
Submitted:
06 March 2024
Posted:
08 March 2024
You are already at the latest version
Abstract
Newcastle disease (ND) is a viral infection that affects domestic and wild type birds especially poultry and establishing serious economic costs for poultry industry. Newcastle disease virus’ (NDV) HN membrane receptor is attractive therapeutic candidate, contributes to pathogenicity with various functions such as fusion and prevent viral self-agglutination to permit viral spread. No validated HN inhibitor has been reported yet. However, the purpose of current study was to determine potential compounds via pharmacophore-based screening of natural molecules to inhibit HN receptor of NDV. Physicochemical characteristics and phylogenetic analysis were determined to elucidate structural information and phylogeny of target protein across different species as well as members of gene family. Fill missing residues of HN target protein and evaluated via PROCHECK and VERIFY 3D. We employed shape and feature-based pharmacophore model and screen natural compound’s library through numerous scoring schemes. Top 48 hits with 0.8860 pharmacophore fit score were subjected towards structure-based molecular docking. Top 9 compounds was observed witihin the range of -8.9 to -7.5 kcal/mol binding score. Five best-fitting compounds in complex with HN receptor were subjected to predict biological activity and ADMET analysis. Top two hits were selected for MD simulations to validate binding modes and structural stability. Upon scrutinization, A1 (ZINC05223166) emerges as potential HN inhibitor to treat ND, necessitating further validation via clinical trials.
Keywords:
Newcastle disease virus
; natural compounds
; antiviral drugs
; NDV
; MD simulation
; Hemagglutinin Neuraminidase
; biological activity
; ADMET
; pharmacophore
; screening
Introduction
Newcastle disease virus (NDV) is an enveloped, non-segmented, negative sense, single stranded RNA virus, belonging to Avulavirus genus of Paramyxoviridae family with ~15 kb genome size. It represents huge crisis on the world’s poultry industry and food safety than other animal viruses especially in developed countries [1], [2]. The poultry industry supplies various products consumed as human food and fulfill ~30% protein requirements. Newcastle disease (ND) is primarily caused by the virulent strains of avian paramyxovirus serotype-1 (termed as avian orthoavulavirus-1), linked to respiratory illnesses and can infect birds and specifically poultry [3]. NDV spreads by direct contact with sick birds and via fomite transmission. The severity of clinical signs ranges from 7 to 30 days, depending upon host's immunity, environmental circumstances, and NDV strain. The 100 nm wide and mostly round NDV’s genome consists upon six viral structural proteins named nucleoprotein (NP), phosphoprotein (P), fusion protein (F), matrix protein (M), haemagglutinin-neuraminidase (HN), and large protein (L) and two nonstructural proteins [4] named V and W. However, surface glycoprotein HN is essential receptor as key virulent determinants, responsible for identification, cell attachment (binds virus to sialic acid receptor) and release [5], [6]. Therefore, HN considered an attractive target for anti-NDV drugs.
HN receptor of NDV is an essential membrane protein with the cytoplasmic domain at the N-terminus, a stalk trans-membrane domain, and a globular non-cytoplasmic domain at the C-terminus. The receptor binding and enzymatic neuraminidase activity occurs in globular head domain at the C-terminal [7], [8]. HN receptor initially acknowledges sialic acid receptors on cell surfaces and facilitates fusion activity by conformational change in the F protein permitting the virus to penetrate the cell surface. Ultimately, it serves as a neuraminidase, removing sialic acid receptors from progeny virus particles to prevent viral self-agglutination thus permitting viral replication and spread [9]. The HN’s sialic acid recognition site suggests it as a promising target for the elucidation of novel ND inhibitors [10].
Early diagnosis, as well as live attenuated and inactivated viral vaccinations, are typically used to prevent Newcastle disease. Poultry and other avian species inoculated with these vaccines cannot be immediately processed for consumption after injection [11] as well cannot feasibly vaccinate wild avian species which indicate that still there is need to provide effective therapeutic requirements for infected birds or chickens. Due to its severe morbidity and mortality rates as well as economic burden, there is need to find potential inhibitors of targeted haemagglutinin-neuraminidase receptor to prevent the ND virus from attaching and multiplying in the host cells.
Vaccines are frequently administered to protect avian species from ND. Live attenuated vaccines i.e., B1, LaSota, and VG/GA, are not practical in some underdeveloped territories due to their expensive prices, inadequate cold chain transportation, inaccessible facilities, and lack of safety measures [12]. On the other hand, inactivated vaccines are safe but time consuming, expensive and can’t prompt long-term immune response while need booster shorts to extend immunity which is essential for laying hens and their offsprings [11], [13]. Recombinant and vector vaccines cost higher production charges with low immunity [14]. Additionally, there is no FDA approved drug to treat Newcastle disease in avian species. Therefore, design in silico study to identify plausible natural compounds as HN inhibitors using structure-based immunoinformatic approaches. These natural HN inhibitors help to inhibit virus's ability to attach to and spread within host cells, potentially reducing the severity of infection.
Material Methods
Phylogenetic Analysis and Physicochemical Properties
The residual sequence of HN receptor in FASTA format was obtained from NCBI (ID: AAG30929.1) and UniProt (ID: I7EFR1) database in order to conduct sequence alignment which assist to elucidate structural information and phylogeny of target protein. For this, perform sequence alignment via ClustalW and construct neighbor-joining (NJ) phylogenetic tree with 1000 bootstrap replications and average sequence difference of 0.85. Expasy ProtParam (https://web.expasy.org/protparam/) tool was utilized to analyze target protein’s (HN) physiochemical characteristics i.e., molecular weight (233.93 kDa), theoretical pI of 7.56, atomic (8767) and varying amino acid composition, -0.157 GRAVY and 34.64 instability index indicating stable HN receptor [15].
Protein Structure Refinement and Assessment
X-ray crystal structure of HN target protein (PDB ID: 7BWU) was retrieved from protein data bank (PDB) with a resolution of 1.87 Å and 0.195 R-value free. Some residues at the N and C terminal regions were found to be missing in the 3-dimensional structure of HN receptor. Subsequently, an attempt was then made to fill in these gaps by employing MODELLER's 'Filling In' module, using methods such as ab-initio loop modeling, fragment assembly, or knowledge-based approaches. Unfortunately, the findings from this comparative modeling approach were not deemed sufficient. Alternatively, ITASSER webserver was employed, yielding five suitable 3D models. The optimized and refined 3D structure retrieved through ITASSER webserver was employed in subsequent Computer-Aided Drug Design pathway analyses [16].
Protein energy minimization, a significant computational practice assists in refinement and optimization of protein structures, allowing for more precise representations of their native state conformations succeeding molecular modeling and simulations. This crucial step optimizes 3-dimensional structure of target protein, HN, by altering its atomic coordinates to attain a state of low potential energy. YASARA energy minimization webserver was utilized for energy minimization of HN receptor [17].
PROCHECK, Errat and Verify3D were employed to predict accuracy of protein 3D model. ERRAT webserver is intended to discriminate between correctly and incorrectly identified regions of protein structures by providing quality score [18]. ERRAT recognizes inaccurate regions which subsequently undergo the refinement process. VERIFY 3D distinguishes between a mistraced or improperly folded protein model [19]. Higher scores denote an improved correlation with experimental data. PROCHECK conduct comprehensive scrutiny of the stereochemistry of a protein 3d structure, highlight regions with potential errors or irregularities and require further inspection [20].
Structure-based Pharmacophore Modelling
To build the pharmacophore model, a structure-based pharmacophore modelling approach was employed. For this, 212 active compounds were retrieved from ChEBI, PubChem and ChEMBL database in .sdf file format and then processed to .pdb file format via BIOVIA Discovery Studio Visualizer. Furthermore, AutoDock Tools were utilized to transform .pdb files in to .pdbqt file formats to conduct further analysis. The design of the pharmacophoric model was based upon the knowledge gained through ligand binding to target protein and interacting atoms that seems crucial for biological activity of compound along common features in all active compounds. Thus, dock active ligands with HN receptor. Molecular docking enables the prediction of reliable binders based on the scoring system including bond length and angle. The chemicals having highest binding affinity for targeted receptor, bond length ≤ 3 and ≤ 0.7 RMSD values, were elected to generate pharmacophore query. Furthermore, the most promising compounds were flexibly aligned to get common features. Pharmacophore fit and atom overlap scoring functions were employed. Ten percent of merged type pharmacophore’s partially mating features were applied. Ten pharmacophore queries were generated based on docking information and aligned attributes of the chosen compounds with 1.0 feature tolerance scale factor and best model was selected based on model scoring scheme.
Library Preparation and Virtual Screening
A vast library of 33372 natural compounds was prepared for virtual screening. The natural compounds extracted from ZINC database. 200 conformers were generated against one small molecule. The purpose of conformers was to enhance chemical search space and this conformational space aids in the identification of potential binding modes that a rigid structure might miss. Pharmacophore based virtual screening was carried out to identify chemical compounds that could inhibit the activity of targeted receptor (HN). Exhaustive screening of library of natural compounds was conducted via Ligand Scout utilizing pharmacophore model to identify similar therapeutic candidates and priority was given to those exhibiting highest suitability with pharmacophoric features [21].
Docking-based Screening of Hits
Following the pharmacophore-based virtual screening, a subsequent structure-based screening of hit compounds were conducted via AutoDock Vina to evaluate protein-ligand interactions. Screened hits were collected in mol2 file format then subsequently converted into pdb and pdbqt file format via AutoDock Tools. Remove water and other nonessential molecules and assign charges to both ligand and receptor atoms. Set up 3D grid box to specify the search space for ligands and adjust parameters i.e., exhaustiveness. Docking was carried out and 10 poses were obtained for each hit in contact with viral protein to evaluate high affinity and specificity along inhibitory actions. The 22 hits were undertook for structure-based molecular docking, determine binding sites of each hit compound against target protein [22]. In structure-based molecular docking, dock best hits using empirical and iterative scoring functions. Compounds demonstrate low energy against the viral receptor HN were recognized for further investigation. The docked complexes with low binding energy values were visualized (2D and 3D) and refined potential drug candidates via BOVIA Discovery Studio.
ADME and Toxicity Profile Analysis
For ADMET analysis, compounds ranked based on their binding poses, docking and RMSD scores. Pharmacokinetic properties help to evaluate drug's actions, i.e., how the drug molecule enters, moves through, metabolized, and eliminated from human body along any possible hazardous consequences. SwissADME (http://www.swissadme.ch/), ProTox-II (https://tox-new.charite.de/protox_II/), ADMETlab 2.0 (https://admetmesh.scbdd.com/) and AdmetSAR (http://lmmd.ecust.edu.cn/admetsar2) webservers were employed to evaluate ADME and toxicity parameters necessary to screen the drug-likeliness of selected hit compounds and then subjected towards focused experimental follow-up studies. Lipophilicity influences the absorption and distribution of a drug in the body. Drug likeness predictions were based on Lipinski, Veber, Ghose, Egan, Muegge rules. Bioavailability and permeability are considered as valuable aspects for oral absorption. Additionally, the compounds were evaluated for their synthetic accessibility, with scores ranging from 1 to 10, where ‘1’ denotes easy to synthesize and ‘10’ denotes difficult to synthesize.
Drug-likeness and Biological Activity Analysis
Biological activity of druglike compounds were predicted to access the possibility of biological effects based on their chemical structure and formula using multilevel neighbor atom (MNA) descriptors. Expected pharmacological effects, mode of action and biological activities of hits were predicted by employing freely accessible PASS (http://www.pharmaexpert.ru/passonline/) webserver which provide probability score (active or inactive) with 95% accuracy, indicating the likelihood of the compound exhibiting that particular biological effect. These probability scores are determined by statistical analysis of chemical structure-activity relationships. In that manner, it prioritizes compounds with potential pharmacological activities for further experimental testing and eliminate false positives and false negatives. The activities of compounds with following effects were preferred: antiviral, antibacterial, antifungal, and antitoxic.
MD Simulations
Two potential docked complexes (HN-ZINC05223166, HN-ZINC02596997) with highest binding affinity, excellent pharmacokinetic properties and competent biological activities were selected for 1-100 ns MD simulations using Desmond [23]. To understand critical physiochemical processes of protein-ligand complexes, it’s necessary to investigate their mobility and stability [24]. Protein Preparation Wizard module was employed to pre-process both systems with default settings while Maestro’s System Builder tool was utilized to configure whole system prior to conducting MD simulations [25]. TIP3P solvent model and 10Å orthorhombic box was determined. Solution was neutralized by adding appropriate amount of Na and Cl ions. The OPLS 2005 force field were used to run protein-ligand simulations [26]. The system was relaxed before the simulation began. NPT ensemble of 300K temperature and 1 atm pressure was utilized for 100ns MD simulations. For coulombic interactions, a threshold radius of 9 was employed and nonbonded forces were ascertained utilizing RESPA integrator. Temperature and pressure were controlled using Nos e-Hoover chain thermostat and Martyna Tobias Klein chain barostat [27] were utilized with relaxation periods of one and two ps respectively. The trajectories were saved at intervals of 50 ps with 1.2 kcal/mol efficiency for post MD analysis. The reliability, stability, and flexibility of both systems were evaluated by examining the evolution of protein-ligand RMSD (root mean square deviation) and RMSF (root mean square fluctuation) graphs. Simulation studies were accomplished on Dell Precision T5810 Workstation featured with Nvidia GeForce GTX 1070 8GB graphics processor.
Results and Discussion
Phylogenetic Analysis of Hemagglutinin Neuraminidase
To investigate the evolutionary relationship and diversity of HN receptor across species, phylogenetic analysis was performed which helps to find out evolutionary relationships across distinct species and members of the gene family. Phylogenetic tree between several species and different NDV strains depicted in Figure 1. HN receptor is the one that is highlighted and is located near distinct Newcastle disease virus strains as well as other relevant species. Notably, target protein demonstrates conservation across several NDV strains. As its conserved nature across several ND strains, its potential usage as a potential therapeutic target is verified and it may be possible to apply this prospective HN inhibitor for other ND strains.
Assessment of Refined HN Receptor
The tremendous ITASSER model of HN receptor was picked up based on lower RMSD values and elevated C-score. The refined 3D models were evaluated based on higher C-score value (suggests more confident model) ranges from -5 to 2. Better quality model was picked up with -1.26 C-score, estimated TM-score of 0.55±0.10, and 10.9±4.5Å RMSD (Figure 2A). Cyclic - C2 is global symmetry while Homo 4-mer - A4 is global stoichiometry of target protein Hemagglutinin Neuraminidase. PROCHECK program systematically evaluates stereochemistry of protein structure, pointing out regions that could require more investigation. It creates a Ramachandran plot of the protein model and displays amino acid residues situated in defined sections as displayed in Figure 2B.
The ERRAT evaluation offers an overall quality factor of 93.0748 for the 3d model of target protein that indicates how accurately the predicted protein structure is folded. The elevated overall quality factor suggests higher accuracy of folded protein regions (Figure 3A). Verify 3D program uncovers correctly and poorly folded regions of target protein. The score lies between -1 to +1 denoted positive and negative outcomes. The value of -1 indicates poor results while 1 denoted good result. Target protein model possess 79.93% amino acids with an average score ≥ 0.1 as depicted in Figure 3B.
Pharmacophore-based Virtual Screening
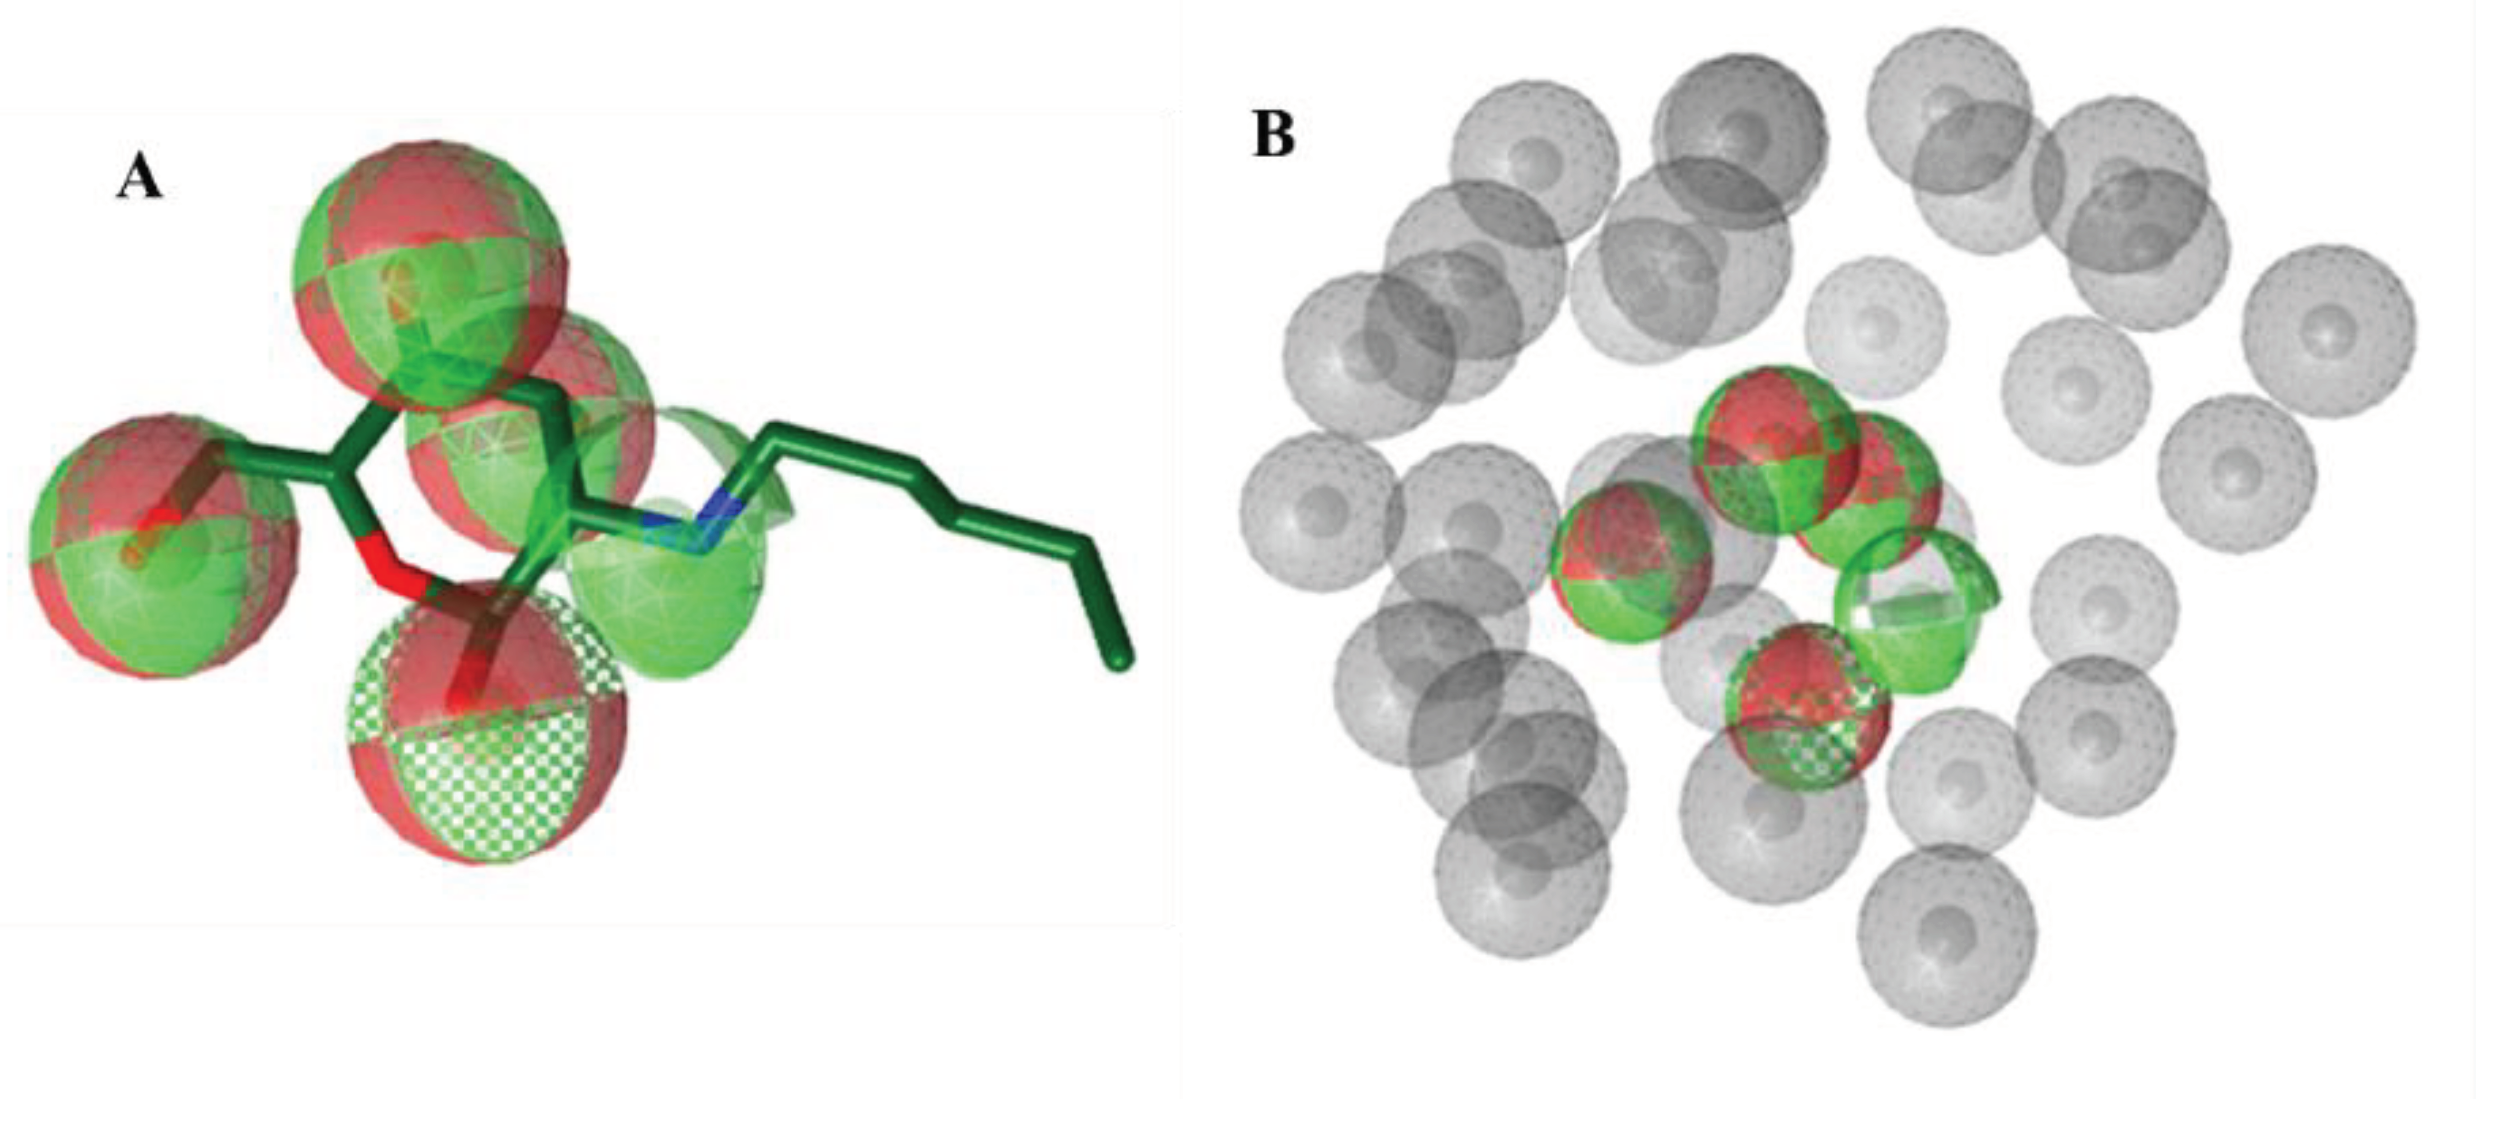
Two hundred and twelve inhibitors were retrieved against HN receptor and 2-acetamido-2-deoxy-beta-D-glucopyranose compound based on their inhibitory effects. Out of the 212 compounds, 165 failed Lipinski and Veber screening criterion, surrounding parameters such as molecular weight (MW) 200-400 g/mol, H-bond donors (2-5), logP (-0.5 to 1), H-bond acceptors (5-9), polar surface area (70-140 Ų), rotatable bonds (2-10) and heavy atom count (13-20). Employing these criterion, 47 compounds were considered suitable for further study. Table S1 lists the ligand IDs and names, as well as their molecular weights and formulas which underwent molecular docking and top docked compounds along their binding affinities enlisted in Table S2. 10 pharmacophores were generated based on aligned features of top compounds and the best one was selected based on the matching features i.e., hydrogen bond acceptor, hydrogen bond donor, and 0.8860 score (Figure 4). Based on these features, pharmacophore-based virtual screening was conducted to extract molecules having properties similar to pharmacophore model. 48 hits (Hitrate:0.16%) from 33373 chemicals were screened and enlisted in Table S3.
Figure 4.
(A) Protein structure validated via ERRAT tool. The result exhibits overall quality factor of the target protein and the quality factor found to be 64.773 which considered good. (B) Verify 3D program calculates that protein structure contains 58.40% amino acids with an average score ≥ 0.1.
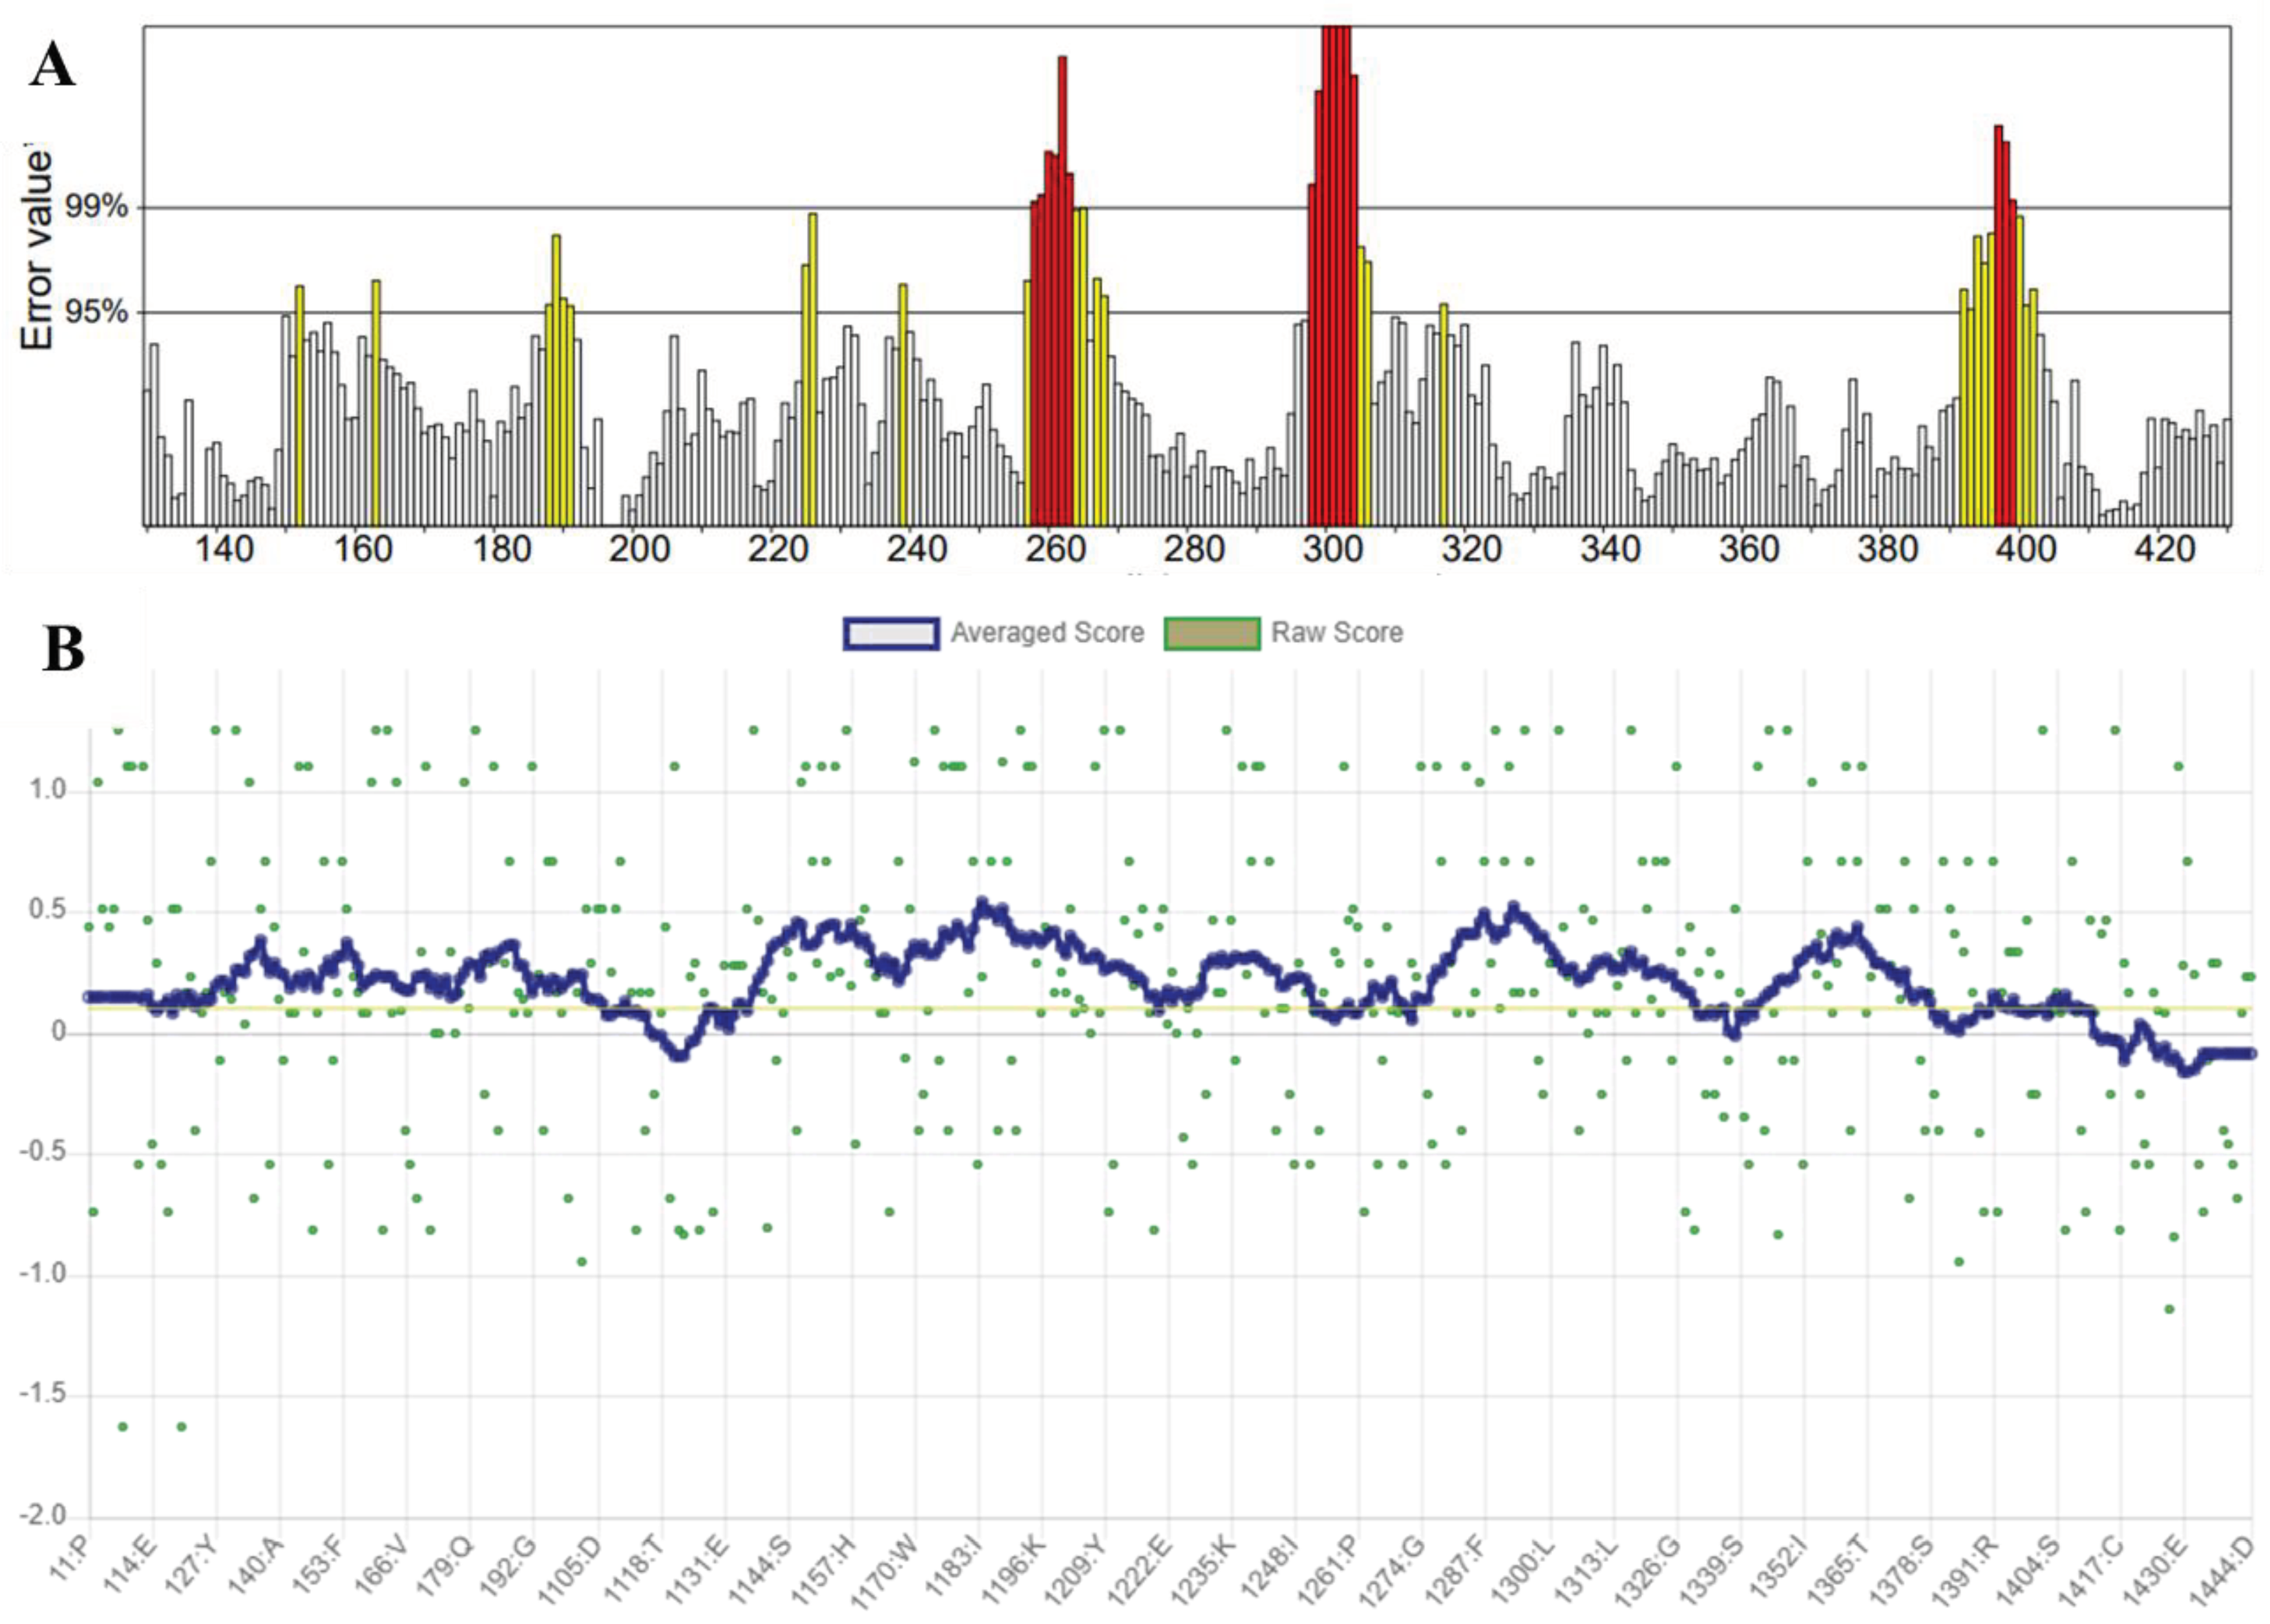
Figure 5.
(A) Pharmacophore query model with selected features. (B) Selected features along exclusion sphere visibility in grey balls.
Figure 5.
(A) Pharmacophore query model with selected features. (B) Selected features along exclusion sphere visibility in grey balls.
Structure-based Molecular Docking of Top Hits
Based on Pharmacophore fit score, lipinski and Veber rule, 22 chemicals were subjected for structure-based molecular docking with HN receptor. This approach helps to narrow down 9 potential hits with desirable characteristics based on binding affinities and RMSD scores. The ligands with higher binding affinities were determined by molecular docking, enlisted in Table 1. The affinity scores of top 9 compounds was observed witihin the range of -8.9 to -7.5 kcal/mol.
Post-Docking Analysis of Potential Hits
Analyze interactions of best docked poses of top 9 hit compounds selected based on their binding affinities and RMSD score (Figure 6).
ZINC05223166 (A1) make conventional H-bonds with polar uncharged Ser372, Ser414, Gln446, Thr421, Thr440, and negatively charged Asp443. Nonpolar aliphatic Val452, Ala454, and negatively charged Glu445 residues make attractive charges along alkyl interactions. Positively charged Arg463, Arg448, Ile416; aromatic Phe456, Phe438; negatively charged Asp444; nonpolar aliphatic Ala447and polar uncharged Thr465 residues represent hydrophobic interactions (Figure 5A). ZINC02596997 (A2) makes conventional hydrogen bond, Pi-anion, and alkyl interactions with Ile416, Thr440, Glu445, Asp443, Thr465 residues while depicts hydrophobic interactions with Phe456, Ala454, Arg448, Ala447, Phe438, Asp444, Asp422, Gly439, Phe371, Thr421 residues (Figure 5B). ZINC01700877 (A3) make 04 conventional H-bonds with Ala447, Asp443, Gln446, Arg448, residues and one alkyl interaction with Ala454 while represents hydrophobic interactions with polar uncharged Thr465, Thr440 nonpolar aliphatic Val467, Leu449, Val452, aromatic Phe456, and negatively charged Glu445 residues (Figure 5C). ZINC04011865 (A4) hit make conventional hydrogen bond, carbon-hydrogen bond, pi-pi stacked, and pi-Alkyl interactions with Ser369, Ala374, Thr421, Pro423, Pro425 Phe438 residues while shows hydrophobic interactions with Gly367, Phe371, Asp422, Ile416, Tyr420, Glu445 residues (Figure 5D). ZINC04011866 (A5) make pi-pi stacked, pi-Alkyl interactions with Ala374, Phe438, Pro423, Pro425, residues while depicting hydrophobic interactions with Ser372, Ile416, Gly367, Ser369, Tyr420, Tyr370, Asp422 residues (Figure 5E). ZINC04348410 (A6) make pi-pi stacked, pi-Alkyl interactions with Phe438, Pro423, Pro425, Ala374 residues while depicting hydrophobic interactions with Glu445, Ser372, Arg463, Pro423, Pro425, Arg366, Gly367, Asp422, Ser368, Tyr370, Phe371 residues (Figure 5F). ZINC04179503 (A7) display 3 conventional H-bonds along one pi-Alkyl interactions with Phe371, Thr440, Gly439, Ile416 residues respectively while depicting hydrophobic interactions with Ser372, Ser368, Ser369, Tyr370, Tyr420, Glu445, Thr421, Phe438, Asp422, Pro423, Pro425 residues (Figure 5G). ZINC03956713 (A8) shows binding energy of -7.5 kcal/mol with two conventional H-bonds (Thr440, Thr421), carbon-hydrogen bond (Ser372, Phe371), and pi-Alkyl interaction with Ile416 residue while depicting hydrophobic type of interactions with Gly367, Ser369, Tyr370, Gly418, Val419, Tyr420, Asp422, Pro423, Phe438, Phe456, Arg463, Ser372 residues (Figure 5H). ZINC04185655 (A9) make conventional hydrogen bond, carbon H-bond, alkyl interactions with aromatic Tyr370, polar uncharged Ser368, Thr440, Thr421 nonpolar aliphatic Pro423 residues while showing hydrophobic interactions with Ser372, Ala374, Gly367, Ser368, Ile416, Tyr420, Asp422, Gly439, Phe438 residues (Figure 5I).2D illustration for top 9 hits displayed in Figure S2.
Analysis of Pharmacokinetic Properties
Based on docked poses and the interaction analysis, 5 best compounds were selected which underwent for ADMET check. Physicochemical characteristics, bioavailability, ADME, and toxicity analysis are crucial in drug design as they influence pharmacokinetic and pharmacodynamic behaviour of potential drug candidates (Table 2). All compounds lie within the optimal criterion in terms of physicochemical properties. Lipophilicity is a complicated criterion that influences numerous aspects of drug's behaviour in biological systems. It influences distribution and bioavailability. Excess lipophilicity can also alter drug's binding affinity to target proteins, resulting in non-specific binding and deposition in tissues, which could lead to toxicity [28]. Therefore, lipophilicity constraints are incorporated into the design and synthesis of novel chemical compounds. All compounds have lipophilicity values less than 5 indicating good oral and intestinal absorption. Water solubility is a significant attribute that affects formulation, pharmacokinetics, and effectiveness of drug candidates. Drugs with optimal water solubility are prone to be consumed through the gastrointestinal tract, resulting in improved systemic availability. Acceptable water solubility can assist to reduce toxicity problems and transform drugs into appropriate dosage forms. All hits belong to soluble classess calculated based on topological and fragmental methods by FILTER-IT program [29]. High gastrointestinal (GI) absorption and adequate human intestinal absorption (HIA) is desirable as it ensures that drug is properly absorbed into the systemic circulation following oral administration. Effective GI absorption enables the consumption of therapeutic doses with fewer amounts of medicine, potentially lowering the risk of adverse effects related to high doses. All compounds depicts high absorption levels after oral administration except A3 (ZINC01700877) compound. Top 3 compounds depicts excellent HIA with 0.1, 0.3, 0.3 values respectively while A4 ans A5 display poor HIA. Drug passes through intestinal cell membranes before reaches the bloodstream in case of oral intake. Caco-2 permiability approach has been frequently utilized to evaluate in vivo drug permeability and considered an imperative indicator for suitable drug candidate. Values greater than 4 depicts easy absorption. A1 and A3 compounds shows excellent absorption than others as they have higher Caco-2 permeability values 18.5693 and 20.6733nm/sec respectively. MDCK, an in vitro model for permeability screening of potential compounds. Values greater than 2.1e-06 shows exceptional MDCK permeability. All compounds presented significant MDCK permeability, BBB refers distribution of compounds in tissues. Output values between 0 to 0.3 cm/s shows excellent probability of being BBB+, 0.3 to 0.7 cm/s as medium and 0.7 to 1.0 cm/s depicts poor BBB+. A1 compound represents exceptional BBB probability with 0.01 cm/s value while A3 depicts medium BBB penetration probability in tissues. Isozymes (CYP1A2, CYP2C19, CYP2C9, CYP2D6, CYP3A4) responsible for phase 1 reactions which indicate process of drug metabolism. Data shows that all compounds work as inhibitors while values of A1 compound enlisted it as an excellent inhibitor. According to data, all compounds present adequate bioavailability scores within the range of 0.4 to 0.6 which help them to reach their target site in sufficient concentrations.
Toxicological Analysis of Top Hit Compounds
Toxicity evaluation is essential for determining possible drug candidate’s efficacy and safety before moving on to subsequent, more expensive phases of development while allocating resources only towards more promising candidates [30]. Improvements in computational models enable for more acurate toxicological evaluations which lessen the need for animal testing. A3 violate all rules i.e., lipinski, ghose, egan, muegge and veber rules while others not break more than one of the defined criterions (Figure 6). Some of the hits shows PAINS and Brenk alerts which highlight molecular attributes that could lead toxicity, interfer in assays, or have other detrimental effects. Compounds with mutagenic, carcinogenic and tumorigenic potential are usually deemed undesirable, as they may have an impact to the commencement or progression of cancer and their development as drugs may be terminated. None of the compounds seems mutagenic and tumorigenic. As well no compounds display irritant effects while A2 depicts reproductive effects.
Biological Activity Prediction
Table 3 demonstrates that compounds with possibility of biological activity are more likely to be active then inactive. Compounds with predicted values Pa > Pi and Pa ˃ 0.4 were only chosen in term of antiviral, antibacterial, antitoxic and antifungal responses as they indicating the relation with reported biological activities. A1 occupy best value for antiviral (Poxvirus) Pa = 0.847 and antiviral (Picornavirus), A2 have good activity value as antifungal (Pa = 0.670), and antiviral (Influenza) Pa = 0.537. A3 acquire Pa = 0.507 for antiviral (Picornavirus), Pa = 0.470 for antiviral (Adenovirus) and Pa = 0.446 for antibacterial activity. A4 depicts antiviral (Picornavirus), antiviral (Hepatitis B), and antibacterial activities with Pa = 0.525, Pa = 0.489, Pa = 0.508 values respectively. A5 possess competent antiviral (Influenza), antibacterial, and antiviral (Picornavirus) activities with Pa = 0.727, Pa =0.569, Pa = 0.525 values. All the proposed compounds have high biological activity scores against various viral, bacterial and fungal diseases, and could serve as potential inhibitors for different targets.
Molecular Dynamic Simulation
To examine stability and structural consistency of both selected systems A1 and A2, molecular dynamic simulation of 100 ns was conducted.
Root Mean Square Deviation (RMSD)
Figure 7 depicts RMSD calculations for both potential complexes. The A1 ligand’s (fit on protein) RMSD (right Y-axis) gain stability at 5ns to 30 ns with 6 Å then reduces and equilibrated at 32 ns within the range of 5 Å and this trend maintains till end of the simulation. P-RMSD (left Y-axis) of A1 system display equilibrium till 50ns followed by slighter upsurge till 100ns simulation time period and lie within the range of 5 ± 0.5 Å (Figure 7). L-RMSD of A2 system gain stability at 40ns till 100 ns with value of 3.2 ± 0.55 Å. On the other hand, P-RMSD of A2 complex gain stability throughout the simulation time with 7.2 Å (Figure 7B). These findings demonstrate that A1 system is more reliable than A2 system and there are no major fluctuations in protein RMSD although slight increase in ligand RMSD in the very start is due to rotatable bonds (9 and 11 RBs for A1 and A2 respectively) while the ligand RMSD values are lower than the protein’s RMSD values.
Root Mean Square Fluctuation (RMSF)
Root mean square fluctuation (RMSF) describes local changes, compactness, and rigidity in both systems at residue level. Figure 8 demonstrates 5 regions (R1-R5) of protein’s structure that change most drastically during simulation. Protein’s N-terminal tail and loop regions frequently depicts fluctuations than other portion of the systems i.e., alpha-helices and beta-strands. Based on the predicted RMSF values, some residues denote slight changes during the simulation, within the range of ∼3 Å indicating that these residues maintained their relative stability, efficacy, and compactness except 5 highlighted regions that goes beyond ∼7 Å and illustrate higher motions. It’s worth noticing that these zones are loop regions of protein’s N and C terminal (Figure 8C). The 3d structure of target protein is of high resolution (1.87 Å) with lower B factor (38.51 Å2), reflecting higher stability and structural rigidity than flexibility. The comparison of RMSF profile and experimental B factor (thermal motion of atoms in the crystallographic structure) values serves as a crucial validation step for assessing the accuracy of the simulated systems. Residues Thr421, Thr440, Gln446 are significant binding residues. In A1 system, these residues lie within acceptable range, depicting reliable A1-HN bond (Figure 8A) while in A2 system they show fluctuations upto 7Å (Figure 8B), suggesting flexibility at the active site.
Secondary Structure Elements (SSE) Analysis
Investigation of secondary structure elements (SSE) provides crucial information about structural characteristics, stability, and reliability of protein-ligand complexes. In Figure 9A, visual inspection of A1’s SSE plot depicts 3.91% helices, 26.22% beta strands and total SSE conformation of 30.13%. In the case of A2’s SSE plot, 2.76% alpha helices, 27.73% beta strands conformation, and a total of 30.49% (Figure 9B). Ligand binding didn’t induce significant conformational effect in target protein which leading to alterations in SSEs. These structural elements establish overall functionality and stability of potential complexes.
Protein-Ligand Interactions
Figure 10 shows summary of protein-ligand interactions (H-bonds, water bridges and hydrophobic interactions) and interaction diagrams over 100 ns simulations. Top potential hit A1’s polar uncharged Arg289, Arg463 (65% of simulation time), negatively charged Glu445, Glu446, polar uncharged Thr440 residues form H-bonds. Arg289, Tyr364, Phe371, Ala374, Phe394, Thr421, and Glu445 depict water bridges while Phe394, Phe348 make hydrophobic interactions for 43% of simulation time. Only one polar uncharged Thr421 displays ionic interaction with HN receptor over 13% of simulation time (Figure 10A). A2 compound shows water bridges and H-bond as major types of interactions. Arg303, Ser307, Tyr309, Gly312, and Leu347 residues represent water bridges and H-bond interactions over ∼40% of simulation time as seen in Figure 10B. Ile64, Arg303, Tyr309, Tyr370, and Phe503 form hydrophobic interactions.
Behavioral Properties of Potential Hit Compounds
Average RMSD of A1 ranged between 0.8 to 1.6 Å while RMSD for A2 compound varied from 0.5 to 1.5 Å. rGyr for A1 ranging from 4.0 to 4.5 Å and for A2 ligand, it lies in between 3.28–3.44 Å. Molecular surface area (MolSA) of A1 fluctuates between 370–390 Å2 while for A2 it varies from 288–295 Å2. Ligand A1 and A2 illustrate 3 and 4 intramolecular H-bonds respectively. Solvent accessible surface area for A1 and A2 stabilizes between 200–300Å2 and 150–450Å2, respectively. The polar surface area (PSA) for both ligands lies within 320–360Å2 and 180–208 Å2 ranges [31] (Figure 11).
Conclusion
Computational and medicinal chemistry approaches such as shape and feature based screening predict potential HN inhibitors. Structure-based molecular docking revealed well docked compounds in the active site of target protein with plausible binding poses. Furthermore, the compounds depict better ADME and toxicity profile along antiviral, antibacterial, antitoxic and antifungal biological activity with Pa > Pi and Pa ˃ 0.4 parameters. Similarly, MD simulations revealed A1 natural compound as stable and rigid HN inhibitor that can be employed as lead compound after execution of biological assays for further optimization.
Supplementary Materials
The following supporting information can be downloaded at the website of this paper posted on Preprints.org.
Author Contributions
I. A.: Conceptualization, Investigation, Writing-original draft, Review & editing, Methodology, Designed and Conceived the study. I.U.H., R.U.R., N.I., W.B.A.: Investigation, Data analysis, Review & editing. M.N.I.: MD simulation. M.A.R.: Conceptualization and Supervision. All authors have read and agreed to the published version of the manuscript.
Data Availability Statement
Added in Supplementary Material file.
Acknowledgments
Researchers supporting project number (RSP2024R332), King Saud University, Riyadh, Saudi Arabia.
References
- D. R. Kapczynski, C. L. Afonso, and P. J. Miller, Immune responses of poultry to Newcastle disease virus. Dev. Comp. Immunol. 2013, 41(3), 447–453. [CrossRef] [PubMed]
- Z. Duan et al., The nucleolar phosphoprotein B23 targets Newcastle disease virus matrix protein to the nucleoli and facilitates viral replication. Virology 2014, 452, 212–222. [CrossRef]
- C. S. Ross et al., JMM Profile: Avian paramyxovirus type-1 and Newcastle disease: a highly infectious vaccine-preventable viral disease of poultry with low zoonotic potential. J. Med. Microbiol. 2022, 71(8), 1489. [CrossRef]
- L. Li et al., Peste Des Petits Ruminants Virus N Protein Is a Critical Proinflammation Factor That Promotes MyD88 and NLRP3 Complex Assembly. J. Virol. 2022, 96(10), e00309-22. [CrossRef]
- W. Sarwar et al., In Silico Analysis of Plant Flavonoids as Potential Inhibitors of Newcastle Disease Virus V Protein. Processes 2022, 10(5), 935. [CrossRef]
- M. M. Osman et al., In silico design of epitope based peptide vaccine against virulent strains of hn-newcastle disease virus (NDV) in poultry species. IJMCR Int. J. Multidiscip. Curr. Res. 2016, 4.
- V. Mayahi, M. Esmaelizad, and M. R. Ganjalikhany, Development of Avian avulavirus 1 epitope-based vaccine pattern based on epitope prediction and molecular docking analysis: an immunoinformatic approach. Int. J. Pept. Res. Ther. 2020, 26, 1513–1522. [CrossRef]
- M. Shafaati, M. Ghorbani, M. Mahmoodi, M. Ebadi, and R. Jalalirad, Expression and characterization of hemagglutinin–neuraminidase protein from Newcastle disease virus in Bacillus subtilis WB800. J. Genet. Eng. Biotechnol. 2022, 20(1), 77. [CrossRef]
- R. A. Lamb, Paramyxoviridae: the viruses and their replication. Fields Virol. 2001, 1305–1340.
- C. Ryan et al., Structural analysis of a designed inhibitor complexed with the hemagglutinin-neuraminidase of Newcastle disease virus. Glycoconj. J. 2006, 23, 135–141. [CrossRef]
- M. Rahmani, A. Mozafari, M. Jafari, and A. H. Salmanian, The heat-labile enterotoxin B subunit bio-adjuvant linked to Newcastle disease virus recombinant hemagglutinin neuraminidase elicited a humoral immune response in animal model. Cell. Mol. Biol. 2023, 69(10), 94–99. [CrossRef] [PubMed]
- M. M. Badawi et al., Immunoinformatics predication and in silico modeling of epitope-based peptide vaccine against virulent Newcastle disease viruses. Am J Infect Dis Microbiol 2016, 4(3), 61–71. [CrossRef]
- Raza, M. A. Rasheed, S. Raza, M. T. Navid, A. Afzal, and F. Jamil, Prediction and analysis of multi epitope based vaccine against Newcastle disease virus based on haemagglutinin neuraminidase protein. Saudi J. Biol. Sci. 2022, 29(4), 3006–3014. [CrossRef] [PubMed]
- K. M. Dimitrov, C. L. Afonso, Q. Yu, and P. J. Miller, Newcastle disease vaccines—A solved problem or a continuous challenge? Vet. Microbiol. 2017, 206, 126–136. [CrossRef]
- E. Gasteiger, C. Hoogland, A. Gattiker, M. R. Wilkins, R. D. Appel, and A. Bairoch, Protein identification and analysis tools on the ExPASy server proteomics. Protoc. Handb. 2005, 571–607. [CrossRef]
- Y. Zhang, I-TASSER server for protein 3D structure prediction. BMC Bioinformatics 2008, 9, 1–8. [CrossRef]
- P. K. Jayaswal, G. C. Sahoo, and P. Das, Rational Drug Designing Strategies and Inhibitor Optimization: Anthrax Lethal Toxin Factor. Int. J. Bioautomation 2012, 16(4), 239.
- C. Colovos and T. O. Yeates, Verification of protein structures: patterns of nonbonded atomic interactions. Protein Sci. 1993, 2(9), 1511–1519. [CrossRef]
- D. Eisenberg, R. Lüthy, and J. U. Bowie, VERIFY3D: assessment of protein models with three-dimensional profiles. InMethods in enzymology 1997 Jan 1 (Vol. 277, pp. 396-404). Acad. Press. 10, s0076-6879. [CrossRef]
- R. A. Laskowski, M. W. MacArthur, D. S. Moss, and J. M. Thornton, PROCHECK: a program to check the stereochemical quality of protein structures. J. Appl. Crystallogr. 1993, 26(2), 283–291. [CrossRef]
- M. A. Rasheed et al., Identification of lead compounds against scm (Fms10) in enterococcus faecium using computer aided drug designing. Life 2021, 11(2). [CrossRef] [PubMed]
- Ali et al., Identification of Natural Lead Compounds against Hemagglutinin-Esterase Surface Glycoprotein in Human Coronaviruses Investigated via MD Simulation, Principal Component Analysis, Cross-Correlation, H-Bond Plot and MMGBSA. Biomedicines 2023, 11(3), 793. [CrossRef]
- J. Bowers et al., Scalable algorithms for molecular dynamics simulations on commodity clusters. Proc. 2006 ACM/IEEE Conf. Supercomput. SC'06 2006. [CrossRef]
- M. Martínez-Archundia, T. G. Hernández Mojica, J. Correa-Basurto, S. Montaño, and A. Camacho-Molina, Molecular dynamics simulations reveal structural differences among wild-type NPC1 protein and its mutant forms. J. Biomol. Struct. Dyn. 2020, 38(12), 3527–3532. [CrossRef]
- G. Madhavi Sastry, M. Adzhigirey, T. Day, R. Annabhimoju, and W. Sherman, Protein and ligand preparation: Parameters, protocols, and influence on virtual screening enrichments. J. Comput. Aided. Mol. Des. 2013, 27(3), 221–234. [CrossRef]
- D. Shivakumar, J. Williams, Y. Wu, W. Damm, J. Shelley, and W. Sherman, Prediction of absolute solvation free energies using molecular dynamics free energy perturbation and the opls force field. J. Chem. Theory Comput. 2010, 6(5), 1509–1519. [CrossRef]
- D. Jayabal, S. Jayanthi, R. Thirumalaisamy, R. Karthika, and M. N. Iqbal, Comparative anti-Diabetic potential of phytocompounds from Dr. Duke’s phytochemical and ethnobotanical database and standard antidiabetic drugs against diabetes hyperglycemic target proteins: an in silico validation. J. Biomol. Struct. Dyn. 2023, 1–13. [CrossRef]
- Daina, O. Michielin, and V. Zoete, iLOGP: a simple, robust, and efficient description of n-octanol/water partition coefficient for drug design using the GB/SA approach. J. Chem. Inf. Model. 2014, 54(12), 3284–3301. [CrossRef]
- Daina, O. Michielin, and V. Zoete, SwissADME: a free web tool to evaluate pharmacokinetics, drug-likeness and medicinal chemistry friendliness of small molecules. Sci. Reports 2017, 7(1), 1–13. [CrossRef]
- Ali, M. N. Iqbal, M. Ibrahim, I. U. Haq, W. B. Alonazi, and A. R. Siddiqi, Computational exploration of novel ROCK2 inhibitors for cardiovascular disease management; insights from high-throughput virtual screening, molecular docking, DFT and MD simulation. PLoS One 2023, 18(11), e0294511. [CrossRef]
- M. G. and D. K. Sunil Kumara, Iqra Alib, Faheem Abbasc, Anurag Ranad, Sadanand Pandeye, In-silico design, pharmacophore-based screening, and molecular docking studies reveal that benzimidazole-1,2,3-triazole hybrids as novel EGFR inhibitors targeting lung cancer. J. Biomol. Struct. Dyn. 2023. [CrossRef]
Figure 1.
Phylogenetic tree (fast minimum evolution method) to explore evolutionary relationships among ND strains and other relevant species.
Figure 1.
Phylogenetic tree (fast minimum evolution method) to explore evolutionary relationships among ND strains and other relevant species.
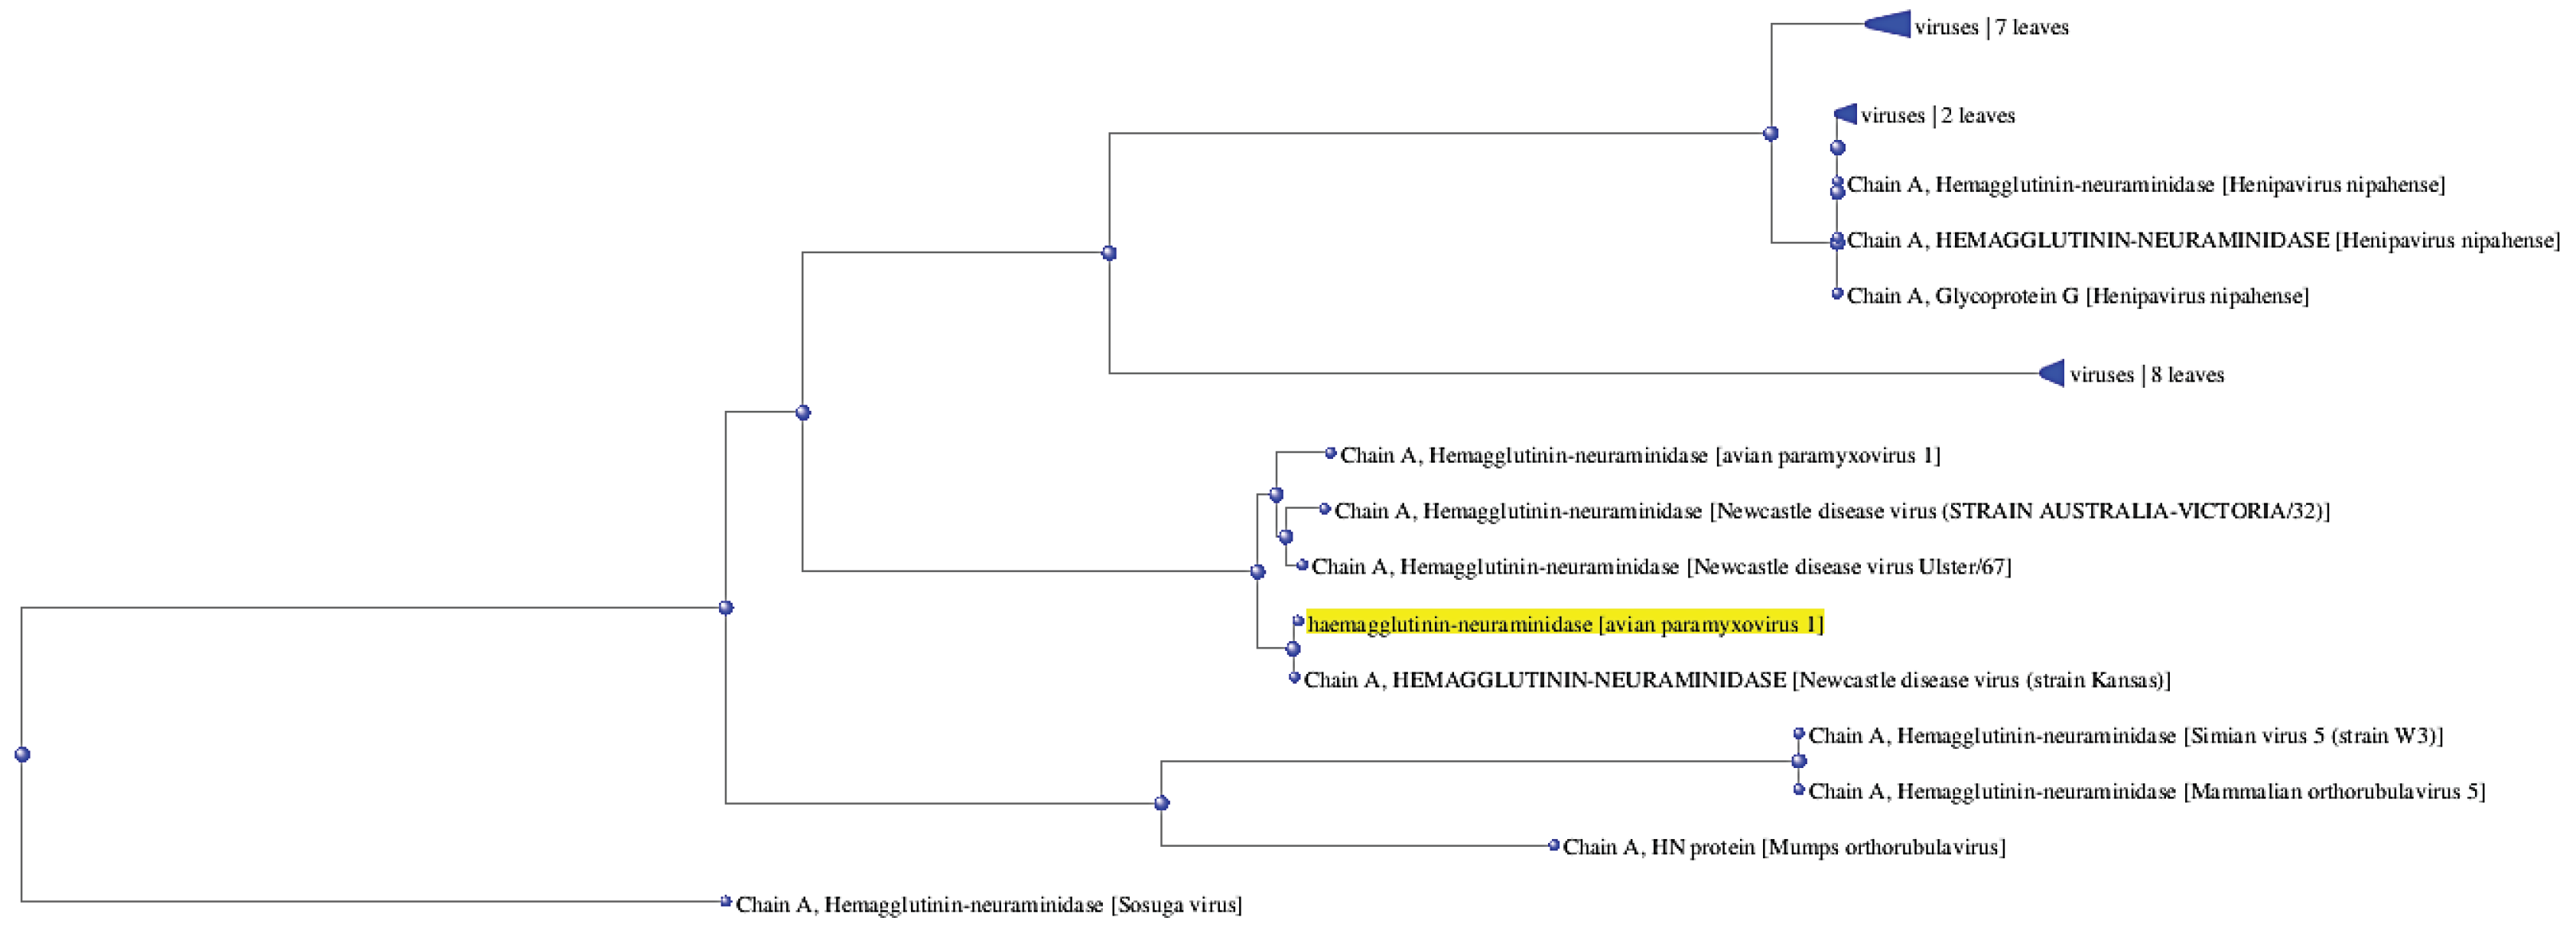
Figure 3.
(A) 3-dimensional structure of targeted receptor Hemagglutinin Neuraminidase (HN). Red is used to represent helices, cyan for beta sheets, grey for loops, and green for turns. (B) Ramachandran plot depicts the most favored region with 86.2% of residues, additional allowed region with 12.8% of residues, 0.5% in generously allowed region and 0.5% residues act as outlier and lie in disallowed regions.
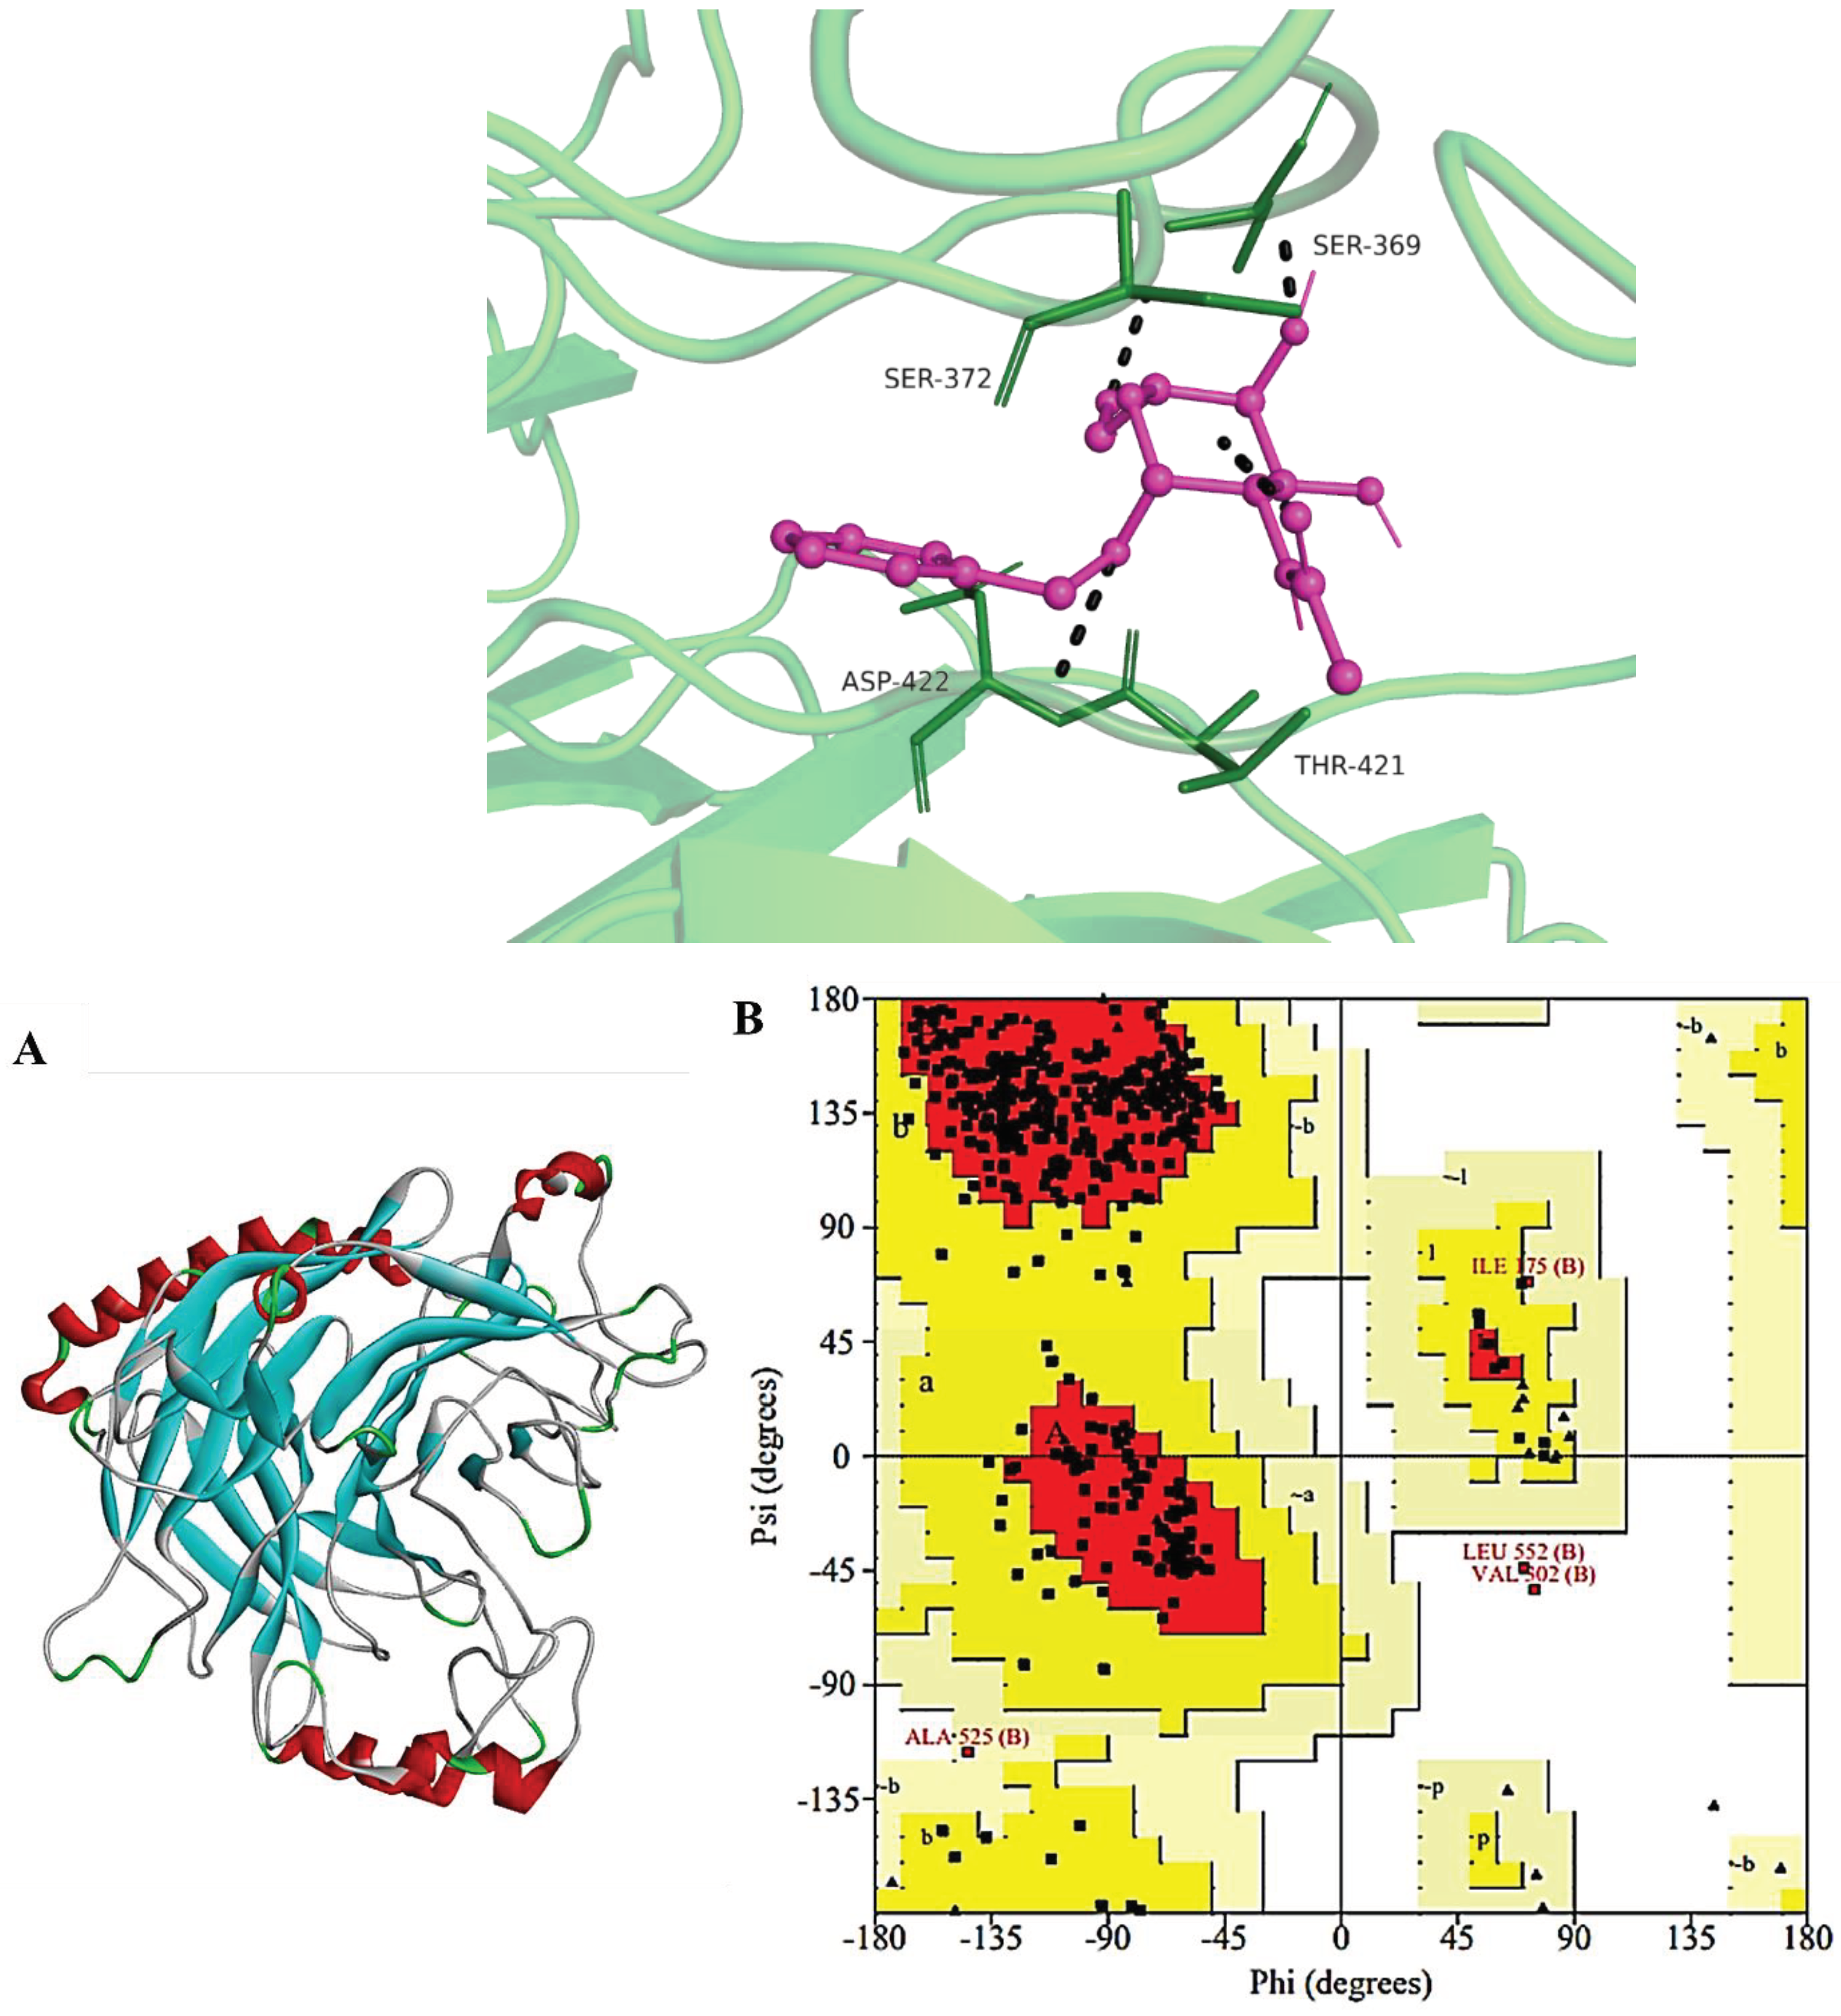
Figure 6.
Best docked poses of top 9 hits with HN’s binding site residues engaged in interaction. (A) ZINC05223166 (B) ZINC02596997 (C) ZINC01700877 (D) ZINC04011865 (E) ZINC04011866 (F) ZINC04348410 (G) ZINC04179503 (H) ZINC03956713 (I) ZINC04185655 involved in the interaction with the receptor.
Figure 6.
Best docked poses of top 9 hits with HN’s binding site residues engaged in interaction. (A) ZINC05223166 (B) ZINC02596997 (C) ZINC01700877 (D) ZINC04011865 (E) ZINC04011866 (F) ZINC04348410 (G) ZINC04179503 (H) ZINC03956713 (I) ZINC04185655 involved in the interaction with the receptor.
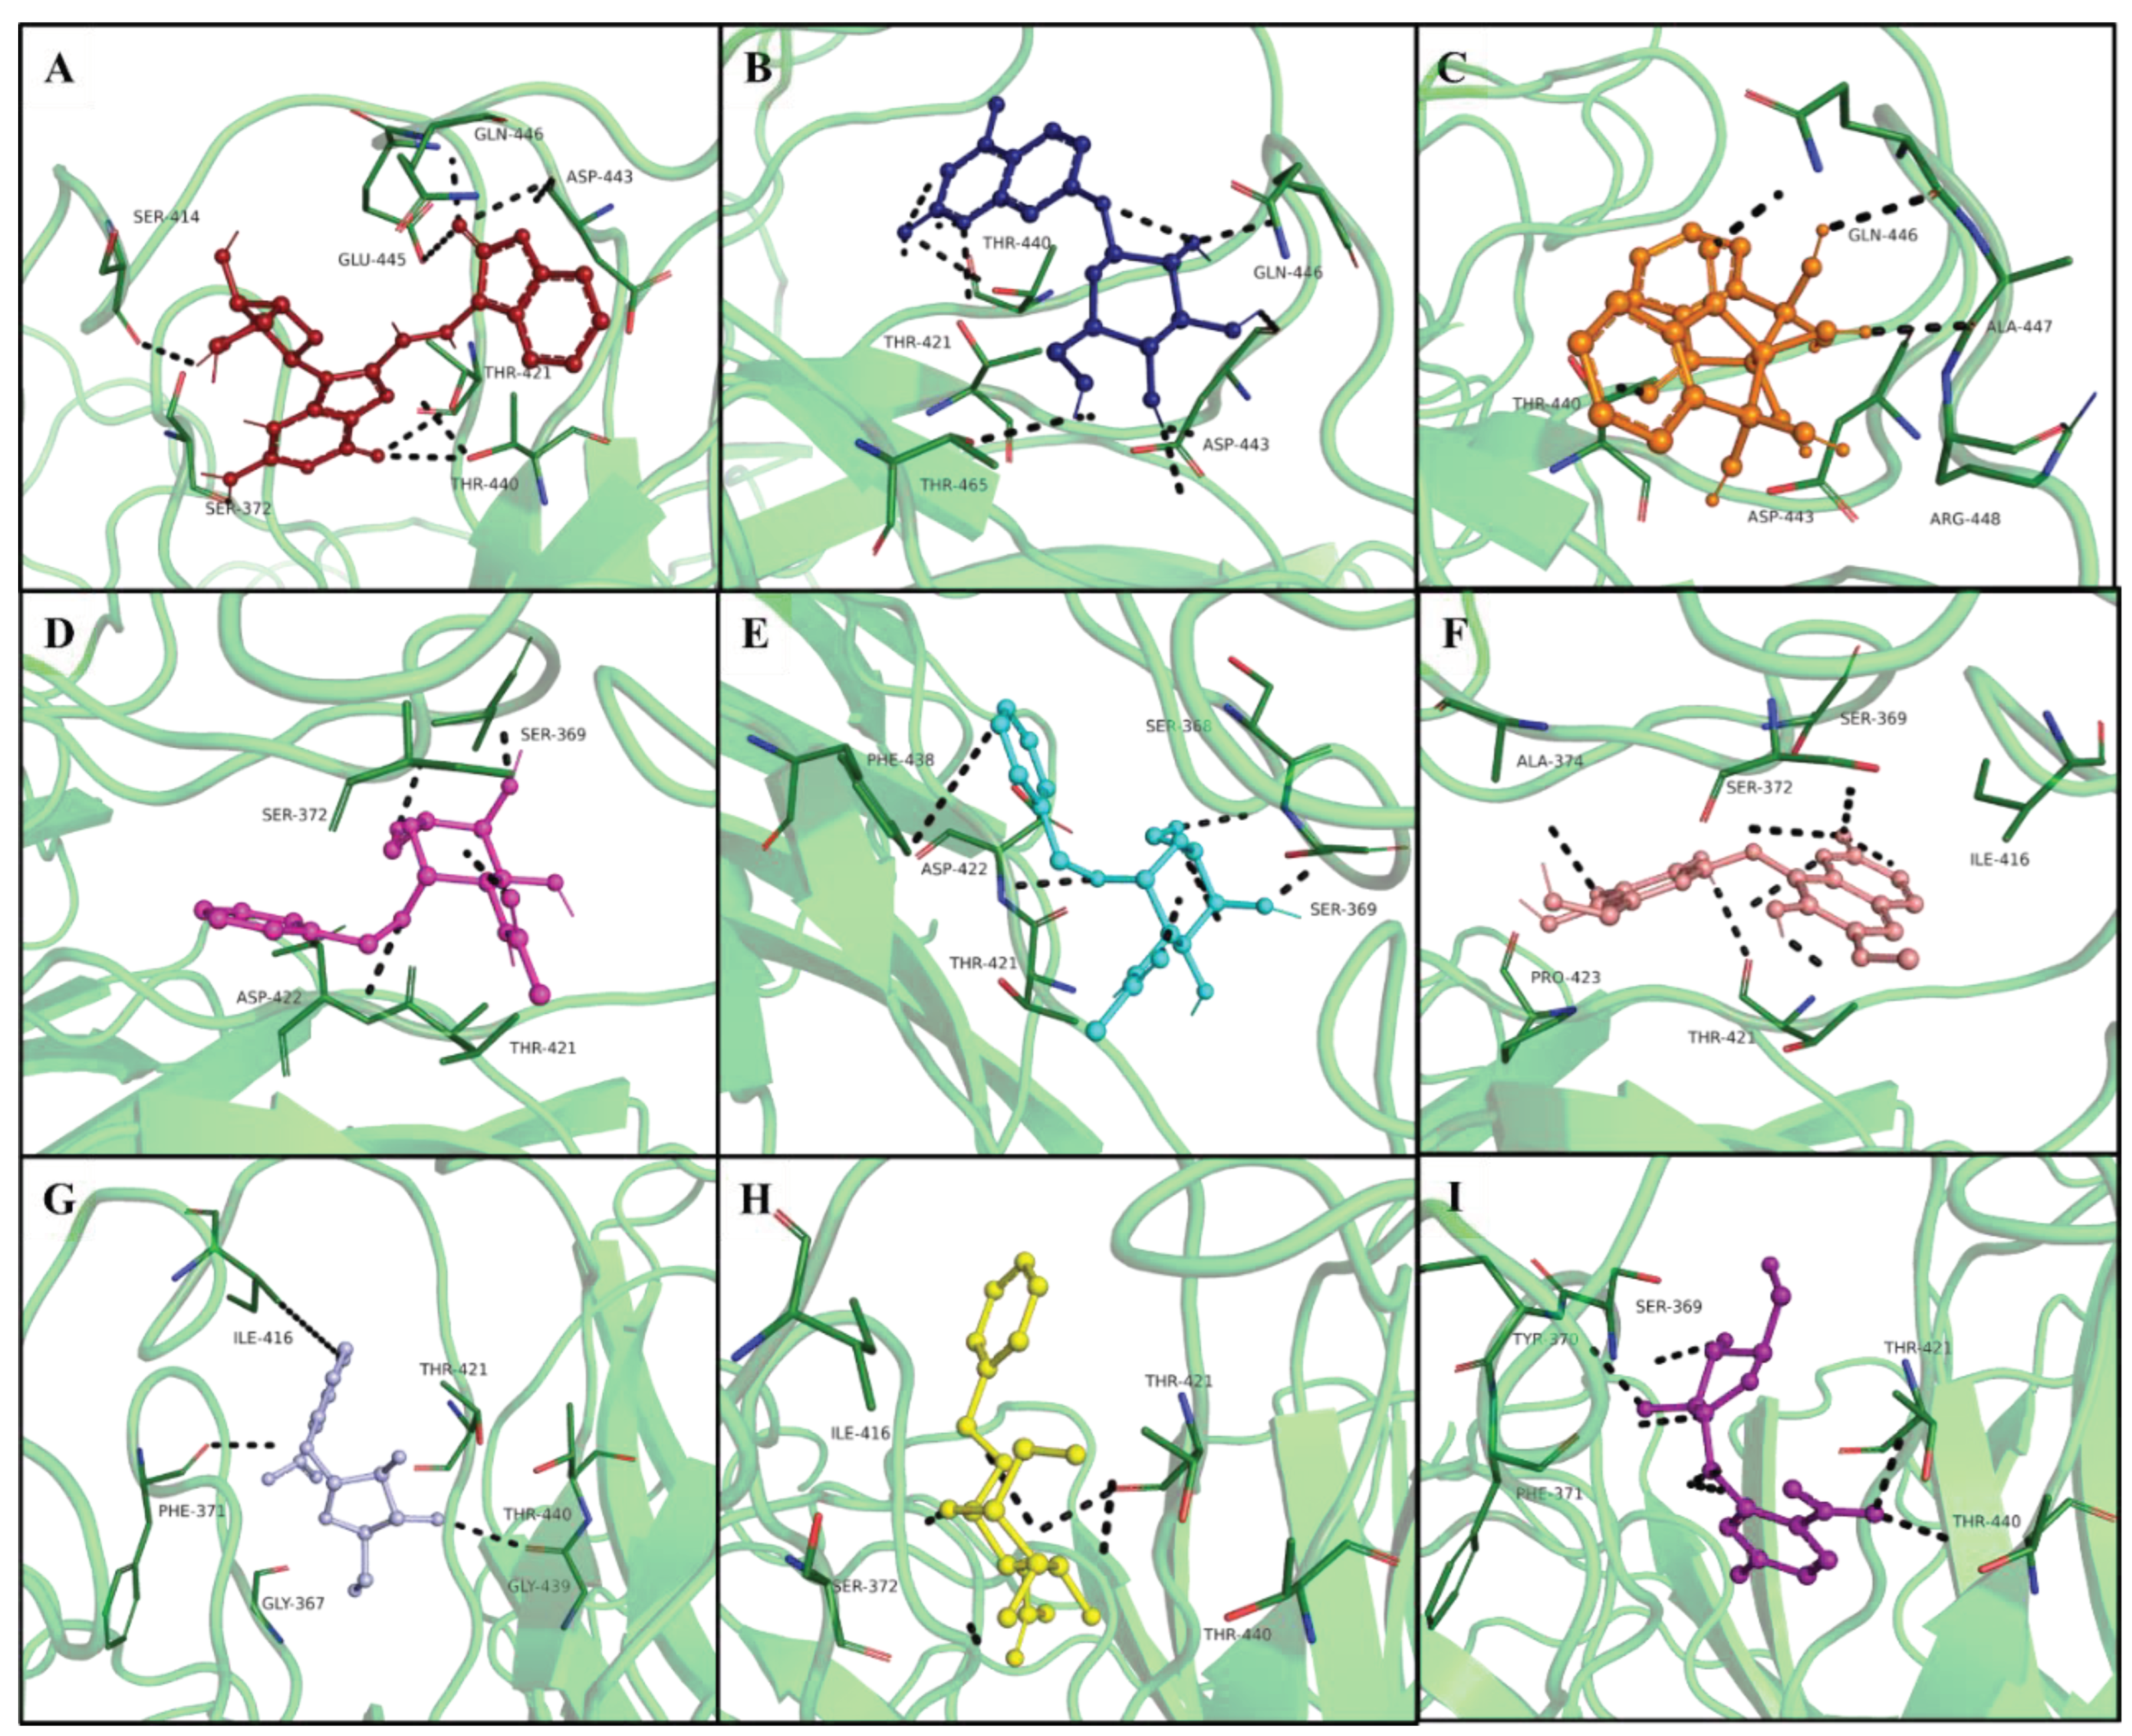
Figure 7.
Toxicity profile analysis of top five hit compounds along KDE plot which depicts joint distribution of binding affinity and drug score.
Figure 7.
Toxicity profile analysis of top five hit compounds along KDE plot which depicts joint distribution of binding affinity and drug score.
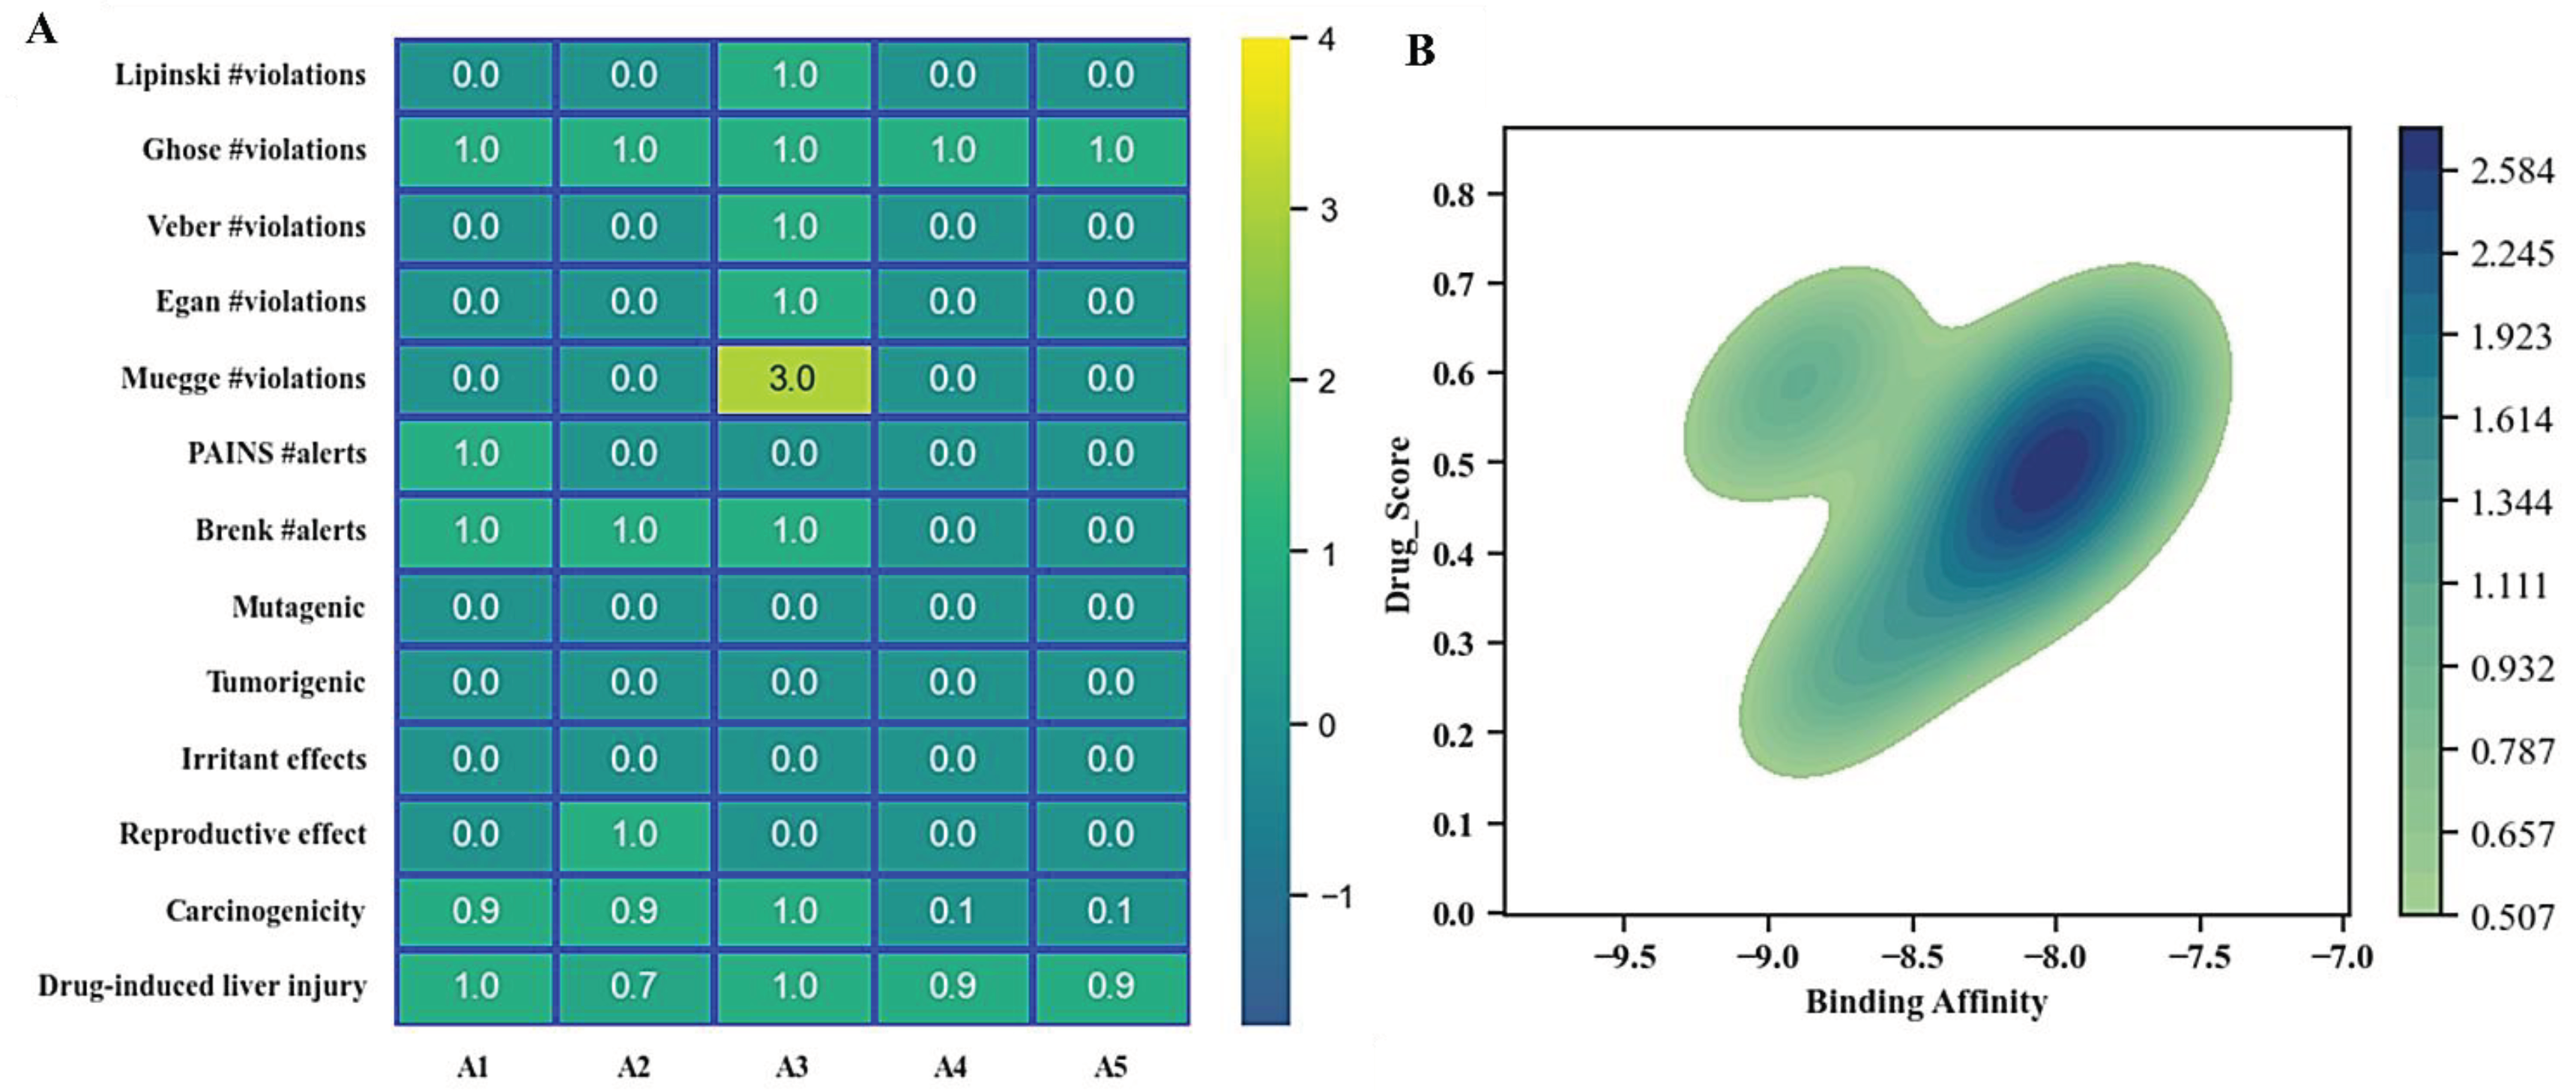
Figure 8.
RMSD of the Cα-atoms of HN and the best selected hit A1 (A) and A2 (B) over 100ns. The left Y-axis indicates variation of protein RMSD (blue line represent results) while right Y-axis show ligand variation (red lines) throughout the simulation time.
Figure 8.
RMSD of the Cα-atoms of HN and the best selected hit A1 (A) and A2 (B) over 100ns. The left Y-axis indicates variation of protein RMSD (blue line represent results) while right Y-axis show ligand variation (red lines) throughout the simulation time.
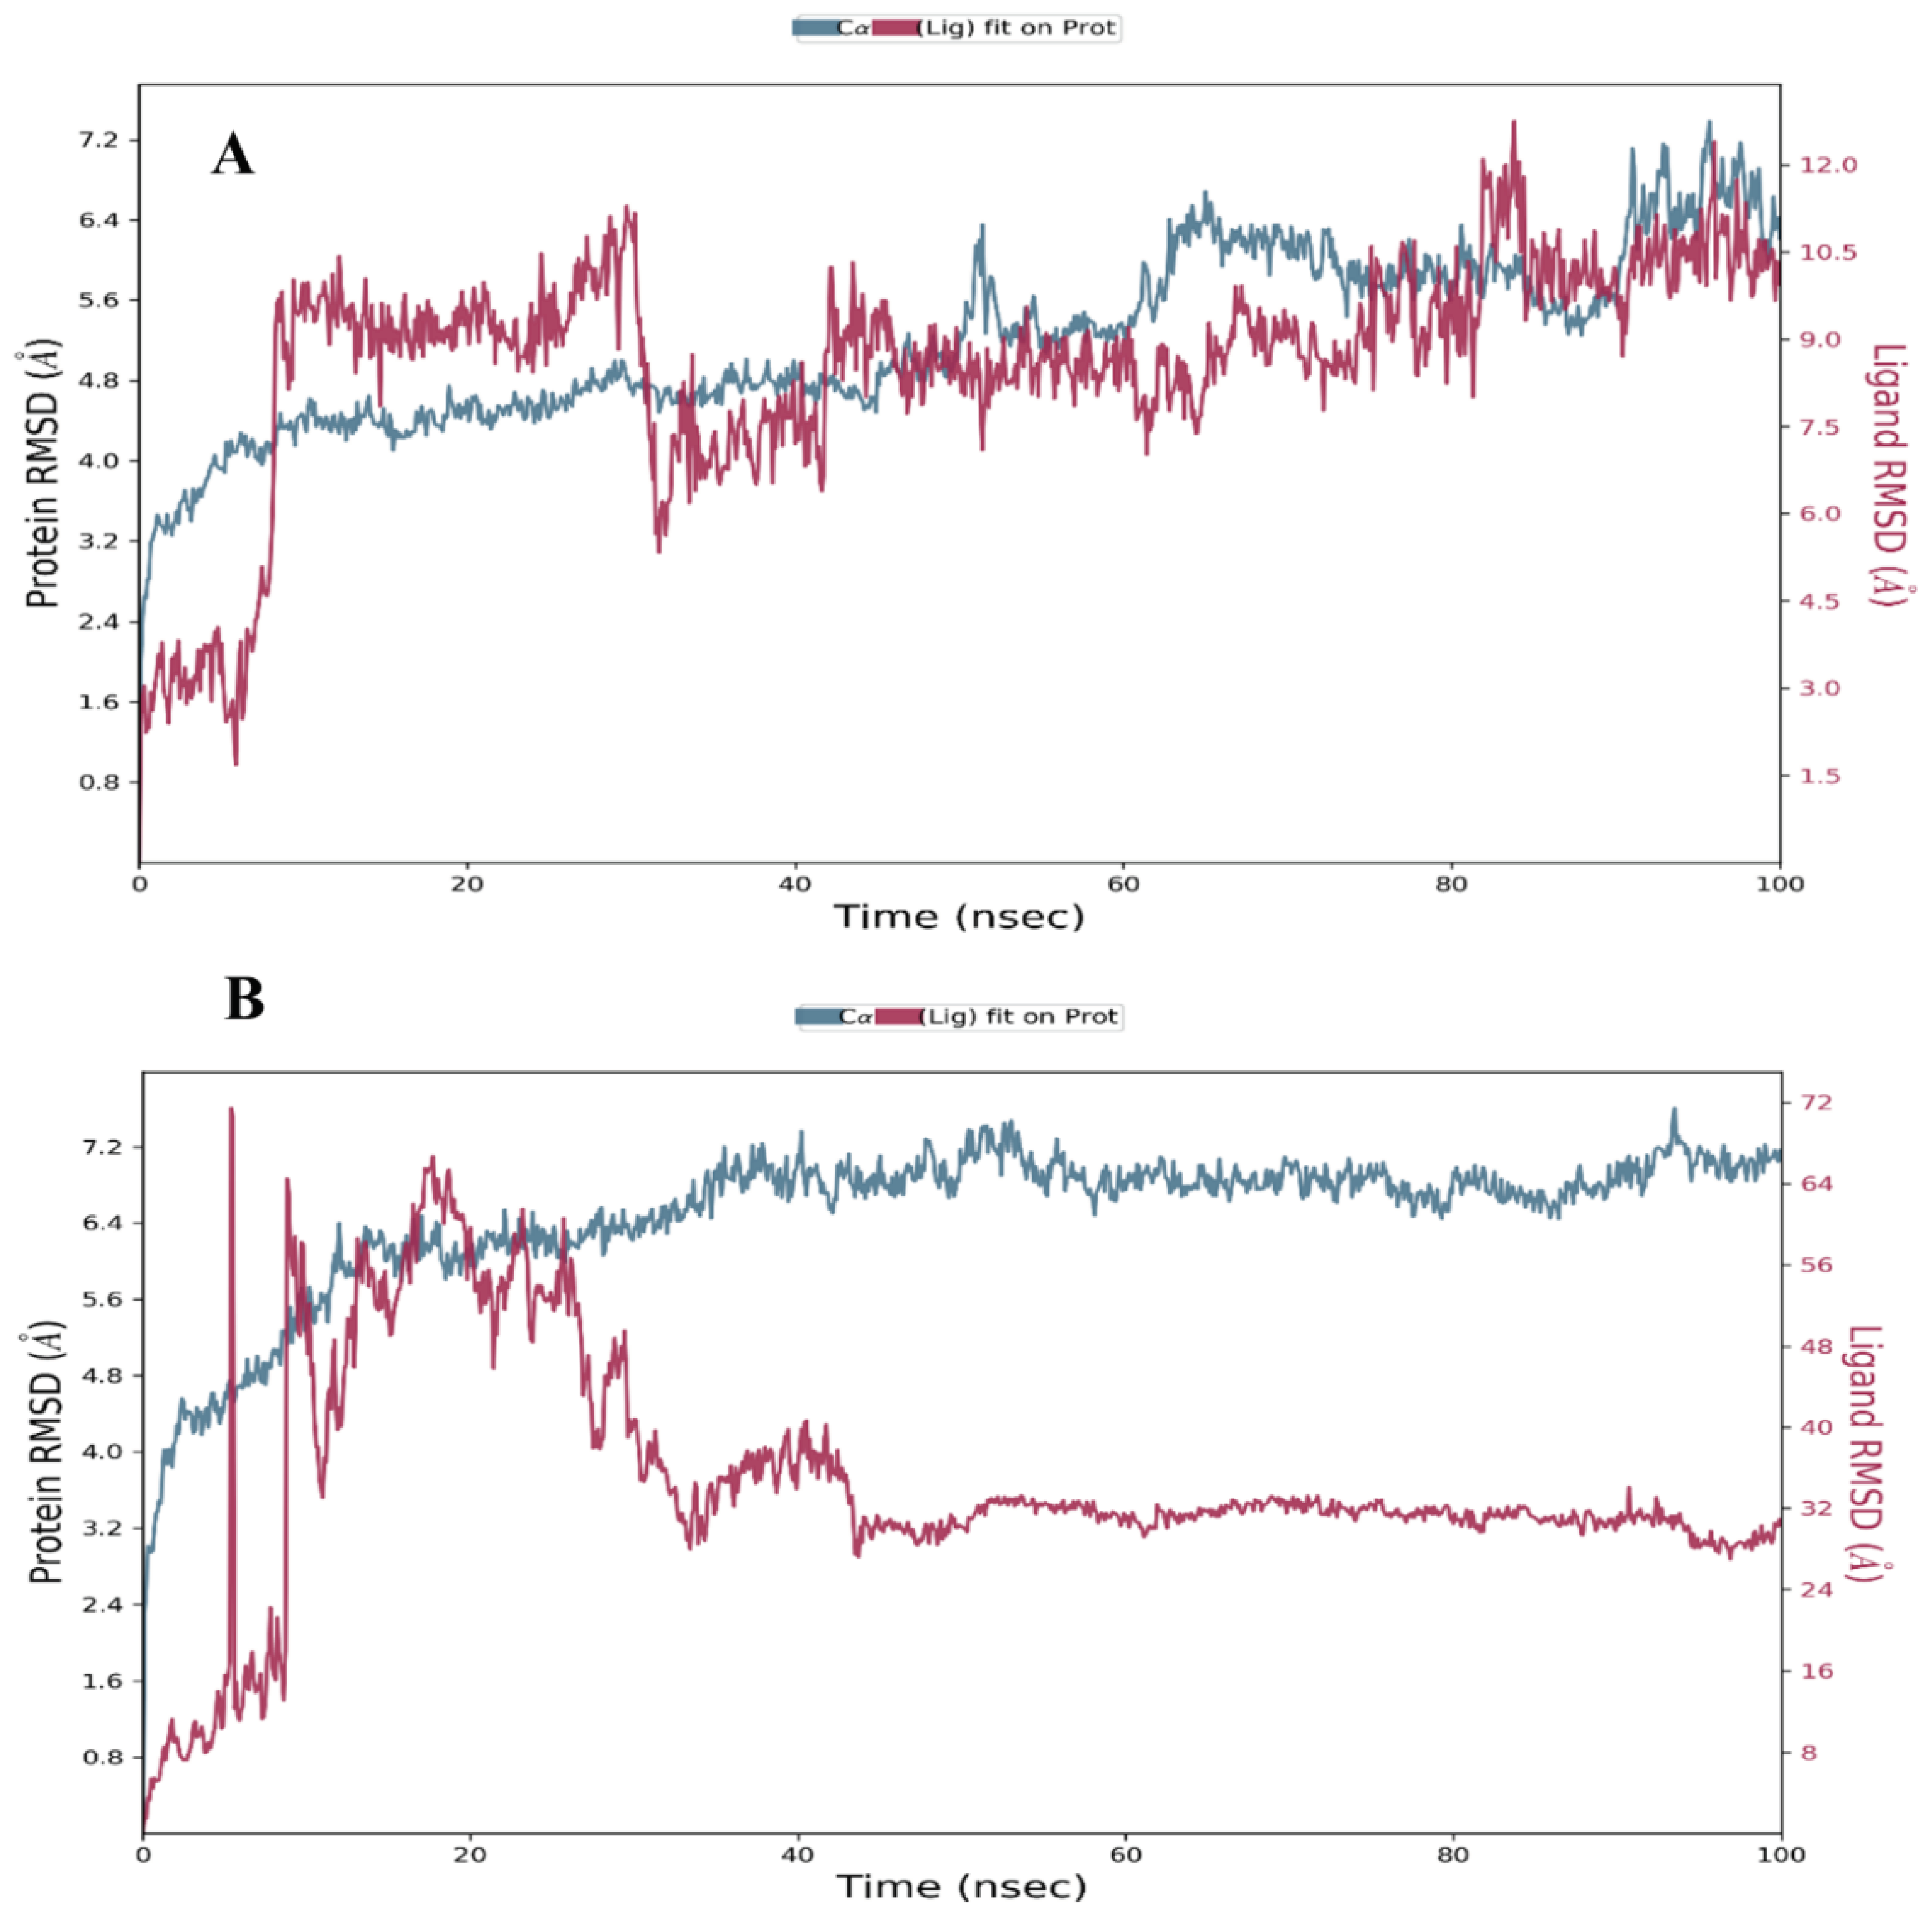
Figure 9.
(A) Residue-wise RMSF of receptor in contact with A1 and (B) A2 compounds during 200 ns MD simulations. (C) display most fluctuated regions during 100 ns simulations and highlighted with red color.
Figure 9.
(A) Residue-wise RMSF of receptor in contact with A1 and (B) A2 compounds during 200 ns MD simulations. (C) display most fluctuated regions during 100 ns simulations and highlighted with red color.
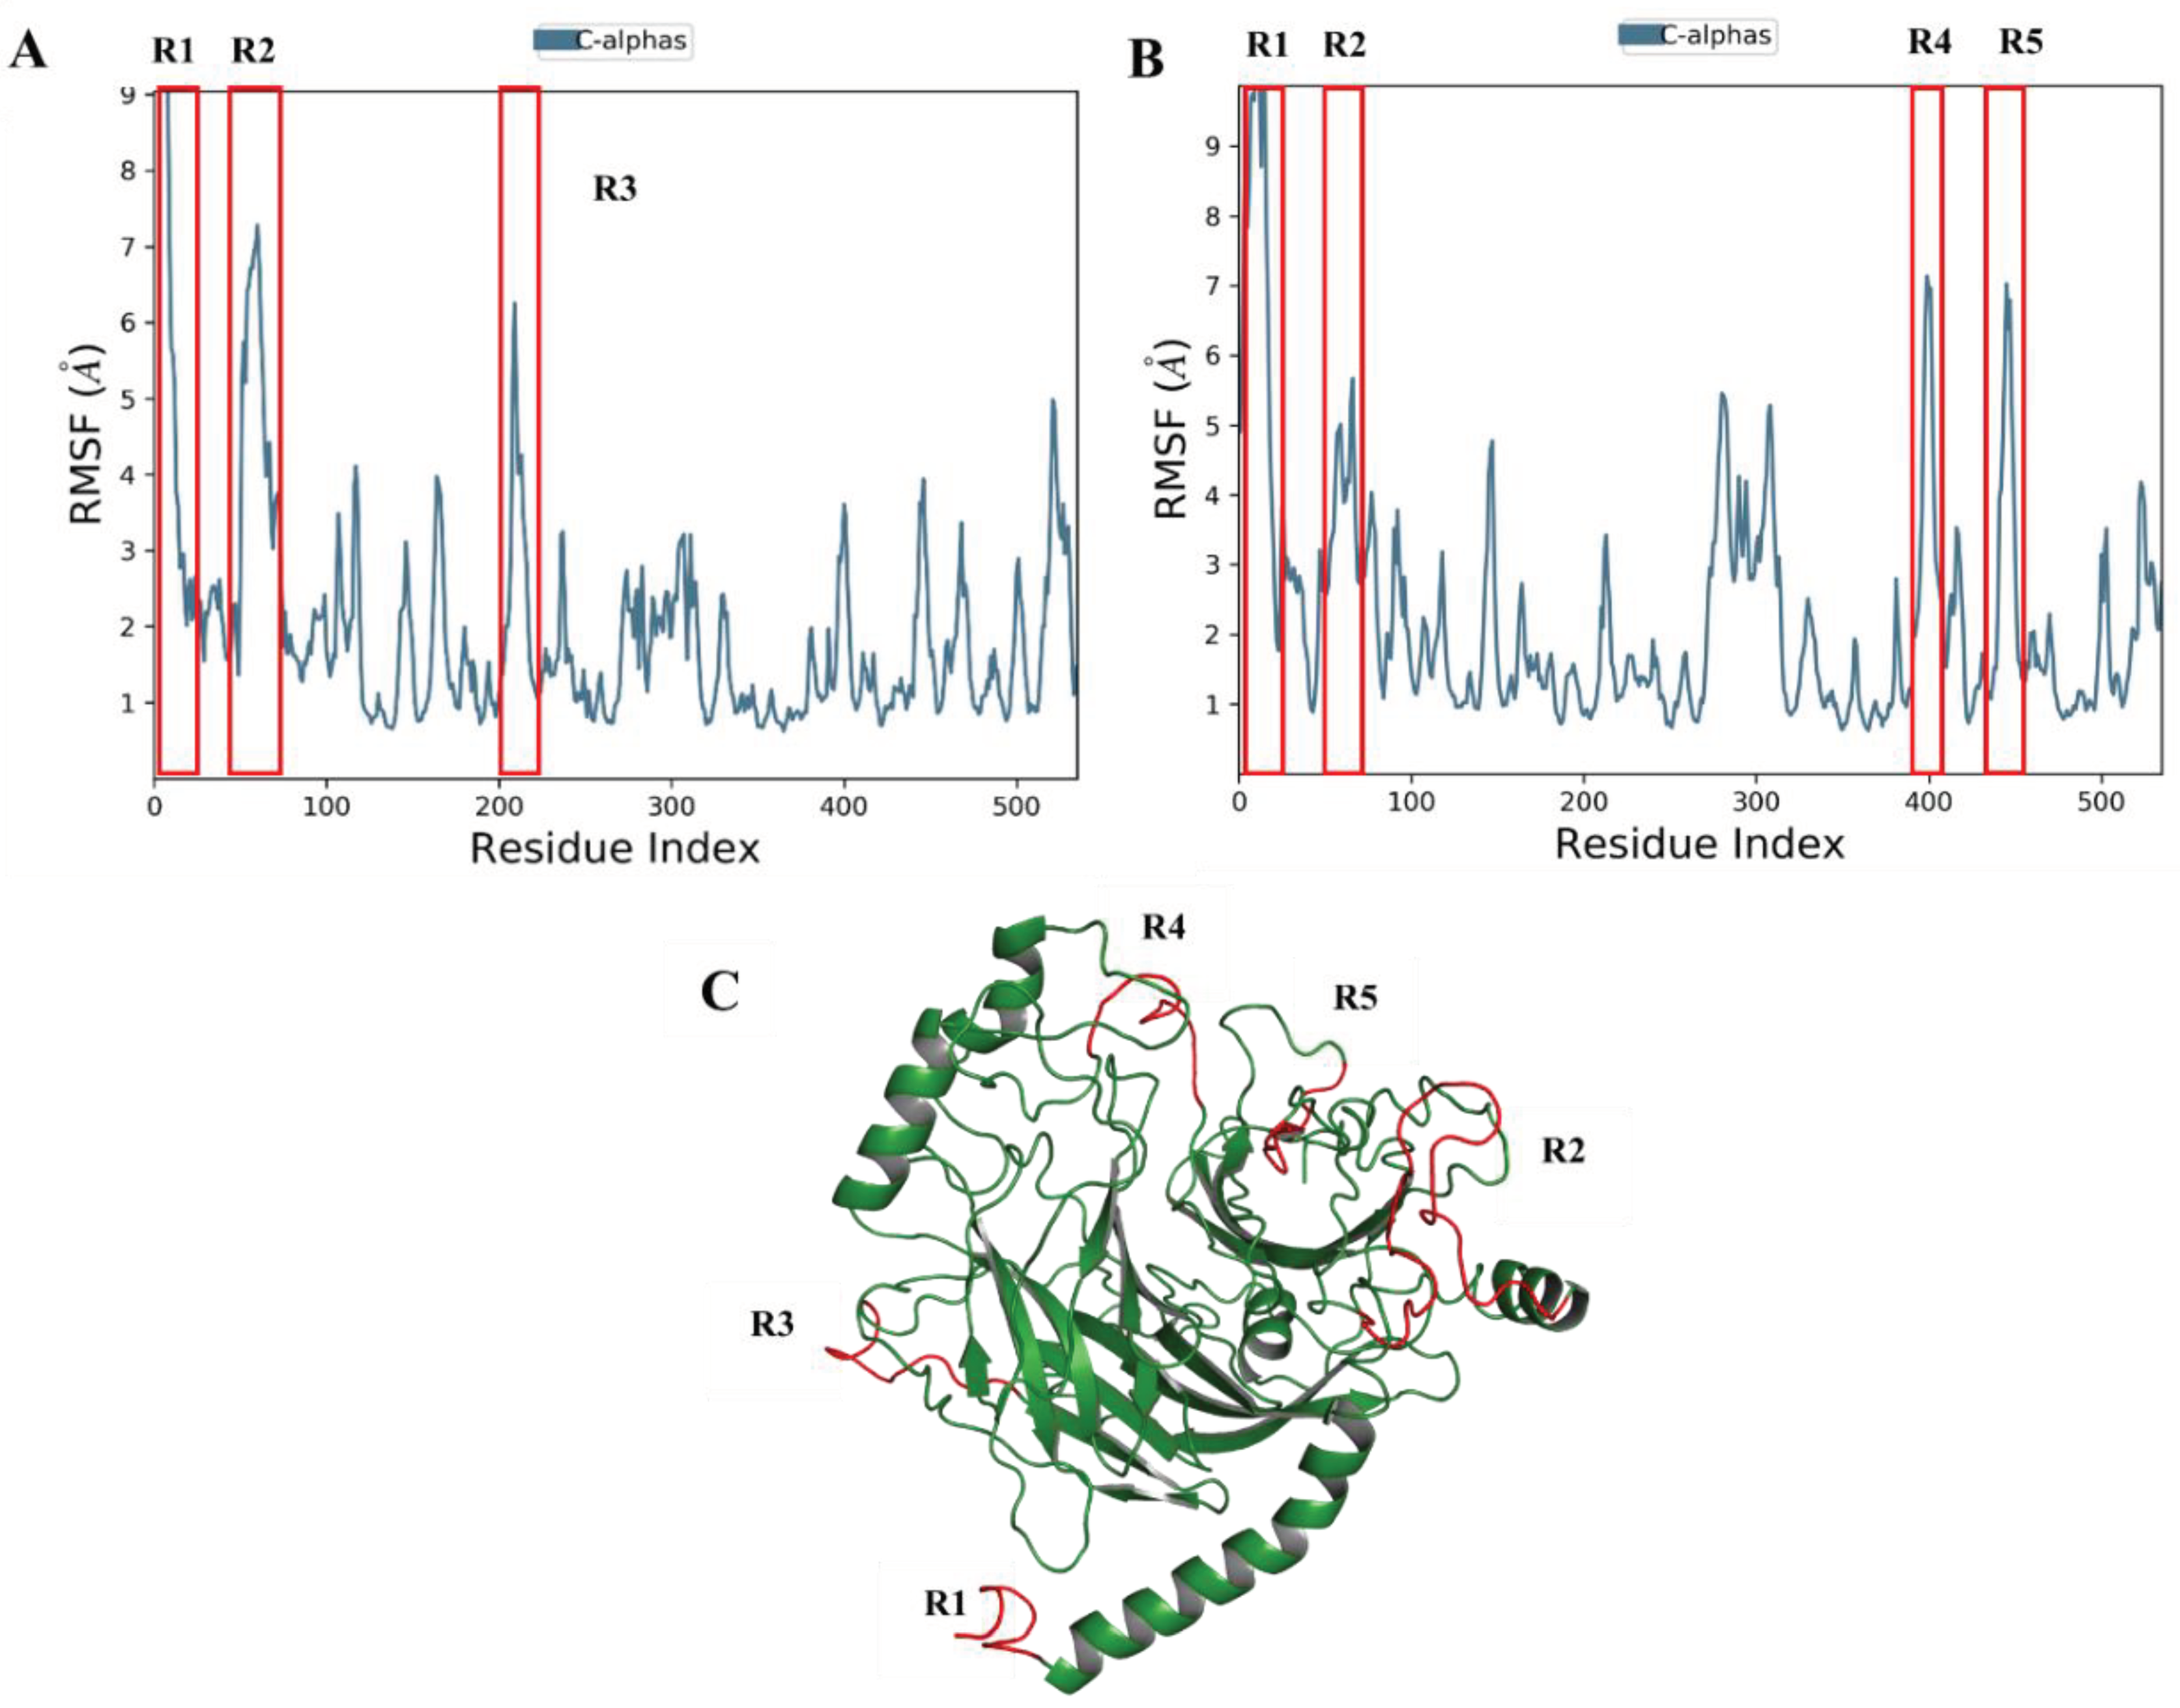
Figure 10.
The upper plot (blue color) captures secondary structure element composition for each trajectory frame during MD simulation while the bottom plot display residue wise SSE assignment (alpha helices: orange color and beta strands: cyan color) over time when A1 (A) and A2 compounds (B) was in contact with HN receptor.
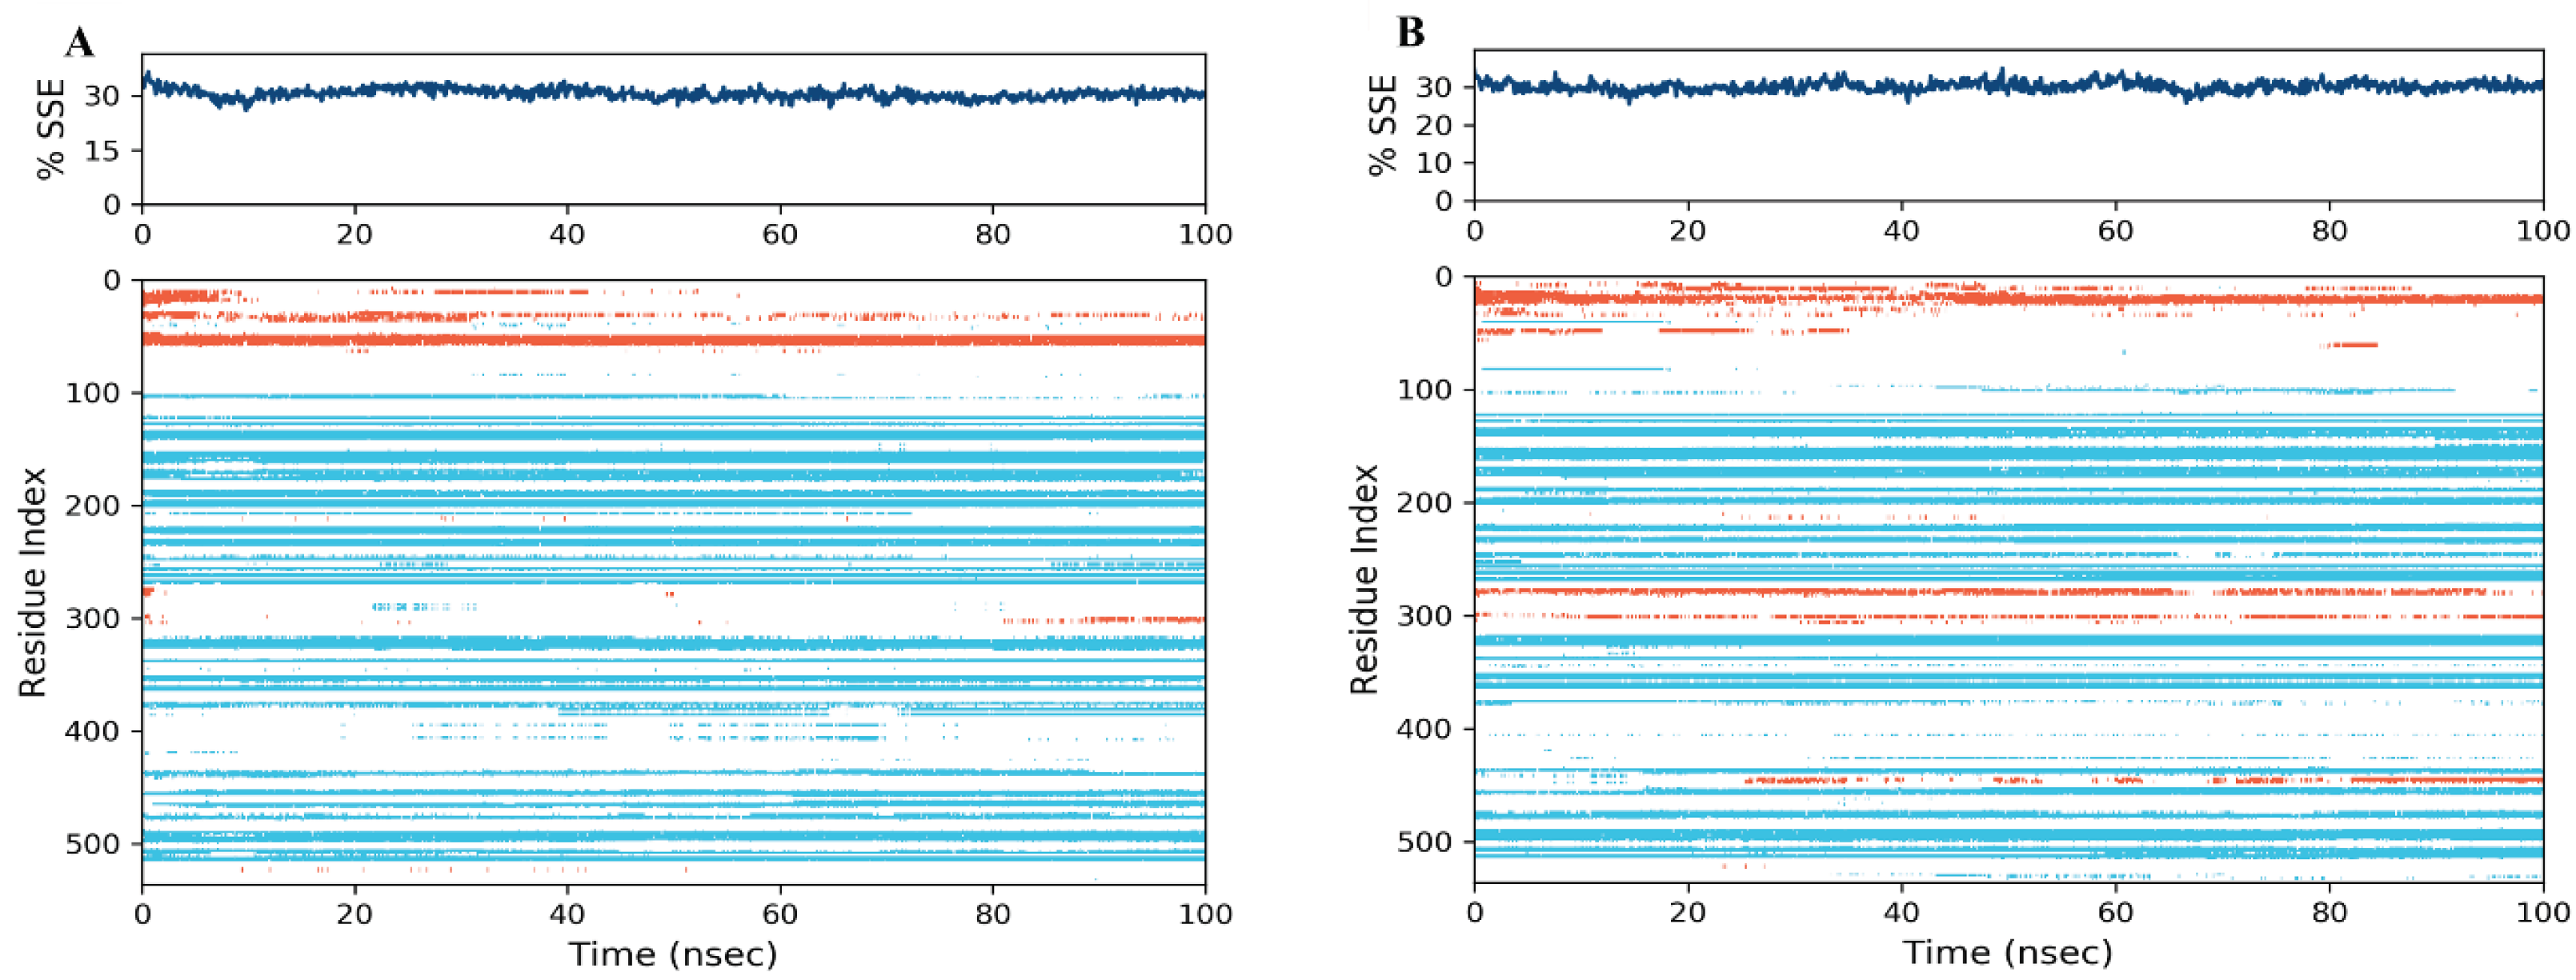
Figure 11.
Represent specific interactions between protein and ligand which occur >60.0% of simulation time (A) interaction of A1 compound with HN receptor (B) A2 and HN protein interactions.
Figure 11.
Represent specific interactions between protein and ligand which occur >60.0% of simulation time (A) interaction of A1 compound with HN receptor (B) A2 and HN protein interactions.
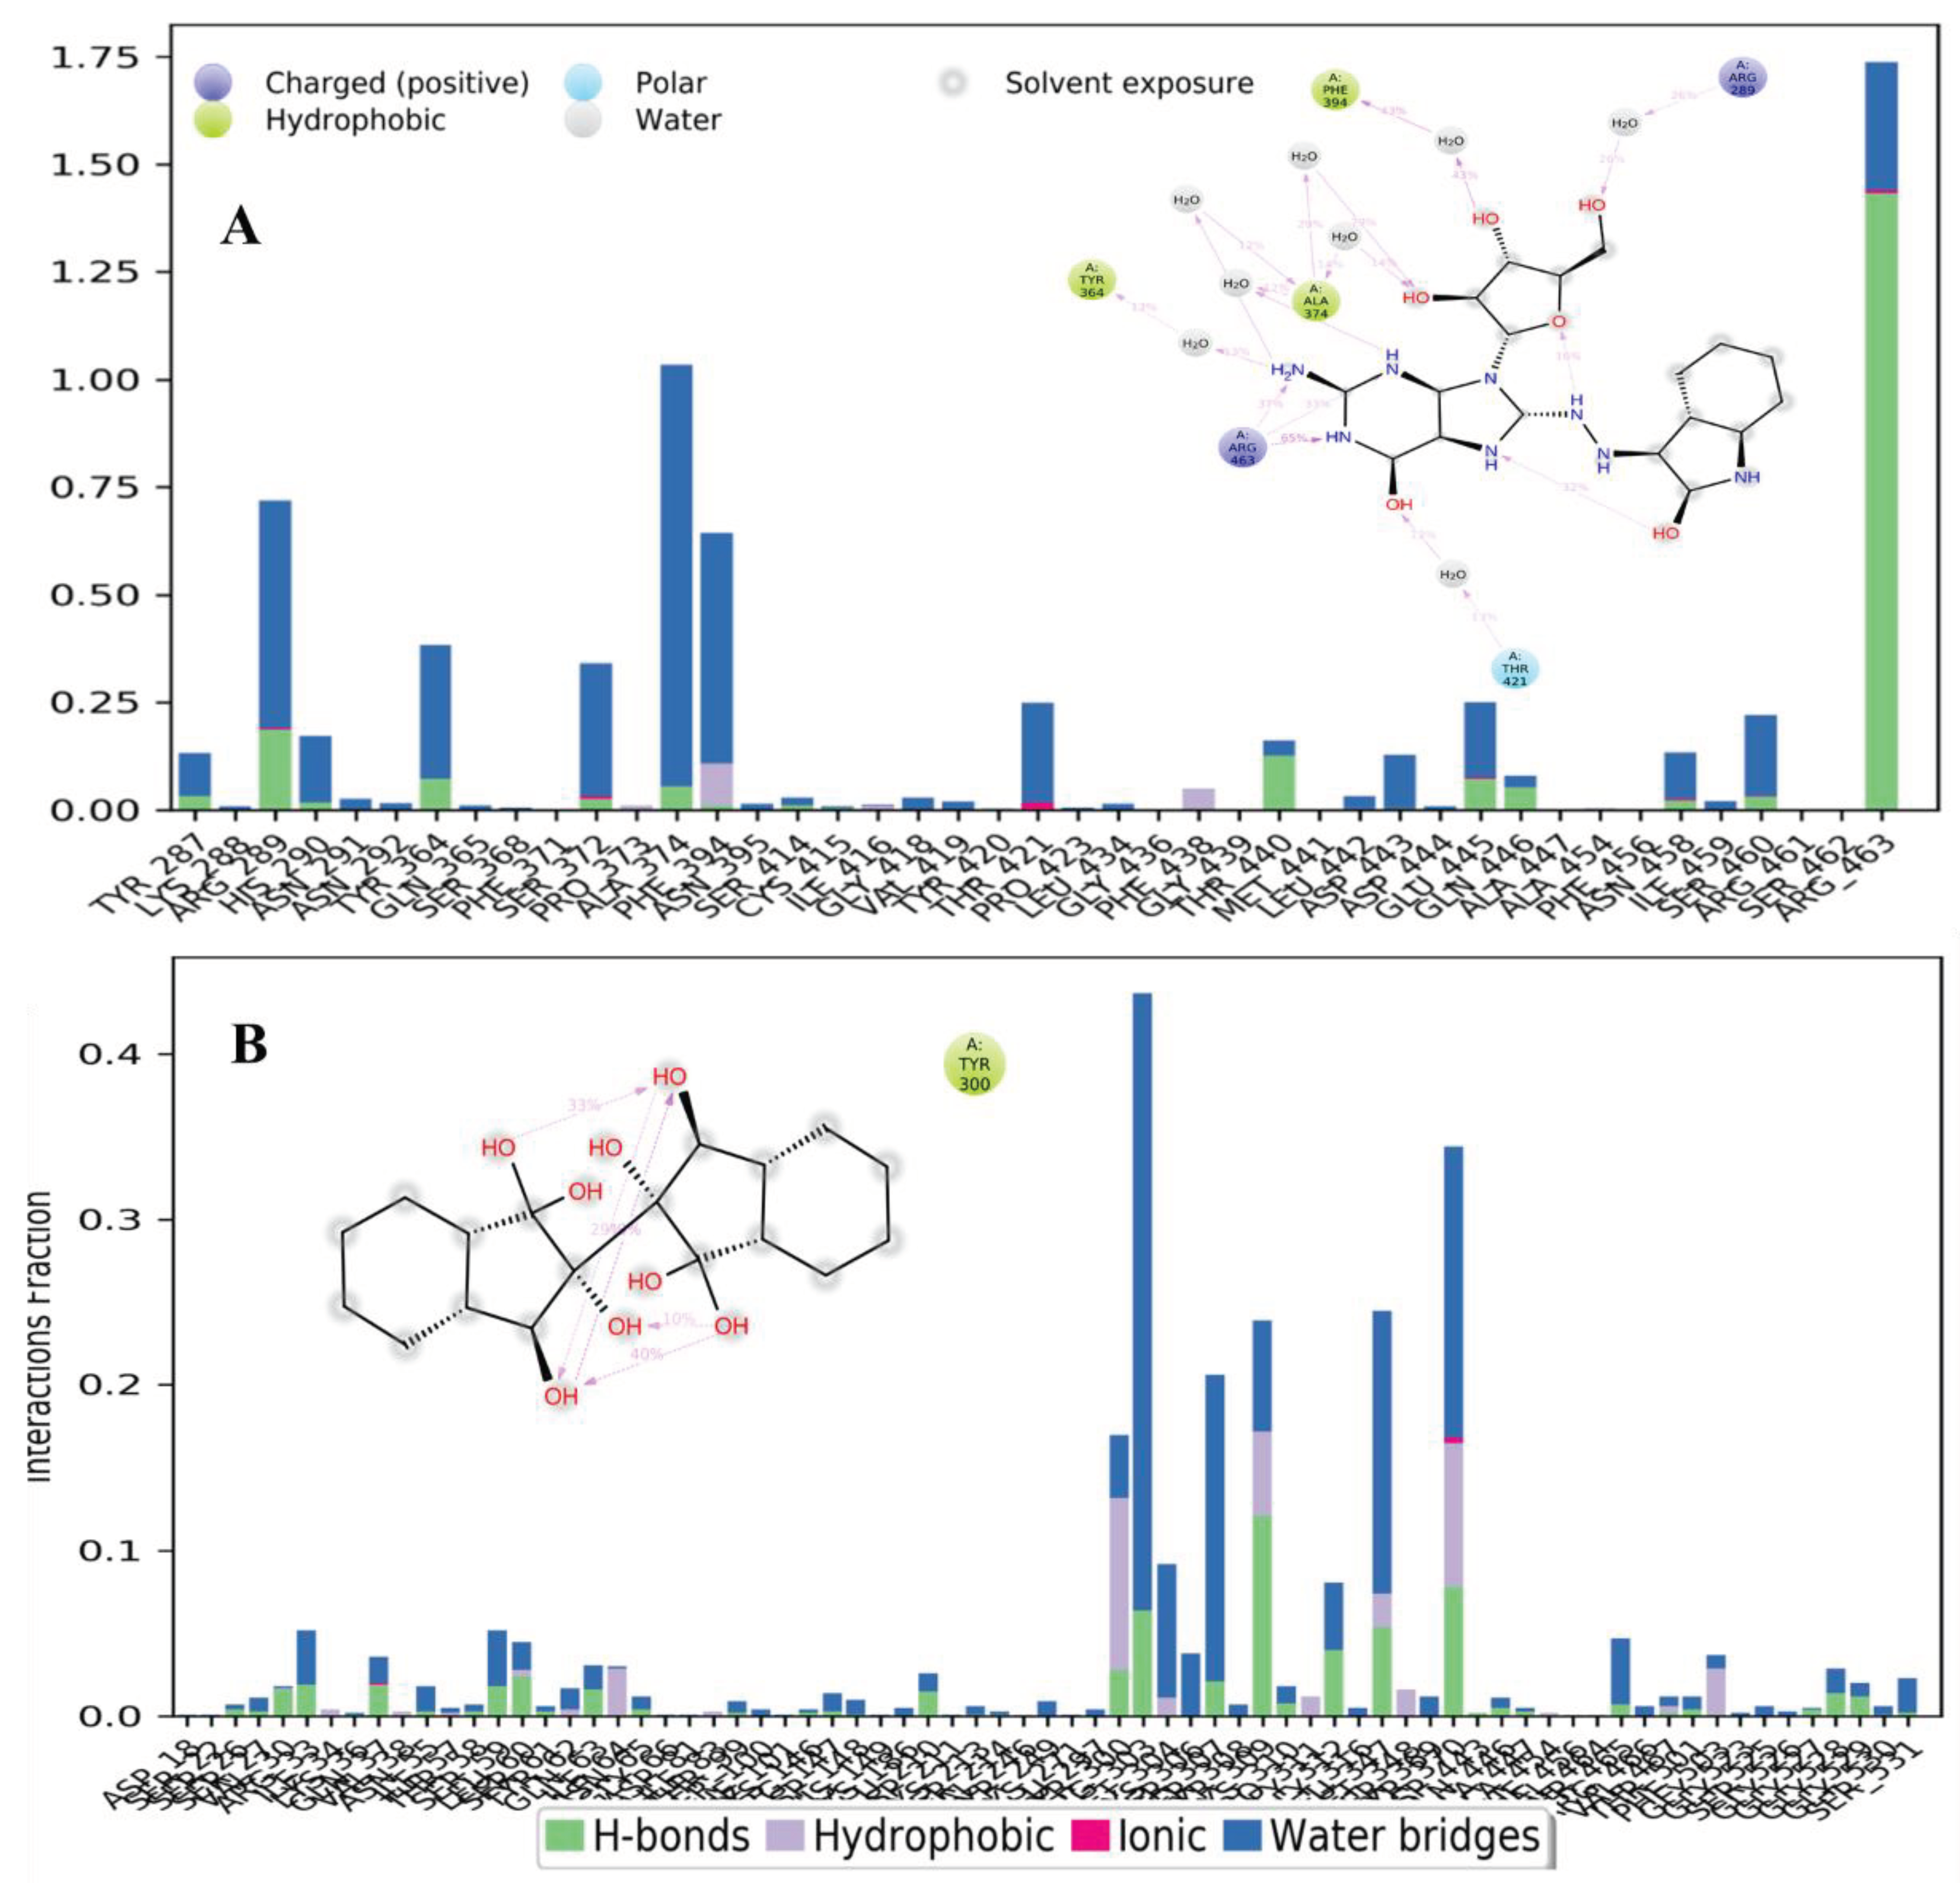
Figure 12.
Ligand properties of A1 (A) and A2 (B) i.e., IntraHbond, RMSD, radius of gyration, Solvent accessible surface area, and polar surface area.
Figure 12.
Ligand properties of A1 (A) and A2 (B) i.e., IntraHbond, RMSD, radius of gyration, Solvent accessible surface area, and polar surface area.
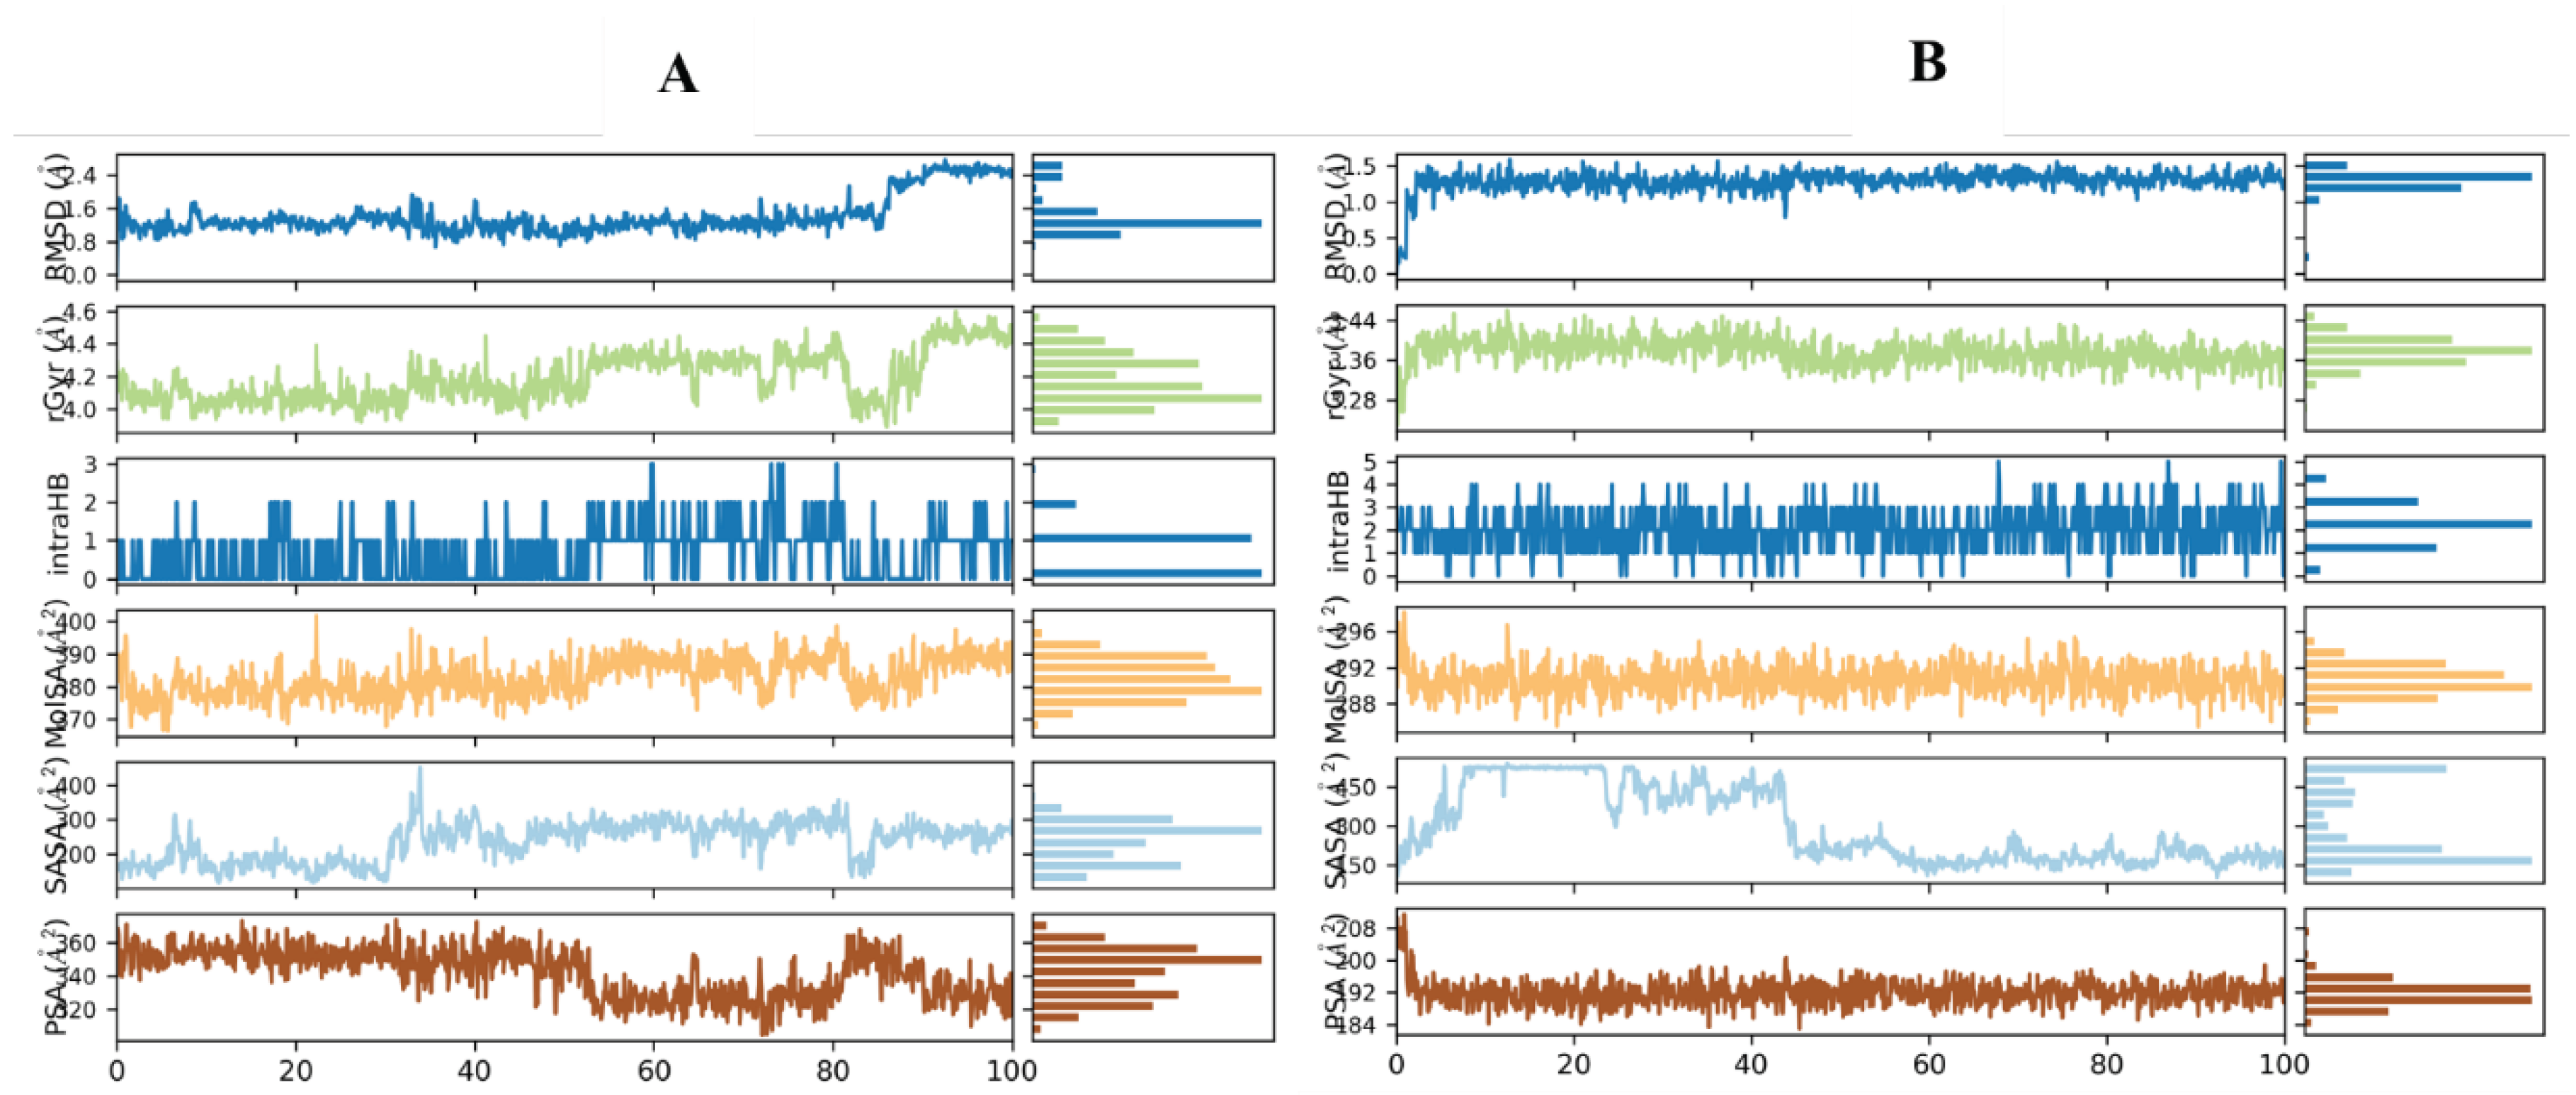

Table 1.
Binding affinity, interacting residues depicting interactions i.e., H-bond, carbon-hydrogen bond, Pi-anion, Alkyl, pi-pi stacked, pi-Alkyl interactions of hit chemicals with HN target protein.
Table 1.
Binding affinity, interacting residues depicting interactions i.e., H-bond, carbon-hydrogen bond, Pi-anion, Alkyl, pi-pi stacked, pi-Alkyl interactions of hit chemicals with HN target protein.
| Hits IDs | Binding Affinities (kcal/mol) | Interacting Residues | Type of Interactions | Vander Wall’s Interacting Residues |
|---|---|---|---|---|
| ZINC05223166 (A1) | -8.9 | Ser414, Ser372, Thr421, Thr440, Gln446, Asp443, Glu445, Val452, Ala454 |
Conventional H-bond, Attractive charge, Alkyl. | Arg463, Phe456, Asp444, Ala447, Arg448, Thr465, Ile416, Phe438 |
|
ZINC02596997 (A2) |
-8.7 | Thr440, Asp443, Thr465, Glu445, Ile416 | Conventional H-bond, Pi-anion, Alkyl. | Phe456, Ala454, Arg448, Ala447, Phe438, Asp444, Asp422, Gly439, Phe371, Thr421 |
| ZINC01700877 (A3) | -8 | Ala447, Asp443, Gln446, Arg448, Ala454 | Conventional H-bond, Alkyl. | Thr465, Val467, Leu449, Val452, Phe456, Thr440, Glu445 |
| ZINC04011865 (A4) | -8 | Ser369, Phe438, Thr421, Ala374, Pro423, Pro425 | Conventional H-bond, carbon-hydrogen bond, pi-pi stacked, pi-Alkyl. | Asp422, Gly367, Phe371, Tyr420, Ile416, Glu445 |
| ZINC04011866 (A5) | -8 | Phe438, Pro423, Pro425, Ala374 | pi-pi stacked, pi-Alkyl. | Ser372, Ile416, Gly367, Ser369, Tyr420, Tyr370, Asp422 |
| ZINC04348410 (A6) | -7.8 | Thr421, Phe438, Ile416, Ala374 | Conventional H-bond, carbon-hydrogen bond, pi-pi stacked, pi-sigma. | Glu445, Ser372, Arg463, Pro423, Pro425, Arg366, Gly367, Asp422, Ser368, Tyr370, Phe371 |
| ZINC04179503 (A7) | -7.7 | Phe371, Thr440, Gly439, Ile416 | Conventional H-bond, pi-Alkyl. | Ser372, Ser368, Ser369, Tyr370, Tyr420, Glu445, Thr421, Phe438, Asp422, Pro423, Pro425 |
| ZINC03956713 (A8) | -7.5 | Thr440, Thr421, Ile416, Ser372, Phe371 | Conventional H-bond, carbon-hydrogen bond, pi-Alkyl. | Tyr370, Ser369, Gly418, Tyr420, Val419, Gly367, Asp422, Pro423, Phe438, Ser372, Phe456, Arg463 |
| ZINC04185655 (A9) | -7.5 | Tyr370, Ser368, Thr440, Pro423, Thr421 | Conventional H-bond, carbon-hydrogen bond, Alkyl interactions. | Ala374, Asp422, Gly439, Phe438, Ser372, Ile416, Tyr420, Ser368, Gly367. |
Table 2.
Physicochemical properties, Lipophilicity, and ADME analysis along drug and lead-likeness of top hits.
Table 2.
Physicochemical properties, Lipophilicity, and ADME analysis along drug and lead-likeness of top hits.
| Molecule ID | (A1) | (A2) | (A3) | (A4) | (A5) | |
|---|---|---|---|---|---|---|
| Physicochemical Properties | Formula | C18H18N8O6 | C16H18O8 | C18H14O8 | C15H21NO6 | C15H21NO6 |
| MW | 442.39 | 338.31 | 358.3 | 311.33 | 311.33 | |
| Aromatic heavy atoms | 15 | 10 | 12 | 6 | 6 | |
| Fraction Csp3 | 0.28 | 0.44 | 0.22 | 0.53 | 0.53 | |
| Rotatable bonds | 4 | 3 | 1 | 6 | 6 | |
| MR | 113.3 | 81.6 | 83.68 | 76.41 | 76.41 | |
| Lipophilicity | iLOGP | 0.28 | 0.9 | 1.07 | 1.21 | 1.43 |
| XLOGP3 | -1.45 | -0.78 | -2.11 | -0.7 | -0.7 | |
| WLOGP | -3 | -0.72 | -1.7 | -1 | -1 | |
| MLOGP | -1.49 | -0.72 | -0.76 | -0.92 | -0.92 | |
| Silicos-IT Log P | -1.83 | 0.26 | 0.48 | -0.25 | -0.25 | |
| Consensus LogP | -1.5 | -0.21 | -0.61 | -0.33 | -0.29 | |
| ESOL Log S | -1.75 | -1.56 | -1.01 | -1.14 | -1.14 | |
| Water Solubility | ESOL Solubility (mg/ml) | 7.83E+00 | 9.39E+00 | 3.52E+01 | 2.28E+01 | 2.28E+01 |
| ESOL Solubility (mol/l) | 1.77E-02 | 2.78E-02 | 9.82E-02 | 7.33E-02 | 7.33E-02 | |
| ESOL Class | Very soluble | Very soluble | Very soluble | Very soluble | Very soluble | |
| Ali Log S | -2.52 | -1.46 | -0.63 | -1.1 | -1.1 | |
| Ali Solubility (mg/ml) | 1.34E+00 | 1.16E+01 | 8.45E+01 | 2.48E+01 | 2.48E+01 | |
| Ali Solubility (mol/l) | 3.02E-03 | 3.44E-02 | 2.36E-01 | 7.98E-02 | 7.98E-02 | |
| Ali Class | Soluble | Very soluble | Very soluble | Very soluble | Very soluble | |
| Silicos-IT LogSw | -2.47 | -1.79 | -2.81 | -1.57 | -1.57 | |
| Silicos-IT Solubility (mg/ml) | 1.49E+00 | 5.51E+00 | 5.52E-01 | 8.38E+00 | 8.38E+00 | |
| Silicos-IT Solubility (mol/l) | 3.36E-03 | 1.63E-02 | 1.54E-03 | 2.69E-02 | 2.69E-02 | |
| Silicos-IT class | Soluble | Soluble | Soluble | Soluble | Soluble | |
| Pharmacokinetics | GI absorption | High | High | Low | High | High |
| HIA | 0.1 | 0.3 | 0.3 | 0.5 | 0.7 | |
| Caco-2 Permeability | 18.5693 | 8.97596 | 20.6733 | 11.4467 | 11.4466 | |
| MDCK Permeability | 3.1e-06 | 5.4e-05 | 0.00025 | 9.3e-05 | 7e-05 | |
| BBB penetration | 0.1 | 0.3 | 0.7 | 0.3 | 0.3 | |
| CYP1A2 inhibitor | 0.1 | 0.3 | 0.3 | 0.1 | 0.2 | |
| CYP2C19 inhibitor | 0.1 | 0.1 | 0.1 | 0.2 | 0.1 | |
| CYP2C9 inhibitor | 0.1 | 0.1 | 0.1 | 0.1 | 0.1 | |
| CYP2D6 inhibitor | 0.1 | 0.1 | 0.1 | 0.1 | 0.1 | |
| CYP3A4 inhibitor | 0.1 | 0.1 | 0.1 | 0.1 | 0.1 | |
| Bioavailability Score | 0.57 | 0.55 | 0.55 | 0.55 | 0.55 |
Table 3.
Evaluation of biological activities of top hits to predict their antiviral, antibacterial, antitoxic, and antifungal potential.
Table 3.
Evaluation of biological activities of top hits to predict their antiviral, antibacterial, antitoxic, and antifungal potential.
| Compound | Possibility of being Activite (Pa) | Possibility of being Inactivite (Pi) | Biological Activities |
|---|---|---|---|
| A1 | 0.847 0.537 0.558 0.508 |
0.003 0.006 0.030 0.014 |
Antiviral (Poxvirus) Antiviral (Herpes) Antiviral (Picornavirus) Antiviral (Hepatitis B) |
| A2 | 0,670 0.537 0.492 0.364 |
0.012 0.010 0.008 0.011 |
Antifungal Antiviral (Influenza) Antitoxic Antibacterial |
| A3 | 0.470 0.507 0.446 0.325 |
0.010 0.047 0.022 0.018 |
Antiviral (Adenovirus) Antiviral (Picornavirus) Antibacterial Antiviral (CMV) |
| A4 | 0.525 0.489 0.508 0.323 |
0.040 0.005 0.029 0.012 |
Antiviral (Picornavirus) Antiviral (Hepatitis B) Antibacterial Antibiotic |
| A5 | 0.727 0.569 0.525 0.489 |
0.004 0.011 0.040 0.005 |
Antiviral (Influenza) Antibacterial Antiviral (Picornavirus) Antiviral (Hepatitis B) |
Disclaimer/Publisher’s Note: The statements, opinions and data contained in all publications are solely those of the individual author(s) and contributor(s) and not of MDPI and/or the editor(s). MDPI and/or the editor(s) disclaim responsibility for any injury to people or property resulting from any ideas, methods, instructions or products referred to in the content. |
© 2024 by the authors. Licensee MDPI, Basel, Switzerland. This article is an open access article distributed under the terms and conditions of the Creative Commons Attribution (CC BY) license (http://creativecommons.org/licenses/by/4.0/).
Copyright: This open access article is published under a Creative Commons CC BY 4.0 license, which permit the free download, distribution, and reuse, provided that the author and preprint are cited in any reuse.


