1. Introduction
Free neutrophil elastase (NE) is a major culprit for disease progression in both cystic fibrosis (CF) and chronic obstructive pulmonary disease (COPD). NE is abundant in the airways of patients with CF and COPD due to neutrophilic inflammation in response to chronic infections [
1]. NE activates signaling pathways leading to airway remodeling, failure to control infections, and chronic inflammation. NE degrades innate immune functions of the sentinel airway cell, the macrophage, by several mechanisms [
2]. NE causes macrophage phagocytic failure in part by cleaving opsonins, opsonin receptors, and macrophage receptors. NE sustains airway inflammation by stimulating NFκB upregulation of cytokines, degrading antimicrobial proteins such as lactoferrin, and activating other proteinases including cathepsins and matrix metalloproteases. NE treatment increases release of TNFα, a M1 marker, from blood monocyte derived macrophages (BMDM). In contrast, NE does not increase CCL18, a M2 marker, consistent with NE-induced M1 macrophage polarization [
3].
Recently, we reported that NE is taken up by human blood monocyte derived macrophages (BMDM), is localized to both the nucleus and cytoplasmic domains, and retains intracellular proteolytic activity [
3]. NE clips histone H3 causing chromatin decondensation and triggering the release of macrophage extracellular traps in alveolar macrophages from Cftr-null or wildtype littermate mice [
3], and from BMDM from patients with CF [
3], and from patients with COPD or control subjects [
3,
4]. Because NE cleaves peptides with alanine or valine at the P1 site [
5], NE likely has many protease targets in the macrophage nucleus and cytosol. Therefore, we evaluated whether NE degrades histone post-translational modifying enzymes including Histone deacetylases (HDACs) and Sirtuins in BMDM which could modify the macrophage phenotype.
HDACs and Sirtuins are evolutionarily conserved enzymes which remove the acetyl group from lysine with functional consequences such as chromatin condensation, transcriptional silencing and signaling [
6]. HDACs are classified based on their structure, function, and homology of accessory domains. There are 18 different human histone deacetylases (HDACs) including Class I nuclear HDACs (HDAC1-2-3-8), Class II cytoplasmic HDACs (HDACs4-5-6-7-9-10), Class III HDACs also known as Sirtuins (Sirt1 through 7), and Class IV HDAC (HDAC11) [
7].
Importantly, in COPD, changes in airway or serum HDAC and Sirt1 concentrations have been reported. HDAC2 expression and HDAC activity are decreased in PBMCs in COPD patients compared with smokers and non-smokers [
8]. Serum Sirt1 levels are also decreased in patients with COPD [
9]. Importantly, Sirt1 is required to deacetylate High Mobility Group Box 1 (HMGB1), a chromatin binding protein, that normally resides in the nucleus. When Sirt1 is degraded, HMGB1 is acetylated and translocates from the nucleus to the cytoplasm, a prerequisite for extracellular release and alarmin activity. Therefore, the Sirt1-HMGB1 axis modulates lung inflammation [
10]. We hypothesized that NE may alter the balance of histone deacetylases (HDACs or Sirtuins) and histone acetyltransferases (HATs) resulting in unopposed lysine acetylation of HMGB1 and cytoplasmic residence. To determine whether NE degrades specific HDACs or Sirts, we prepared human BMDM from healthy individuals or from subjects with CF or COPD to assess the impact of NE on HDAC and Sirt protein abundance, on deacetylase activity and on HMGB1 cellular localization.
2. Results
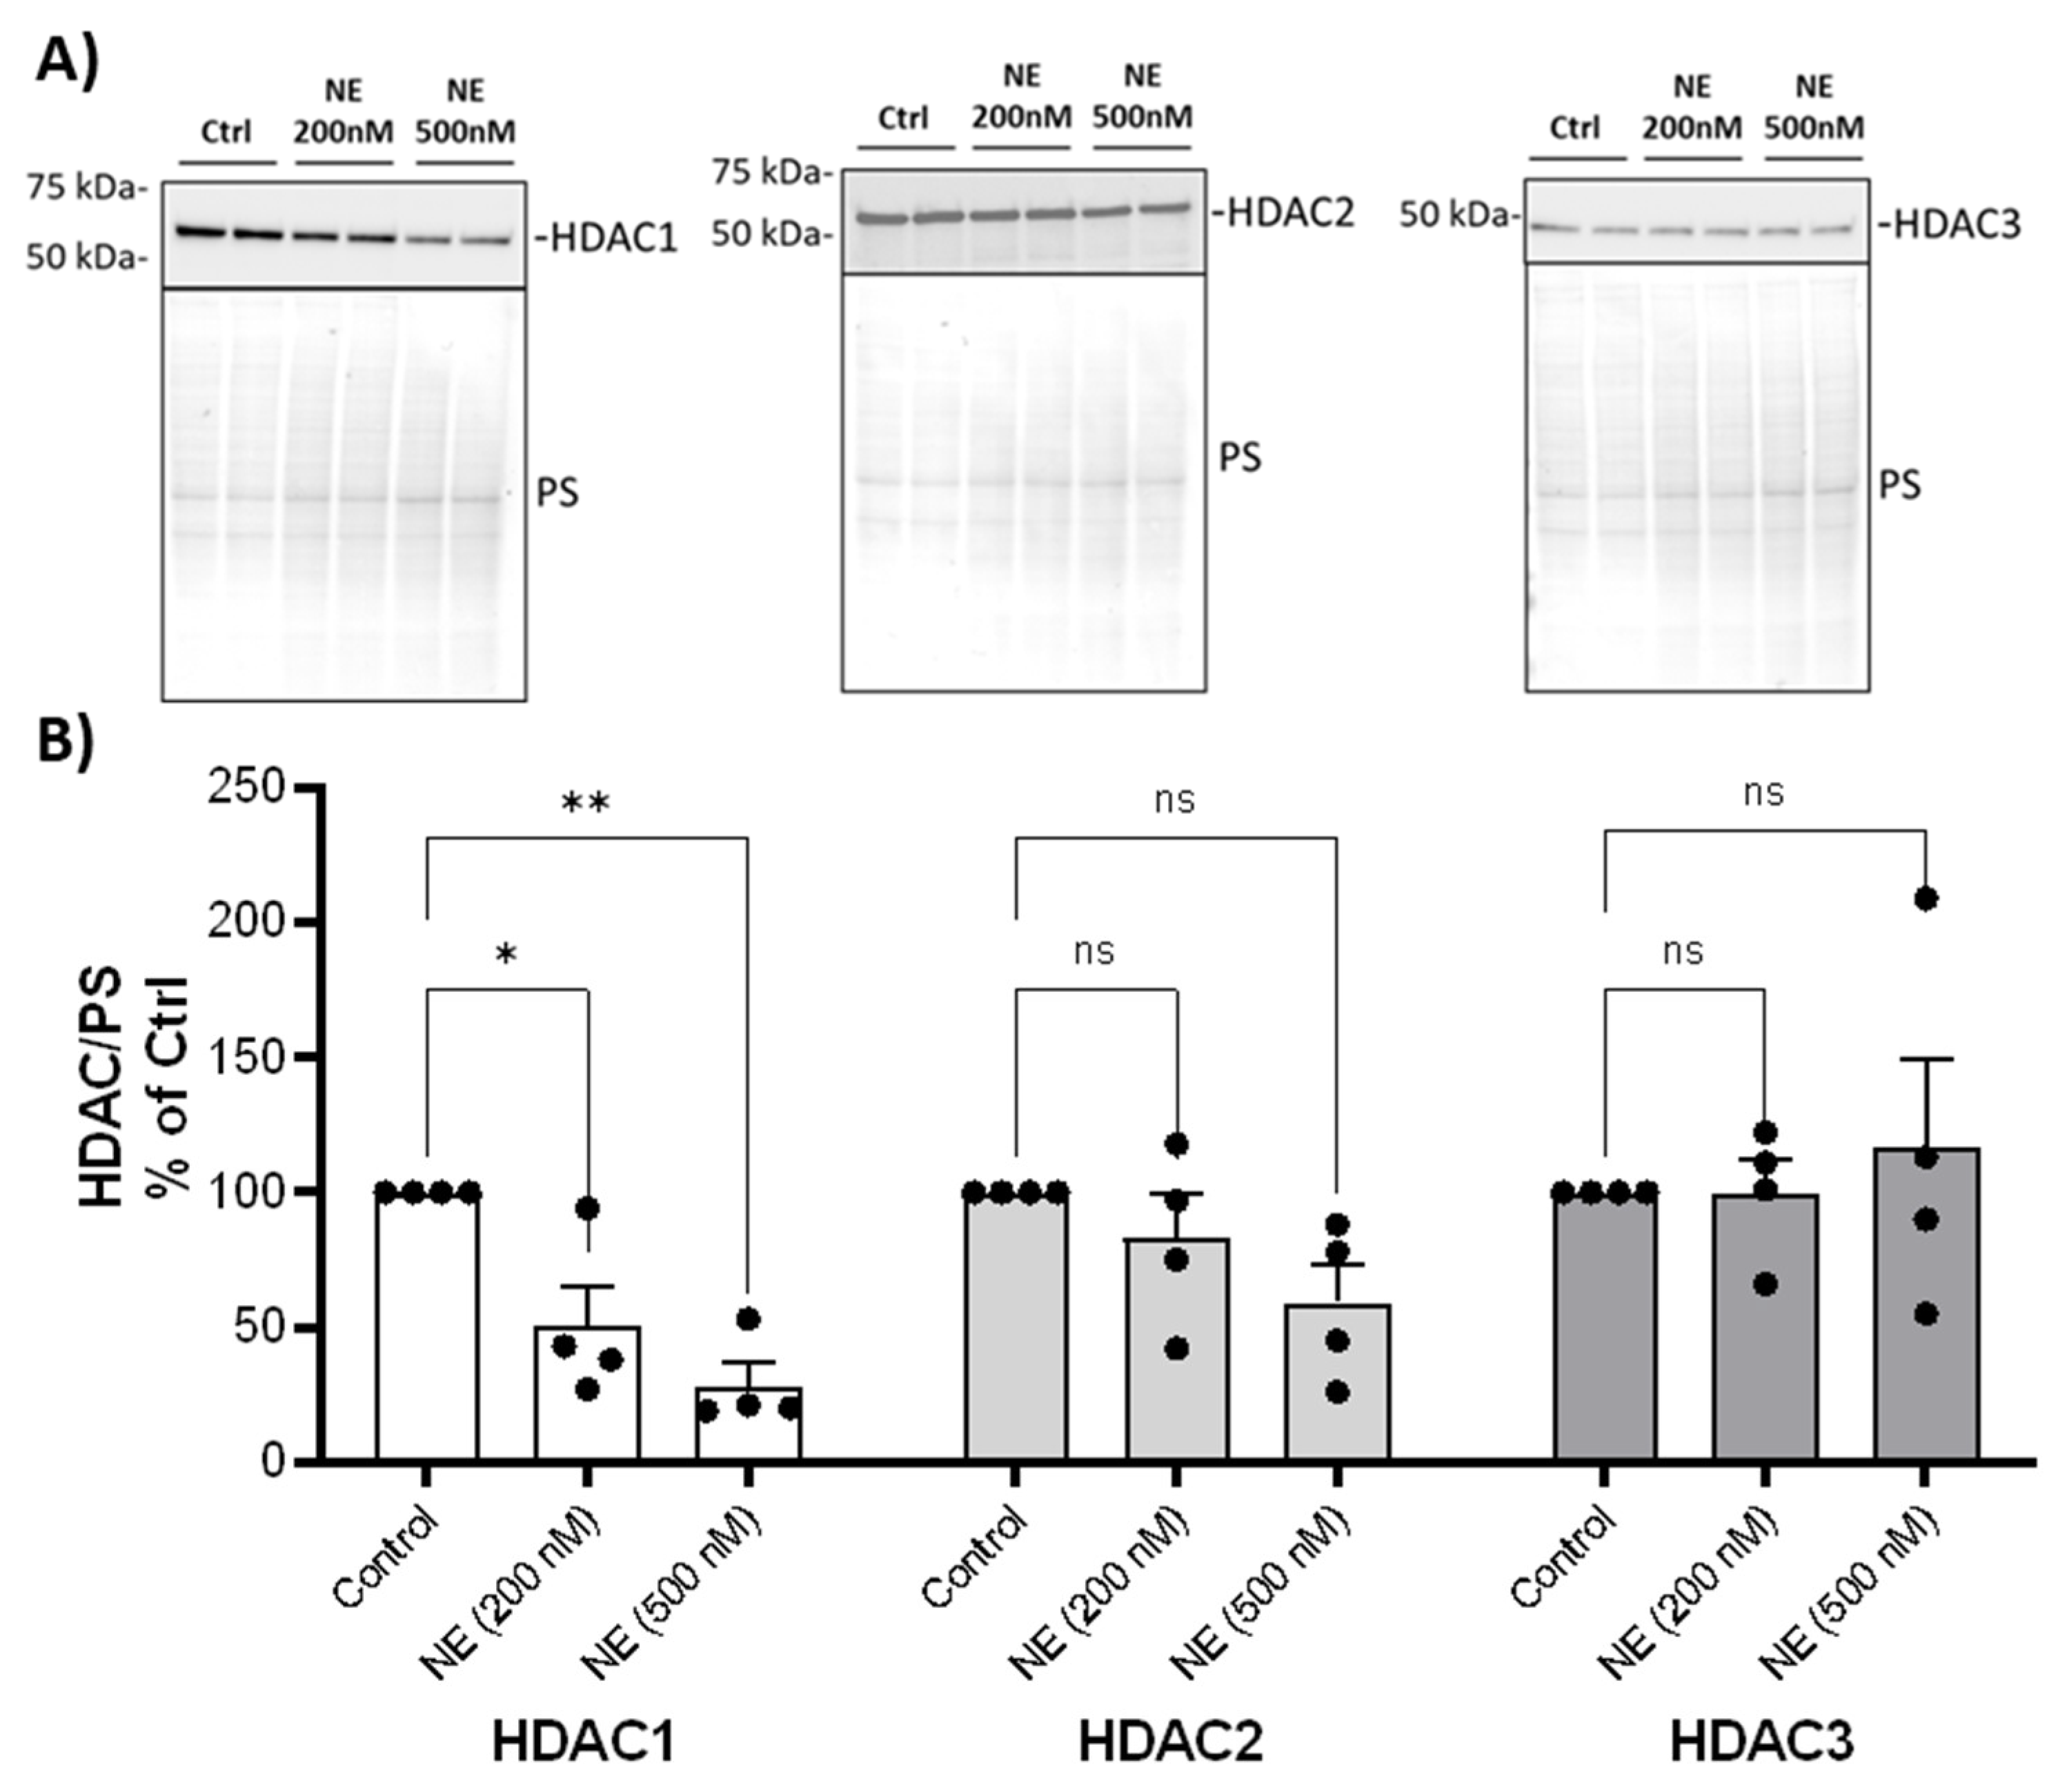
We examined whether NE catalyzed the degradation of HDAC and Sirtuin enzymes and decreased their activity. We first screened most of the HDACs and Sirtuins by western analysis using BMDM from healthy buffy coat donors. NE (200nM and 500nM, 2h) caused a significant decrease in nuclear HDAC 1 but had no effect on the protein abundance of other Class I HDACs: HDAC2 and HDAC3 (
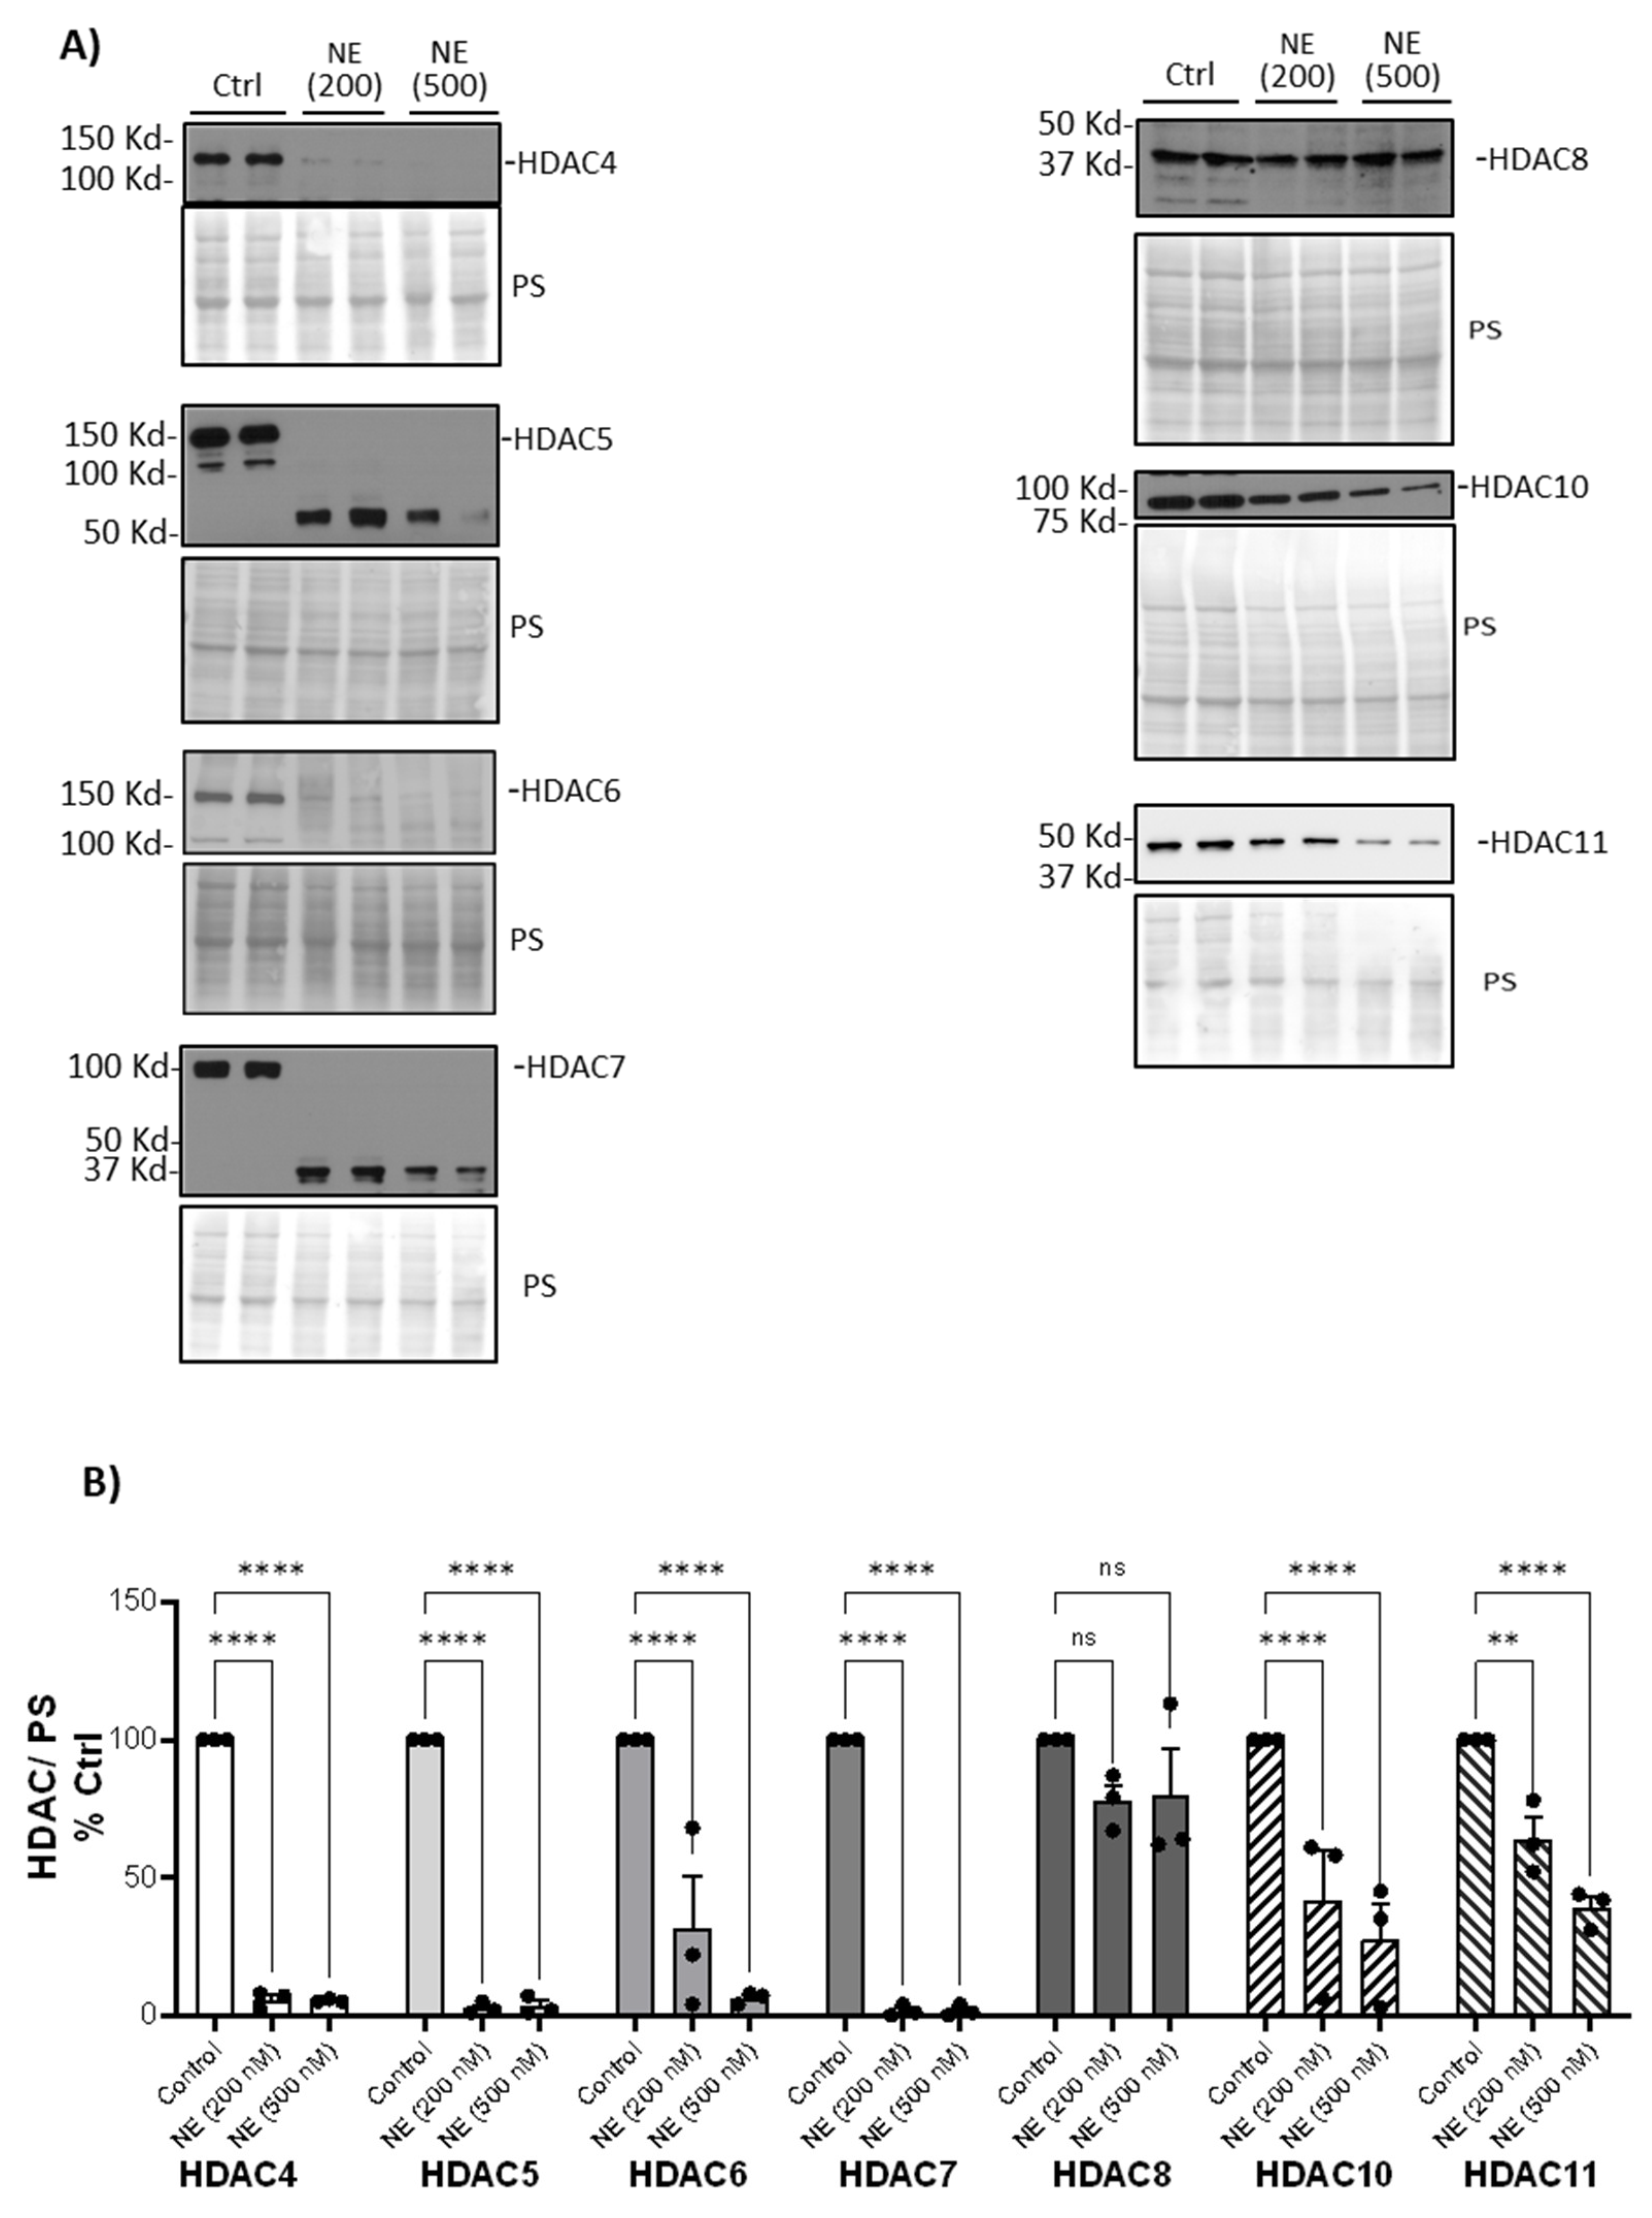
Figure 1). NE (200nM and 500nM, 2h) caused a significant decrease in cytoplasmic Class II and IV HDAC4, 5, 6, 7, 10, 11 but had no effect on HDAC8 (
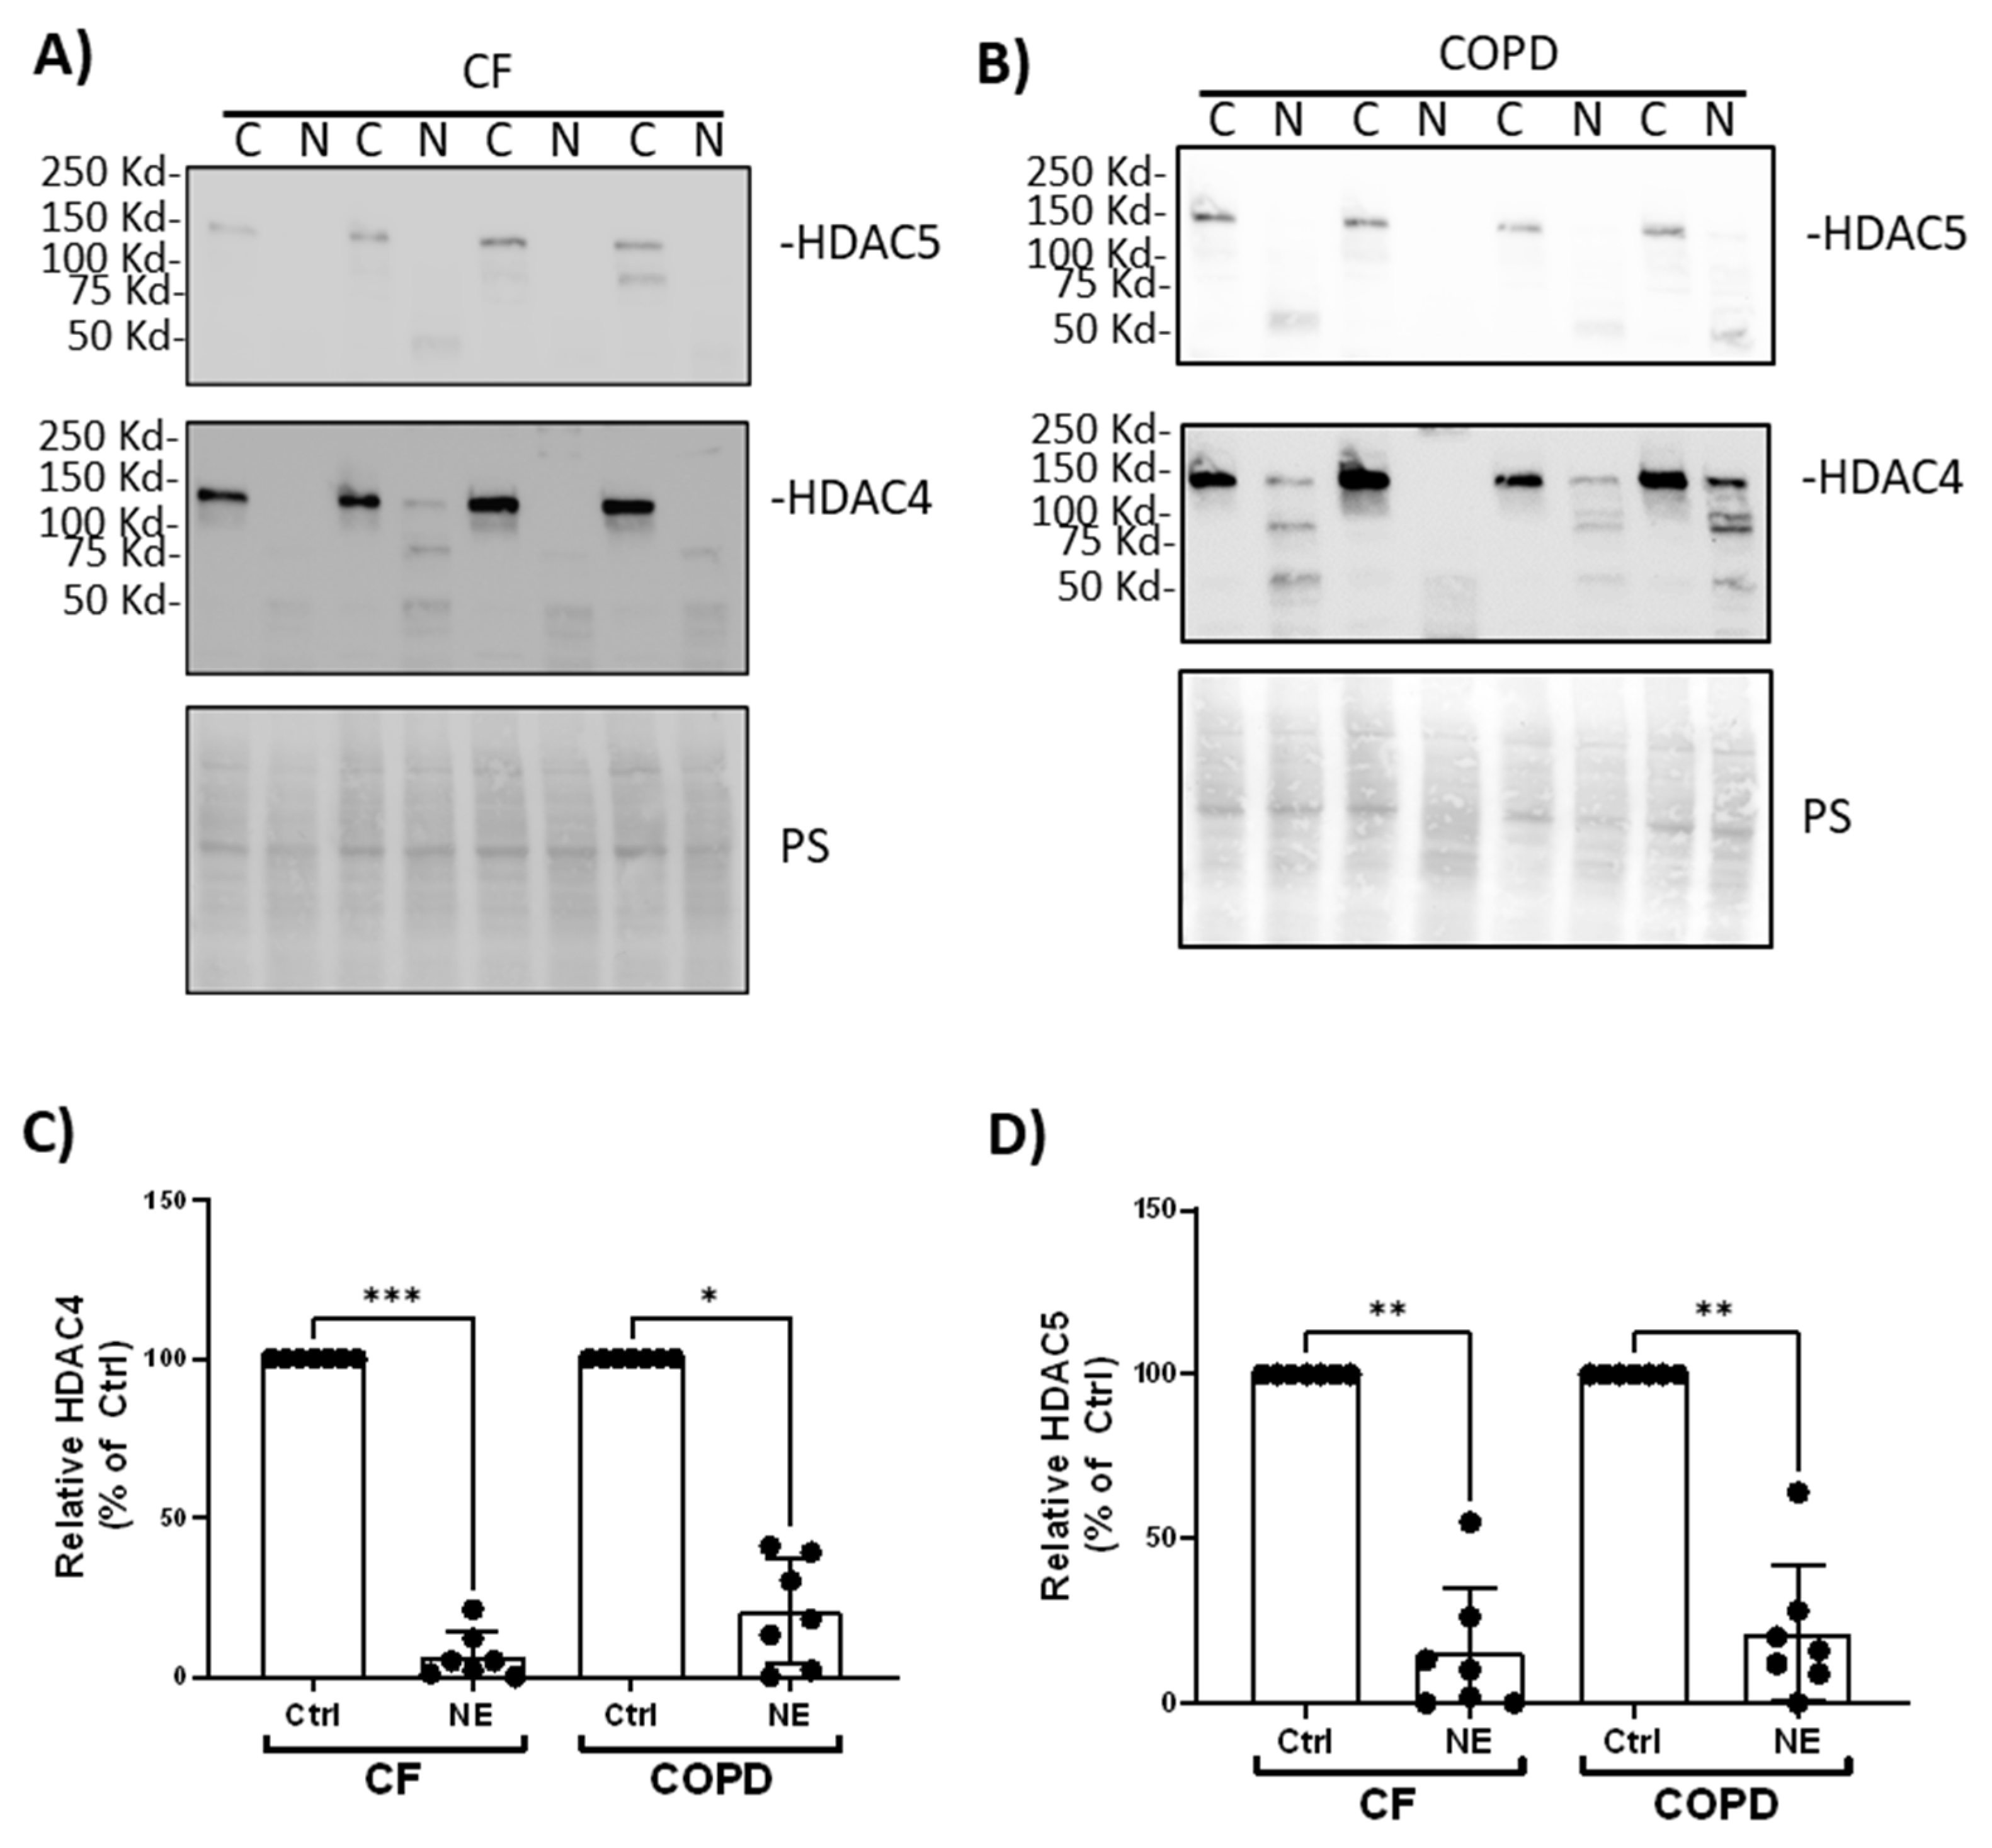
Figure 2). We confirmed similar findings in BMDM from patients with CF and COPD. NE (200nM, 2h) decreased HDAC4 and HDAC5 in BMDM from patients with CF and COPD (
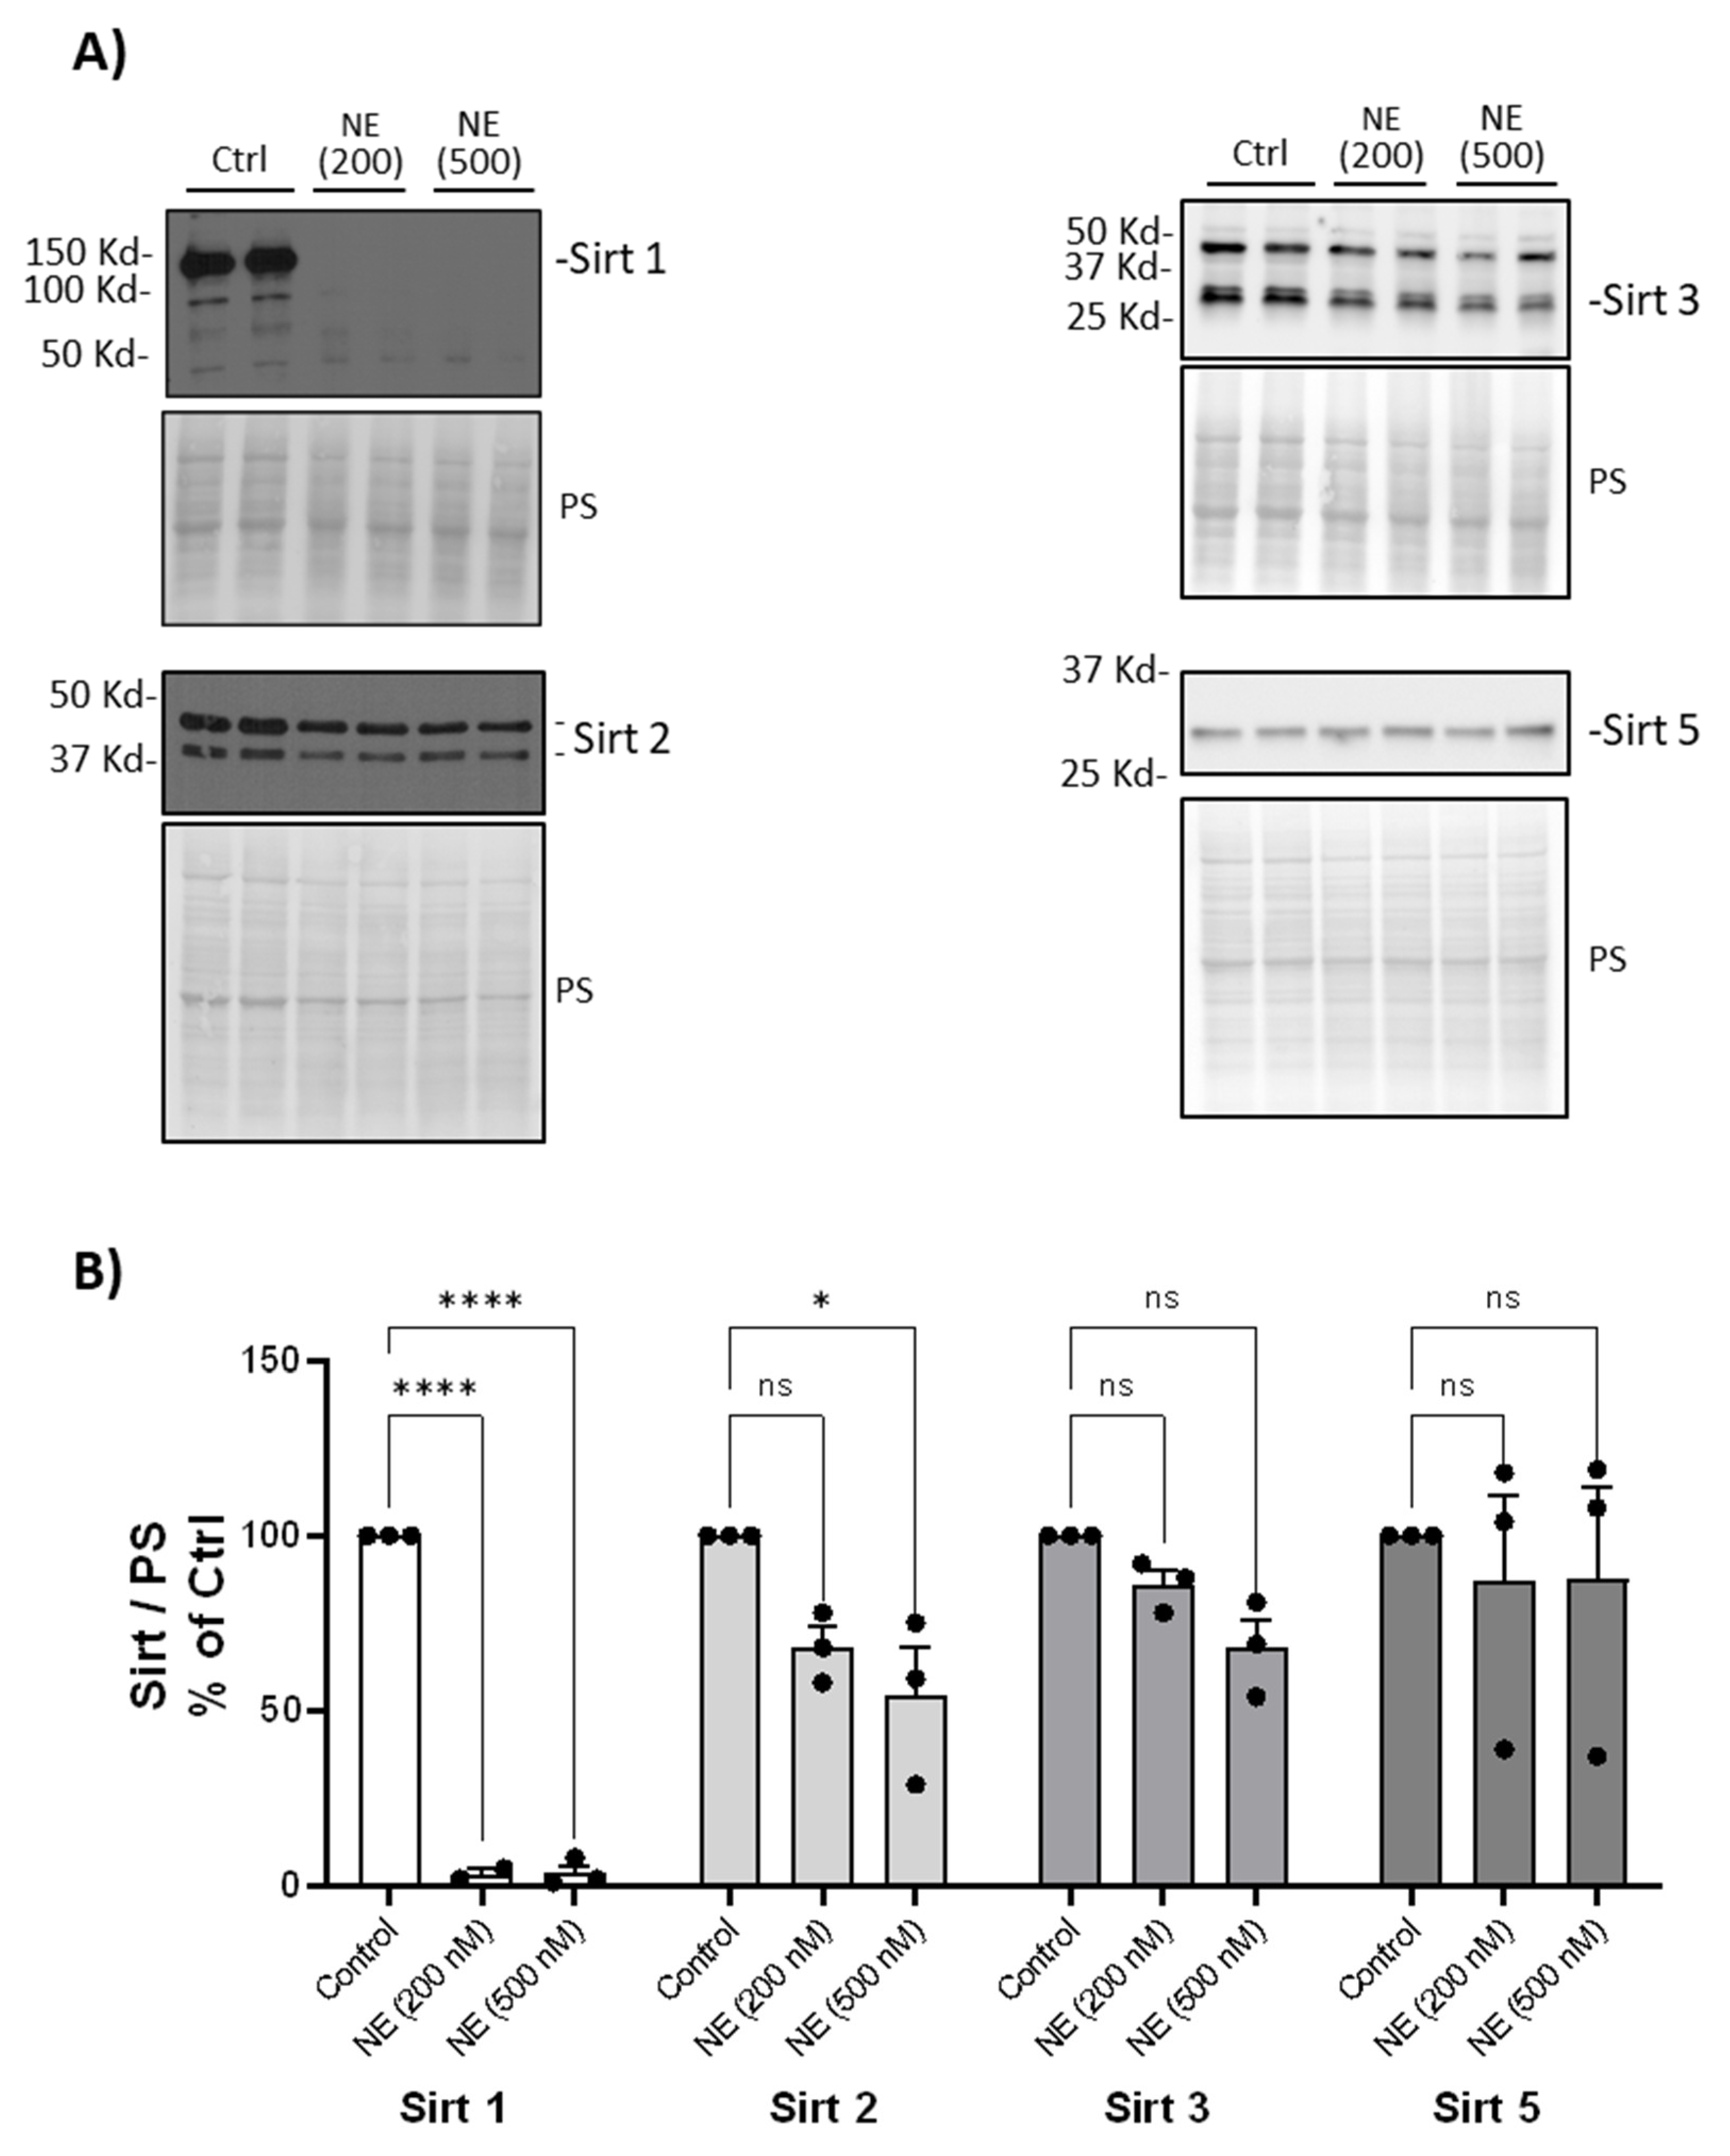
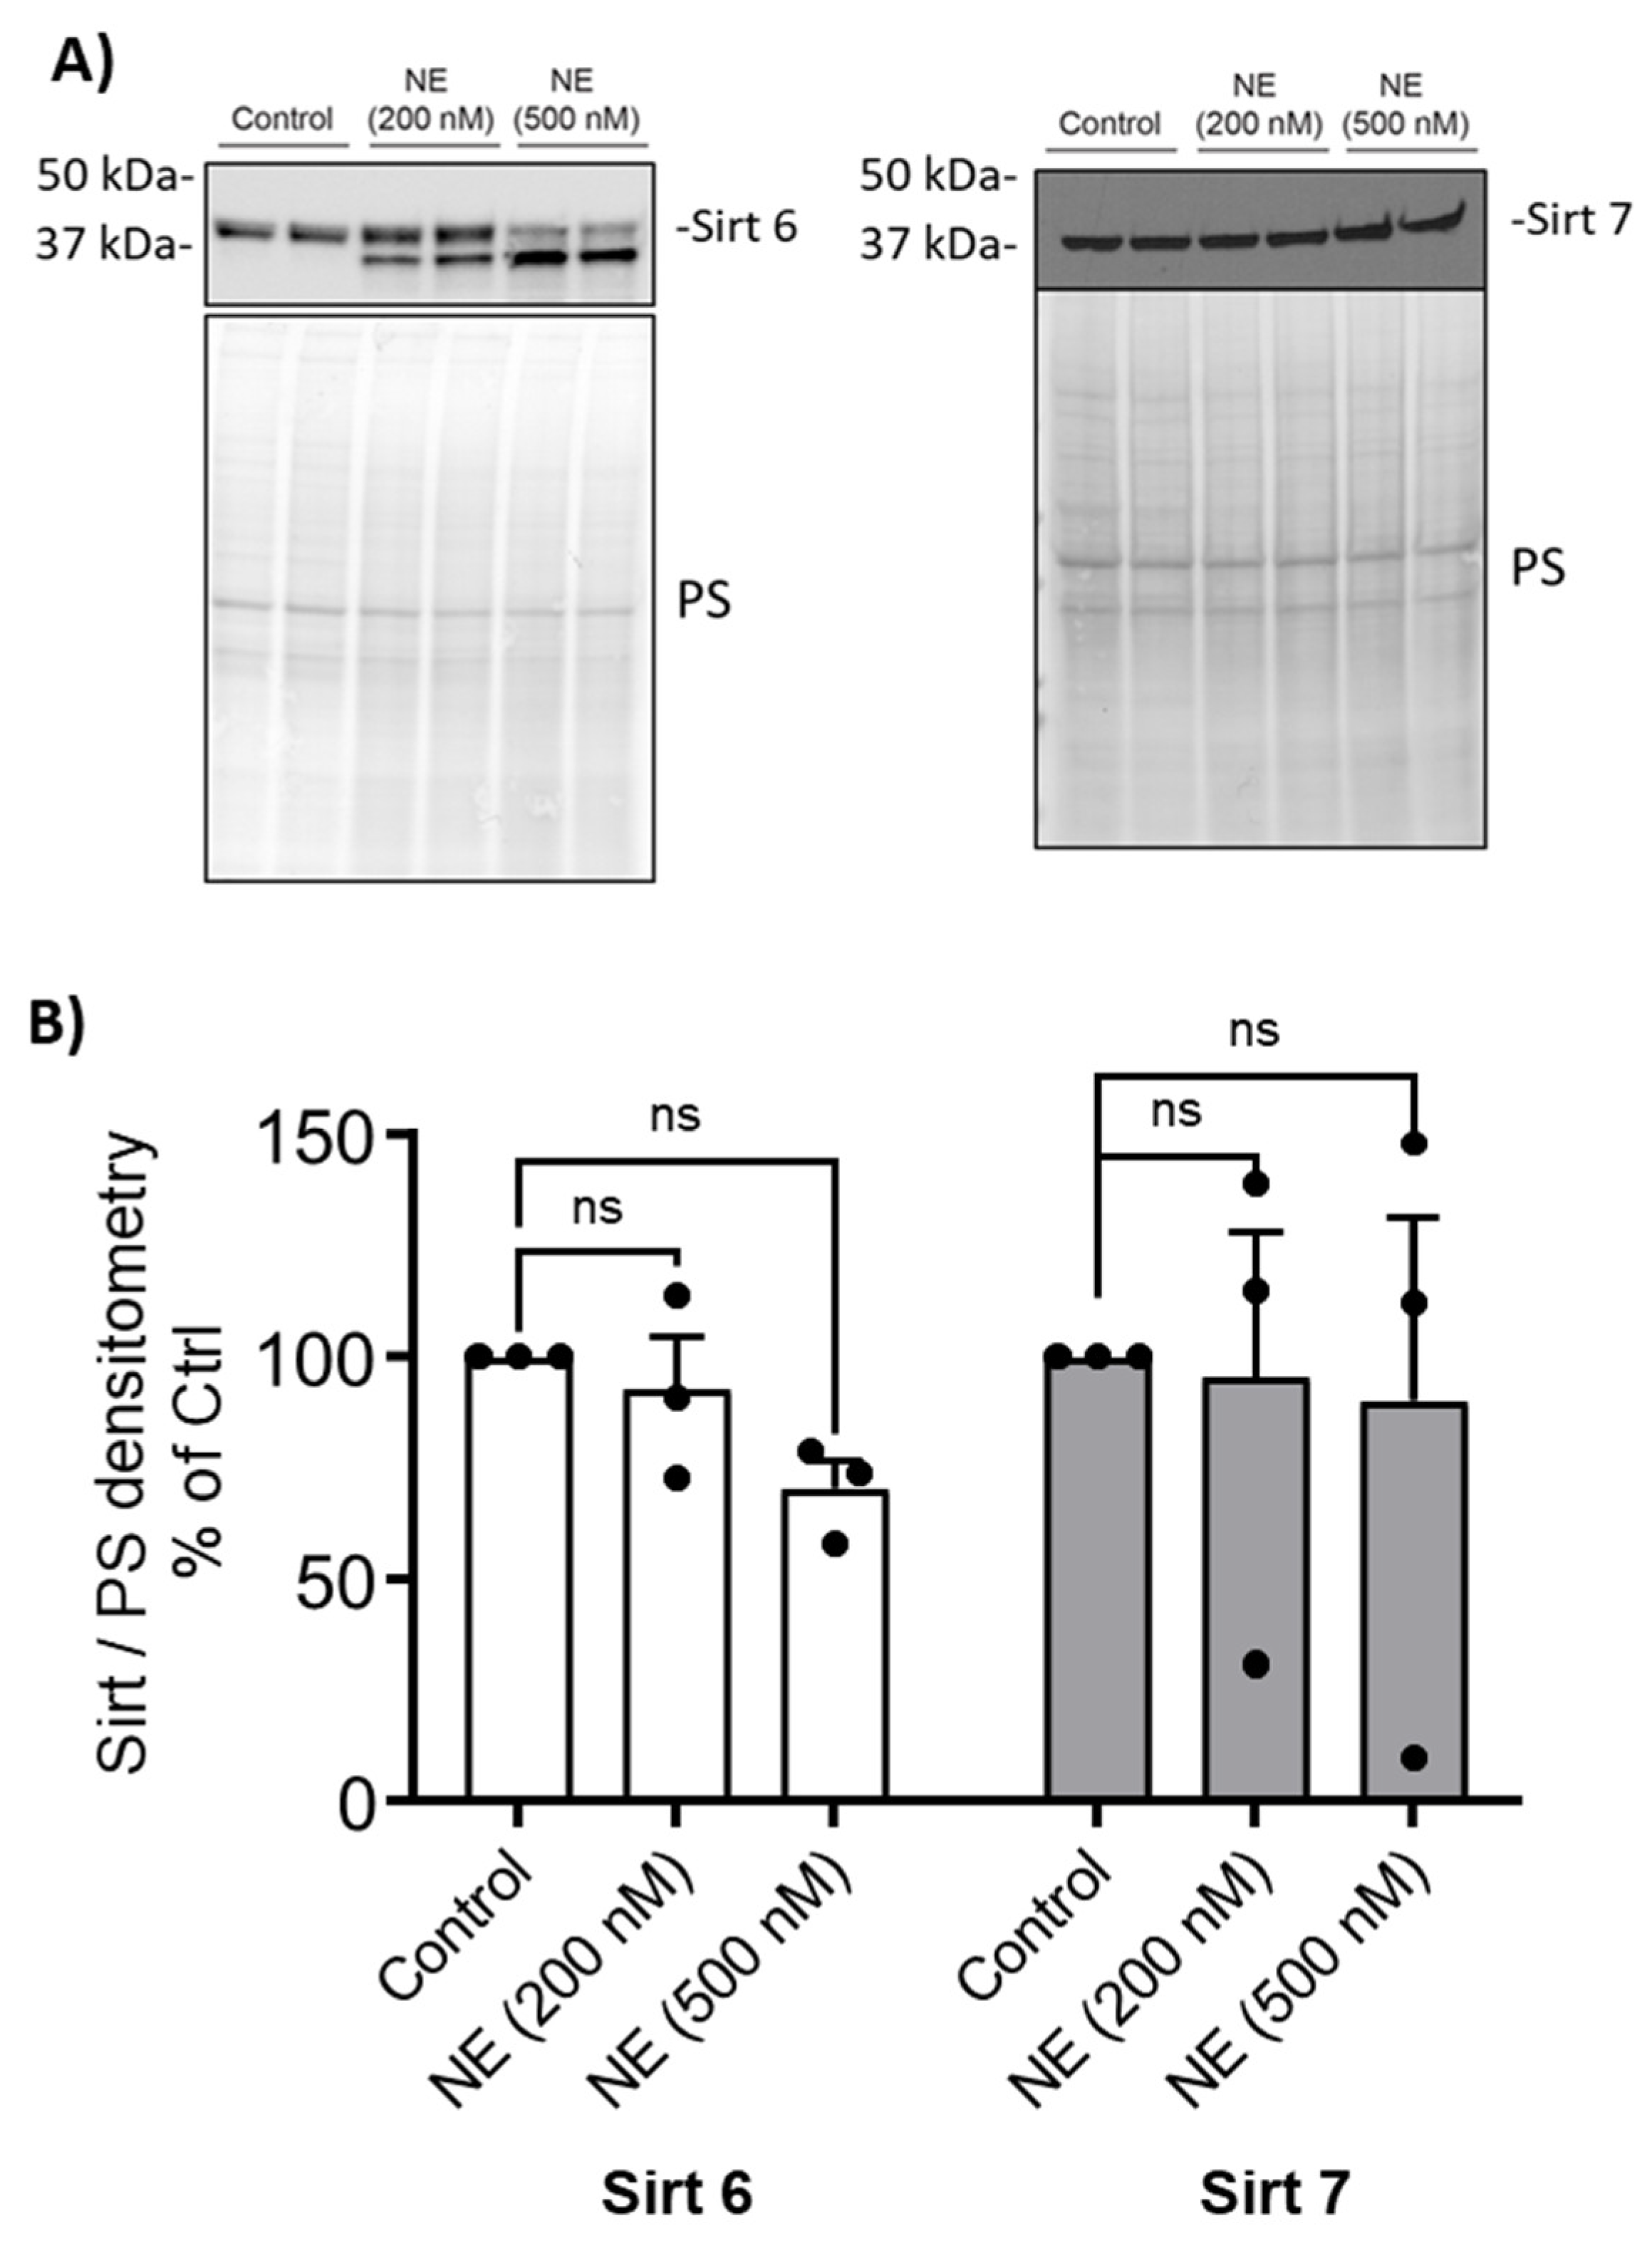
Figure 3). NE (200nM and 500nM, 2h) decreased Sirtuin 1 but had no significant effect on Sirtuins 2, 3 or 5 (
Figure 4). Sirtuin 6 was degraded by NE (200nM and 500nM, 2h) resulting in a decrease in the full-length enzyme, but there was no significant NE effect on Sirtuin 7 (
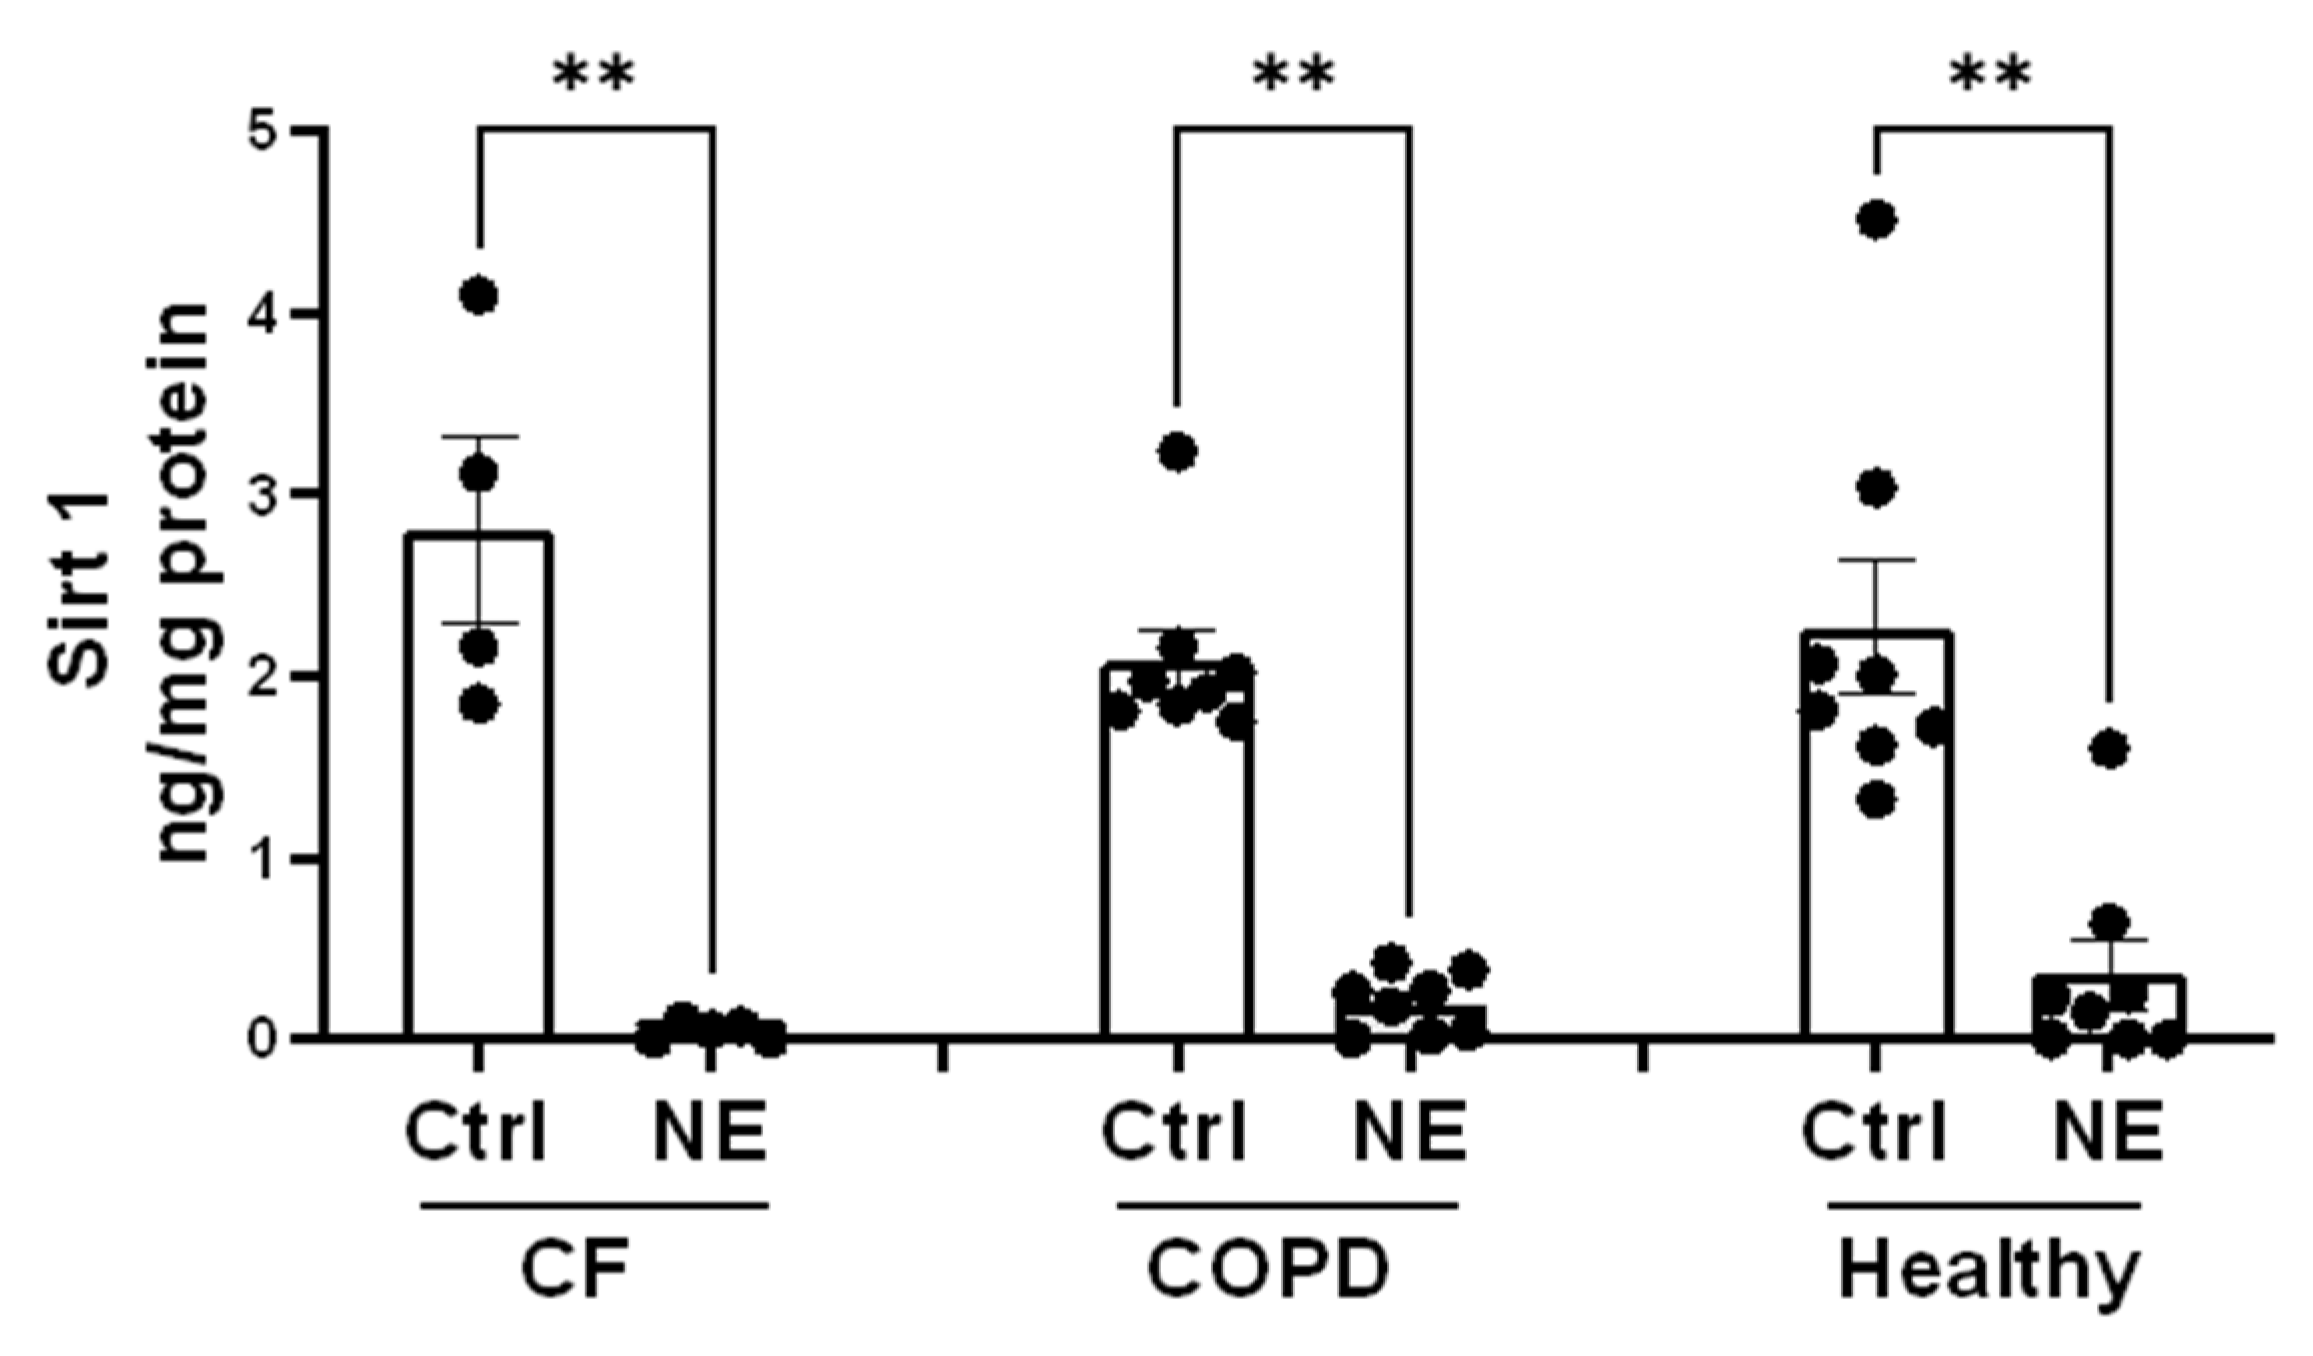
Figure 5). Similarly, NE (200nM, 2h) decreased Sirt1 in BMDM from patients with CF and COPD (
Figure 6).
Figure 1.
Neutrophil Elastase degraded Class I HDACs.
(A) Human BMDM were treated with either control vehicle (Ctrl) or NE (200nM and 500nM) for 2h. Nuclear extracts were separated using SDS-PAGE. Western blotting was performed using antibodies against HDAC1, HDAC2, and HDAC3. Antibodies and dilutions used for Western blot were listed in
Table 1.
(B) Band intensities were quantified using Image J (Bio-Rad). Relative Class I HDAC expression was first normalized to total Ponceau S (PS) staining, and then normalized to control treated cells; n=4 donors with 2 replicates averaged per treatment condition. Data (mean ± SEM) were analyzed by Prism using one-way, nonparametric ANOVA (Kruskal-Wallis) test, followed by Dunn’s multiple comparison. *, p<0.05; **, p< 0.01; ns, not significant.
Table 1.
Antibodies and dilutions used for Western Analysis.
Table 1.
Antibodies and dilutions used for Western Analysis.
| Target |
Antibody (dilution) |
Target |
Antibody (dilution) |
| HDAC1 |
sc-81598(1:1000) |
HDAC10 |
sc-393417(1:500) |
| HDAC2 |
CST #5113s(1:1000) |
HDAC11 |
sc-390737(1:500) |
| HDAC3 |
CST #3949s (1:1000) |
Sirt 1 |
CST 9475T(1:1000) |
| HDAC4 |
sc-46672(1:500) |
Sirt 2 |
CST 12650(1:1000) |
| HDAC5 |
sc-133106(1:500) |
Sirt 3 |
CST 5490(1:1000) |
| HDAC6 |
CST #7558s(1:2000) |
Sirt 5 |
CST 8782(1:1000) |
| HDAC7 |
sc-74563(1:500) |
Sirt 6 |
CST 12486(1:1000) |
| HDAC8 |
sc-374180(1:500) |
Sirt 7 |
CST 5360(1:1000) |
| Β-actin |
Sigma A5441(1:8000) |
HMGB1 |
sc-56698(1:1000) |
| Mouse IgG, HRP |
NXA931(1:10000) |
rabbit IgG, HRP |
CST 7074(1:2000) |
Figure 2.
Neutrophil Elastase degraded Class II and IV HDACs. (A) Human BMDM were treated with either control vehicle (Ctrl) or NE (200nM and 500nM) for 2h. Total cell lysates were separated using SDS-PAGE. Western blotting was performed using antibodies against HDAC4, HDAC5, HDAC6, HDAC7, HDAC8, HDAC10, HDAC11. (B) Band intensities were quantified using Image J (Bio-Rad). Relative Class II and IV HDAC expression was first normalized to total Ponceau S (PS) staining, and then normalized to control treated cells; n=3 donors with 2 replicates averaged per treatment condition. Data (mean ± SEM) were analyzed by Prism using one-way, nonparametric ANOVA (Kruskal-Wallis) test, followed by Dunn’s multiple comparison. **, p< 0.01; ****, p<0.0001; ns, not significant.
Figure 3.
Neutrophil Elastase degraded HDAC4 and HDAC5 in BMDM from patients with CF and COPD. Human BMDM from CF (A) or COPD (B) were treated with either control vehicle (Ctrl) or NE (200nM) for 2h. Total cell lysates were separated using SDS-PAGE. Western blotting was performed using antibodies against HDAC4 and HDAC5. (C, D) Band intensities were quantified using Image J (Bio-Rad). Relative HDAC4 or HDAC5 expression was first normalized to total Ponceau S (PS) staining, and then normalized to control treated cells; n=7 donors. Data (mean ± SEM) were analyzed by Prism using one-way, nonparametric ANOVA (Kruskal-Wallis) test, followed by Dunn’s multiple comparison. *, p<0.05; **, p< 0.01; ***, p<0.001.
Figure 4.
Neutrophil Elastase degraded Sirt1. (A) Human BMDM were cultured and treated with either control vehicle or NE (200nM and 500nM) for 2h. Total cell lysates were separated using SDS-PAGE. Western blotting was performed using antibodies against Sirt 1, Sirt2, Sirt3, and Sirt 5. (B) Band intensities were quantified using Image J (Bio-Rad). Relative Sirt expression was first normalized to total Ponceau S (PS) staining, and then normalized to control treated cells; n=3 donors with 2 replicates averaged per treatment condition. Data (mean ± SEM) were analyzed by Prism using one-way, nonparametric ANOVA (Kruskal-Wallis) test, followed by Dunn’s multiple comparison. *, p< 0.05; ****, p<0.0001; ns, not significant.
Figure 5.
Neutrophil Elastase degraded Sirt6. (A) Human BMDM were cultured and treated with either control vehicle or NE (200nM and 500nM) for 2h. Nuclear extracts were separated using SDS-PAGE. Western blotting was performed using antibodies against Sirt 6, and Sirt 7. (B) Band intensities were quantified using ImageLab (Bio-Rad). Relative Sirt expression was first normalized to total Ponceau S (PS) staining, and then normalized to control treated cells; n=3 donors with 2 replicates averaged per treatment condition. Data (mean ± SEM) were analyzed by Prism using one-way, nonparametric ANOVA (Kruskal-Wallis) test, followed by Dunn’s multiple comparison. ns, not significant.
Figure 6.
Neutrophil Elastase decreased Sirt1. Total cell lysate (TCL) from Ctrl or NE (200nM, 2h) treated hBMDM from Buffy coat (healthy), patients with CF or COPD were evaluated for Sirt1 protein by ELISA (Abcam, Ab171573). Sirt1 protein level was normalized to total protein level (ng/mg protein) and presented as Mean±SEM. Heathy, n=8; CF, n=4; COPD, n=8. Statistical analysis was performed by Prism using one-way, nonparametric ANOVA (Kruskal-Wallis test), followed by Dunn’s multiple comparisons test, **, p<0.01.
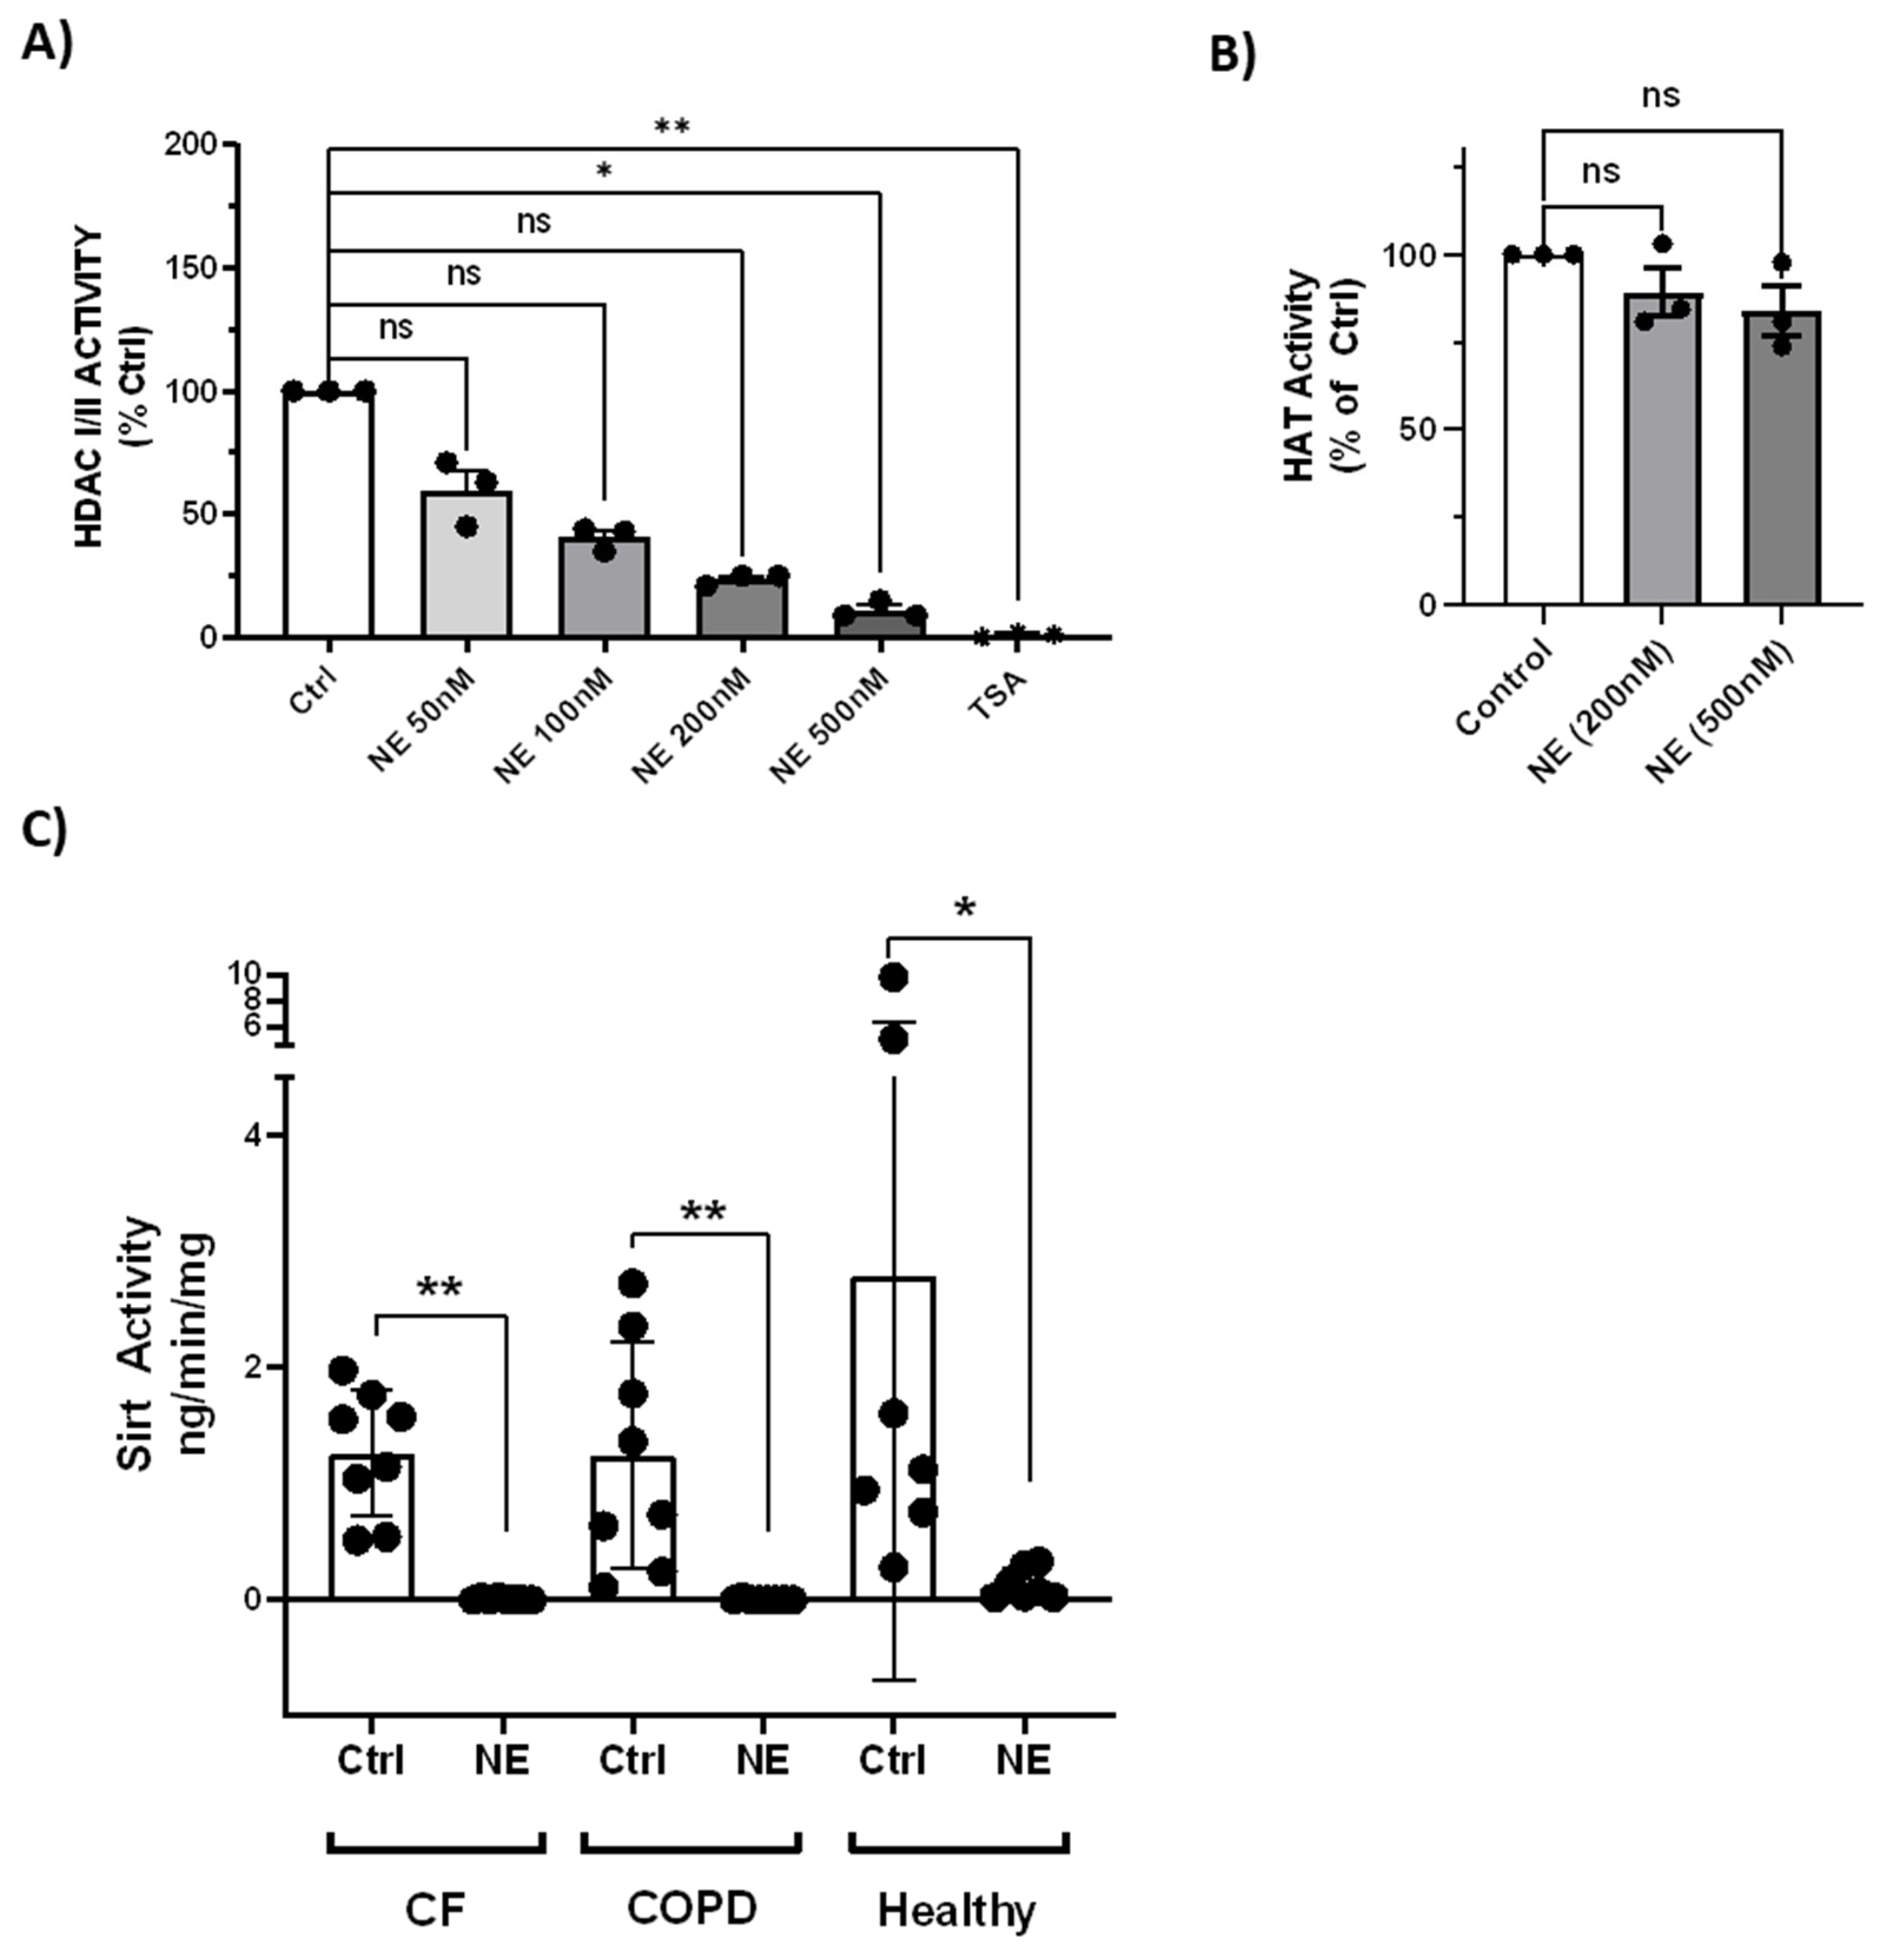
NE treatment (50nM-500nM, 2h) resulted in concentration-dependent loss of total HDAC activity by HDAC-Glo I/II kits (
Figure 7A), but did not affect total HAT activity (
Figure 7B). NE (200nM, 2h) also resulted in decrease of total Sirt activity in BMDM from healthy buffy coat donors and from patients with CF and COPD (
Figure 7C).
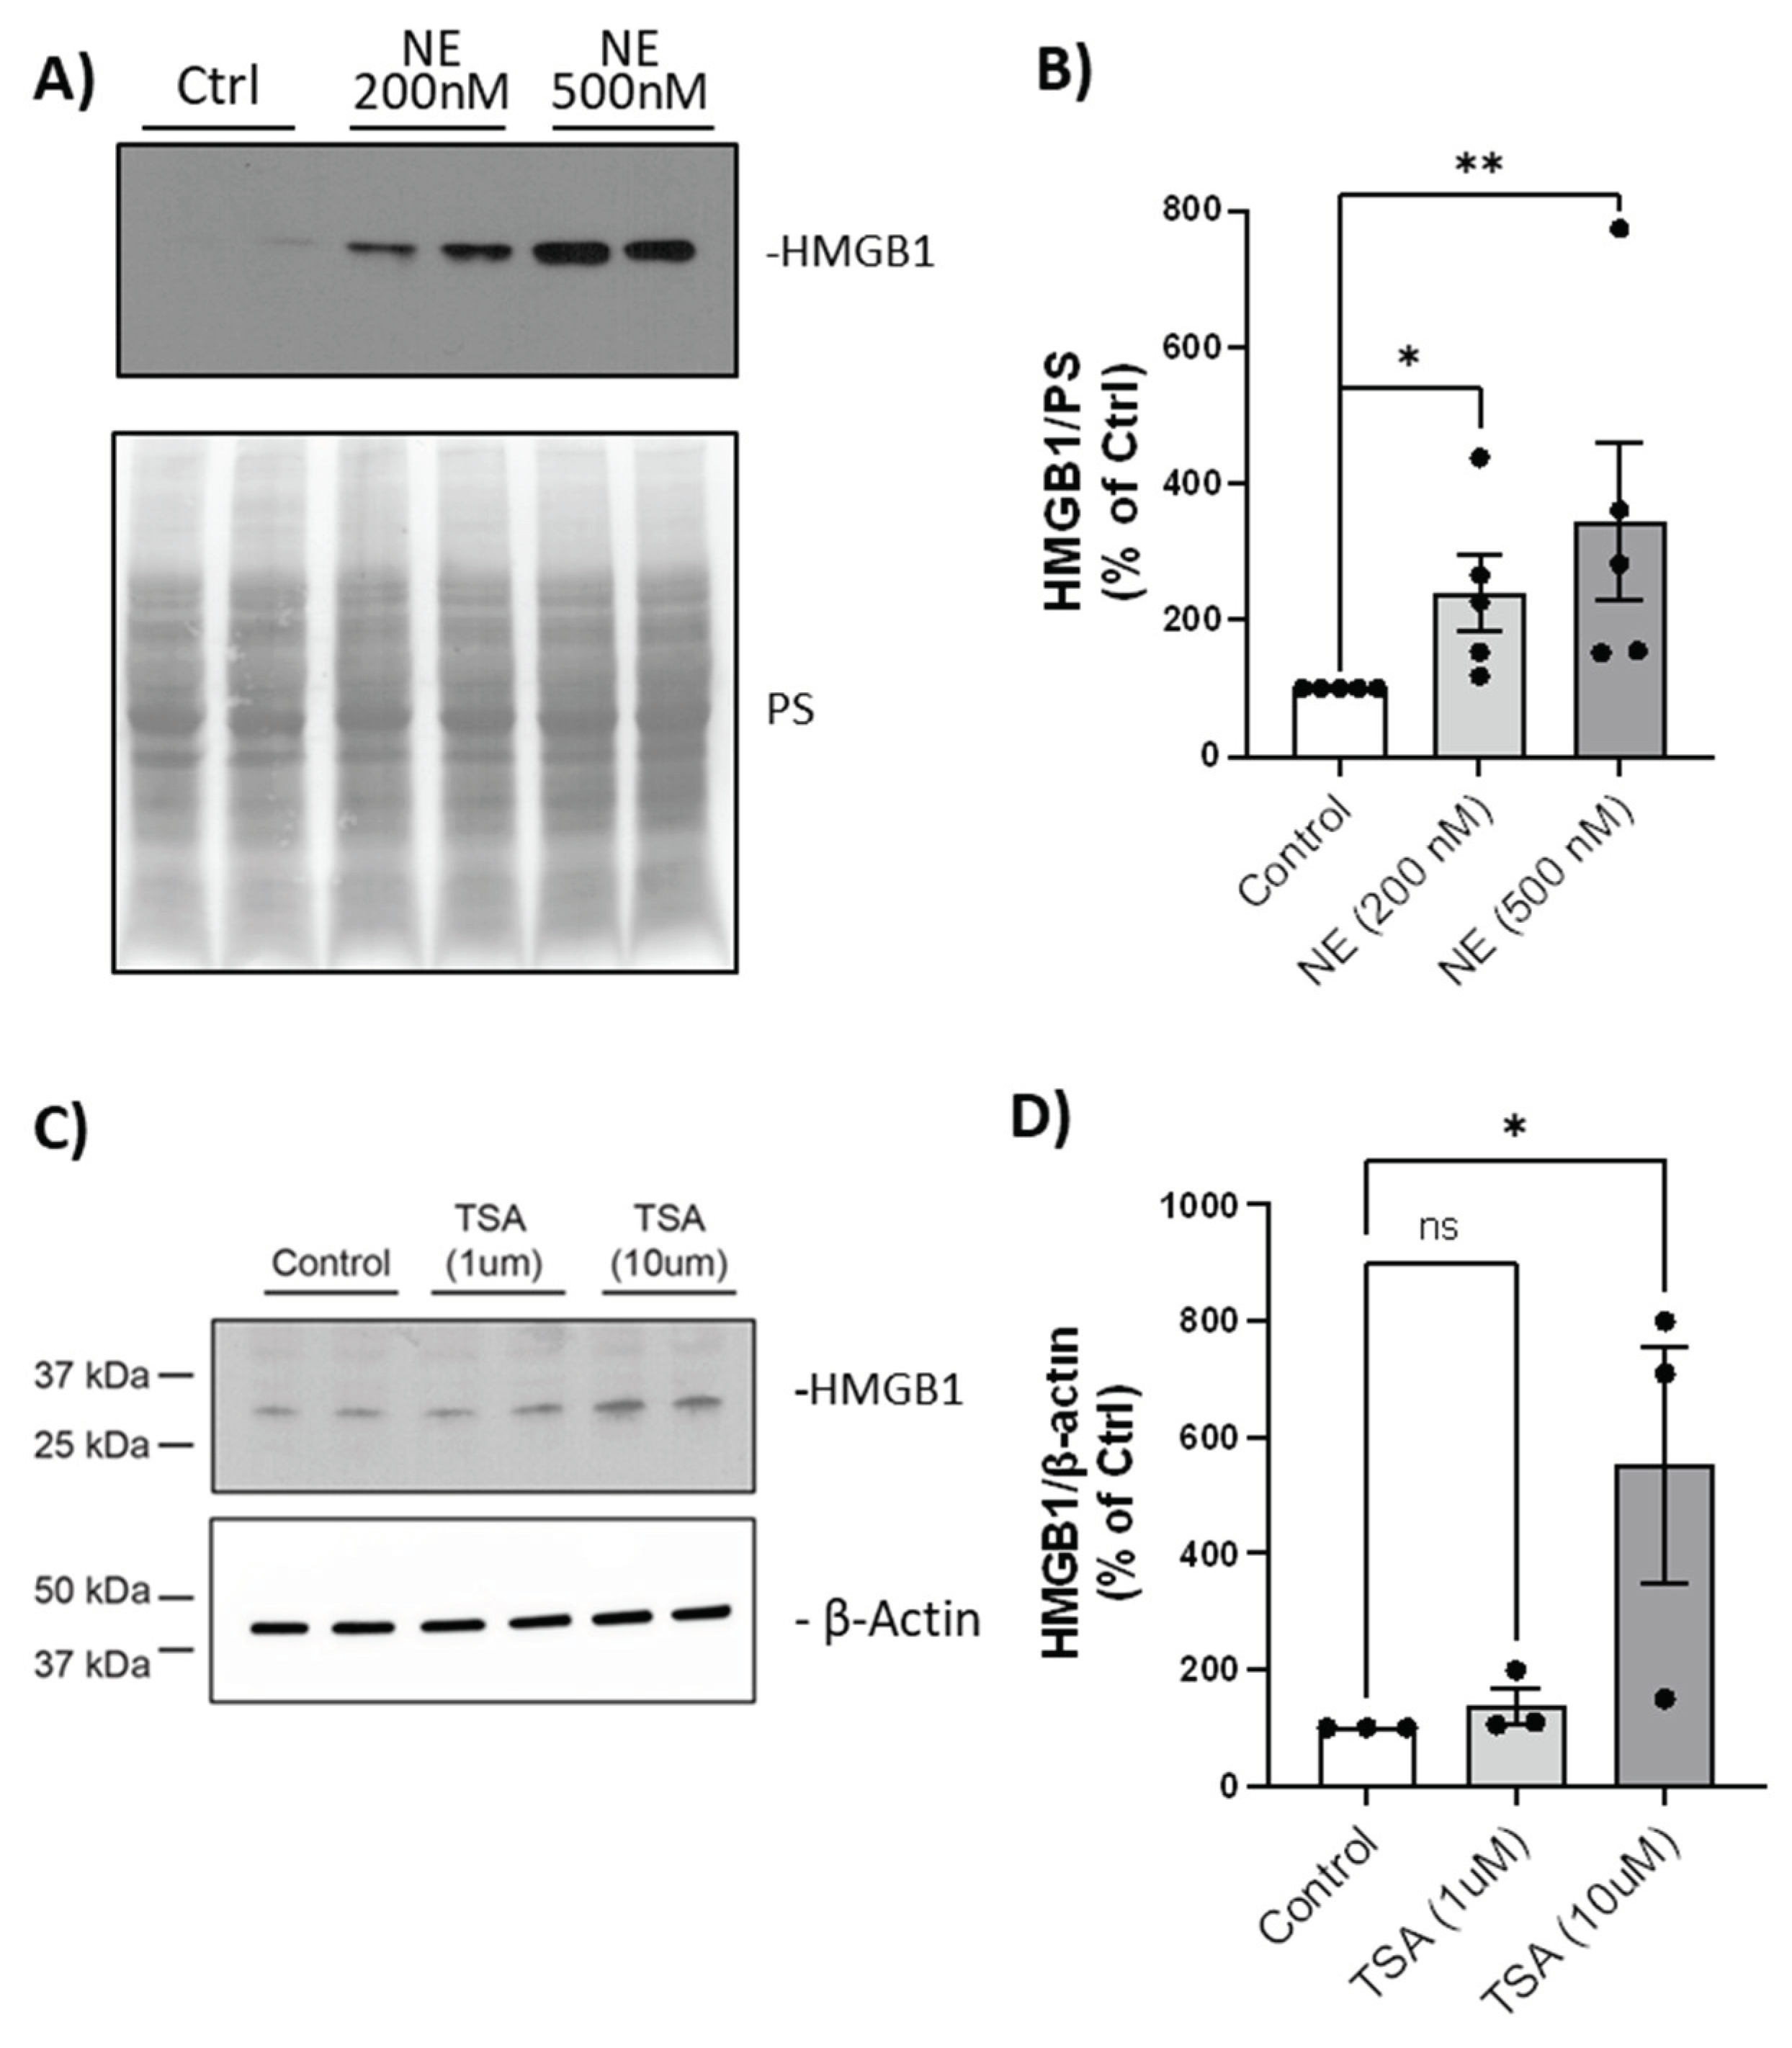
We then tested whether the loss of HDAC/Sirtuin activity resulted in HMGB1 translocation from nucleus to cytoplasm by western analysis. We demonstrated that there was a NE-induced concentration-dependent increase in HMGB1 abundance in the cytoplasm (
Figure 8A & 8B). BMDM were treated with TSA (1µM and 10µM, 24h) which also increased cytoplasmic abundance of HMGB1 in a concentration-dependent manner (
Figure 8C & 8D). These experiments are consistent with HDAC loss or inhibition, and unopposed lysine acetylation, driving nuclear to cytoplasmic translocation of HMGB1, a prerequisite condition for extracellular release of HMGB1.
3. Discussion
NE and HDAC degradation: Herein, we demonstrate that NE proteolytically degraded HDAC1 (Class I), HDAC4, 5, 6, 7, and 10 (Class II), HDAC11 (Class IV), and Sirt1 (Class III), resulting in a concentration-dependent loss of HDAC activity. NE-induced loss of HDAC activity was specific because in contrast, there was no significant change in HAT activity. Furthermore, treatment with the HDAC inhibitor, TSA, confirmed that HMGB1 nuclear to cytoplasm translocation was associated with loss of HDAC activity. We previously reported that inhibition of p300 HAT activity by 2-O, 3-O desulfated heparin, was sufficient to block NE- or LPS-induced HMGB1 release from a murine macrophage cell line, RAW264.7 [
11]. Thus, the balance of HAT and HDAC activities control HMGB1 lysine acetylation, cellular localization and function.
HDAC and HMGB1: Previous publications demonstrate the relationship between loss of HDAC activity and HMGB1 post-translational modifications and cellular fate. Ischemia and reperfusion injury, associated with loss of HDAC 1 and 4 [
12], or cerebral ischemia and reperfusion injury associated with loss of HDAC 4 and 5 [
13] were both associated with HMGB1 translocation or cellular release. In murine renal endothelial cells, following ischemia and reperfusion injury, Sirt1 inhibition is associated with lysine acetylation and cytoplasmic translocation of HMGB1; this process is rescued by introduction of recombinant Sirt1 [
14]. In HEK293T cells, the lysine-acetylation status of the HMGB1 Nuclear Localization Site 1 (NLS1) regulates the interaction with Sirt1. When HMGB1 is hypoacetylated, it interacts with Sirt1 and is sequestered in the nucleus. However, with LPS or TNFα exposure, HMGB1 nuclear localization signal 1 (NLS1) lysine residues are acetylated, shifting HMGB1 to interact with the nuclear exporter, chromosome region maintenance 1 (CRM1), and cytoplasmic localization [
15]. Thus, acetylation of several key HMGB1 lysine residues control cell localization and functional status.
Cytoplasmic accumulation of HMGB1: Cytoplasmic accumulation of HMGB1 in secretory lysosomes is a pathogenic feature of COPD, cigarette smoke extract (CSE), and ventilator induced lung injury [
16,
17,
18], and is a prerequisite for extracellular HMGB1 release. In a murine model of ventilator induced lung injury, increased cytoplasmic accumulation of HMGB1 is associated with JAK2/STAT1 activation, autophagy, apoptosis and LDH release [
18]. Treatment of macrophages with extracellular rhHMGB1 did not activate autophagy, suggesting that endogenous HMGB1 was sufficient for CSE-induced macrophage inflammation [
17].
HDACs and COPD and CF: Oxidative stress is associated with loss of HDACs in COPD and CF. HDAC2, 5, and 8 mRNA are downregulated in lung tissue of patients with COPD and both HDAC2 protein and activity are decreased in COPD lung macrophages [
8]. CSE decreases HDAC class I activity in macrophages [
19] via decreased glutathione and increased nitration modification of HDACs. CSE decreases HDAC3 in human BMDM resulting in IL8 and IL1β upregulation in conditioned media [
20]. Sirt1 protein and activity are markedly reduced in blood monocytes of patients with COPD, regardless of smoking status [
21]. HDAC2 protein and activity levels are decreased in CF human primary nasal cells and in CF human epithelial cell lines via a post-transcriptional oxidative mechanism. The loss of HDAC2 is associated with upregulation of IL-8 expression with associated H4- chromatin acetylation at the IL-8 promoter domain [
22].
Proteases and HDAC regulation: To our knowledge, our report is the first to identify that an exogenous human protease, NE, was sufficient to decrease HDAC protein levels and activity in BMDM. Importantly, the NE concentrations used are relevant to concentrations of NE reported in sputum from patients with COPD [
23] or CF [
24].
In addition to NE, there are several reports of viral proteinases or viral-regulated host caspases that degrade HDACs resulting in altered innate immune function. SARS CoV2 and Porcine deltacoronavirus proteinase, Nsp5, cleave class 1 HDACs resulting in loss of HDAC activity and failure of interferon- stimulated gene expression, an anti-viral immune mechanism [
25,
26]. Lysosomal caspase 3, activated by Influenza A, degrades HDAC6 [
27] resulting in increased viral protein transcription. Lysosomal caspase 3 also degrades HDAC4, resulting in diminished innate immune function [
28]. Under conditions of cellular stress or transformation, activated caspase 3 cleaves HDACs and Sirt1 during apoptosis [
29,
30,
31], autophagy and senescence [
32,
33]. Thus, proteases regulate HDAC expression and function. Importantly, we demonstrate that NE plays a critical role in the balance of HDACs and HATs resulting in activation of HMGB1 in BMDM.
4. Materials and Methods
Buffy Coat processing using double density gradients for human peripheral blood monocyte derived macrophages (BMDM) cultures
Buffy coats from deidentified healthy donors (American Red Cross) were diluted in RPMI 1640 medium (1:3) and layered onto Lymphopure (15 ml, Biolegend, #426202) in a 50 ml conical tube. After centrifugation at 1000g, 15 minutes with brake off, the intermediate cloudy layer was collected, washed, and incubated with red blood cell lysis buffer to obtain peripheral blood mononuclear cells (PBMC). PBMC (50-70M cells/ml; up to 200M cells) were layered onto a second gradient (10 ml of Percoll gradient solution: 23.5 ml Percoll, 5 ml 1.6M NaCl, 21.5 ml H
2O at 1.0661 density [
34]) in a 15 ml conical tube and centrifuged at 600g for 15 min with brake off. The intermediate cloudy monocyte layer, was collected, washed and counted. Monocytes were seeded on 10cm tissue culture plates (37°C, 1 h). Unattached cells were removed by aspiration. Attached monocytes were cultured in RPMI growth media (500 ml RPMI 1640 medium, 10% fetal bovine serum (FBS; Life technologies), 1:100 L-Glutamine, 1:100 Pen/Strep, 1M HEPES (1.25 ml)) and GM-CSF (20 ng/ml, Biolegend, Cat# 572903) for 8-10 days, with media change every other day. BMDM isolated by double density gradients and differentiated by GM-CSF in RPMI media were used for treatment and to collect total cell lysate (TCL) or cytoplasmic and nuclear extracts for HDAC and Sirtuin western analyses and HAT activity assay. We confirmed purity of the BMDM by Flow cytometry using CD11b and CD68, and by cell morphology (cytospin followed by Dif-Quick staining of the cells). GM-CSF differentiation generates BMDM with cell surface receptors expressed by alveolar macrophages (AMs) [
35].
Monocyte Enrichment via Rosette-Sep using Buffy Coat and patient whole blood
Whole blood samples from patients with CF and COPD, or buffy coat samples (diluted 1:2 with PBS dilution buffer (PBS+ 2% FBS+ 1mM EDTA)) were processed using Rosette-Sep human monocyte enrichment cocktail (Stem Cell Technologies, #15068) following manufacture’s instruction. Monocytes were cultured in suspension for 7 days in RPMI growth medium with GM-CSF (20 ng/ml) to differentiate to macrophages. We confirmed purity of BMDM using CD11b and CD68. Macrophages from buffy coat were seeded on 96 well plate (white wall, transparent bottom) for additional 2-3 days for HDAC activity assay. Macrophages from patients with CF or COPD were seeded in 12 well plate for NE treatment and TCL collection.
Treatments of BMDM with NE and Trichostatin A (TSA); Total cell lysate collection and Cell fractionation
BMDM were stimulated with NE (Elastin Products, SE563) in serum- free media for 2h. At the end of NE treatment, NE specific inhibitor, N-(Methoxysuccinyl)-Ala-Ala-Pro-Val-chloromethyl ketone (AAPV-CMK, Sigma, M0398, final concentration 10µM) were added to stop NE activity. TCL were prepared in lysis buffer (CST #9803) containing protease and phosphatase inhibitors (Sigma, P8340, P5726) for HDAC/ Sirtuin westerns. Nuclear and cytoplasmic extracts were prepared using a nuclear extract kit (Active Motif, # 40010) following manufacturer’s instructions, except that DTT was omitted for enzyme activity assays. BMDM were treated with TSA, a global HDAC inhibitor, (Sigma, T1952) in media with serum for 24h to collect cytoplasmic extracts for HMGB1 westerns [
36].
Western Blotting and Antibodies
TCL, nuclear extracts, or cytoplasmic extracts (25µg) were separated by 4-20% SDS PAGE (BioRad, 4561094) and transferred to nitrocellulose membrane (BioRad, #1620112). The membrane was stained with Ponceau S (Sigma, P7170) and image was scanned. Membrane was then washed and used for western analysis. Antibodies and dilutions are listed in
Table 1. Westerns were developed by SuperSignal™ West Pico PLUS Chemiluminescent Substrate (ThermoFisher, #34579) and band density determined by Image J (NIH). Band density was normalized to Ponceau S staining for each lane, a measure of total protein quantitation. The normalized data from NE treated cells was then compared to control vehicle-treated cells from the same individual and expressed as percentage of control.
HDAC Activity assays
Macrophages seeded on 96 well plate were treated with NE (50-500nM), TSA (1µM), or control vehicle for 2h. At the end treatment, AAPV-CMK were added to stop NE activity and cells were incubated with HDAC-Glo kit reagent mixture per manufacturer’s instructions (Promega G6420 HDAC-Glo I/II assay) and luminescence was read using the SPARK plate reader (TECAN).
HAT Activity assay
Nuclear extract (45 µg) was used for HAT activity using HAT Assay kit (BioVision, K334-100) per manufacturer’s instructions, using the SPARK plate reader.
Sirt 1 ELISA
TCL from Ctrl or NE (200nM, 2h) treated hBMDM from Buffy coat (healthy), patients with CF or COPD were first diluted 5 time in Cell Extraction Buffer and then evaluated for Sirt1 protein by ELISA (Abcam, Ab171573). Sirt1 protein level was normalized to total protein in each reaction and results were presented as ng/mg protein.
Sirt Activity assay
TCL from Ctrl or NE (200nM, 2h) treated hBMDM from Buffy coat (healthy), patients with CF or COPD were evaluated for Sirt activity (Abcam, Ab1156915). 4µl of sample was used for each reaction and Sirt activity was expressed as ng/min/mg total protein.
