Submitted:
07 March 2024
Posted:
08 March 2024
You are already at the latest version
Abstract
Keywords:
1. Introduction
2. Materials and Methods
2.1. Strain, Growth Media, and Culture Conditions
2.2. The LAB Species Identification
2.3. In Vitro Assessment of Acid Tolerance of L. plantarum AC11S.
2.4. Analytical Procedures
2.5. Fermentation
2.6. Modeling
3. Results
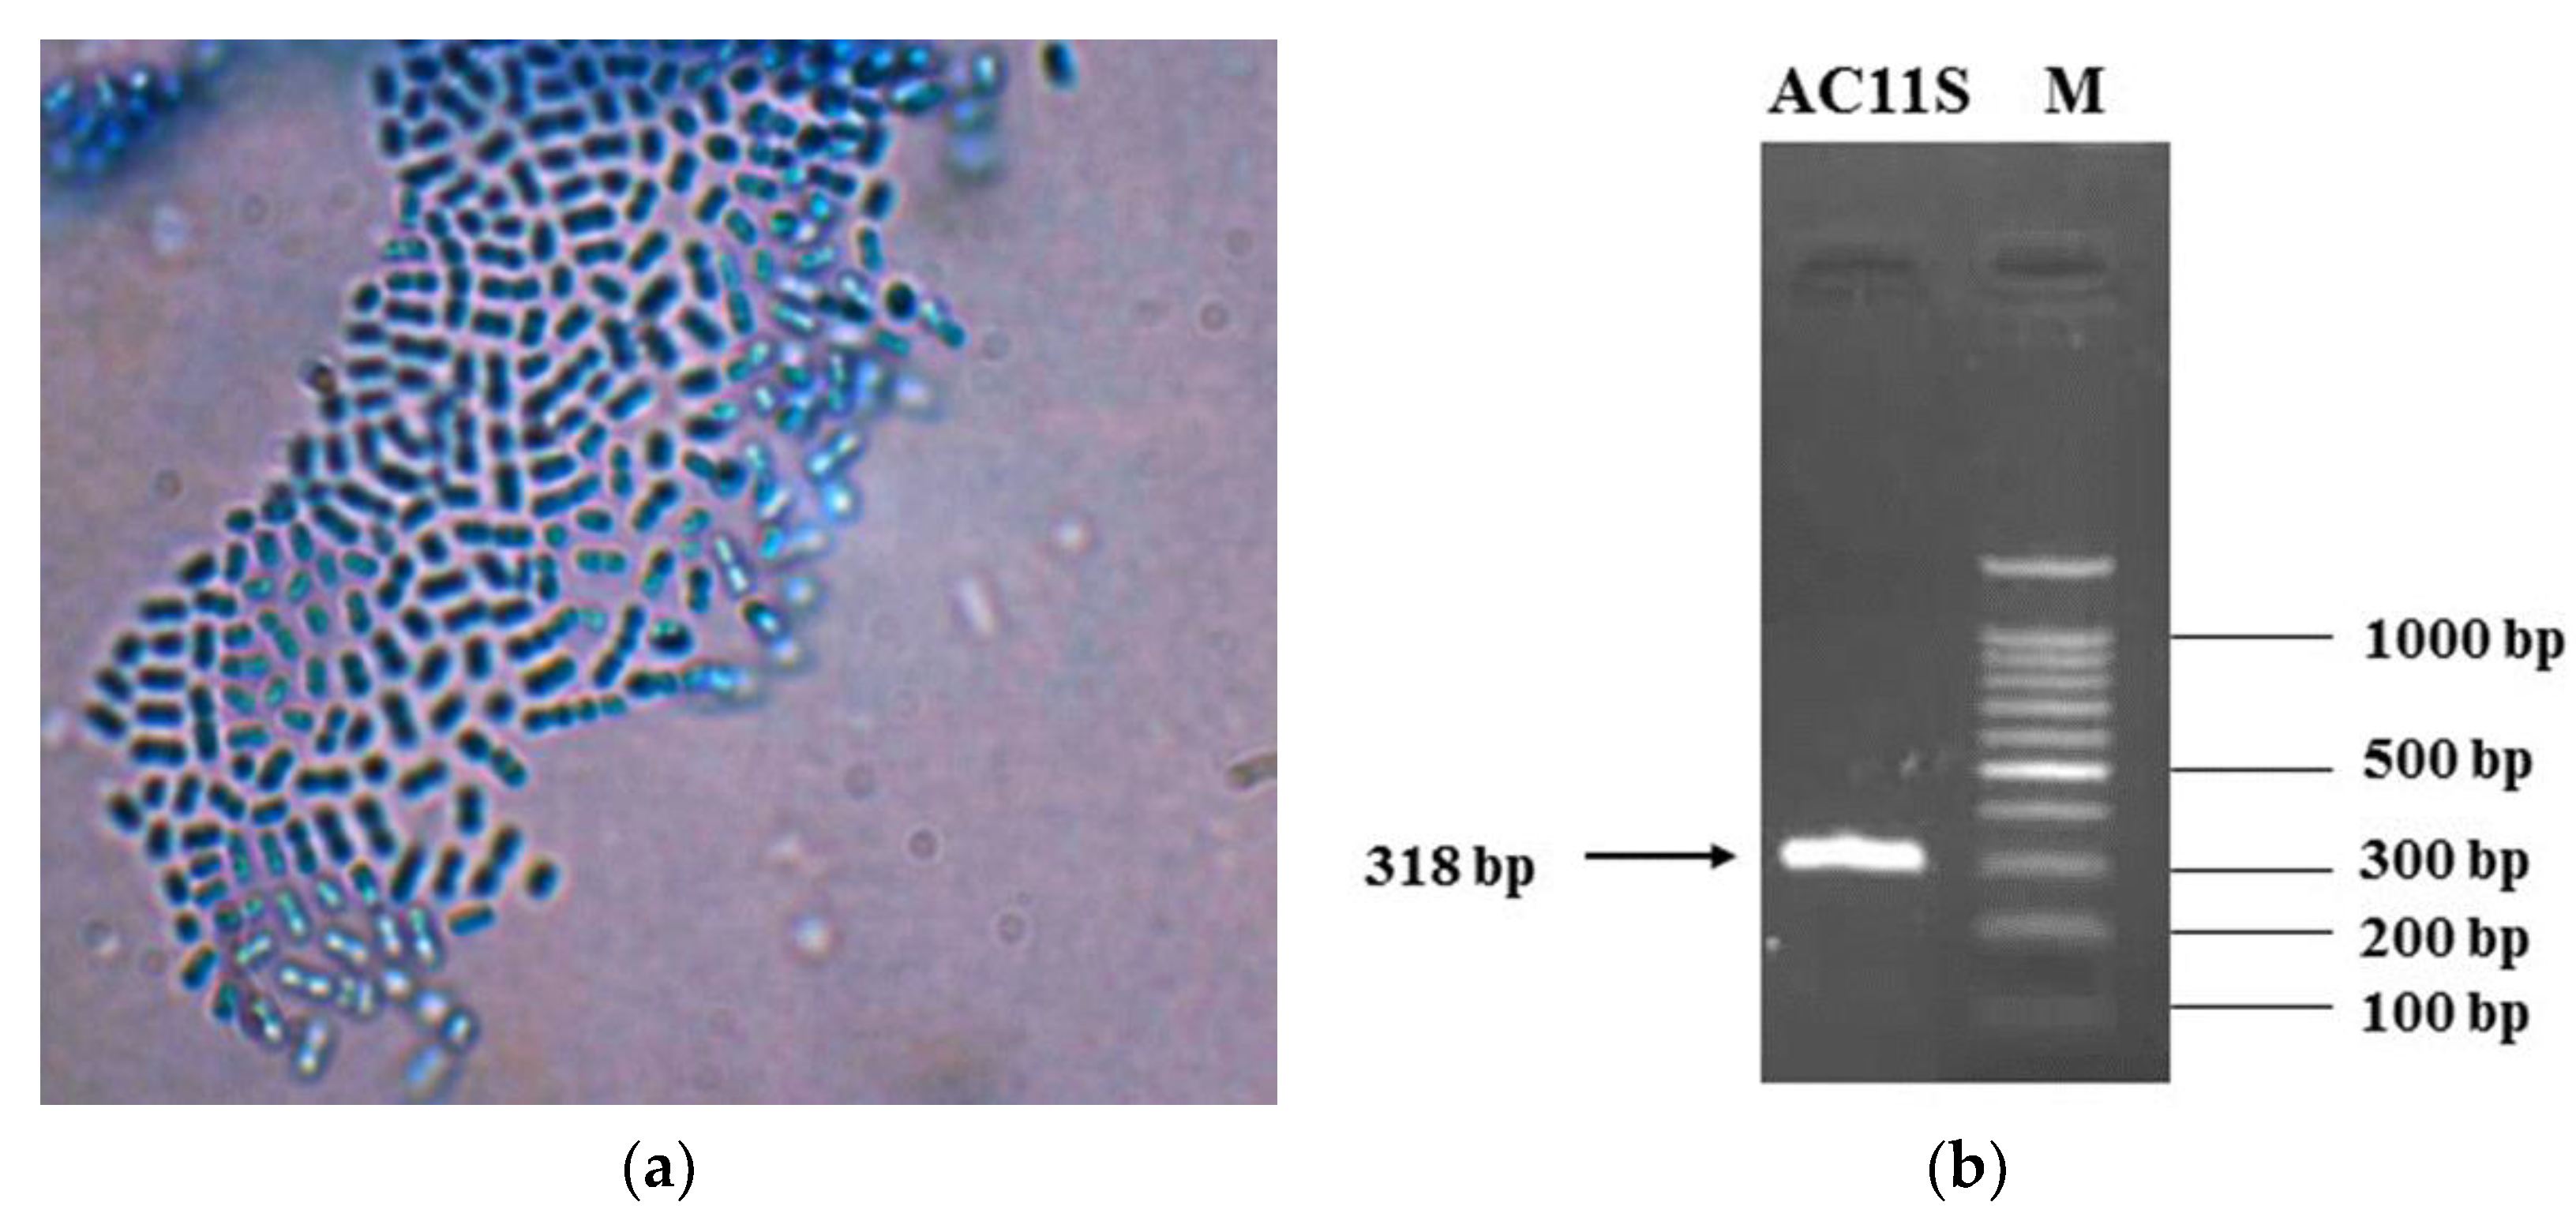
3.1. Isolation and Identification of Lactiplantibacillus plantarum AC 11S
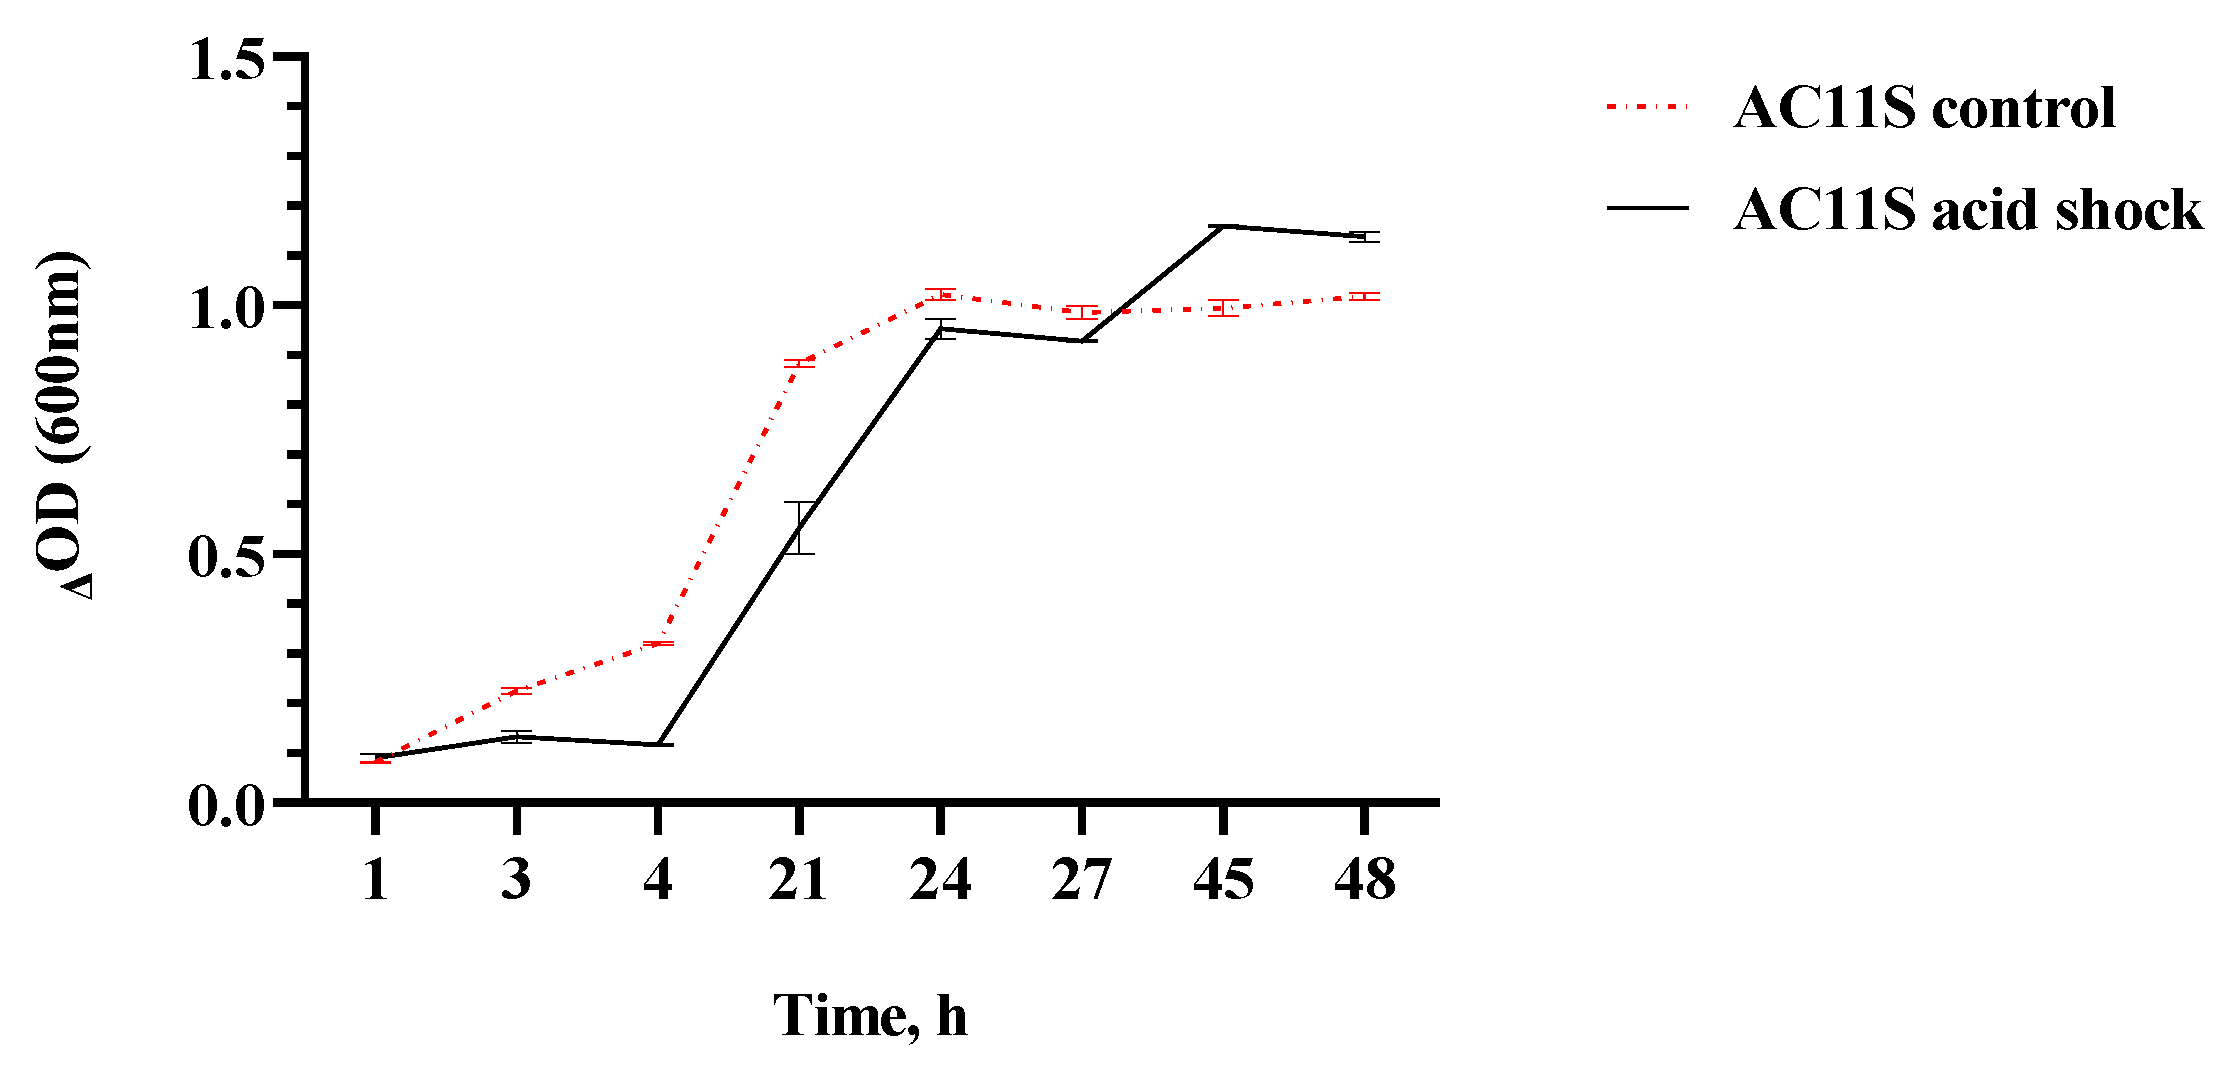
3.2. Viability of L. plantarum AC 11S in an Acidic Environment
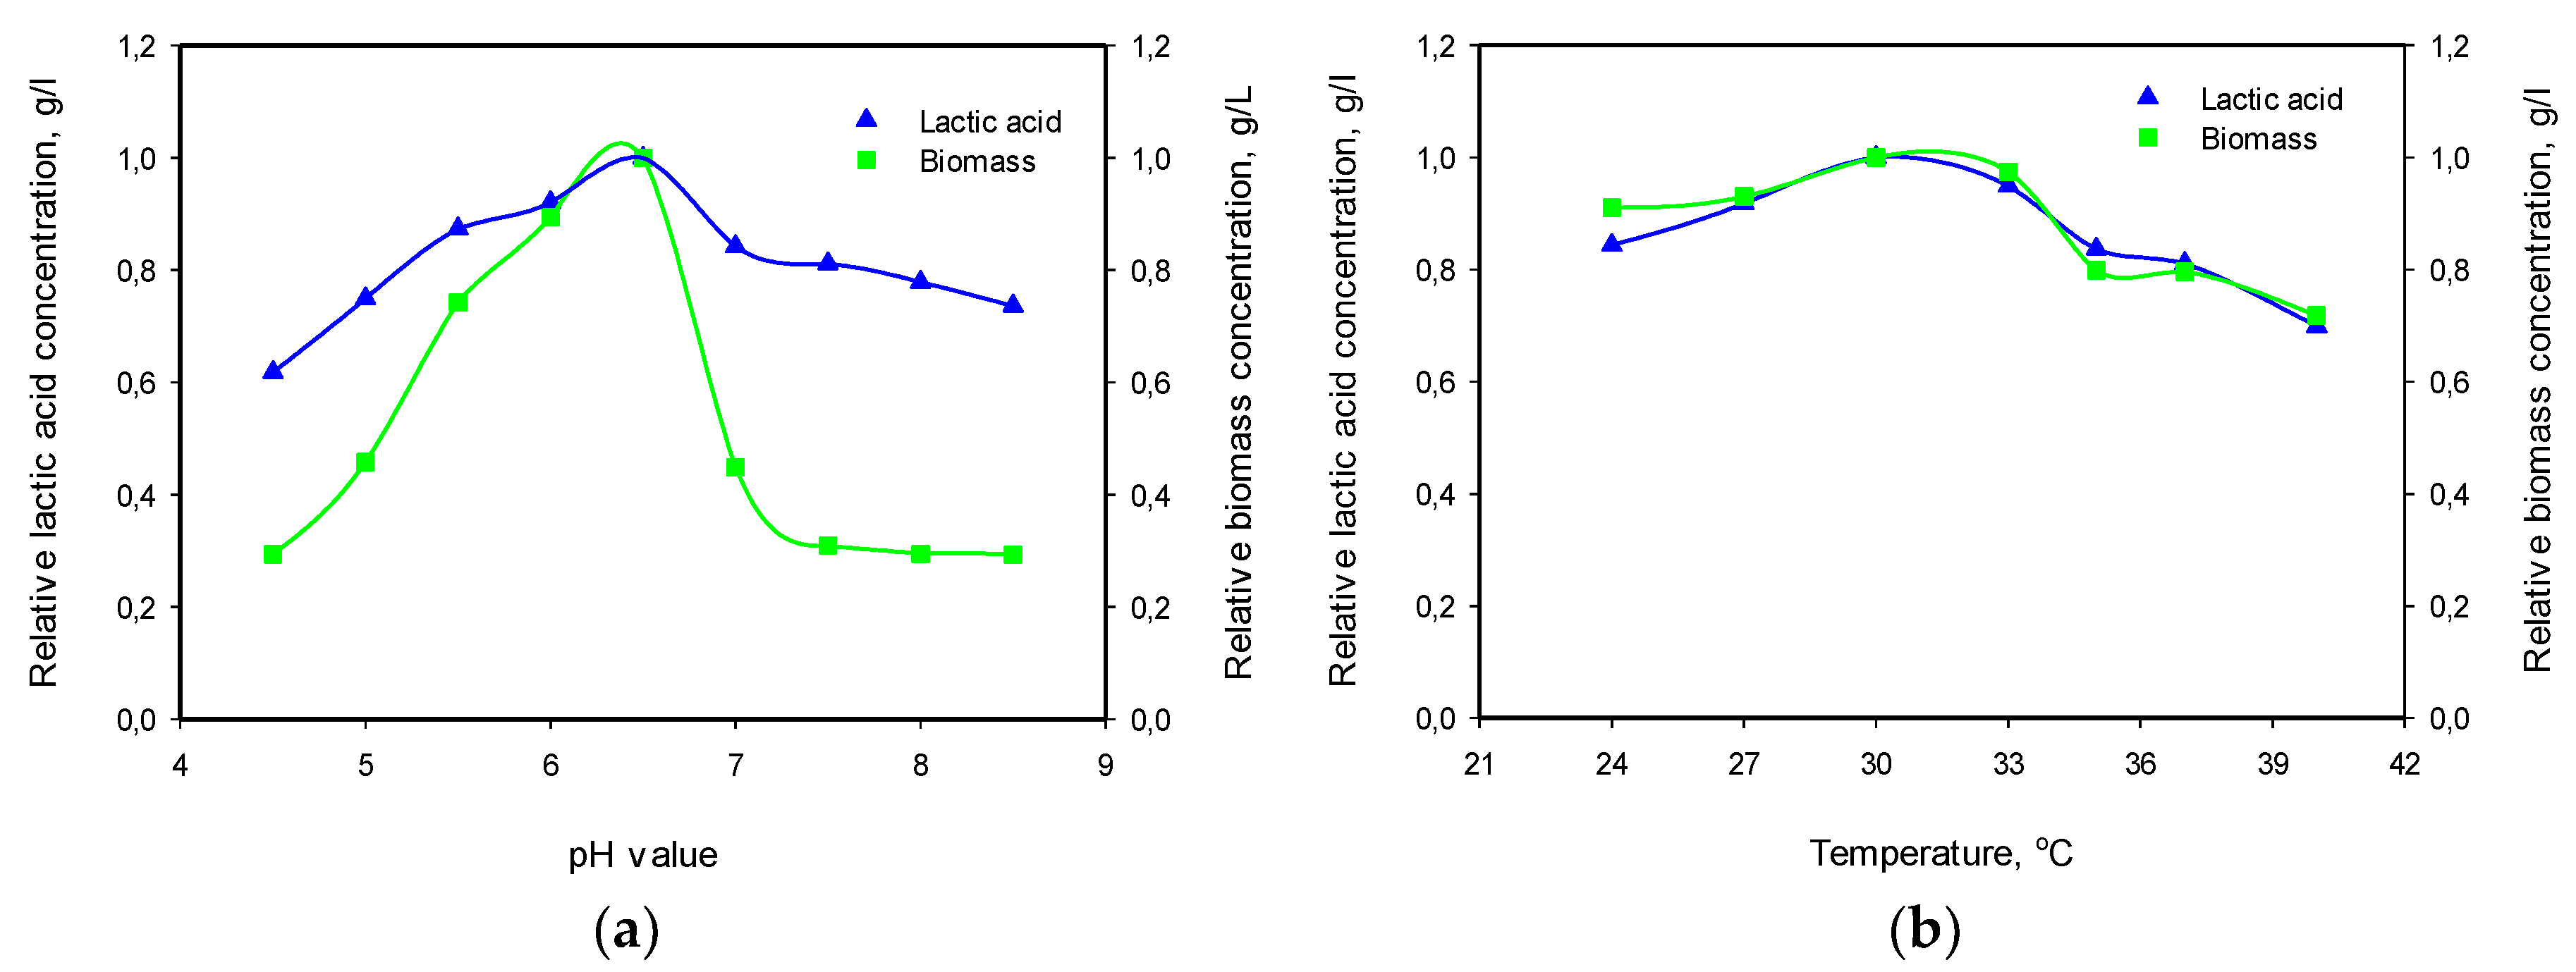
3.3. Influence of pH and Temperature
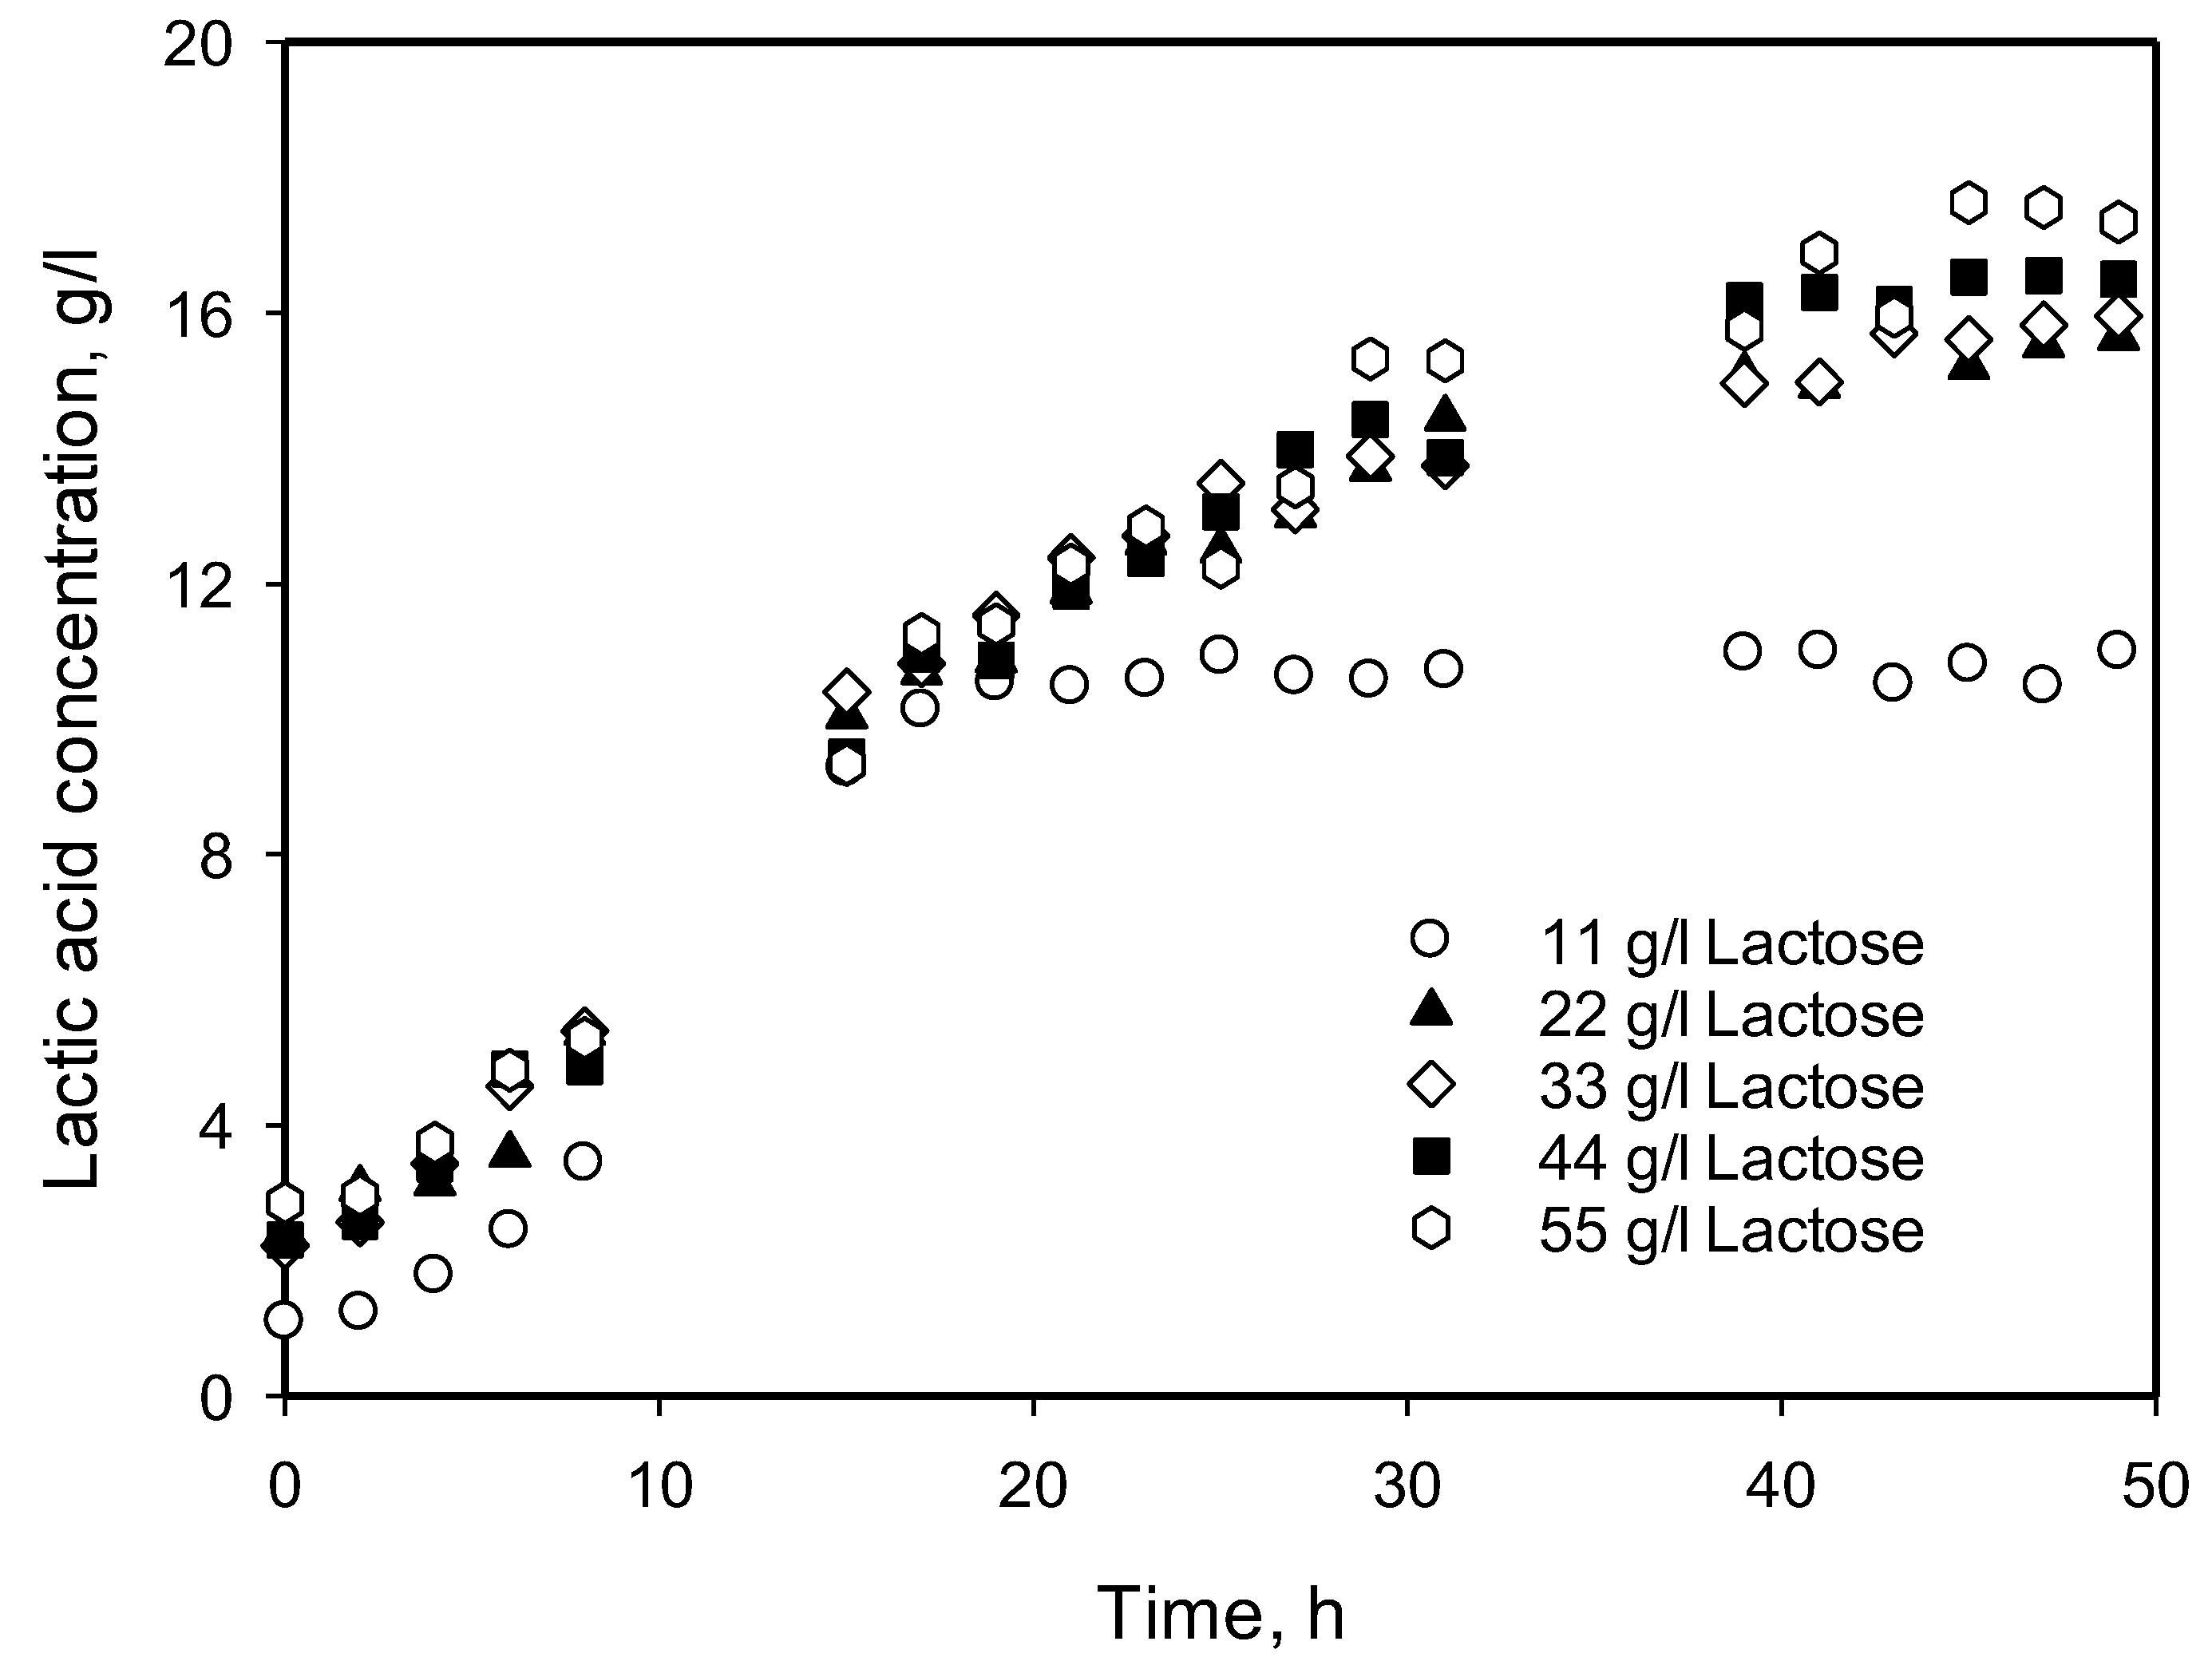
3.4. Influence of Initial Substrate Concentration
3.5. Modeling of Cell Growth, Substrate Consumption, and Product Accumulation
3.6. Model Predictions
4. Conclusions
Author Contributions
Funding
Conflicts of Interest
References
- Hatti-Kaul, R.; Chen, L.; Dishisha, T.; El Enshasy, H. Lactic acid bacteria: from starter cultures to producers of chemicals. FEMS Microbiology Letters 2018, 365, fny213. [CrossRef]
- Filannin, P.; De Angelis, M.; Di Cagno, R.; Gozzi, G.; Riciputi, Y., Gobbetti, M. How Lactobacillus plantarum shapes its transcriptome in response to contrasting habitats., Environmental Microbiology 2018, 20, 3700-3716. [CrossRef]
- Chen, P.-T.; Hong, Z.-S.; Cheng, Ch.-L.; Ng, I-S.; Lo, Y.-Ch.; Nagarajan, D.; Chang, J.-S. Exploring fermentation strategies for enhanced lactic acid production with polyvinyl alcohol-immobilized Lactobacillus plantarum using microalgae as feedstock. Bioresource Technology 2020, 308, 123266. [CrossRef]
- Yetiman, A. E.; Keskin, A.; Nur, D. B.; Kotil, S. E.; Ortakci, F.; Dogan, M. Characterization of genomic, physiological, and probiotic features Lactiplantibacillus plantarum DY46 strain isolated from traditional lactic acid fermented shalgam beverage. Food Bioscience 2022, 46, 101499. [CrossRef]
- Yadav, N.; Nain, L.; Khare, K. S. One-pot production of lactic acid from rice straw pretreated with ionic liquid. Bioresource Technology 2021, 323, 124563. [CrossRef]
- David, A. N.; Sewsynker-Sukai, Y.; Gueguim, Kana, E.B. Co-valorization of corn cobs and dairy wastewater for simultaneous sacharification and lactic acid production: Process optimization and kinetic assessment. Bioresource Technology 2022, 348, 126815. [CrossRef]
- Haokok, Ch.; Lunprom, S.; Reungsang, A.; Salakkam, A. Efficient production of lactic acid from cellulose and xylan in sugarcane bagasse by newly isolated Lactiplantibacillus plantarum and Levilactobacillus brevis through simultaneous saccharification and co-fermentation process Heliyon 2023, 9, e17935. [CrossRef]
- Derabli, B.; Nancib, A.; Nancib, N.; Aníbal, J.; Raposo, S.; Rodrigues, B.; Boudrant, J. Opuntia ficus indica waste as a cost effective carbon source for lactic acid production by Lactobacillus plantarum. Food Chemistry 2022, 370, 131005. [CrossRef]
- Fu, W.; Mathews, A.P. Lactic acid production from lactose by Lactobacillus plantarum: kinetic model and effects of pH, substrate, and oxygen Biochemical Engineering Journal 1999, 3, 163-170. [CrossRef]
- Seddik, H. A.; Bendali, F.; Gancel, F.; Fliss, I.; Spano, G.; Drider, D. Lactobacillus plantarum and Its Probiotic and Food Potentialities. Probiotics & Antimicrob. Prot., 2017, 9, 111–122. [CrossRef]
- Zheng, J.; Wittouck, S.; Salvetti, E.; Franz, C.M.A.P.; Harris, H.M.B.; Mattarelli, P.; O’Toole, P. W.; Pot, B.; Vandamme, P.; Walter, J.; Watanabe, K.; Wuyts, S.; Felis, G.E.; Gänzle, M.G.; Lebeer, S. A taxonomic note on the genus Lactobacillus: Description of 23 novel genera, emended description of the genus Lactobacillus Beijerinck 1901, and union of Lactobacillaceae and Leuconostocaceae. Int. J. Syst. Evol. Microbiol. 2020, 70, 2782–2858. [CrossRef]
- Corsetti, A.; Ciarrocchi, A.; Prete, R. Lactic Acid Bacteria: Lactobacillus spp.: Lactobacillus plantarum. Reference Module in Food Sciences, Elsevier. Amsterdam, 2016. [CrossRef]
- Zacharof, M.-P.; Lovitt, R.W. Modelling and Simulation of Cell Growth Dynamics, Substrate Consumption, and Lactic Acid Production Kinetics of Lactococcus lactis. Biotechnology and Bioprocess Engineering 2013, 18, 52-64. [CrossRef]
- Bouguettoucha, A.; Balannec, B.; Amrane A. Unstructured Models for Lactic Acid Fermentation—A Review. Food Technol. Biotechnol. 2011, 49, 3–12.
- Gordeev, L.S.; Koznov, A.V.; Skichko, A.S.; Gordeeva, Yu. L. Unstructured Mathematical Models of Lactic Acid Biosynthesis Kinetics: A Review. Theoretical Foundations of Chemical Engineering 2017, 51, 175–190. [CrossRef]
- Danova, S.; Georgieva, R.; Koleva, P.; Tropcheva, R.; Manasiev, J.; Nikolova, D. Biodiversity and activity of Lactic acid bacteria from traditional Bulgarian milk products. Scientific Works of UFT - Plovdiv 2009, 56, 275-280.
- Torriani, S.; Felis, G.E.; Dellaglio, F. Differentiation of Lactobacillus plantarum, L. pentosus, and L. paraplantarum by recA gene sequence analysis and multiplex PCR assay with recA gene-derived primers. Appl. Environ. Microbiol. 2001, 67, 3450–3454. [CrossRef]
- Georgieva, R.N.; Iliev, I.N.; Chipeva, V.A.; Dimitonova, S.P.; Samelis, J.; Danova, S.T. Identification and in vitro characterisation of Lactobacillus plantarum strains from artisanal Bulgarian white brined cheeses. J. Basic. Microbiol. 2008, 48, 234–244. [CrossRef]
- Verhulst, P.-F. Notice sur la loi que la population suit dans son accroissement. Corr. math. phys. 1838, 10, 113-121. [CrossRef]
- Altıok, D.; Tokatlı, F.; Harsa Ş. Kinetic modelling of lactic acid production from whey by Lactobacillus casei (NRRL B-441). J Chem Technol Biotechnol 2006, 81, 1190–1197 (). [CrossRef]
- Aiba, S.; Shoda, M.; Nagatani M. Biotechnol. Bioeng. 1968, 10, 845–864.
- Andrews, J. F. A mathematical model for the continuous culture of microorganisms utilizing inhibitory substrates. Biotechnology and bioengineering, 1968, 10, 707-723. [CrossRef]
- Åkerberg, C.; Hofvendahl, K.; Zacchi, G.; Hahn-Hägerdal, B. Modelling the infuence of pH, temperature, glucose and lactic acid concentrations on the kinetics of lactic acid production by Lactococcus lactis ssp. lactis ATCC 19435 in whole-wheat flour. Appl Microbiol Biotechnol 1998, 49, 682-690. [CrossRef]
- Ierusalimskiĭ, N.D.; Neronova, N.M. Quantitative relationship between the concentration of metabolic products and the rate of growth of microorganisms. Doklady Akademii nauk SSSR 1965, 161, 1437-1440 (in Russian).
- Hinshelwood, C. N. The chemical kinetics of the bacterial cell, 1st ed., Clarendon Press, Oxford, 1946.
- Zwietering, M.H.; Jongenburger, I.; Rombouts, F. M.; van ‘t Riet, K. Modeling of the Bacterial Growth Curve. Applied and Environmental Microbiology 1990, 56, 1875-1881. [CrossRef]
- Luedeking, R.; Piret, E.L. A Kinetic Study of the Lactic Acid Fermentation. Batch Process at Controlled pH. Journal of Biochemical and Microbiological Technology and Engineering 1959, 1, 393-412.
- Brinques, GB.; Ayub, M.A.Z. Effect of microencapsulation on survival of Lactobacillus plantarum in simulated gastrointestinal conditions, refrigeration, and yogurt. J Food Eng 2011, 103,123–128. [CrossRef]
- van de Guchte, M.; Serror, P.; Chervaux, C.; Smokvina, T.; Ehrlich, S.D.; Maguin E. Stress responses in lactic acid bacteria. Antonie Van Leeuwenhoek, 2002, 82, 187–216.
- Wall, T.; Båth, K.; Britton, R.A.; Jonsson, H.; Versalovic, J.; Roos, S. The early response to acid shock in Lactobacillus reuteri involves the ClpL chaperone and a putative Cell Wall-altering esterase. Appl Environ Microbiol 2007, 73, 3924–3935. [CrossRef]
- Barbosa, J.; Albano, H.; Silva, B.; Almeida, M.H.; Nogueira, T.; Teixeira, P.; Caracterization of a Lactiplantibacillus plantarum R23 Isolated from Arugula by Whole-Genome Sequencing and Its Bacteriocin Production Ability. Int. J. Environ. Res. Public Health 2021, 18, 5515 . [CrossRef]
- Bomrungnok, W.; Sonomoto, K.; Pinitglang, S.; Wongwicharn, A. Single Step Lactic Acid Production from Cassava Starch by Lactobacillus plantarum SW14 in Conventional Continuous and Continuous with High Cell Density. APCBEE Procedia, 2012, 2, 97 – 103. [CrossRef]
- Jang, H.-Y.; Kim, M. J.; Bae, M., Hwang, I.M.; Lee, J.-H. Transcriptional analysis of the molecular mechanism underlying the response of Lactiplantibacillus plantarum to lactic acid stress conditions., Heliyon, 2023, 9, e16520, DOI: 10.1016/j.heliyon.2023.e16520. [CrossRef]
- Baltà-Foix, R.; Serrano-Adrover, C.; López-Cano, A.; Gifre-Renom, L.; Sanchez-Chardi, A.; Arís, A.; Garcia-Fruitós, E. Lactiplantibacillus plantarum: a new example of inclusion body producing bacteria, Microbial Cell Factories, 2023, 22, 111. [CrossRef]
- Adesokan, I.A.; Odetoyinbo B.B.; Okanlawon, B.M. Optimization of lactic acid production by lactic acid bacteria isolated from some traditional fermented food in Nigeria. Pakistan Journal of Nutrition, 2009, 8, 611 – 615.
- Venkatesh, K.V.; Okos, M.R.; Wankat, P.C. Kinetic Model of Growth and Lactic Acid Production from Lactose by Lactobacillus bulgaricus. Process Biochemistry 1993, 28, 231-241. [CrossRef]
- Lunelli, B.H.; Melo, D.N.C.; de Morais, E.R.; Victorino, I.R.S.; Vasco de Toledo, E.C.; Maciel, M.R.W.; Filho, R.M. Real-time optimization for lactic acid production from sucrose fermentation by Lactobacillusplantarum. Computer Aided Chemical Engineering, 2011, 29, 1396-1400. [CrossRef]
- Peetermans, A.; Foulquié-Moreno, M.R.; Thevelein, J.M. Mechanisms underlying lactic acid tolerance and its influence on lactic acid production in Saccharomyces cerevisiae. Microbial Cell 2021, 8, 111-130. [CrossRef]
- Mercier, P.; Yerushalmi, L.; Rouleau, D.; Dochain D. Kinetics of Lactic Acid Fermentation on Glucose and Corn by Lactobacillus amylophilus. J. Chem. Tech. Biotechnol. 1992, 55, 111-121. [CrossRef]
- Kostov, G.; Angelov, M.; Denkova, Z.; Dobrev, I.; Goranov, B. Lactic acid production with Lactobacillus casei ssp. rhamnosus NBIMCC 1013: Modeling and optimization of the nutrient medium. Eng. Life Sci. 2011, 11, 517–527. [CrossRef]
- Liu, B.; Yang, M.; Qi, B.; Chen, X.; Su, Zh.; Wan, Y. Optimizing l-(+)-lactic acid production by thermophile Lactobacillus plantarum As.1.3 using alternative nitrogen sources with response surface method. Biochemical Engineering Journal 2010, 52, 212–219. [CrossRef]
- Tomás, M.S.J.; Ocaña, V.S.; Wiese, B.; Nader-Macías ,M.E. Growth and lactic acid production by vaginal Lactobacillus acidophilus CRL 1259, and inhibition of uropathogenic Escherichia coli. Journal of Medical Microbiology 2003, 52, 1117–1124. [CrossRef]
- Amrane, A.; Prigent, Y. Mathematical Model for Lactic Acid Production from Lactose in Batch Culture: Model Development and Simulation. J. Chem. Tech. Biotechnol. 1994, 60, 241-246. [CrossRef]
- Colucci Cante, R.; Gallo, M.; Nigro, F.; Passannanti, F.; Budelli, A.; Nigro, R. Mathematical Modeling of Lactobacillus paracasei CBA L74 Growth during Rice Flour Fermentation Performed with and without pH Control. Appl. Sci. 2021, 11, 2921. [CrossRef]
- Barragán, P.J.; Sánchez, Ó.J.; Henao-Rojas, J.C. Evaluation of the Growth Kinetics of Lactobacillus Plantarum ATCC 8014 on a Medium Based on Hydrolyzed Bovine Blood Plasma at Laboratory and Bench-Scale Levels and Its Application as a Starter Culture in a Meat Product. Fermentation 2020, 6, 45. [CrossRef]
- Palaniraj, R.; Nagarajan, P. Kinetic Studies In Production Of Lactic Acid From Waste Potato Starch Using Lactobacillus casei. Int. J. Chem Tech Res. 2012, 4, 1601-1614,.
- Vázquez, J.A.; Murado, M.A. Unstructured mathematical model for biomass, lactic acid and bacteriocin production by lactic acid bacteria in batch fermentation. J Chem Technol Biotechnol 2008, 83, 91–96. [CrossRef]
- Trontel, A.; Baršić, V.; Slavica, A.; Šantek, B.; Novak S. Modelling the Effect of Different Substrates and Temperature on the Growth and Lactic Acid Production by Lactobacillus amylovorus DSM 20531T in Batch Process. Food Technol. Biotechnol. 2010, 48, 352–361.
- Goranov, B.; Shopska, V.; Denkova, R.; Kostov, G. Kinetics of Batch Fermentation in the Cultivation of a Probiotic Strain Lactobacillus delbrueckii ssp. Bulgaricus B1. Acta Universitatis Cibiniensis Series E: Food Technology 2015, XIX, 61-72. [CrossRef]
- Gonçaives, L.M.D.; Xavier, A.M.R.B.; Almeida, J.S.; Carrondo, M.J.T. Concomitant substrate and product inhibition kinetics in lactic acid production. Enzyme Microb. Technol. 1991, 13, 314-319. [CrossRef]
- Anuradha, R.; Suresh, A.K.; Venkatesh K.V. Simultaneous saccharification and fermentation of starch to lactic acid. Process Biochemistry 1999, 35, 367-375. [CrossRef]
- Balannec, B.; Bouguettoucha, A.; Amrane A. Unstructured model for batch cultures without pH control of Lactobacillus helveticus—Inhibitory effect of the undissociated lactic acid. Biochemical Engineering Journal 2007, 35, 289–294. [CrossRef]
- Biazar, J.; Tango, M.; Babolian, E.; Islam, R. Solution of the kinetic modeling of lactic acid fermentation using Adomian decomposition method. Appl. Math. Comput. 2003, 144 433–439. [CrossRef]
- Ben Youssef, C.; Goma, G.; Olmos-Dichara, A. Kinetic modelling of Lactobacillus casei ssp. rhamnosus growth and lactic acid production in batch cultures under various medium conditions. Biotechnology Letters 2005, 27, 1785–1789. [CrossRef]
- Gupta, S.; Abu-Ghannam, N.; Scannell, A.G.M. Growth and kinetics of Lactobacillus plantarum in the fermentation of edible Irish brown seaweeds. Food and Bioproducts Processing 2011,89, 346–355. [CrossRef]
- Sharma, V.; Mishra, H.N. Unstructured kinetic modeling of growth and lactic acid production by Lactobacillus plantarum NCDC 414 during fermentation of vegetable juices. LWT Food Science and Technology 2014, 59, 1123e11. [CrossRef]
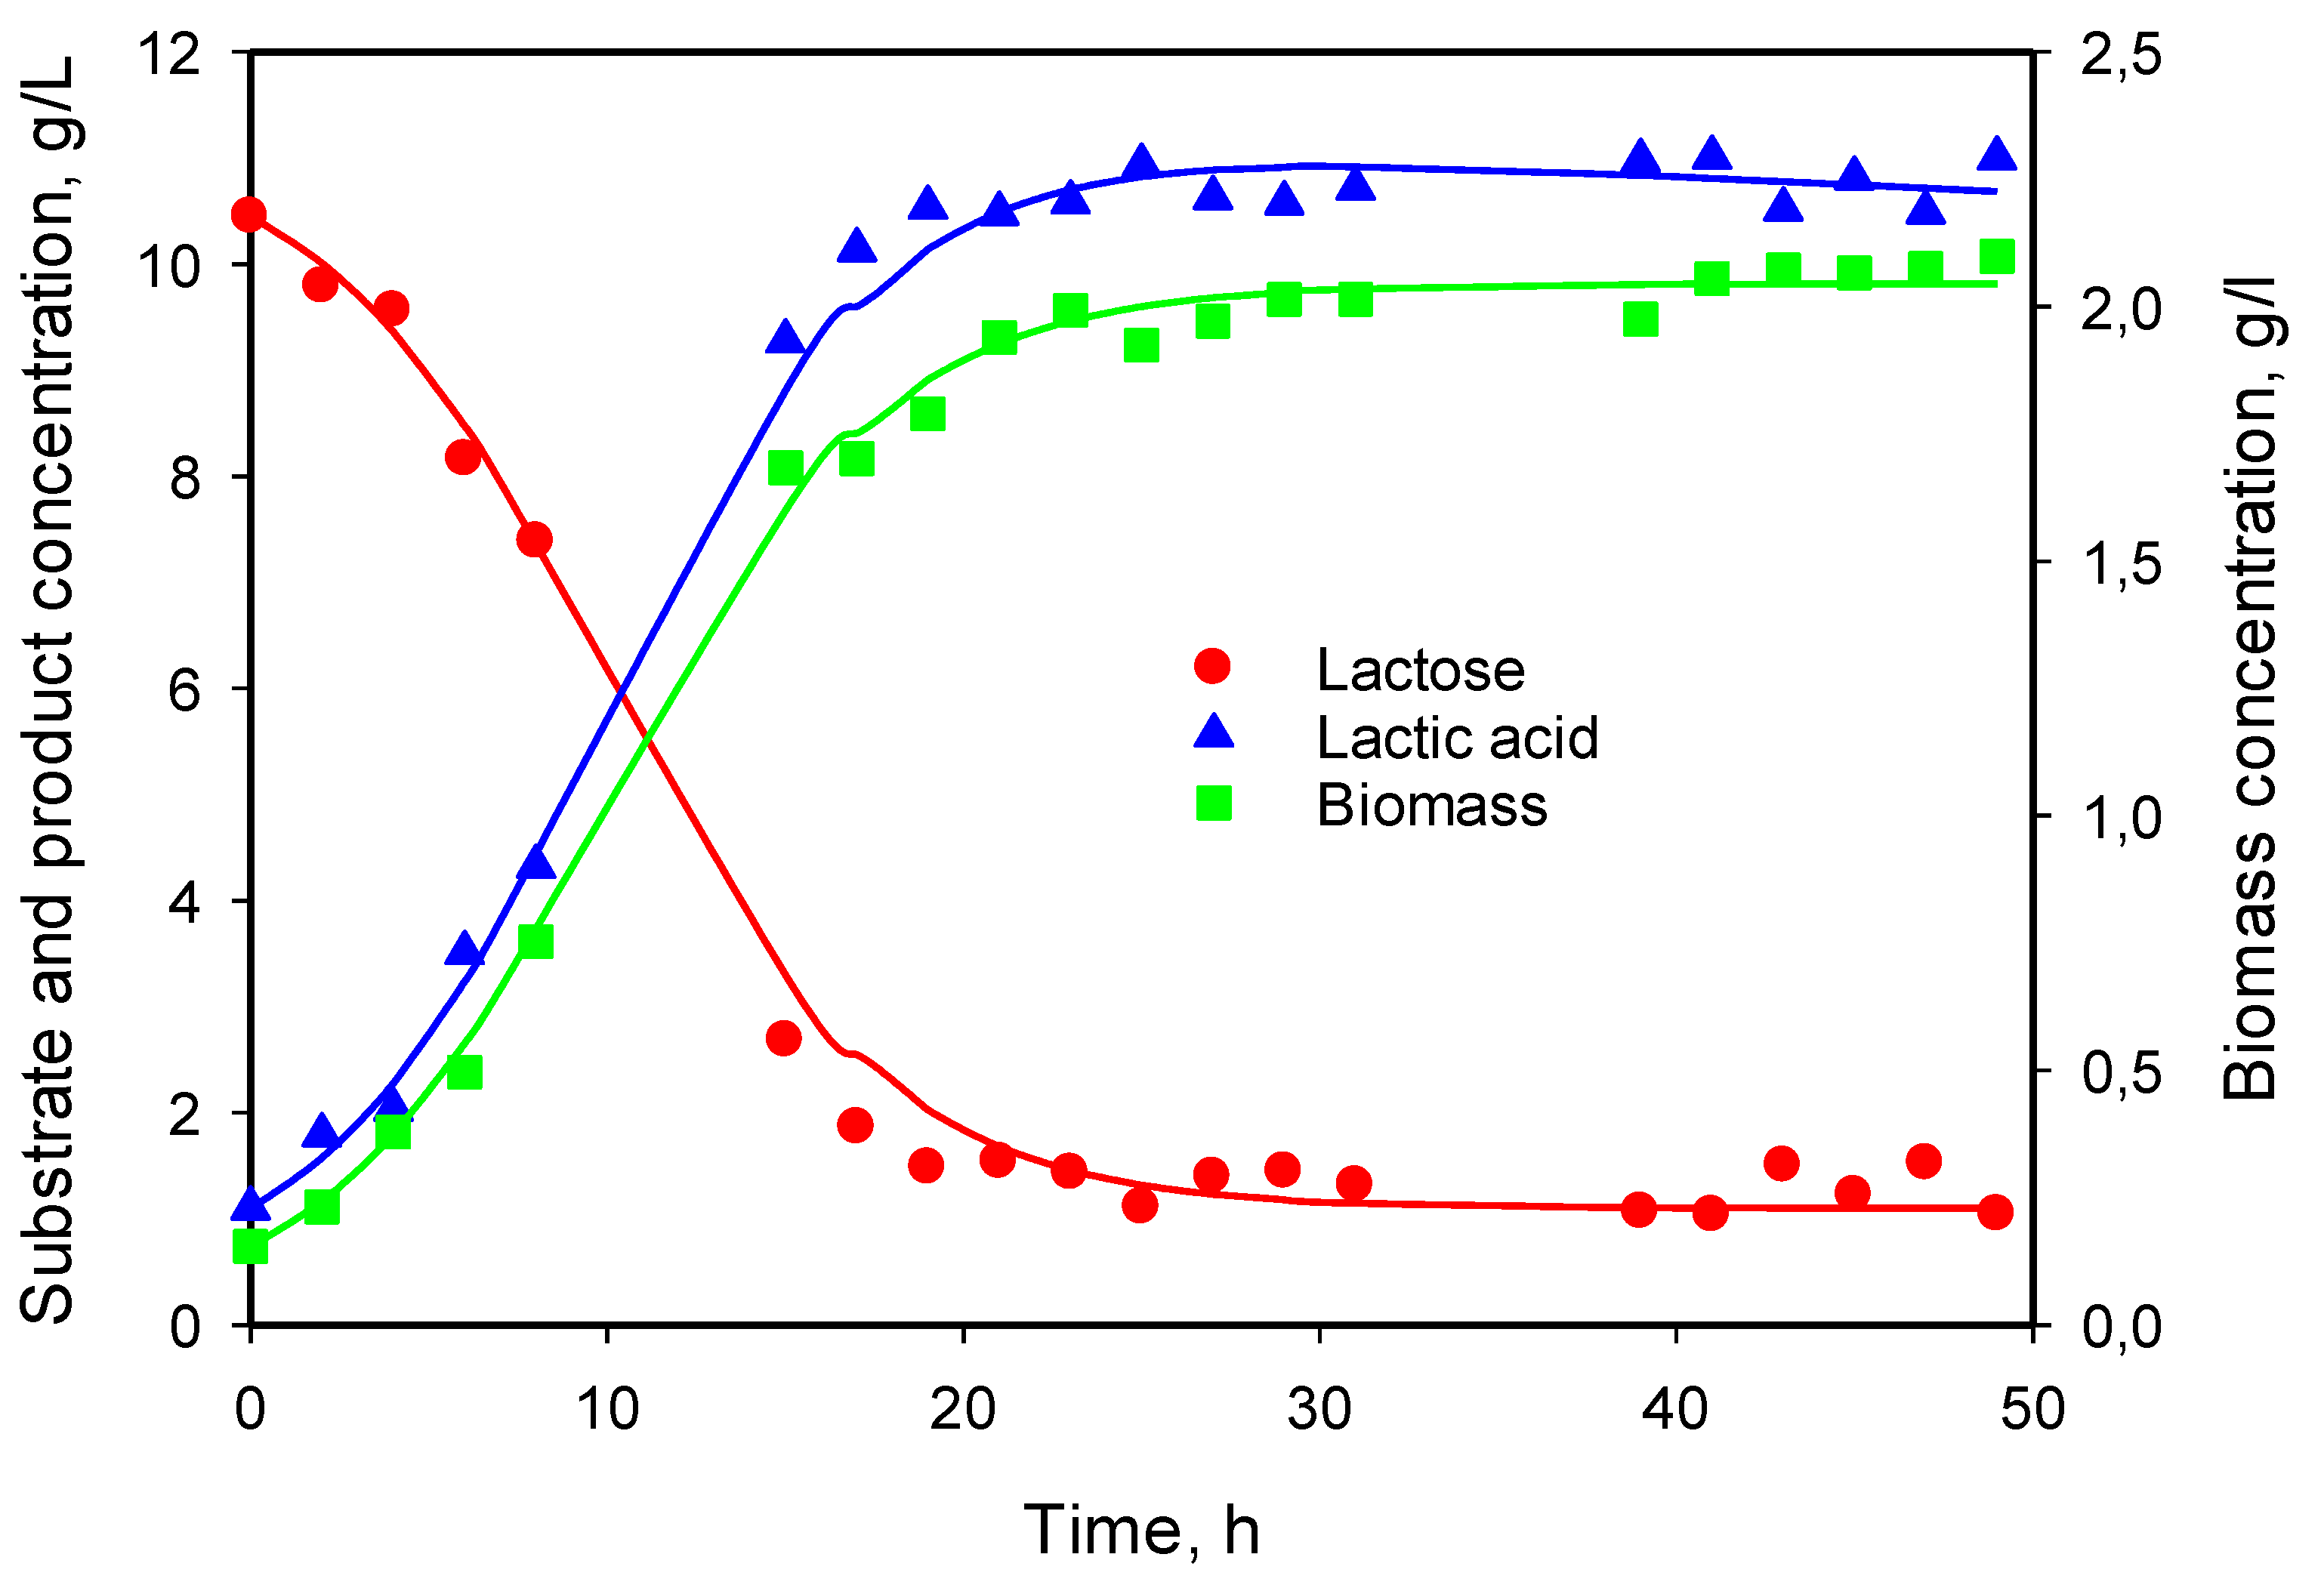
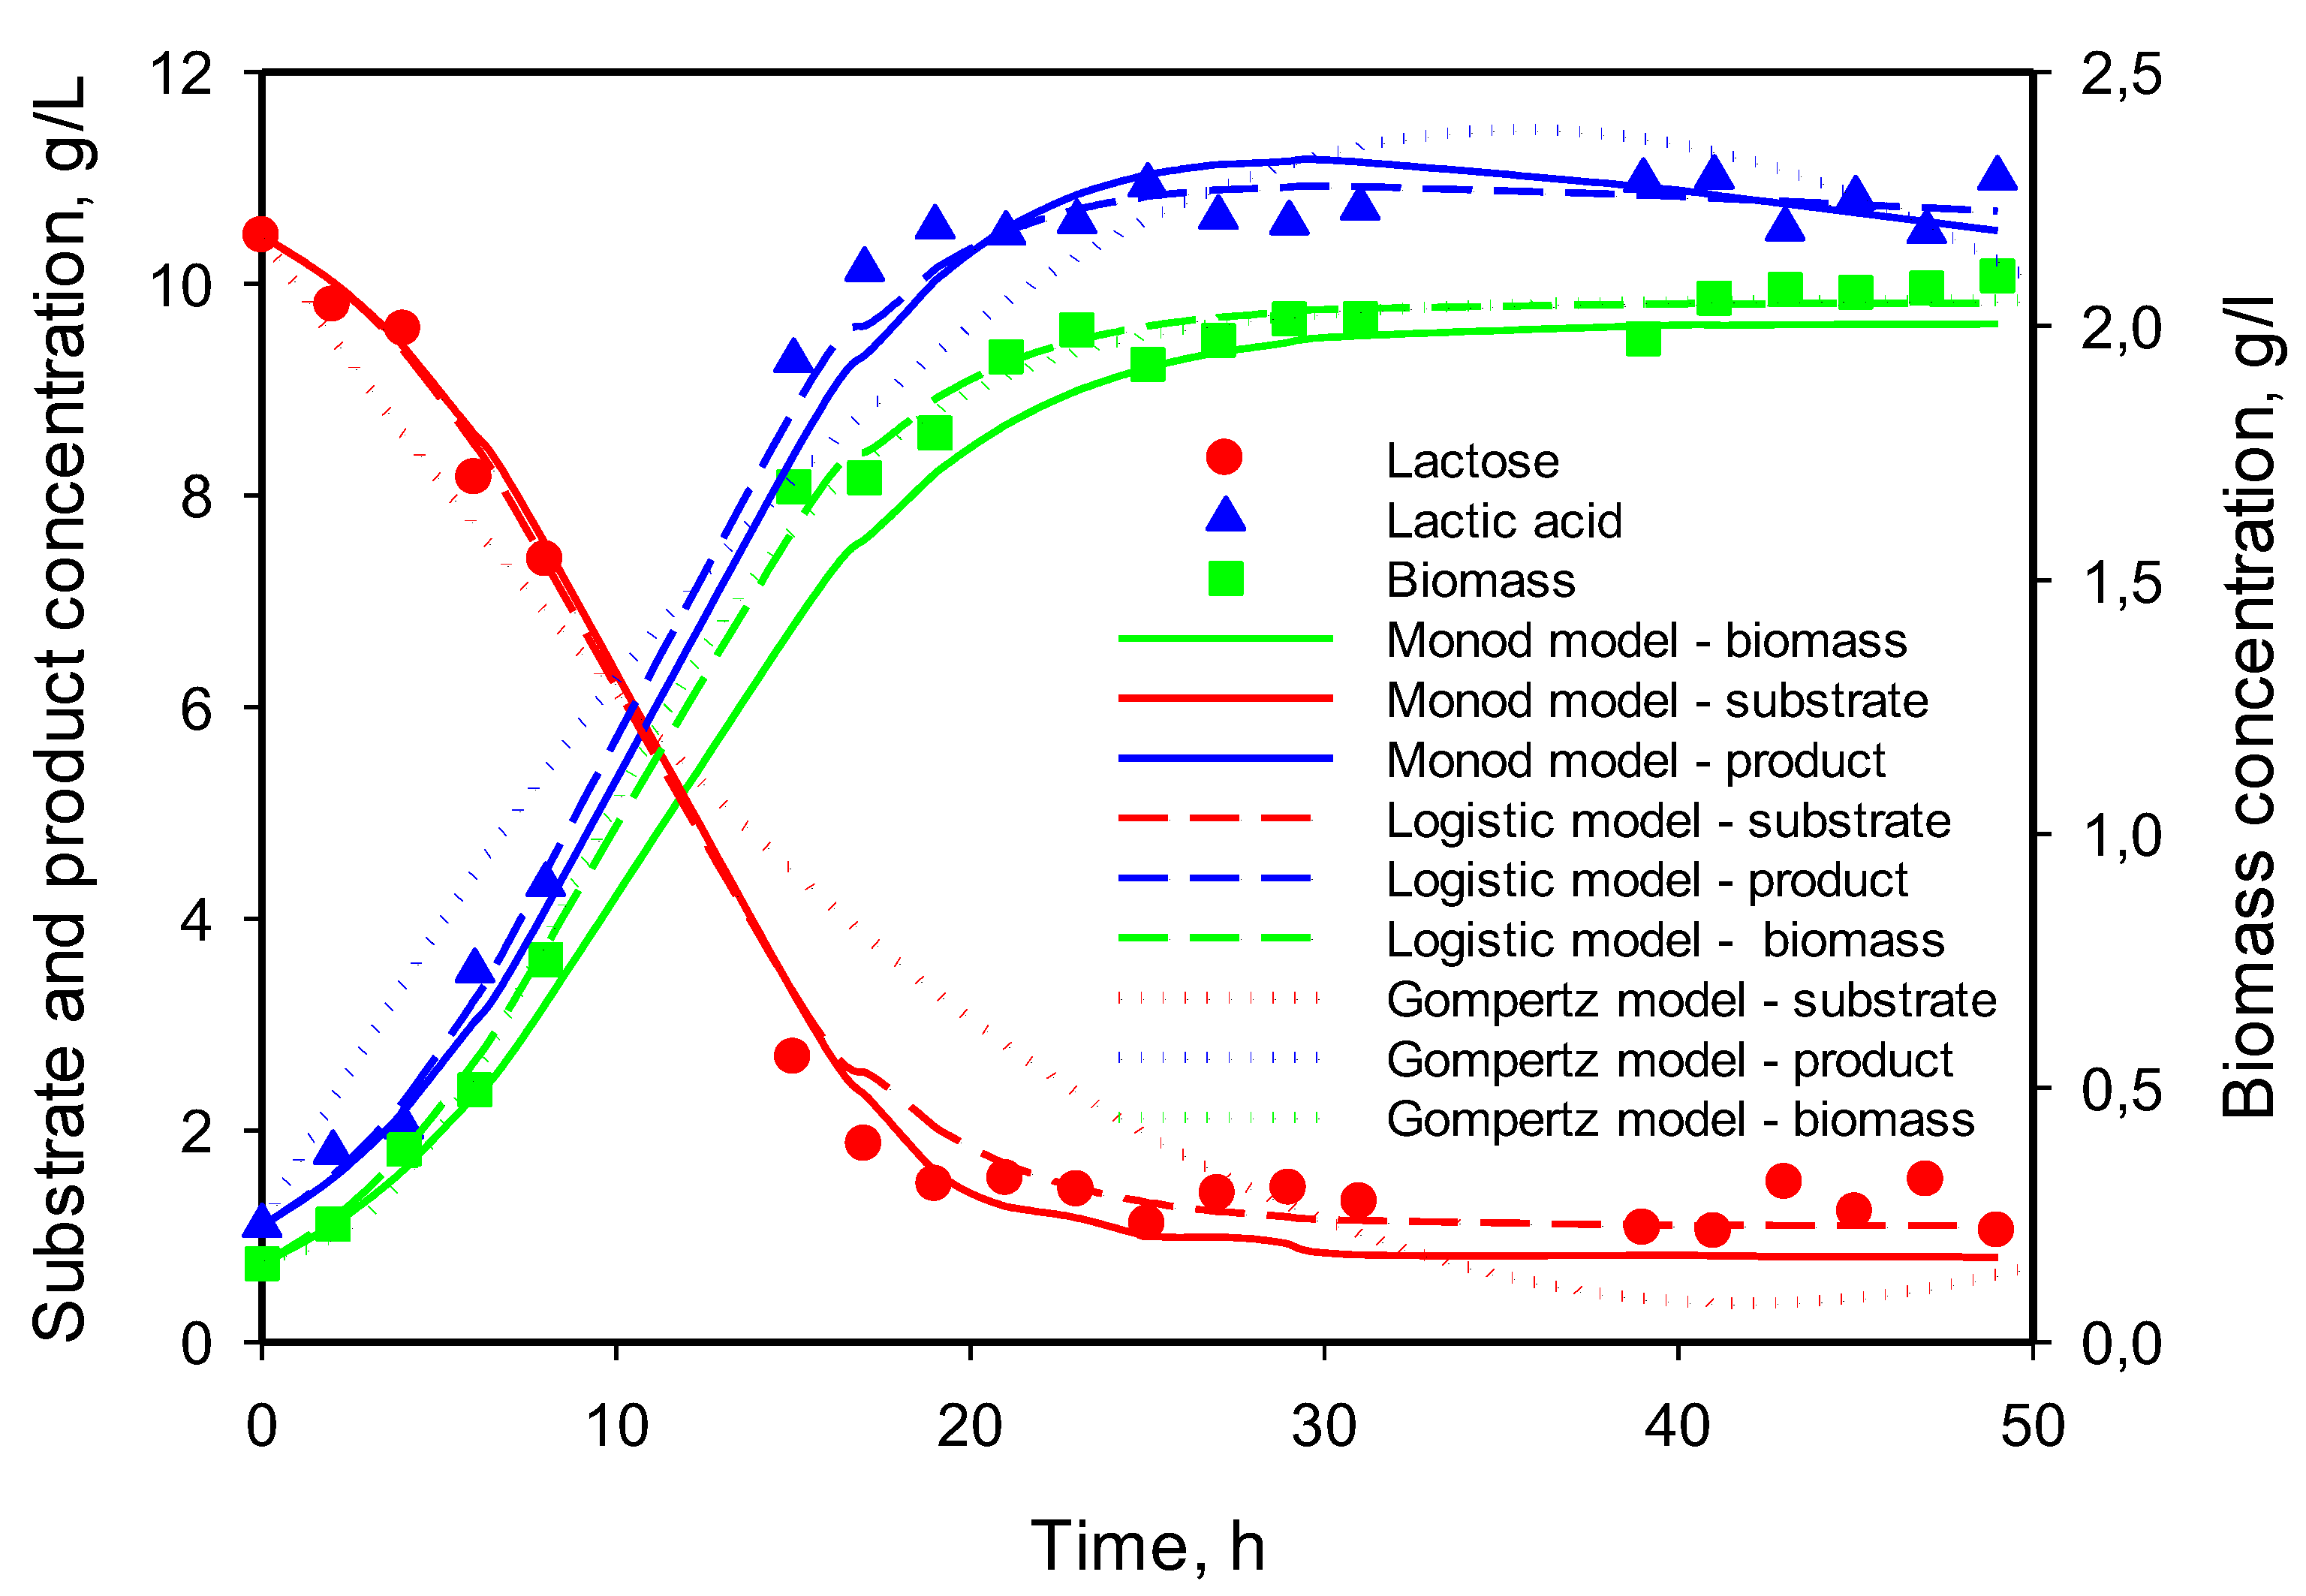
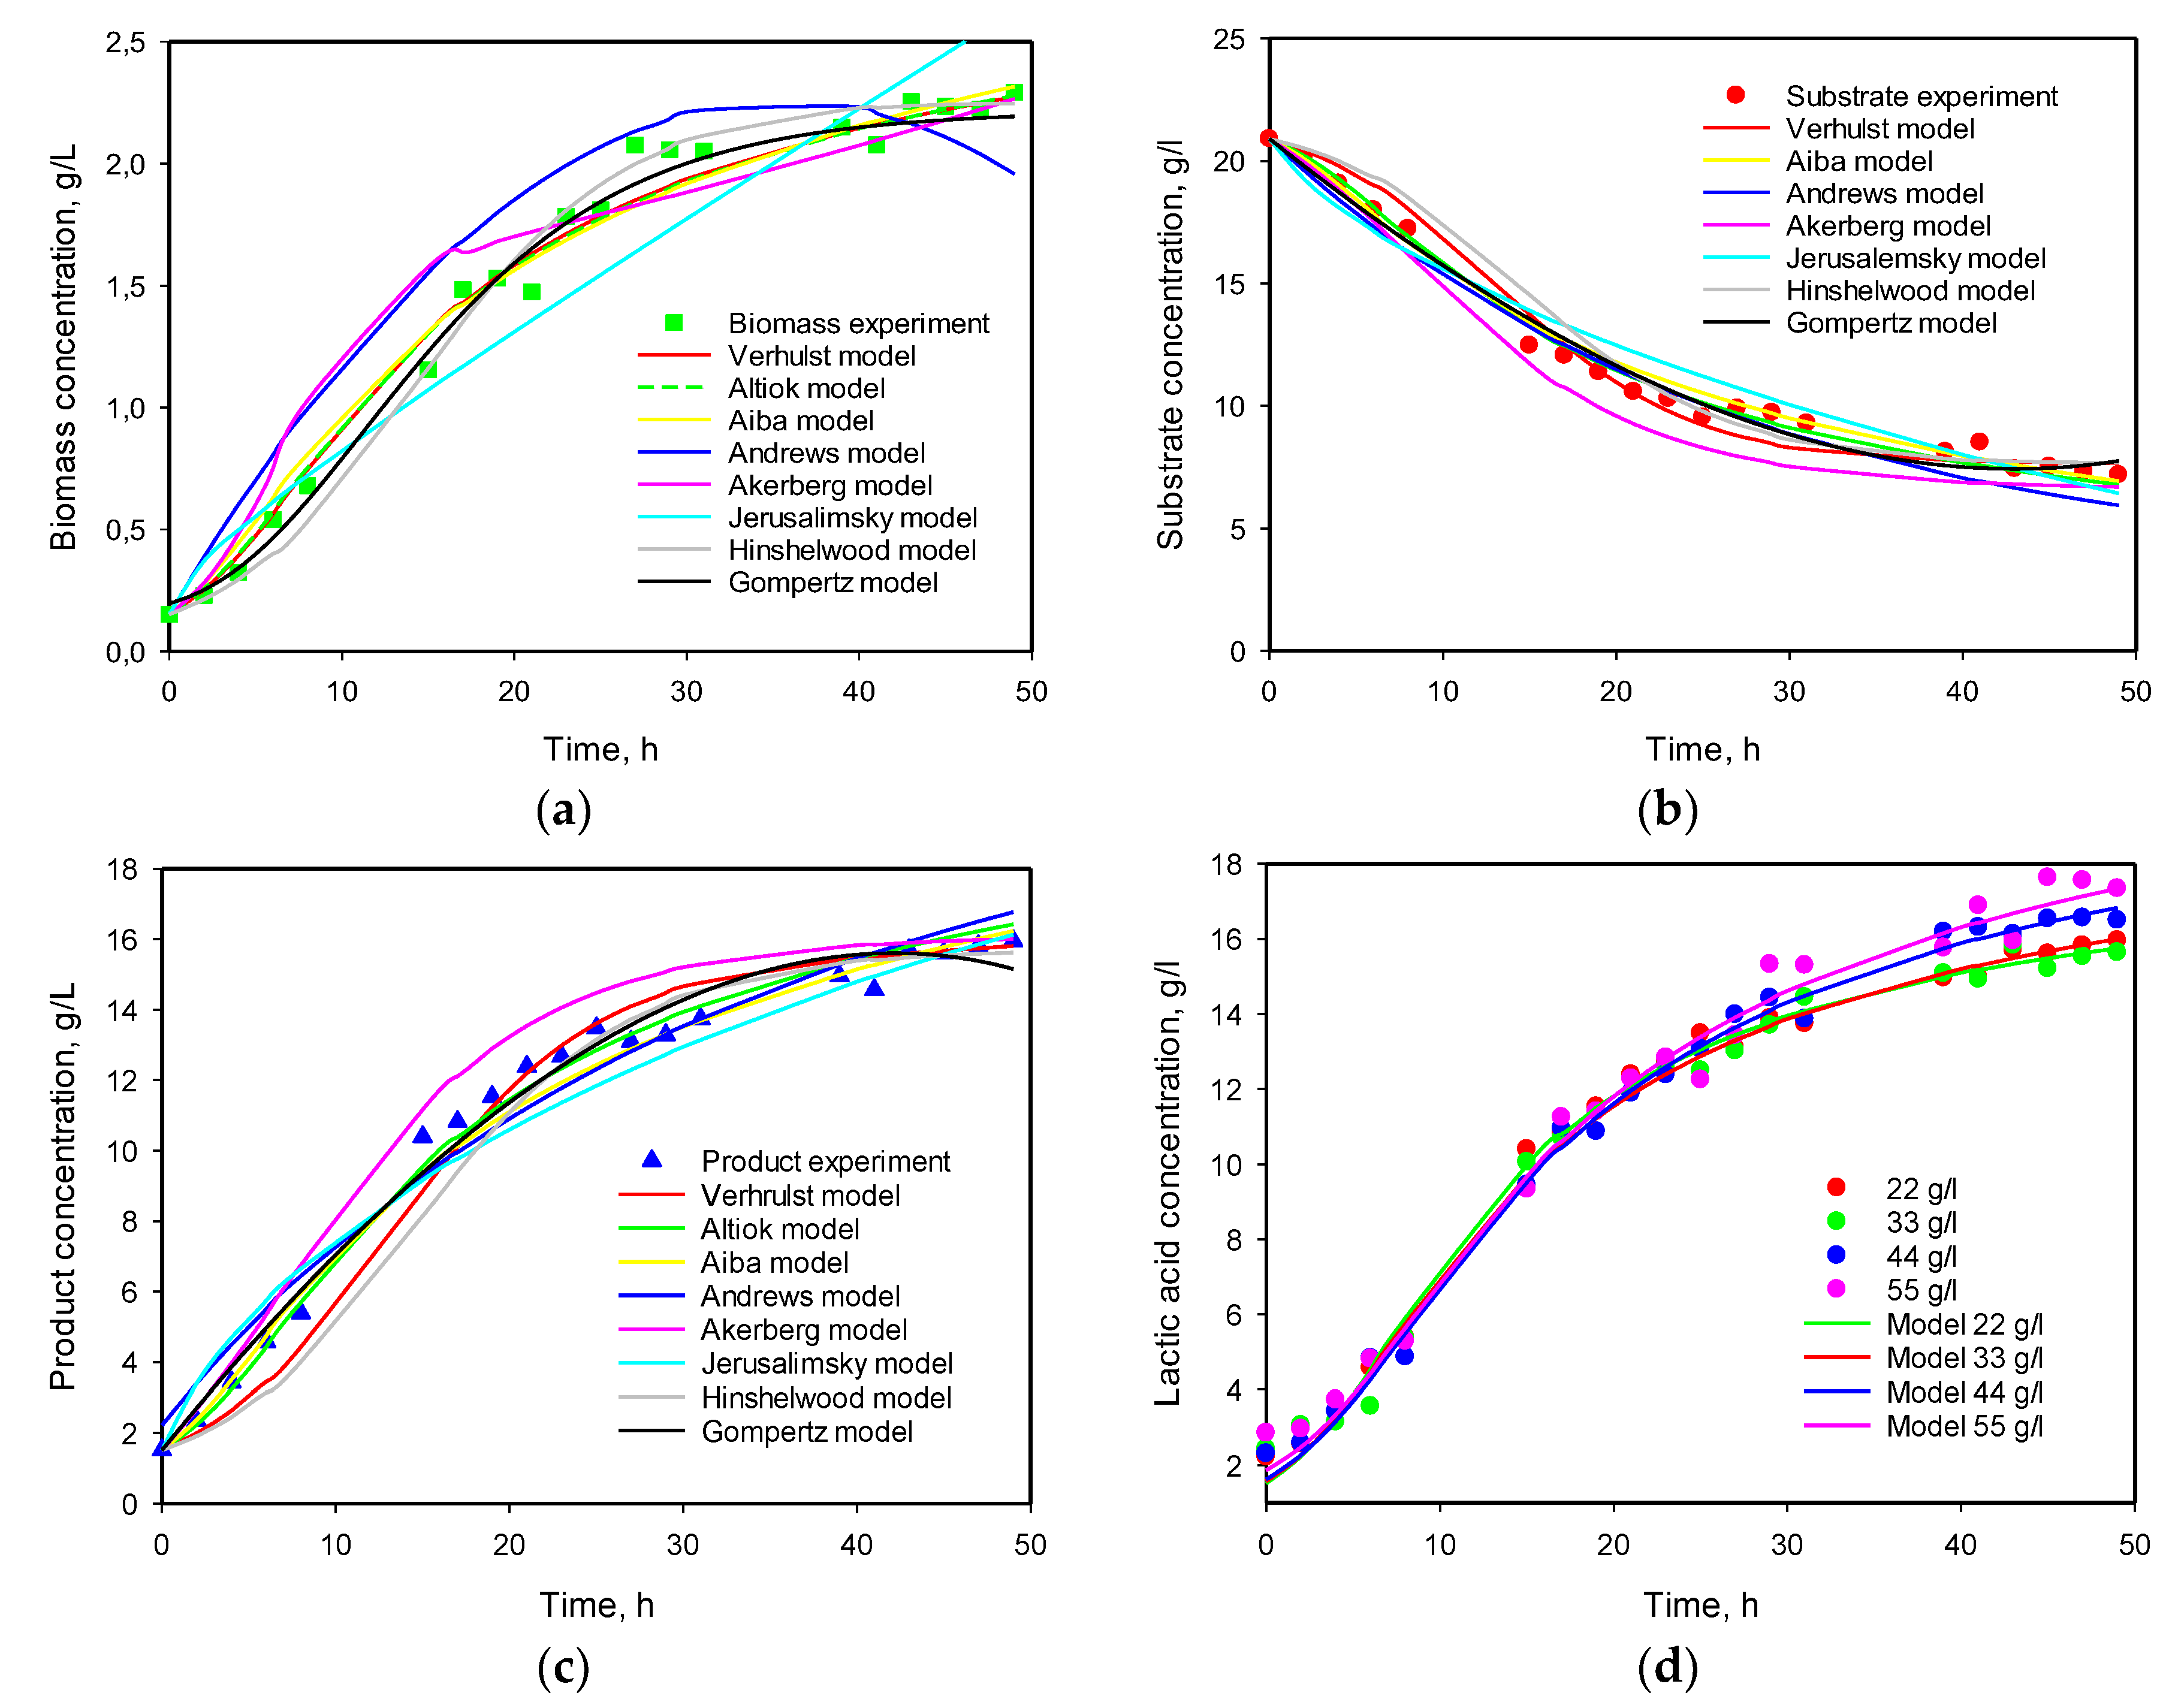
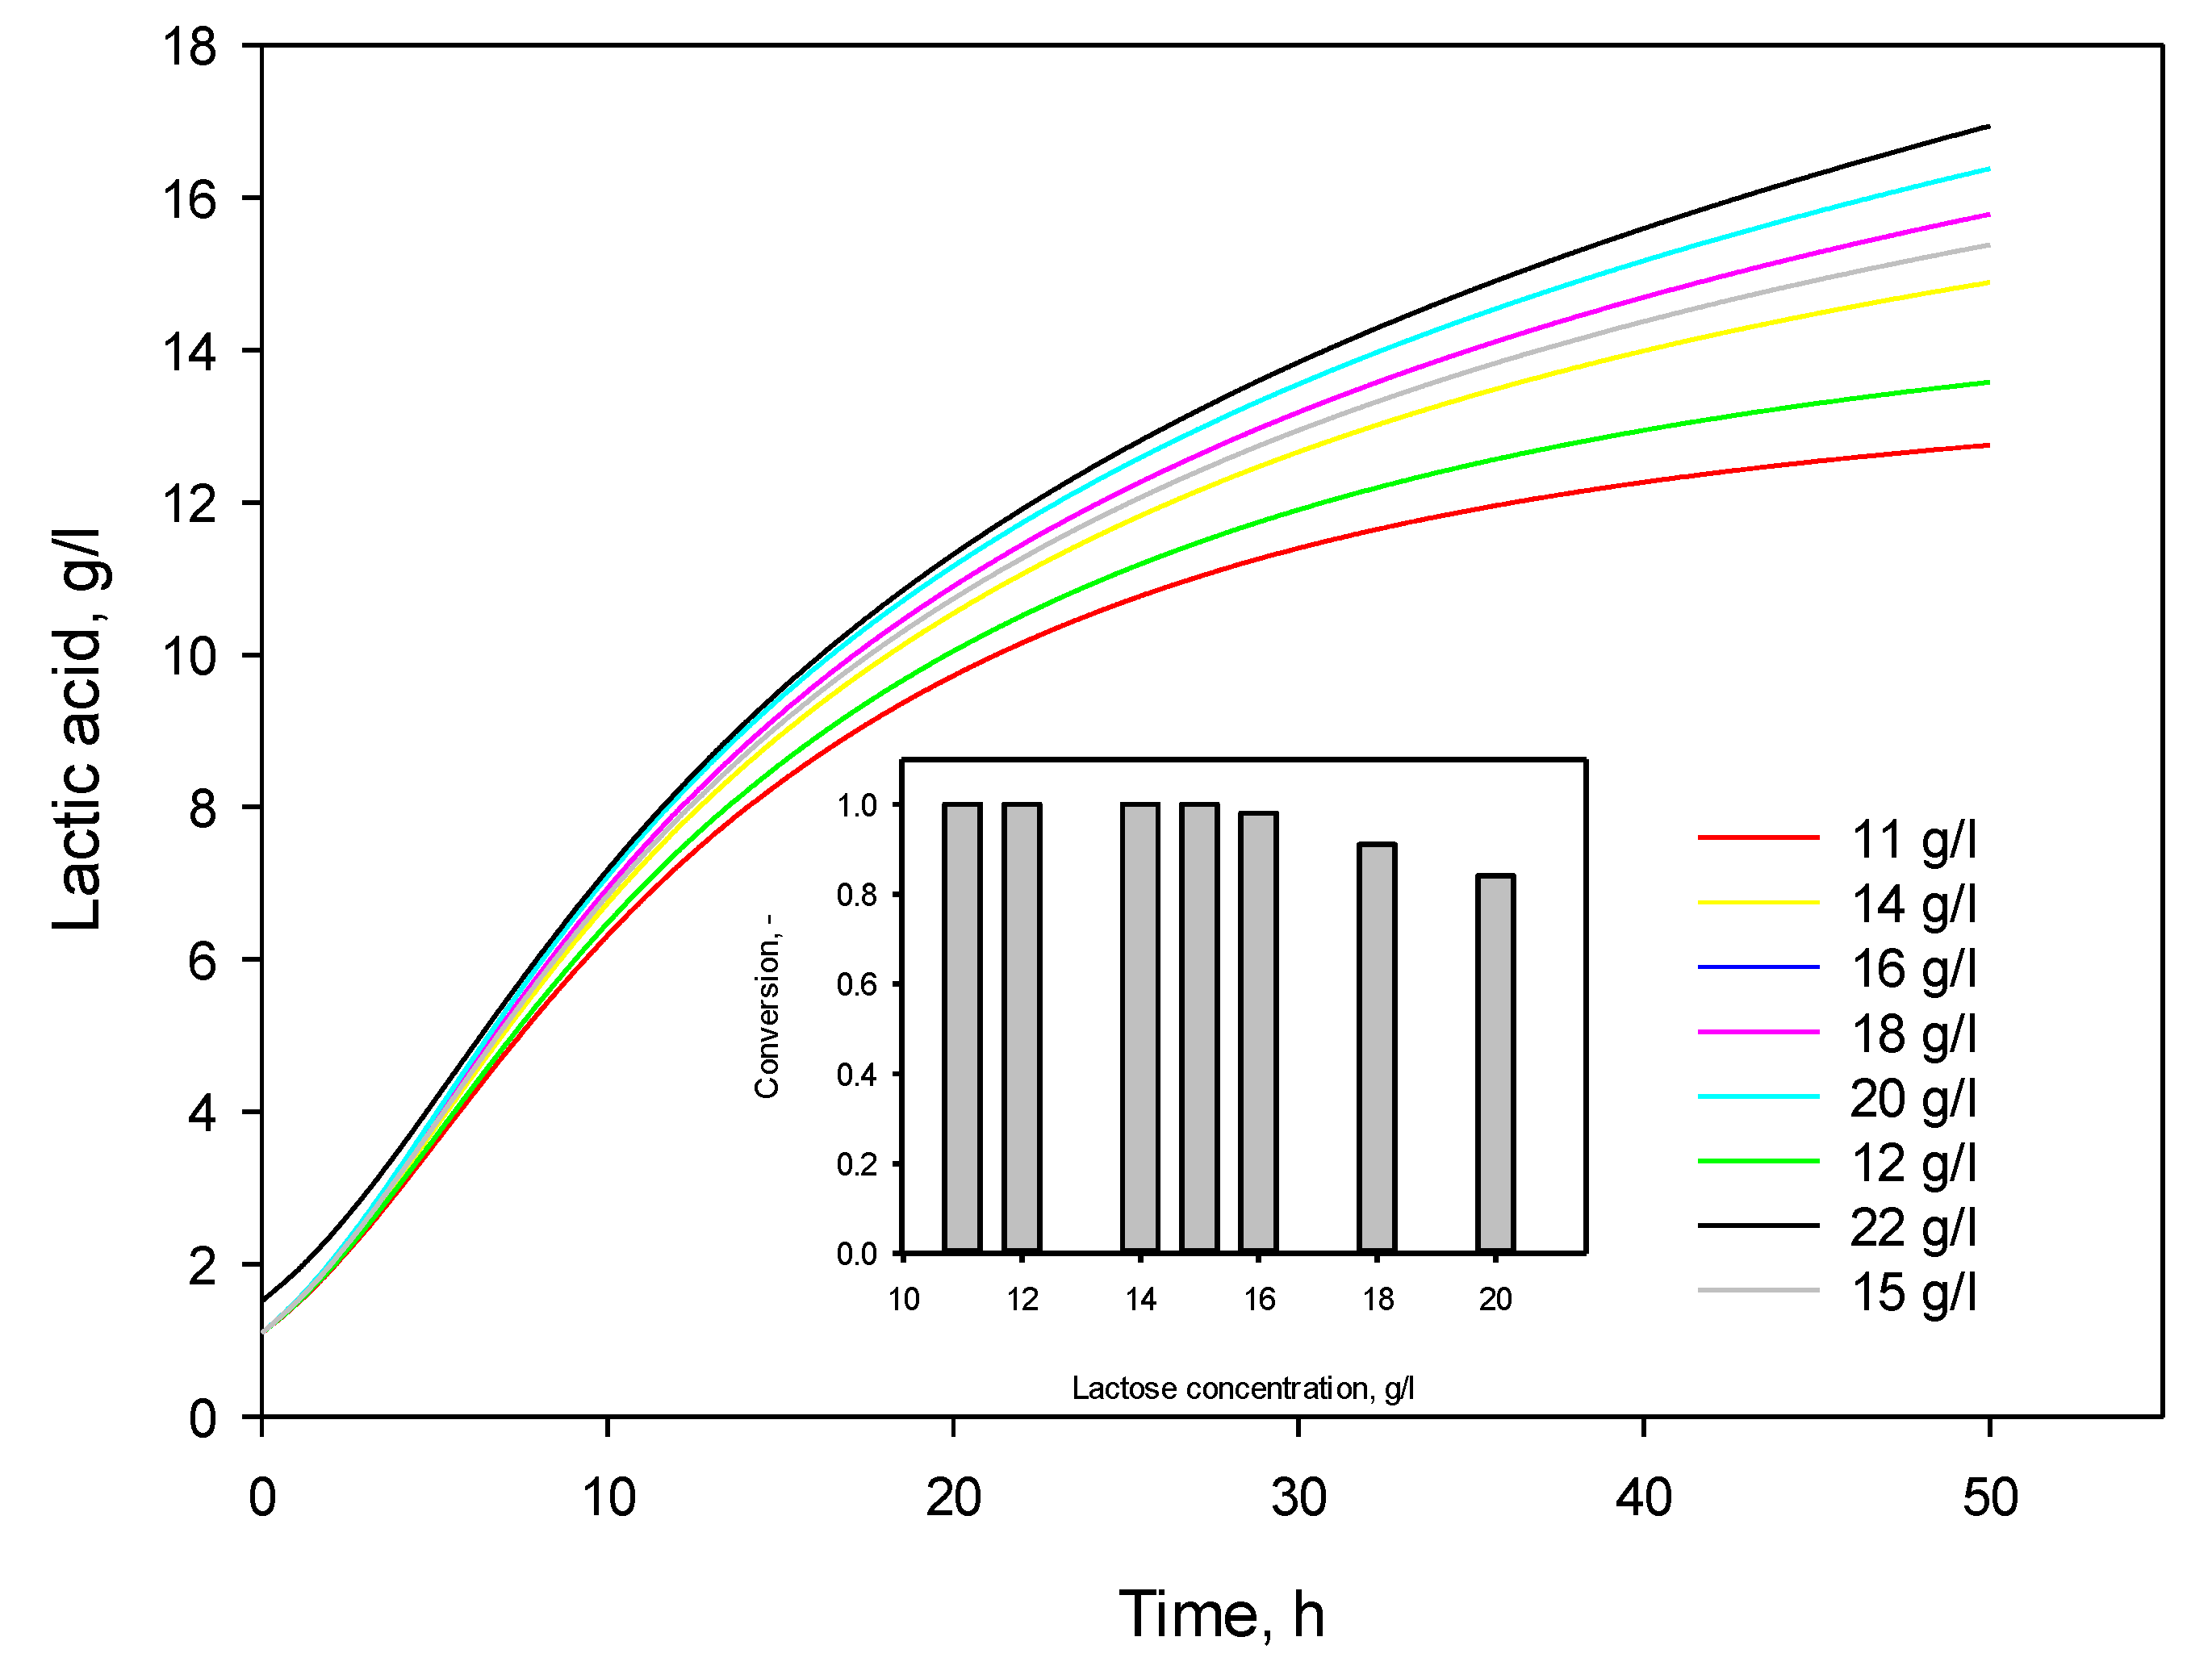
| No | Model name | Equation of biomass specific growth rate | Ref. |
|---|---|---|---|
| 1 | Verhulst |
if n=1 |
[19] |
| 2 | Altıok | if n1, n2 = 1 | [20] |
| 3 | Aiba | [21] | |
| 4 | Andrews | [22] | |
| 5 | Akerberg | [23] | |
| 6 | Monod-Jerusalimsky | [24] | |
| 7 | Hinshelwood | [25] |
| Model | μmax | KS | Xmax | λ | A | YX/S | YP/S | α | β | Q |
|---|---|---|---|---|---|---|---|---|---|---|
| Monod | 0.420 | 5.511 | 0.175 | 4.016 | 5.965 | 0.0197 | 1.019 | |||
| Verhulst | 0.253 | 2.045 | 0.202 | 6.394 | 5.396 | 0.0077 | 0.352 | |||
| Gompertz | 0.048 | 2.959 | 1.925 | 0.205 | 5.986 | 6.086 | 0.0042 | 3.846 | ||
| Logistic | 0.138 | 4.0705 | 1.875 | 0.229 | 2.011 | 4.591 | 0.0 | 1.949 |
| Model No | μmax | KS | KP | Ki | Xmax | Pmax | n1 | n2 | YX/S | YP/S | α | β | Q |
|---|---|---|---|---|---|---|---|---|---|---|---|---|---|
| 1 |
0.179 0.322 |
1.754 3.673 |
2.060 |
0.121 0.154 |
3.650 3.346 |
8.337 7.015 |
0.0156 0.0014 |
0.991 0.348 |
|||||
| 2 | 0.257 0.302 |
2.268 3.013 |
19.389 17.087 |
2.248 |
1.767 |
0.419 0.151 |
3.803 2.951 |
7.263 6.948 |
0.0069 0.0029 |
0.494 0.305 |
|||
| 3 | 0.365 | 3.464 | 0.247 | 0.155 | 1.855 | 6.784 | 0.005 | 0.463 | |||||
| 4 | 0.168 | 0.550 | 0.077 | 0.144 | 5.269 | 6.232 | 0.0549 | 4.099 | |||||
| 5 | 0.113 | 17.306 | 2.506 | 6.406 | 0.011 | 58.27 | 29.07 | 1.2367 | 4.71 | ||||
| 6 | 0.185 | 4.293 | 1.052 | 0.114 | 1.231 | 7.287 | 0.0231 | 3.287 | |||||
| 7 | 0.233 | 4.847 | 0.064 | 0.158 | 3.262 | 6.524 | 0.0028 | 1.348 |
| Microorganism | Substrate | Growth model | μmax (h-1) | Reference |
|---|---|---|---|---|
| L. amylophilus | Glucose 20 g/L | 0.32 (pH 6.5) | [39] | |
| L. casei | Lactose 20 g/L | 0.511 | [40] | |
| L. plantarum | Glucose 100 g/L | 0.64 | [41] | |
| L. lactis | Glucose 20 g/L | 0.66 (pH 6.5) | [13] | |
| L. acidophilus | Glucose 10 g/L | Four parameter Gompertz model | 0.35 (pH 6.5, 30 oC) 0.43 (pH 6.5, 37 oC) |
[42] |
| L. helveticus | Whey ultrafiltrate powder | 0.56 | [43] | |
| L. paracasei | Rice flour |
|
0.993 0.619 0.811 |
[44] |
| L. plantarum | Sucrose 20 g/L | . | 0.0545 | [45] |
| L.plantarum | Hydrolysed wheat flour | 0.403 | [23] | |
| L. plantarum | Lactose 40 g/L | 0.364 (pH 6.0) | [9] | |
| L. plantarum | Dairy waste water | 0.35 | [6] | |
| L. casei | Waste potato starch | 0.115 | [46] | |
| L. lactis | Glucose | 0.687 | [47] | |
| L. amylovorus | Glucose Sucrose Starch |
0.58 0.32 0.61 |
[48] | |
| L. delbrueckii | Glucose 10 g/L | Logistic equation | 0.031 | [49] |
| L. delbrueckii | Glucose |
|
0.55 0.59 0.58 |
[50] |
| L. casei | Whey lactose | 0.265 | [20] | |
| L. delbrueckii | Potato starch | 0.372(pH 5.5) | [51]a | |
| L. helveticus | Whey lactose | 0.64 | [52] | |
| L. helveticus | Lactose 50 g/L | 0.25 | [53] | |
| L. casei | Glucose 50 g/L | 0.45 | [54] | |
| L. plantarum | Irish brown seaweeds L. digitata L. saccharina |
Modified Gompertz equation |
0.4 0.29 |
[55] |
| L. plantarum | Glucose- 20 g/L Vegetable juice – 3 g/L RS |
Modified Gompertz equation | 0.6 0.45 |
[56] |
| L. plantarum | Glucose- 20 g/L Vegetable juice – 3 g/L RS |
Logistic equation | 0.62 0.53 |
[56] |
| Initial substrate concentration, g/L | α exp | α calc | µmax, calc |
|---|---|---|---|
| 11 | 5.091 | 6.850 | 0.249 |
| 22 | 6.748 | 6.782 | 0.334 |
| 33 | 6.959 | 6.768 | 0.343 |
| 44 | 6.947 | 7.197 | 0.311 |
| 55 | 7.651 | 7.195 | 0.309 |
| Mean value | 6.679 | 6.958 | 0.309 |
Disclaimer/Publisher’s Note: The statements, opinions and data contained in all publications are solely those of the individual author(s) and contributor(s) and not of MDPI and/or the editor(s). MDPI and/or the editor(s) disclaim responsibility for any injury to people or property resulting from any ideas, methods, instructions or products referred to in the content. |
© 2024 by the authors. Licensee MDPI, Basel, Switzerland. This article is an open access article distributed under the terms and conditions of the Creative Commons Attribution (CC BY) license (http://creativecommons.org/licenses/by/4.0/).


