
Submitted:
07 March 2024
Posted:
08 March 2024
You are already at the latest version
Abstract
This study examines the capacity of a Site-Specific Fodder Management Decision Support System (SSFM-DSS) model to assist in successful cultivation of sericea lespedeza [SL; Lespedeza cuneata (Dum.-Cours.) G. Don.], with a specific focus on small-scale agricultural systems in the southeastern United States (U.S.). The study emphasizes incorporating advanced geospatial technologies, such as Geographic Information Systems (GIS), remote sensing, and Global Navigation Satellite Systems (GNSS), to improve fodder production. The research showcases the versatility of SL under varying environmental conditions, underscoring its significance in promoting sustainable livestock production. The methodology integrates empirical field data, geospatial analysis, and predictive modeling to formulate an SSFM strategy customized to address the distinct difficulties climate change presents, such as sudden and severe drought conditions. The study introduces an automated geospatial model for assessing the appropriateness of SL production throughout Alabama, Georgia, and South Carolina. The model uses many environmental criteria, including soil properties, climate fluctuations, and terrain. Furthermore, the research was instrumental in development of a WebGIS Dashboard, which offers farmers a decision assistance system to enhance the sustainable production of SL. The results highlight the significant impact that a SSFM-DSS can have on promoting sustainable agricultural practices, providing a solution to address the issues of food security and environmental concerns in agriculture.
Keywords:
Site-specific Fodder Management
; Sericea Lespedeza
; Geographic Information Systems
; Remote Sensing
1. Introduction
Sericea lespedeza [SL; Lespedeza cuneata (Dum.-Cours.) G. Don.], a warm-season perennial legume, is well adapted to the soil types and climatic conditions of the southeastern United States (U.S.). Long recognized for its strong agronomic traits, including drought resistance, tolerance of acidic, infertile soils, and soil building properties that reduce erosion [1], SL has recently been gaining attention from farmers and scientists for its nutraceutical (nutritional + health-promoting) capabilities [2]. Sericea lespedeza has a high concentration of a unique type of condensed tannin (Over 90% prodelphinidin-type tannin subunits; [3,4], which is thought to be responsible for its excellent bioactivity against internal parasites in livestock, including Haemonchus contortus, a highly pathogenic blood-feeding gastrointestinal nematode that resides in the animal’s abomasum [2,5], and Eimeria spp., a small intestinal protozoan parasite that causes coccidiosis outbreaks in young animals during times of stress [3,6]. Both parasites cause production losses and increased mortality, particularly for small ruminants (sheep and goats). Sericea lespedeza also reduces ruminal methane emissions in livestock [7], kills domestic fly larvae in manure [8], and has bioactivity against pathogenic bacteria [9]. Because of these properties, producer demand for SL seeds, hay, and leaf meal feed pellets has been rapidly growing in the U.S., particularly for small ruminant farmers (T. Sims, Pers. Comm.). Because of its small seed size and relatively slow initial growth, establishment of SL pastures can be challenging, and new technologies are needed to identify optimal soil and climatic conditions for growth of this plant.
The agricultural sector, a fundamental pillar of human civilizations, persists in a perpetual state of transformation as it adapts to dynamic environmental conditions, emerging technological advancements, and evolving societal needs [10,11]. A transformation is occurring within the fodder management domain, particularly focusing on resource-constrained farmers in developing nations [12,13]. The emerging paradigm of site-specific fodder management (SSFM) is poised to revolutionize current practices by placing a strong emphasis on investigation, broad effect evaluation, and a strategic approach to addressing minor variations, particularly in the realm of production of the bioactive forage SL [14,15,16]. This approach presents the potential to not only bring about a paradigm shift in agricultural methodologies, but also to effectively tackle urgent issues surrounding food security and establishment of sustainable methods in livestock production.
While the focus is on developing nations, the phenomenon is not exclusive to them. The U.S., specifically its southeastern regions, is experiencing a transition from cattle to small ruminant farming, driven by factors such as reduced land ownership and unpredictable environmental circumstances [16]. During this transition, the production of SL has experienced an upswing since the 1940s [15,17,18]. The acquisition of valuable insights gained through extensive collaborations with farmers has guided development of decision support systems (DSS) in precision agriculture. These systems assume paramount significance in the comprehensive assessment of forage, encompassing qualitative and quantitative dimensions. Although agriculture has a history of embracing technological advancements, the utilization of geospatial technologies in sustainable small-scale farming systems is still in its nascent stages, particularly in its application to fodder management. The tools encompassed within this framework, such as Geographic Information Systems (GIS), remote sensing, and Global Navigation Satellite Systems (GNSS), have demonstrated their inherent value. One notable characteristic of SL is its persistent expansion trajectory, rendering it a highly suitable contender for applying advanced technologies, such as satellite imageries, soil characteristics rasters, and climatic spatial databases for early biomass estimation to provide production management decision support. Geospatial data can be used to ascertain SL's nutritional quality and biomass production prediction on a spatial basis for better SSFM-DSS development.
The emergence of SL production, supported by SSFM-DSS and state-of-the-art technology, greatly increases the potential value of this plant as a bioactive forage [15]. The potential transformation in fodder management and production methodologies in developing nations and regions such as the southeastern U.S. alludes to a promising and environmentally conscious agricultural future characterized by enhanced sustainability and efficiency for both limited resource farmers in developing nations and commercial farmers in developed countries, such as the U.S. As smartphones are now available to the masses, including marginal farmers, a WebGIS Dashboard supported SL SSFM-DSS delivery process is vital.
2. Goals and Objectives
The goal of this study was to develop an SSFM-DSS model for SL to enhance animal production as a climate-smart fodder in place of other forages that cannot grow sustainably under the flash-drought conditions [19] being encountered in the U.S. and other parts of the globe as a consequence of climate change. This will potentially improve animal production in regions afflicted by adversities, such as severe droughts and acidic, infertile soils, as SL has been shown to be productive under these conditions [1]. By employing a comprehensive methodology encompassing the gathering of empirical data in the field, the use of geospatial analysis techniques, and implementing predictive modeling, this research aims to effectuate a paradigm shift in the agricultural domain, particularly for resource poor farmers. The amalgamation of a SSFM-DSS with geospatial technologies presents a framework that holds promise for fostering sustainable and economically thriving agricultural communities on a global scale.
The objectives to achieve this goal were to:
- Develop a protocol for field data (sample) collection and laboratory analysis for SL yield and nutritional quality quantification.
- Develop a geospatial approach to obtaining data on spatial variables contributing to SL production.
- Develop and validate models (algorithms) using statistics and artificial neural networks to predict SL biomass yield and nutritional quality in the field using geospatial data application so that yield optimization-related site-specific correctional decision support can be developed.
- Develop an automated geospatial model using geospatial parameters like land cover distribution, elevation, soil characteristics, and climatic variation data to determine a SL production spatial suitability map.
- Create a SL Production spatial suitability results dissemination through an interactive WebGIS Dashboard.
3. Materials and Methods
3.1. Rationale, Scope, and Agronomic Advantage of SL Production
Sericea lespedeza growth is a function of precipitation, temperature (especially minimum), and other climatic conditions, soil characteristics, especially pH, plant height, plant density, topography, etc., although it can sustainably grow in drought-prone conditions and areas with a wide range of soil types, including low pH, infertile/marginal soils. It is a homogenous crop, with other plants (weeds) as the only heterogeneity. Therefore, it has the potential to accurate, yield-estimated remote sensing image analyses that can easily differentiate weeds from SL. Although SL is listed as an invasive species in some states, newer cultivars, including AU-Lotan [20] and AU-GrazerTM [21] developed at Auburn University, are non-invasive and hold greater promise for larger scale production through precision agriculture [15]. As discussed earlier, SL is a neutraceutal fodder that prevents growth of internal parasites in ruminants because of the presence of prodelphinidin-type condensed tannins [3,4]. It is a crop that needs less fertilizer application, as it fixes nitrogen into the soil and its deep root system, as compared to other forages and row-crops, take up phosphorous and potassium from subsoil (Horizon B). In the U.S., SL has been grown and used as slope-stabilizing forage on highways since the early 20th century, and in the last decade, it is being researched as a small ruminant fodder in various universities in the southeastern U.S., including Fort Valley State University (FVSU), who are the major contributors to this study [23,24]. Recently, small and large farmers in the tristate of Alabama, Georgia, and South Carolina have joined the research team spearheaded by FVSU to grow SL as a replacement forage for alfalfa (Medicago sativa), bermudagrass (Cynodon dactylon), and other grasses grown for cattle.
3.2. Study Area
Figure 1a shows the locations where SL is found to be grown worldwide, and Figure 1b shows states in the U.S. that have potential of large-scale SL production. A comprehensive experimental study was conducted in a Tristate region, comprising the states of Alabama, Georgia, and South Carolina, in the southeastern U.S. (Figure 2), where 20 farmers participated in researching and growing AL as commercial fodder. The twenty distinct agricultural experimental sites, including FVSU's Agriculture Research Station, were chosen to reflect a wide spectrum of growth conditions. The growth parameters contained various conditions, spanning from the overarching factors of climate and topography to more site-specific fluctuations in soil characteristics. The sites’ topography varied from coastal flat in southern and southeastern Georgia to mountainous terrain topography of northern parts of three states. The soil types varied from piedmont clays in the north to the fertile silty loam soil of southern Georgia. Climate had distinct variation in all 20 sites, the north being colder and with very high precipitations, while the southern sites had lower annual precipitation and higher temperatures. The site elevation varied drastically, with the northern sites more than a thousand meters above sea level and the southern coastal sites a few meters above sea level. The southern sites are more or less within the premise of row-crop agricultural lands, while the northern sites are within the periphery of Appalachian Mountain Forest ranges. For precision agriculture and SSFM-DSS development, such heterogeneity of agronomic conditions was an advantage.
3.3. Data Collection and Processing
3.3.1. Agronomic Importance Geospatial Data Collection
Datasets were used to augment the resilience and specificity of the present investigation. The dataset above encompassed the 2021 iteration of the NLCD (National Land Cover Dataset, https://www.mrlc.gov/data), which underwent a rigorous process of classification and validation using on-ground information. In conjunction with this, a 30-meter Digital Elevation Model (DEM) obtained from USDA-NRCS Geospatial Data Gateway was used (https://datagateway.nrcs.usda.gov/) and yielded significant revelations about topographical intricacies. The acquisition of soil data, a crucial component of these investigations, was obtained from STATSGO, a comprehensive resource allowing state-level suitability mapping. To facilitate a more comprehensive approach to model development at the field level, gSSURGO was used. An additional facet of this investigation entailed employment of Unmanned Aerial Vehicle (UAV), or drone imagery. The acquisition of aerial shots during field sample collections was augmented by the use of downloaded Landsat imageries, resulting in the generation of a comprehensive aerial perspective of the Area of Interest (AOI), where drone imaging was not feasible. In conclusion, the acquisition of real-time environmental parameters, including precipitation, soil moisture, and temperature fluctuations (both minimum and maximum), was achieved using data sourced from the PRISM Climate Center (https://www.prism.oregonstate.edu/) at Oregon State University, and is accessible via the Internet.
3.3.2. Instrumentation and Methodology for Field Sample Collection
Other than the spatial data of agronomic importance, samples were collected by placing a 3.66-meter rope in various points in each field and cutting plant material to 2 cm stubble within the area to determine biomass yield and forage quality components. These sampling locations were selected by the stratified random sampling process, as depicted in Figure 3a,b. Figure 3a shows the stratified random fodder sampling locations as yellow dots on a Drone image collected at an example site. Figure 3b shows the sampling points over a field superimposed by the colored soil (gSSURGO) map of another example site. Based on the inherent variability observed within each field, 5-8 sample collection sites were identified. The precise geographical coordinates of each sample site were recorded and saved with the help of a Global Positioning System (GPS) instrument (Gramin GPS map 64, Part number 010-01199-00, Olathe, Kansas), as shown in Figure 3a,b.
Sericea lespedeza biomass was determined for each of the research fields in the tristate as the representative of the entire field, to obtain the fodder quality and quantity information in-situ, which was correlated with agronomic spatial parameters, as discussed above. The heights of three plants, selected at random, were averaged for each of the specified sampling locations. While process of biomass collection entailed close to the complete removal of the SL forage crop, it was ensured that residual biomass of 5 cm was left to promote subsequent regeneration. The collected sample was then weighed using a hand-held digital scale (AvaWeigh HSD330 Digital hanging scale, PA, USA), with subsamples taken for quality analysis. Samples were frozen, freeze-dried, ground in a Cyclotec Sample Mill (FOSS, CT293, Denmark,) to 1 mm particle size, then subjected to laboratory analysis for evaluation of nutritive value parameters. Quantitative measures of the forage's nutritional profile, including extractable condensed tannin (ECT, %), protein-bound CT (PBCT, %), fiber-bound CT (FBCT, %) and total CT (TCT, %), were conducted. The weights (in Kg) per sampled plot was directly interpreted as the biomass quantity of SL procured from the field. A further analysis involved multiplication of the average plant height with the sampled area of Πr2, where r is the radius of the 3.66 meter rope circumference. An allometric value representing the canopy coverage to stem area ratio is currently under development and will be leveraged with LiDAR data.
3.4. Geospatial Data Acquisition and Processing for Fodder Quality and Quantity Remote Estimation
The acquisition of geospatial data was carried out through a two-tiered method. The geographical coordinates obtained using the GPS during the field sampling process were subsequently extracted and transformed into Point Shapefile with latitude and longitude attributes, commonly used for representing and analyzing spatial data. Furthermore, the polygons that demarcated the growth fields of SL were digitized using the 1m spatial resolution National Agriculture Imagery (NAIP) as the base map (Figure 3a,b). The UAV imageries were collected from most sites and Landsat 8 satellite imageries compensated for the lack of UAV images for digital image formation in order to correlate with the land sustainability. The acquisition of Landsat 8 ensured the obtained data closely corresponded to the specific sampling dates. The data used in this study was obtained from the Earth Explorer platform, maintained by the U.S. Geological Survey (USGS) (https://earthexplorer.usgs.gov/). In addition, a comprehensive collection of raster datasets containing metrics such as the DEM, soil, precipitation, temperature (minimum, maximum, and average), solar radiation, and land cover rasters were projected using the Universal Transverse Mercator (UTM), North American Datum (NAD83) projection system, clipped to the study areas (of each of 20 sites) and resampled to a spatial resolution of 30 m, agreeing with the Landsat 8 imagery. Color Infrared (CIR) imageries comprising of Red, Green, and NIR bands and the Thermal Infrared (TIR) imageries acquired by UAVs at a subset of the 20 sites were processed as above and clipped to the sampling sites of 609.60 cm circumference areas. The processed 30 m spatial resolution agronomic factor rasters were used to develop a comprehensive automated geospatial model to provide SL production spatial suitability decision support. The sample locations’ image-based information, like normalized difference vegetation index (NDVI), soil adjusted vegetation index (SAVI), individual band (Red, Green, NIR, and TIR) information, and other spatial information, like elevation (collected in-situ with GPS instrument), precipitation, temperature (minimum, maximum, and average), and solar radiation were used to develop the SL fodder quality and biomass estimation correlation model.
Figure 4 represents a clipped screenshot of the MS-Excel Table that has the input parameters and the corresponding output parameters that were used to perform the multiple regression model using a MS-Excel Statistical Data Pack and the Radial Basis Function Network (RBFN) model using Neural Ware Professional II Plus software. Figure 5 depicts the RBFN model architecture with input and output neurons (Biomass as single output neuron shown here is an example) for individual output prediction modeling.
3.5. Automated SL Production Spatial Suitability Determination Model in the Tristate
The geospatial data discussed in section 3.4 were acquired and processed for the Tristate study area to develop the SL production suitability model development. The factors (soil loss tolerant factor, explaining soil stability), drainage (explaining the moisture loss), texture (explaining soil fertility, etc.), AWC (available water content, explaining the amount of moisture available on spatial basis), kSat (saturated hydraulic conductivity, explaining the water filtration), and the pH (explaining the acidity level), were developed as spatial raster for the Tristate AOI using the Reclassify tool of ArcGIS software (ESRI, Redlands, CA), as they are soil characteristics that determine crop production spatial variability. The reclassification of gSSURGO data was completed with a Delphi Scaled Value Determination process [16] including a weighted scale value of 1 for least suitable and 5 for most suitable in a scale of 1-5. The Delphi method uses expert opinions to evaluate the relative weightings of individual parameters in the context of decision-support modeling. Various collaborators involved in this research have significantly contributed to determining the scale values assigned to each parameter. A slope map was created using the AOI DEM using the Slope (gradient) tool of ArcGIS. Rest of the AOI rasters were reclassified as the gSSURGO raster to develop the SL production suitability rasters. Figure 6 is the example of all 13 rasters Suitability Scale Values used in the reclassification process.
Figure 7a is the comprehensive automated geospatial model schematic developed ArcGIS Pro (3.2.2) ModelBuilder platform. It explains the geoprocessing tasks, including reclassification, as a flow pattern. At the end, 13 rasters reclassified for SL production suitability were combined as a single raster (SL Production Spatial Suitability Raster) using a similar Delphi method as earlier. The weights assigned by the experts for each of the 13 input parameters in Figure 6 were subsequently aggregated to ascertain relative importance, expressed as a percentage out of 100%, for each parameter. The process entailed the collection of expert opinions and subsequent aggregation of scores, allocating a weight of 5% to each of the seven soil-based parameters, 5% each to the maximum and average temperature parameters, 10% each to minimum temperature and precipitation, 15% for land
3.6. WebGIS Dashboard Development for SSFM-DSS Dissemination
ArcGIS Dashboards enable end-users to obtain information as presented by developers in location-based analytics, using intuitive and interactive data visualizations [20]. Through a dashboard, geographic (spatial) information and data is viewed to monitor events, make decisions, inform others, and see trends. In our case, farmers and other end-users will view and query, on a point click basis, to determine if their intended location is suitable for growing SL with better yield. If the spatial location is not most suitable, it will provide the users information on the agronomic features to modify. Dashboards are designed to display multiple visualizations that work together on a single screen by popping up new windows once clicked on, such as an attribute table. WebGIS Dashboards offer a comprehensive view of the data and provide key insights for at-a-glance decision-making for SL production. The ArcGIS Dashboard (online) software was used to develop the Tristate SL production spatial suitability decision support in map format online. The site has a detailed description of the project, including the comprehensive Model Schematic and the final Tristate SSFM-DSS results as a map (Figure 8).
4. Results and Discussion
4.1. SL Quality and Quantity Remote Estimation
Figure 9a-k are the Suitability Rasters in the context of SL production on a spatial basis. Figure 10a represents the soil drainage types; the excessively or poorly drained soil of each area was considered as of low suitability, and the moderately drained soils area were considered as highly suitable for SL production, as the soil should hold enough moisture to enhance SL growth and yield. The factor of soil (Figure 9b) with higher values were considered as of low suitability, as the soil is more fragile and prone to erosion. Clayey soils (Figure 9c) were scored low, as clay soil will hold water for longer, creating waterlogging conditions, while other soil types were scored for higher production suitability. This was demonstrated in a farmer’s field in northeast Georgia, where planted SL was not growing well at all in an area prone to waterlogging, while an adjacent well-drained area had excellent growth. This research group’s initial soil production suitability analysis for SL production was soil pH, as this was the only parameter available in the UN-FAO soil database for eSwatini in southern Africa, in which, acidic soil was predicted as better for SL production than high pH, basic soil [14]. Figure 9d was classified with scoring based on this premise, with SL production suitability parameters shown in Figure 9g-I with accentuated colored scale values on a spatial basis. As we observed from our field experience that waterlogging is one of the worst factors for SL production, we used kSat (soil hydraulic conductivity, Figure 9e) and available water capacity (AWC; Figure 9f), which were classified with low scores (1 or 2) for higher kSat and AWC values and vice versa. Annual average TMean (Figure 9g) and TMax (Figure 9i) was of a less importance than Tmin (Figure 9h), as prevailing low temperature for long periods creates an impediment for SL growth and for regrowth in subsequent years. Solar radiation annual average data was available from the PRISM Climate Center, and as solar radiation determines evapotranspiration, we used that raster (Figure 9j) and the precipitation raster (Figure 9k) to determine SL production suitability, with higher solar radiation values scored as low suitability and vice versa, while higher and lower precipitation were also scored with low values. We assigned a score of 2 to forest covers and a score of 5 to pasture lands, while assigning the lowest value to wetlands (Figure 9l). Figure 9m explains the slope related SL production suitability. Flat lands were scored 2 because of the chances of waterlogging, and moderately sloping (1-5% slope) land were assigned the highest score of 5.
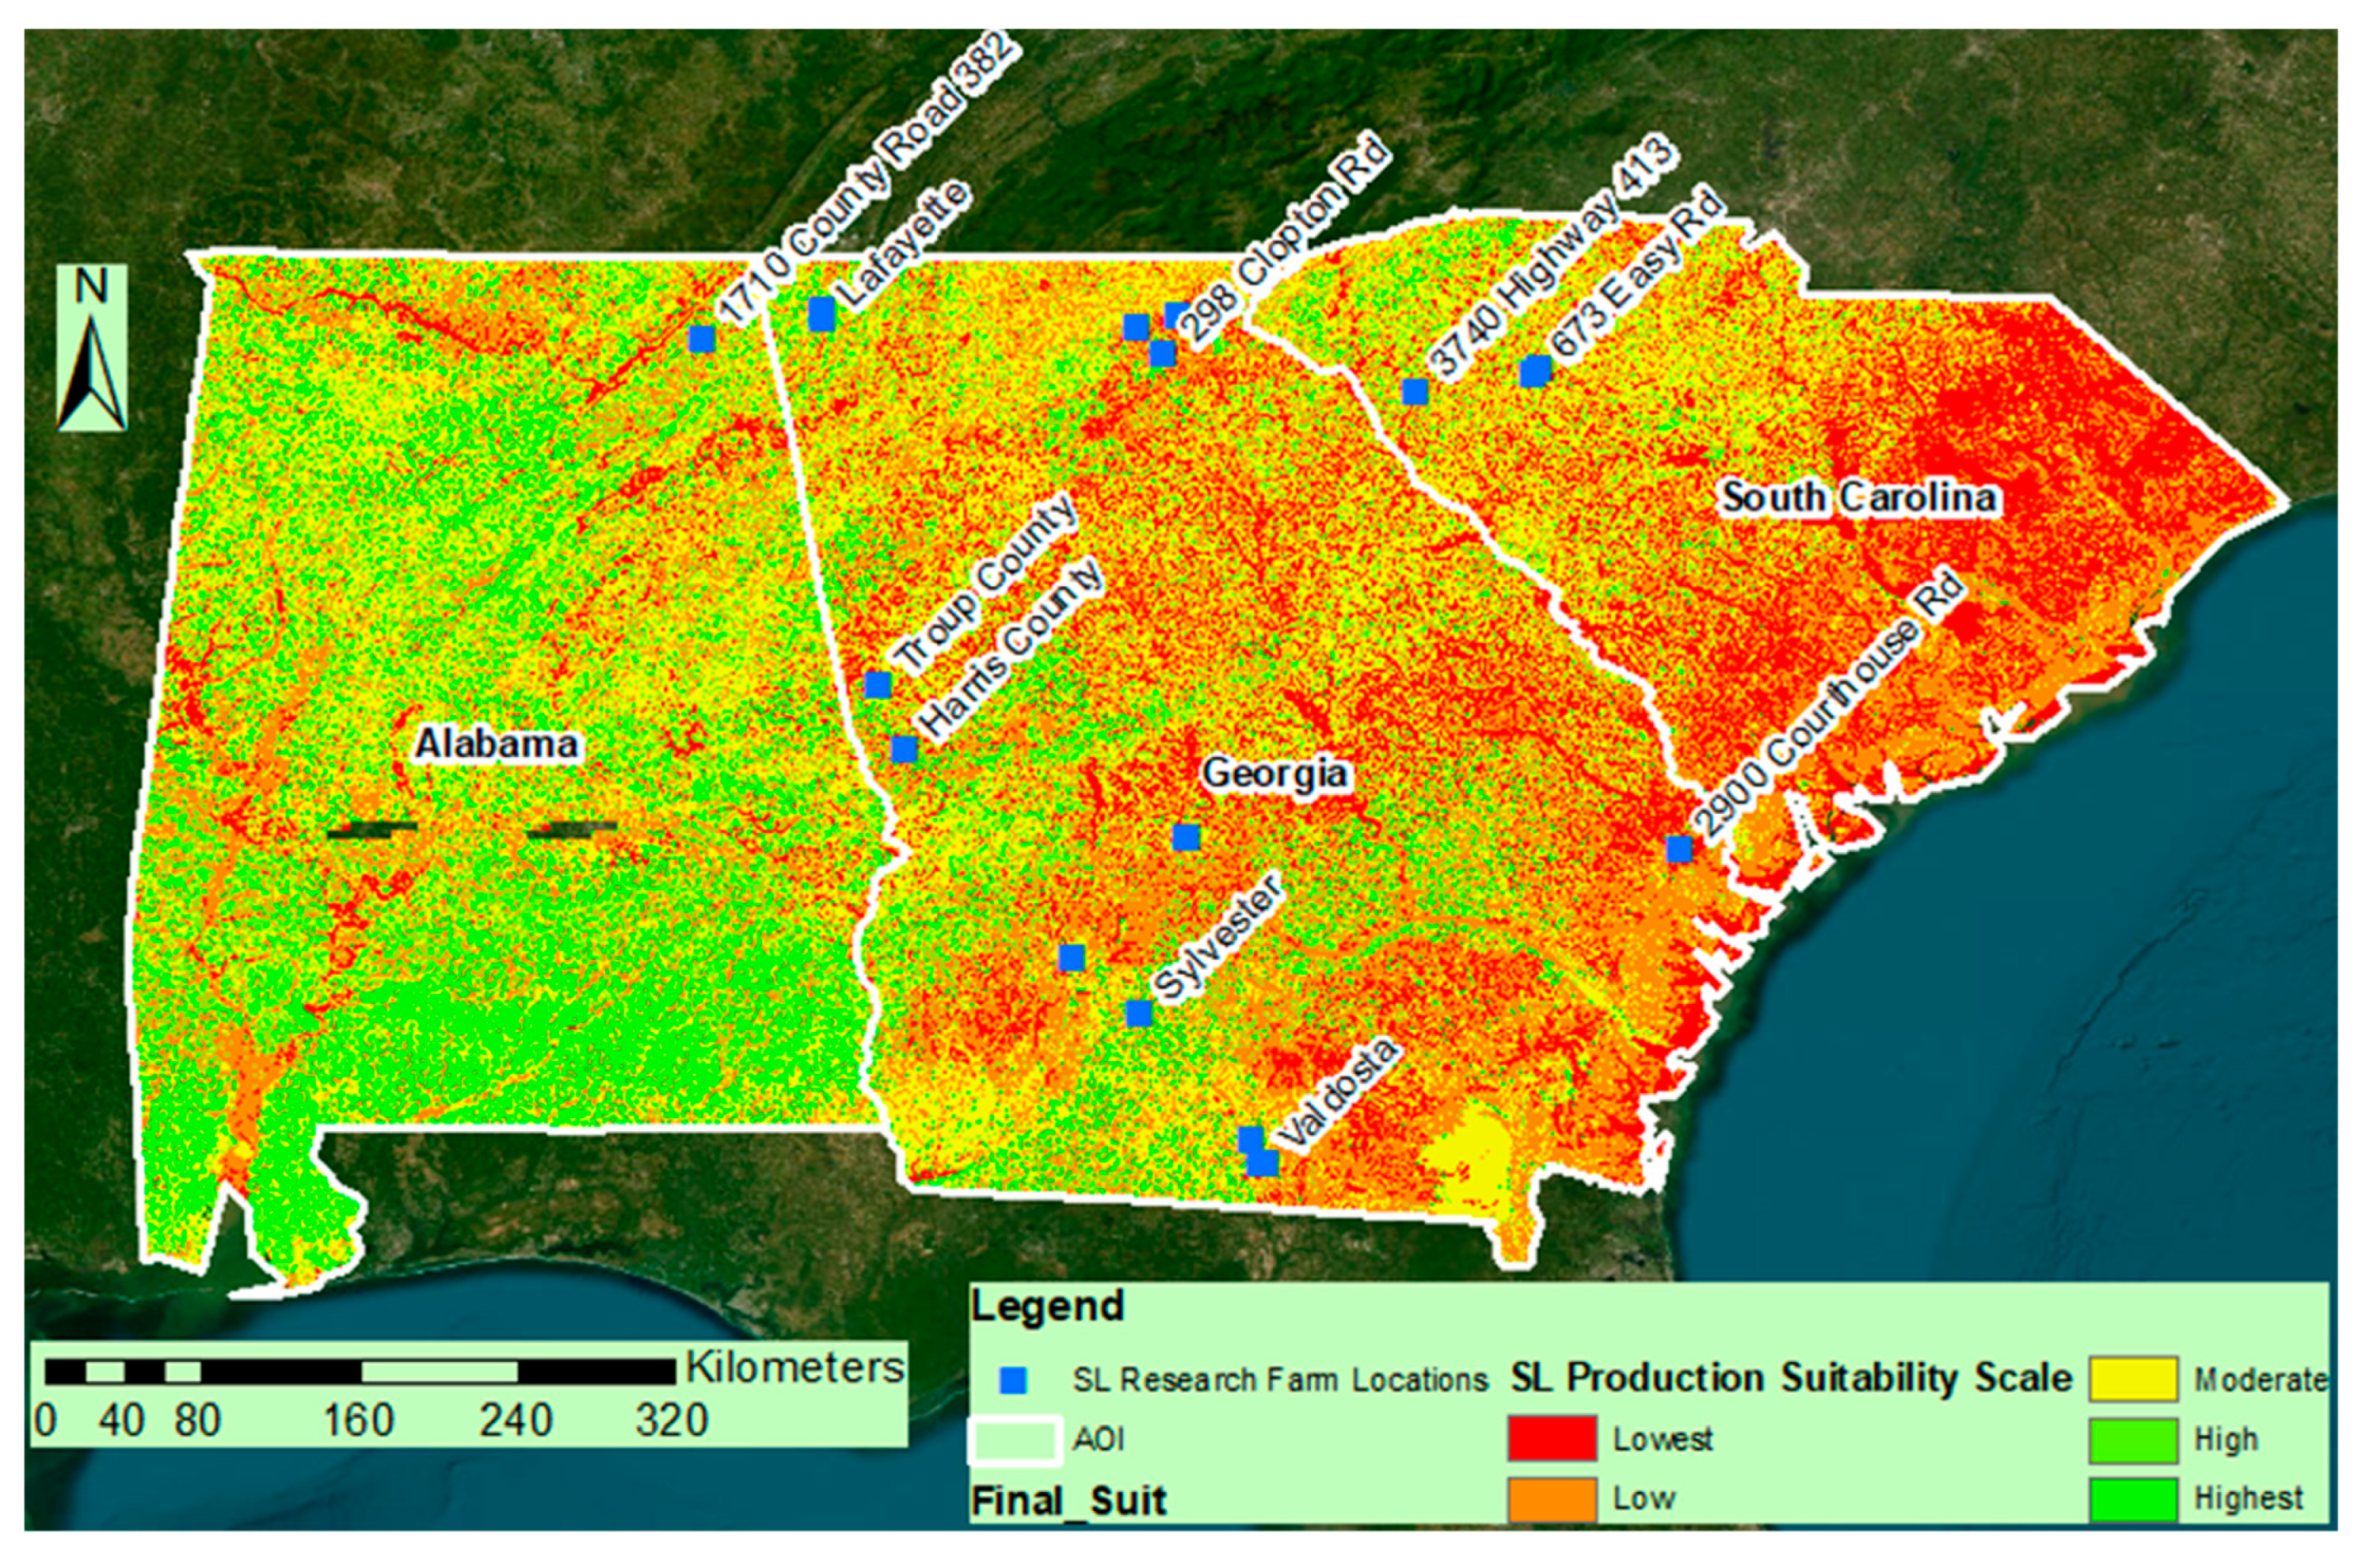
All these factors in the form of Suitability Rasters were combined into the final SL production suitability raster. Figure 10 is the visual representation of the SL fodder production suitability in the states of Alabama, Georgia, and South Carolina. Coastal areas of the Tristate and row-crop agricultural areas were analyzed as the lowest suitable areas for SL production because coastal areas are prone to flooding and row-crop areas were not considered for SL as a replacement crop. Pasture, herbaceous, and shrub lands in the AOI were the most suitable spatial locations for growing SL optimally, since, with less investment and resources use, SL can be grown sustainably in those spatial locations. All 20 on-farm research sites (marked on the raster map) that are successfully growing SL are in spatial locations with a score of 4 and 5, and this supports our model results. The ArcGIS dashboard has already been developed as part of this initiative, for WebDSS (Figure 8) for farmers and other end-users to access decision support for either growing SL, or not.
Statistical multivariate analysis with NDVI mean and standard deviation, SAVI mean and standard deviation, elevation, average precipitation, minimum and maximum temperatures, and Band 10 (TIR) mean and standard deviation used as mean values for 41 sampling location points as input parameters yielded a moderate correlation with an R2 value (coefficient of determination) of 0.54 and standard error of 0.736 kg (18%) for SL biomass estimation. Precipitation, elevation mean, SAVI Mean, and minimum and maximum temperature means were the best predictors of SL biomass yield, with R2 values of 0.68, 0.66, 0.36, 0.35, and 0.34, respectively, while the remaining three were the least relevant factors. This was in line with our hypothesis, as discussed above. The RBFN modeling approach yielded an average prediction accuracy of 86% and 80.5% for the training and testing/validation models, respectively. The ANN application has promise for remote estimation of SL biomass using remote sensing and other environmental rasters using satellite imageries combined with in-situ data.
5. Summary & Conclusion
The study introduces a novel method for agricultural operations using SSFM for SL production. This approach is advantageous for farmers who have limited resources, regardless of whether they are in developing or developed countries. It highlights the ability of agriculture to adapt to environmental and technological changes. The project promotes sustainability in fodder management by using advanced geospatial technologies such as GIS, remote sensing, and GNSS, which improve the understanding of SL's growth patterns, nutritional qualities, and biomass prediction capabilities.
The increasing significance of SL is evident in locations like the southeastern U.S., where restricted land ownership and changing environmental conditions are driving a shift towards small ruminant farming. This plant species is becoming more acknowledged for its capacity to withstand adverse climatic conditions and offer ample nourishment for livestock. This paper presents an innovative approach that combines field data, predictive modeling, and advanced technology to create a comprehensive DSS. This system can fundamentally transform agricultural practices and methods, surpassing the mere improvement of animal feed output.
An accomplishment of the study is the re-evaluation of SL, shifting how it is viewed, from being an invasive species to being a valuable agricultural resource. Its nutritional composition and ability to flourish in unfavorable environmental circumstances justify its categorization. The study developed a strategy based on an SSFM-DSS for SL, intending to enhance animal output in regions affected by drought and unproductive soils. This approach entails a comprehensive procedure for gathering data, which includes collecting samples from the field, conducting laboratory analysis, and using geospatial data to create a map that identifies the most optimal areas for SL production.
An innovative aspect of this research is the application of automated geospatial models and the development of a WebGIS Dashboard for sharing information. This approach enables farmers to make well-informed decisions regarding SL agriculture by considering soil stability, moisture levels, fertility, and climate fluctuations. The study also highlights the importance of SL in contemporary agriculture, serving not only as a drought-resistant and nutritionally dense animal feed with anti-parasitic qualities, but also as a crucial component in attaining sustainable livestock production.
The effective execution of SSFM-DSS demonstrates its potential capacity to improve agricultural output and sustainability for both emerging and developed countries. The study proposes the integration of SSFM with advanced technical advancements to create an agricultural landscape that is both efficient and sustainable. This integration is expected to provide significant advantages to farmers in different geographical and economic settings.
Author Contributions
S.S.P., as the first author of this original research, conceptualized the research methodology in consultations with the entire research team participating in this manuscript as co-authors. S.S.P. completed the data collection, processing, analyses, and geospatial model development, along with WebGIS dashboard development of this research. T.H.T. and A.K.M. provided technical help on geospatial data accuracy assessment and ground truthing, supported the Delphi-based study and modeling, and reviewed the manuscript. J.A.v.W. and E.R.M. participated in the Delphi process of SL production input parameter weight development. They reviewed the manuscript and provided technical assistance that were necessary for the completion of the research as they were involved in an earlier study of Eswatini. A.S. and A.A.P.-C. provided the review and correction of manuscript. All authors have read and agreed to the published version of the manuscript.
Institutional Review Board Statement
Ethical review and approval were not applicable for this study as there were no human or animal subjects involved.
Data Availability Statement
The data presented in this study are available on request from the corresponding author.
Acknowledgments
This work was not supported by any external funding. The University of North Georgia – Gainesville Campus Institute for Environmental Spatial Analysis' undergraduate cohort contributed to acquiring and evaluating satellite and aerial imagery using unmanned aerial vehicles.
Conflicts of Interest
The authors declare no conflict of interest.
References
- Hoveland CS, Windham WR, Boggs DL, Durham RG, Calvert GV, Newsome JF, Owsley M. Sericea lespedeza production in Georgia. Research Bulletin Georgia Agricultural Experiment Stations. 1990;(393). Available from: https://www.cabdirect.org/cabdirect/abstract/19900738785.
- Terrill TH, Miller JE, Burke JM, Mosjidis JA, Kaplan RM. Experiences with integrated concepts for the control of Haemonchus contortus in sheep and goats in the United States. Vet Parasitol. 2012;186(1-2):28-37. [CrossRef]
- Kommuru DS, Barker T, Desai S, Burke JM, Ramsay A, Mueller-Harvey I, Miller JE, Mosjidis JA, Kamisetti N, Terrill TH. Use of pelleted sericea lespedeza (Lespedeza cuneata) for natural control of coccidia and gastrointestinal nematodes in weaned goats. Vet Parasitol. 2014;204(3-4):191-198. [CrossRef]
- Mechineni A, Kommuru DS, Gujja S, Mosjidis JA, Miller JE, Burke JM, Ramsay A, Mueller-Harvey I, Kannan G, Lee JH, Kouakou B. Effect of fall-grazed sericea lespedeza (Lespedeza cuneata) on gastrointestinal nematode infections of growing goats. Vet Parasitol. 2014;204(3-4):221-228. [CrossRef]
- Kommuru DS, Whitley NC, Miller JE, Mosjidis JA, Burke JM, Gujja S, Terrill TH. Effect of sericea lespedeza leaf meal pellets on adult female Haemonchus contortus in goats. Vet Parasitol. 2015;207(1-2):170-175. [CrossRef]
- Burke JM, Miller JE, Terrill TH, Orlik ST, Acharya M, Garza JJ, Mosjidis JA. Sericea lespedeza as an aid in the control of Emeria spp. in lambs. Vet Parasitol. 2013;193(1-3):39-46.
- Naumann HD, Tedeschi LO, Muir JP, Lambert BD, Kothmann MM. Effect of molecular weight of condensed tannins from warm-season perennial legumes on ruminal methane production in vitro. Biochem Syst Ecol. 2013;50:154-162. [CrossRef]
- Littlefield KA, Muir JP, Lambert BD, Tomberlin JK. Condensed tannins inhibit house fly (Diptera: Muscidae) development in livestock manure. J Environ Entomol. 2011;40:1572–1576. [CrossRef]
- Min BR, Pinchak WE, Merkel R, Walker S, Tomita G, Anderson RC. Comparative antimicrobial activity of tannin extracts from perennial plants on mastitis pathogens. Sci Res Essays. 2008;3(2):066-073.
- Angelakιs AN, Zaccaria D, Krasilnikoff J, Salgot M, Bazza M, Roccaro P, Fereres E. Irrigation of world agricultural lands: Evolution through the millennia. Water. 2020;12(5):1285. [CrossRef]
- Hemathilake DMKS, Gunathilake DMCC. Agricultural productivity and food supply to meet increased demands. In: Future Foods. Academic Press; 2022. p. 539-553.
- Antony AP, Leith K, Jolley C, Lu J, Sweeney DJ. A review of practice and implementation of the Internet of Things (IoT) for smallholder agriculture. Sustainability. 2020;12(9):3750. [CrossRef]
- Dorji N, Yamazaki S, Thinley P. Productivity improvement to sustain small-scale fish production in developing countries: The case of Bhutan. Aquaculture. 2022;548:737612. [CrossRef]
- Panda SS, Terrill TH, Mahapatra AK, Kelly B, Morgan ER, Wyk JAV. Site-specific forage management of sericea lespedeza: Geospatial technology-based forage quality and yield enhancement model development. Agriculture. 2020;10(9):419. [CrossRef]
- Panda SS, Terrill TH, Mahapatra AK, Morgan ER, Siddique A, Pech-Cervantes AA, van Wyk JA. Optimizing sericea lespedeza fodder production in the southeastern US: A climate-informed geospatial engineering approach. Agriculture. 2023;13:1661. [CrossRef]
- Panda S, Terrill T, Mahapatra AK, Morgan E, Siddique A, Pech-Cervantes AA, Van Wyk J. Geospatial engineering and technology supported climate sensitive sericea lespedeza fodder production suitability analysis modeling in the southeastern United States. In: 2023 IST-Africa Conference (IST-Africa); IEEE. p. 1-12.
- Shaik SA, Terrill TH, Miller JE, Kouakou B, Kannan G, Kaplan RM, Mosjidis JA. Sericea lespedeza hay is a natural deworming agent against gastrointestinal nematode infection in goats. Vet Parasitol. 2006;139(1-3):150–157. [CrossRef]
- Panda SS, Hoogenboom G, Paz JO. Remote sensing and geospatial technological applications for site-specific management of fruit and nut crops: A review. Remote Sens. 2010;2(8):1973-1997. [CrossRef]
- Christian JI, Basara JB, Hunt ED, Otkin JA, Furtado JC, Mishra V, Randall RM. Global distribution, trends, and drivers of flash drought occurrence. Nat Commun. 2021;12(1):6330. [CrossRef]
- Donnelly ED. Registration of AU Lotan sericea lespedeza (Reg. No. 11). Crop Sci. 1981;21:474.
- Mosjidis JA. Registration of ‘AU Grazer’ sericea lespedeza. Crop Sci. 2001;41:262.
- Szukalski B. Create your first dashboards using ArcGIS Dashboards. Available from: https://www.esri.com/arcgis-blog/products/ops-dashboard/mapping/create-first-arcgis-dashboards/. Accessed on November 15, 2023.
- Silva SR, Sacarrão-Birrento L, Almeida M, Ribeiro DM, Guedes C, Gonzalez Montana JR, de Almeida AM. Extensive sheep and goat production: The role of novel technologies towards sustainability and animal welfare. Animals. 2022;12(7):885.
- Walder MR. Takeover on the tallgrass prairie: How Lespedeza cuneata establishes dominance. Illinois State University; 2017.
- Besharati M, Maggiolino A, Palangi V, Kaya A, Jabbar M, Eseceli H, Lorenzo JM. Tannin in ruminant nutrition. Molecules. 2022;27(23):8273. [CrossRef]
Figure 1.
(a) Places of the world where sericea lespedeza is grown (Source: https://www.discoverlife.org/mp/20q?search=Lespedeza+cuneata) and (b) Places in the U.S. where SL is currently found (Source: University of Georgia - Center for Invasive Species and Ecosystem Health; Early Detection & Distribution Mapping System. Available online at https://www.eddmaps.org/; last accessed November 15, 2023).
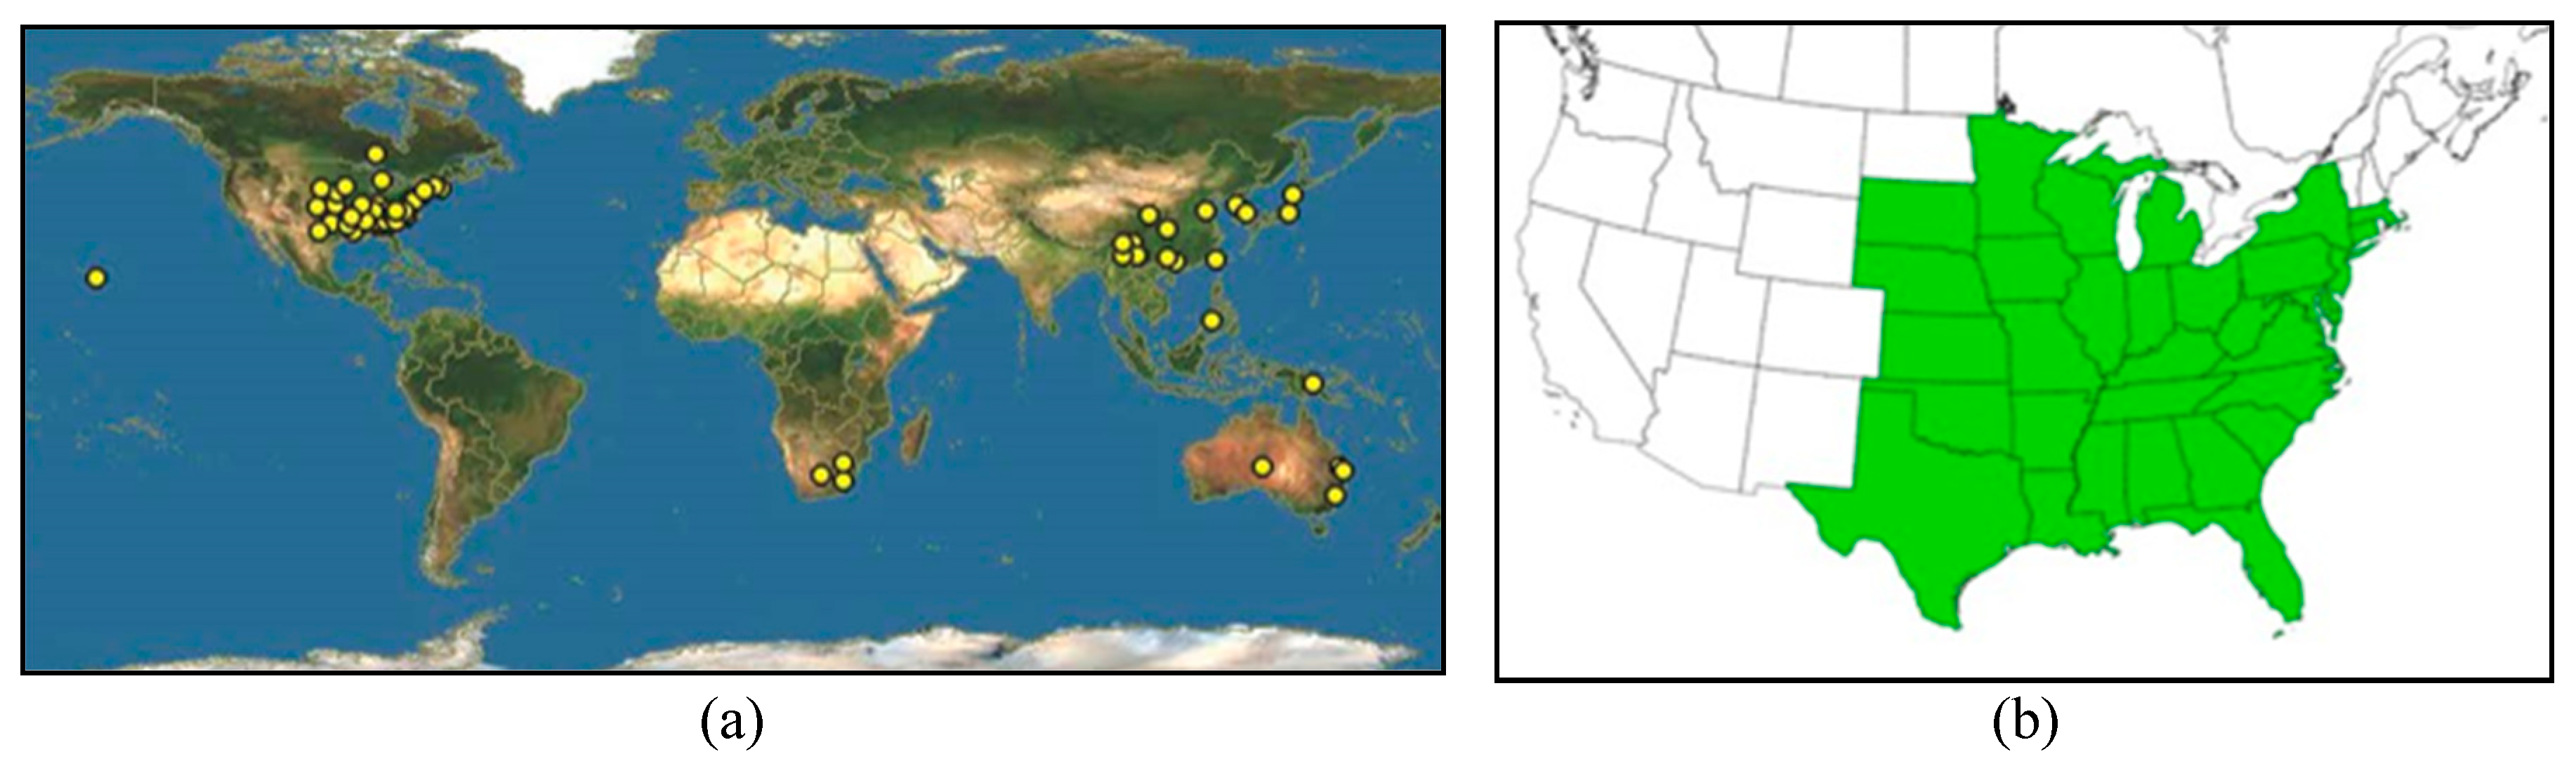
Figure 2.
Twenty research sites in Alabama, Georgia, and South Carolina (from left to right) in the southeastern United States are marked by dots, representing where sericea lespedeza is currently grown. This includes a site at Fort Valley State University, GA, in the center.
Figure 2.
Twenty research sites in Alabama, Georgia, and South Carolina (from left to right) in the southeastern United States are marked by dots, representing where sericea lespedeza is currently grown. This includes a site at Fort Valley State University, GA, in the center.
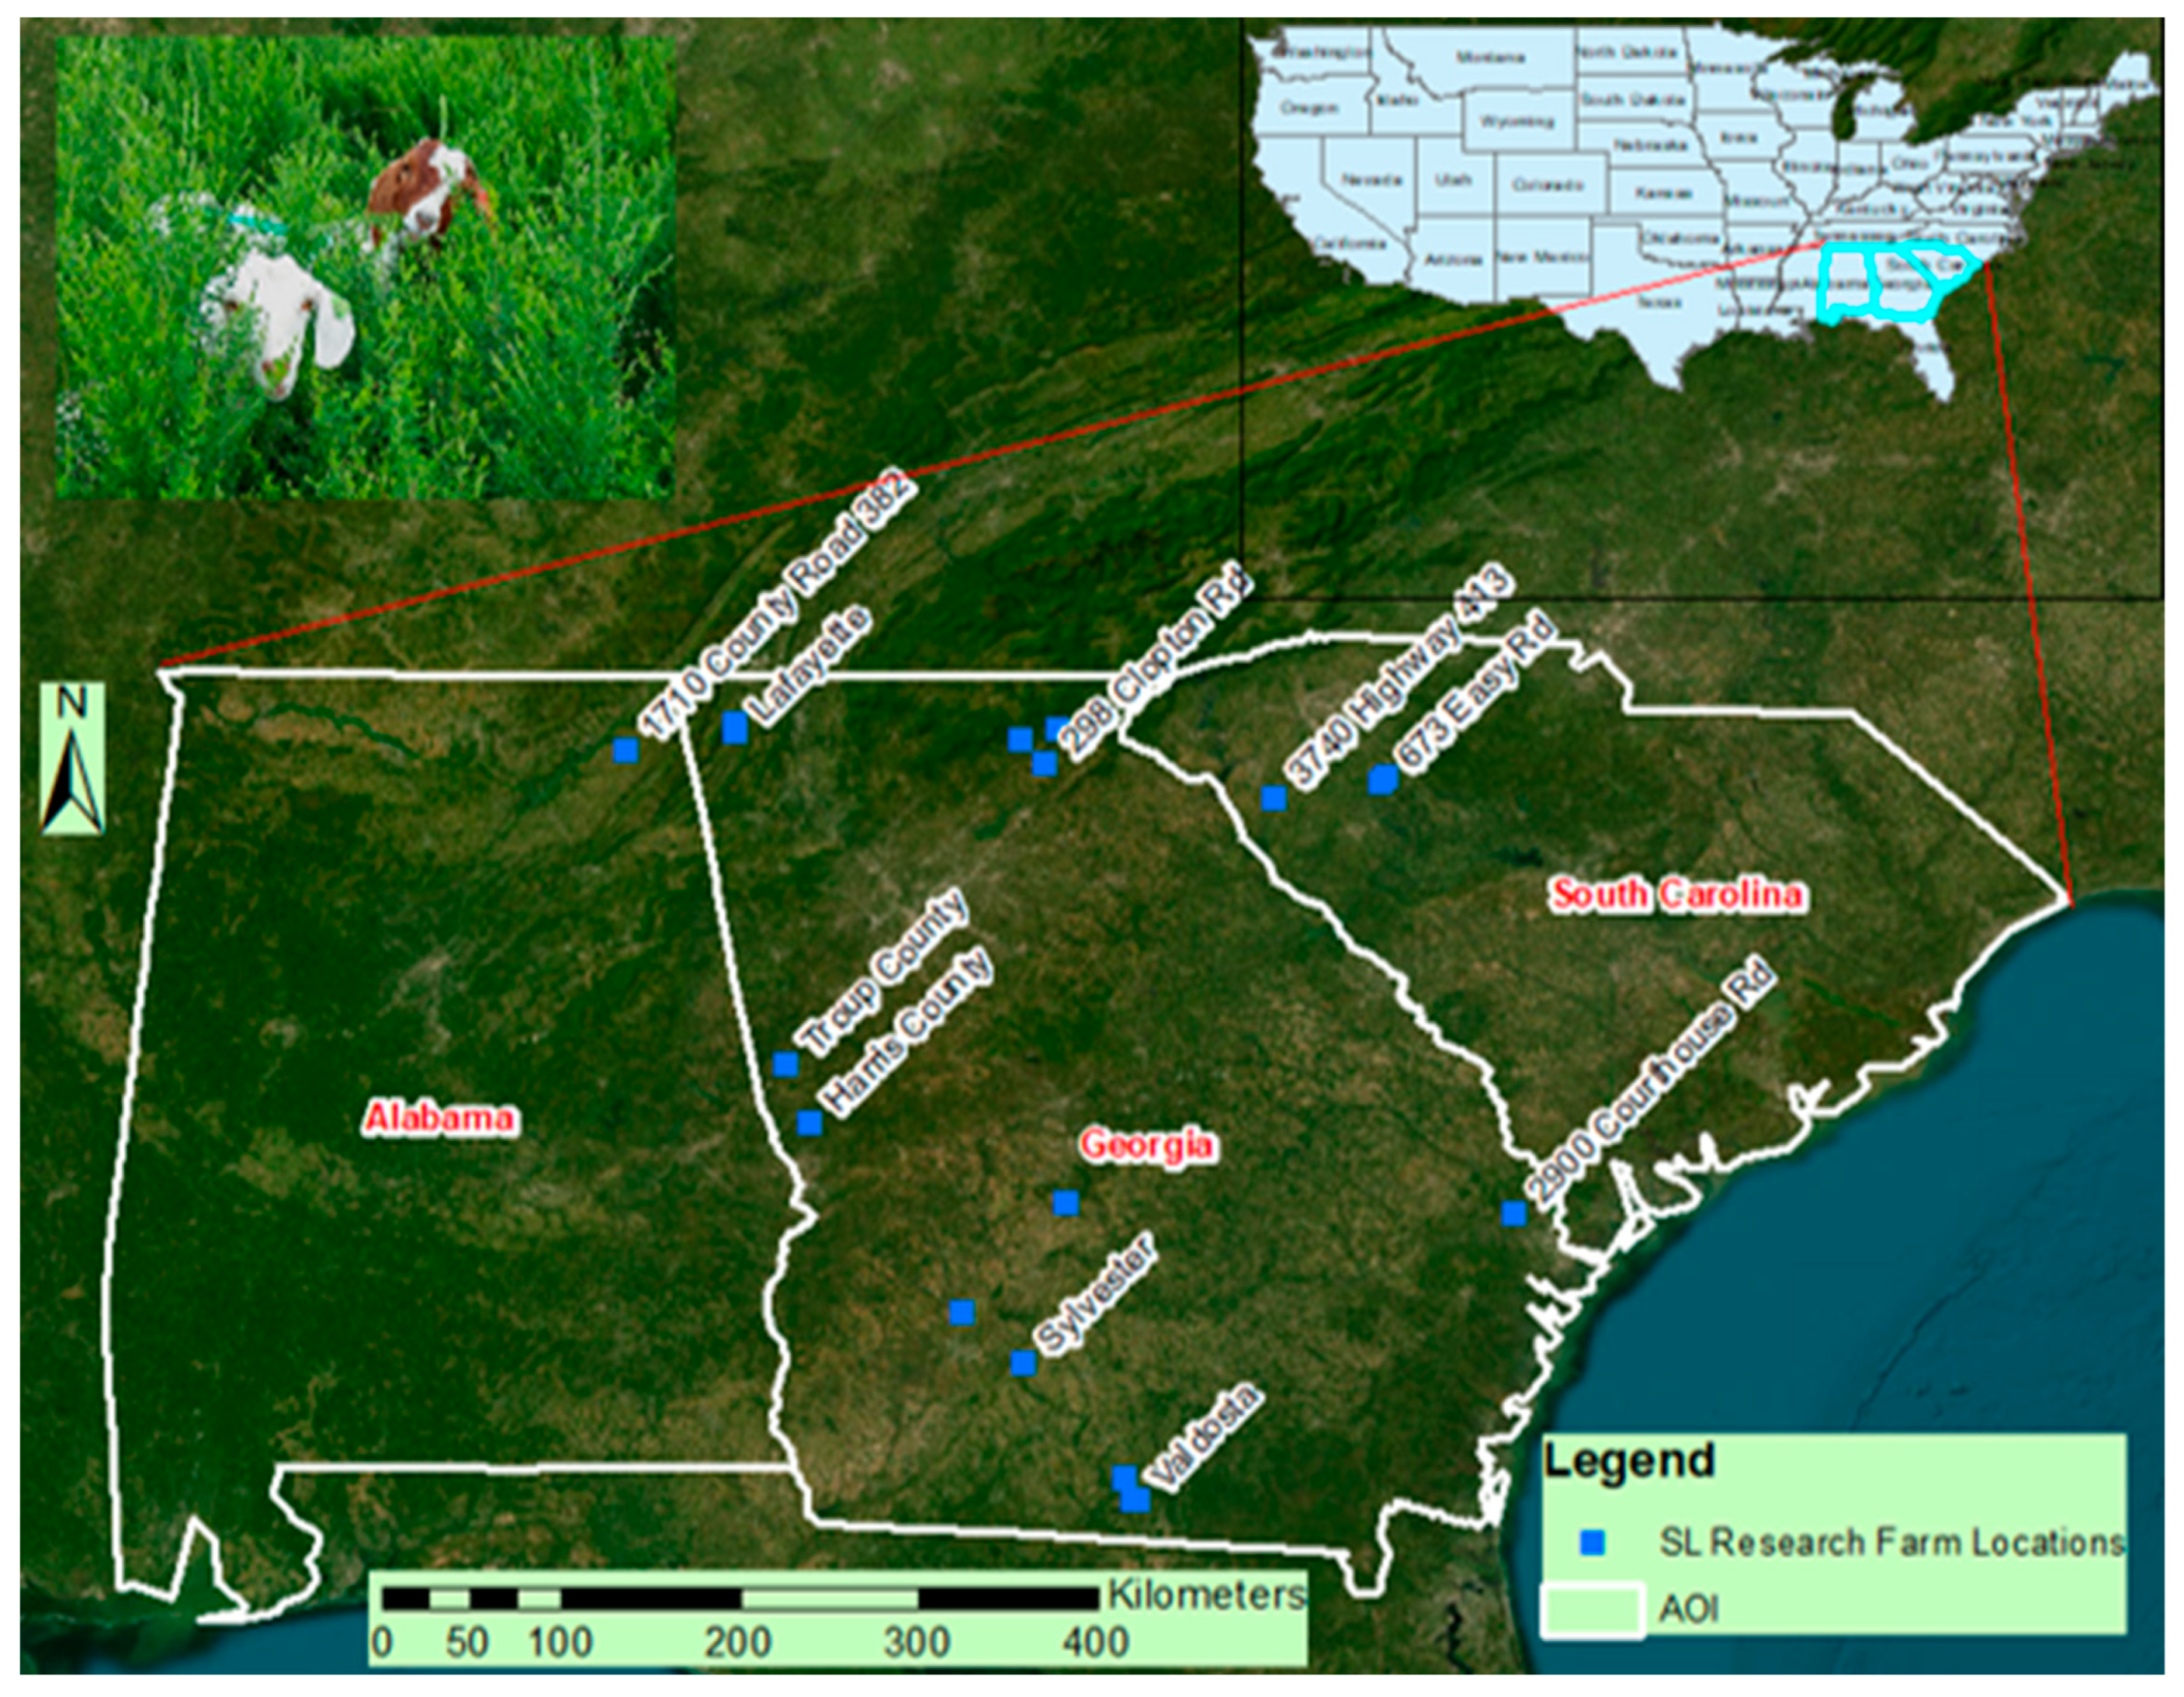
Figure 3.
Representation of the stratified random sampling for GPS points on sites of sericea lespedeza production (a) over UAV collected and processed image and (b) gSSURGO soil spatial distribution superimposed site map.
Figure 3.
Representation of the stratified random sampling for GPS points on sites of sericea lespedeza production (a) over UAV collected and processed image and (b) gSSURGO soil spatial distribution superimposed site map.
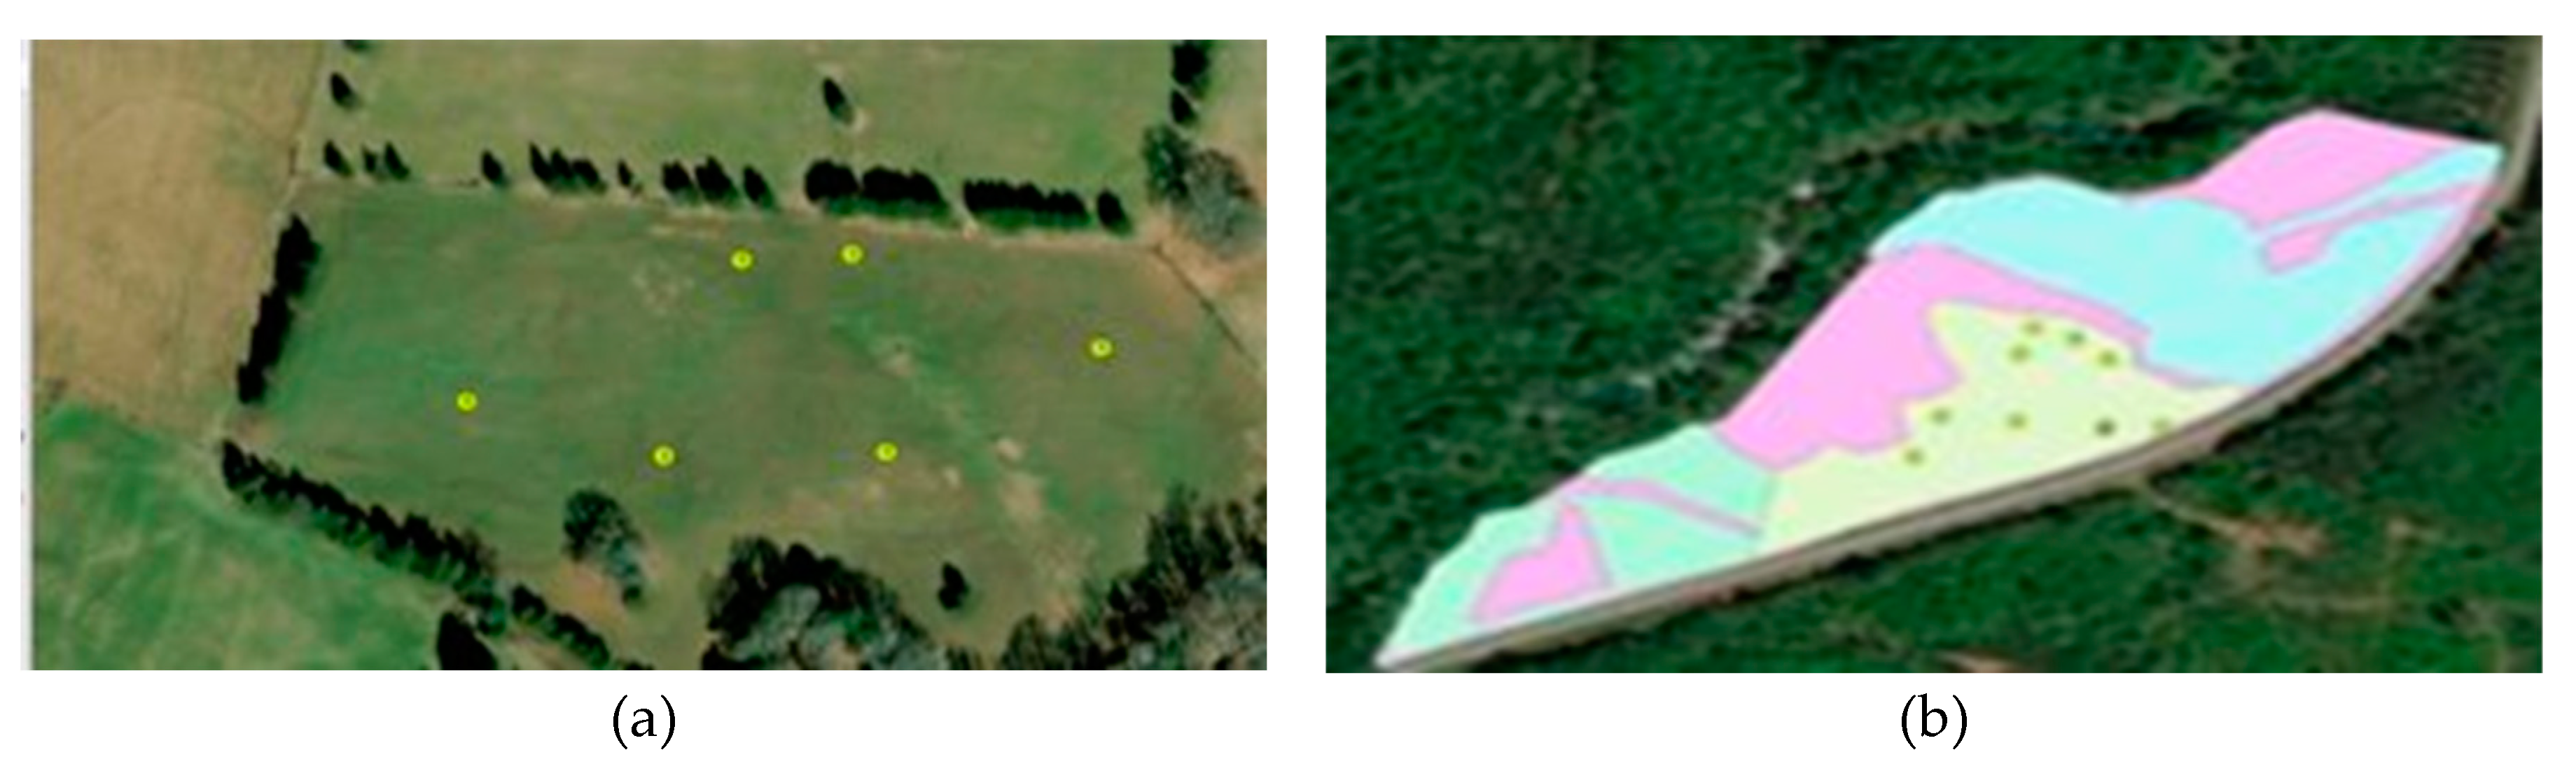
Figure 4.
Clipped screenshot of the MS-Excel database developed to estimate variations in SL crop quality and quantity parameters, using MS-Excel Statistics Tool Pack.
Figure 4.
Clipped screenshot of the MS-Excel database developed to estimate variations in SL crop quality and quantity parameters, using MS-Excel Statistics Tool Pack.
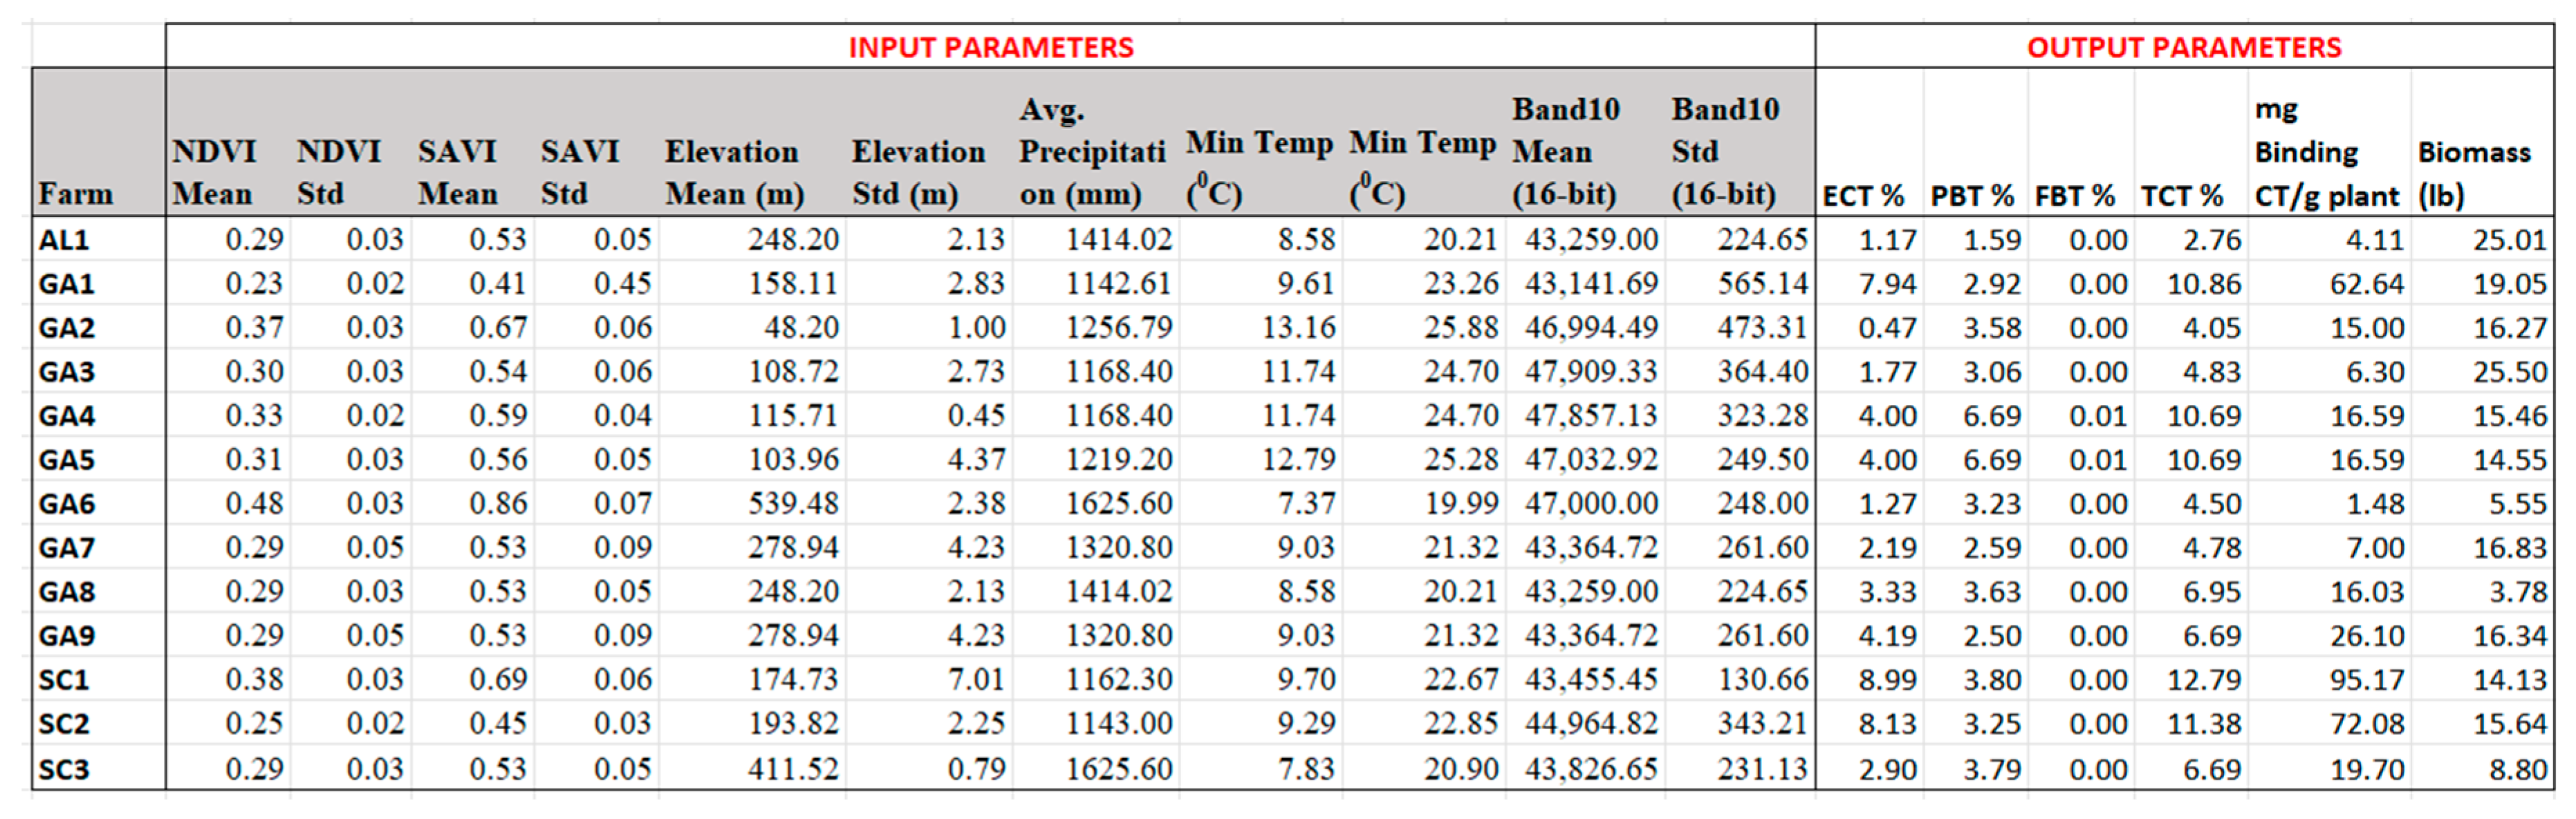
Figure 5.
RBFN model architecture to estimate variations in sericea lespedeza crop quality and quantity parameters using ANN software.
Figure 5.
RBFN model architecture to estimate variations in sericea lespedeza crop quality and quantity parameters using ANN software.
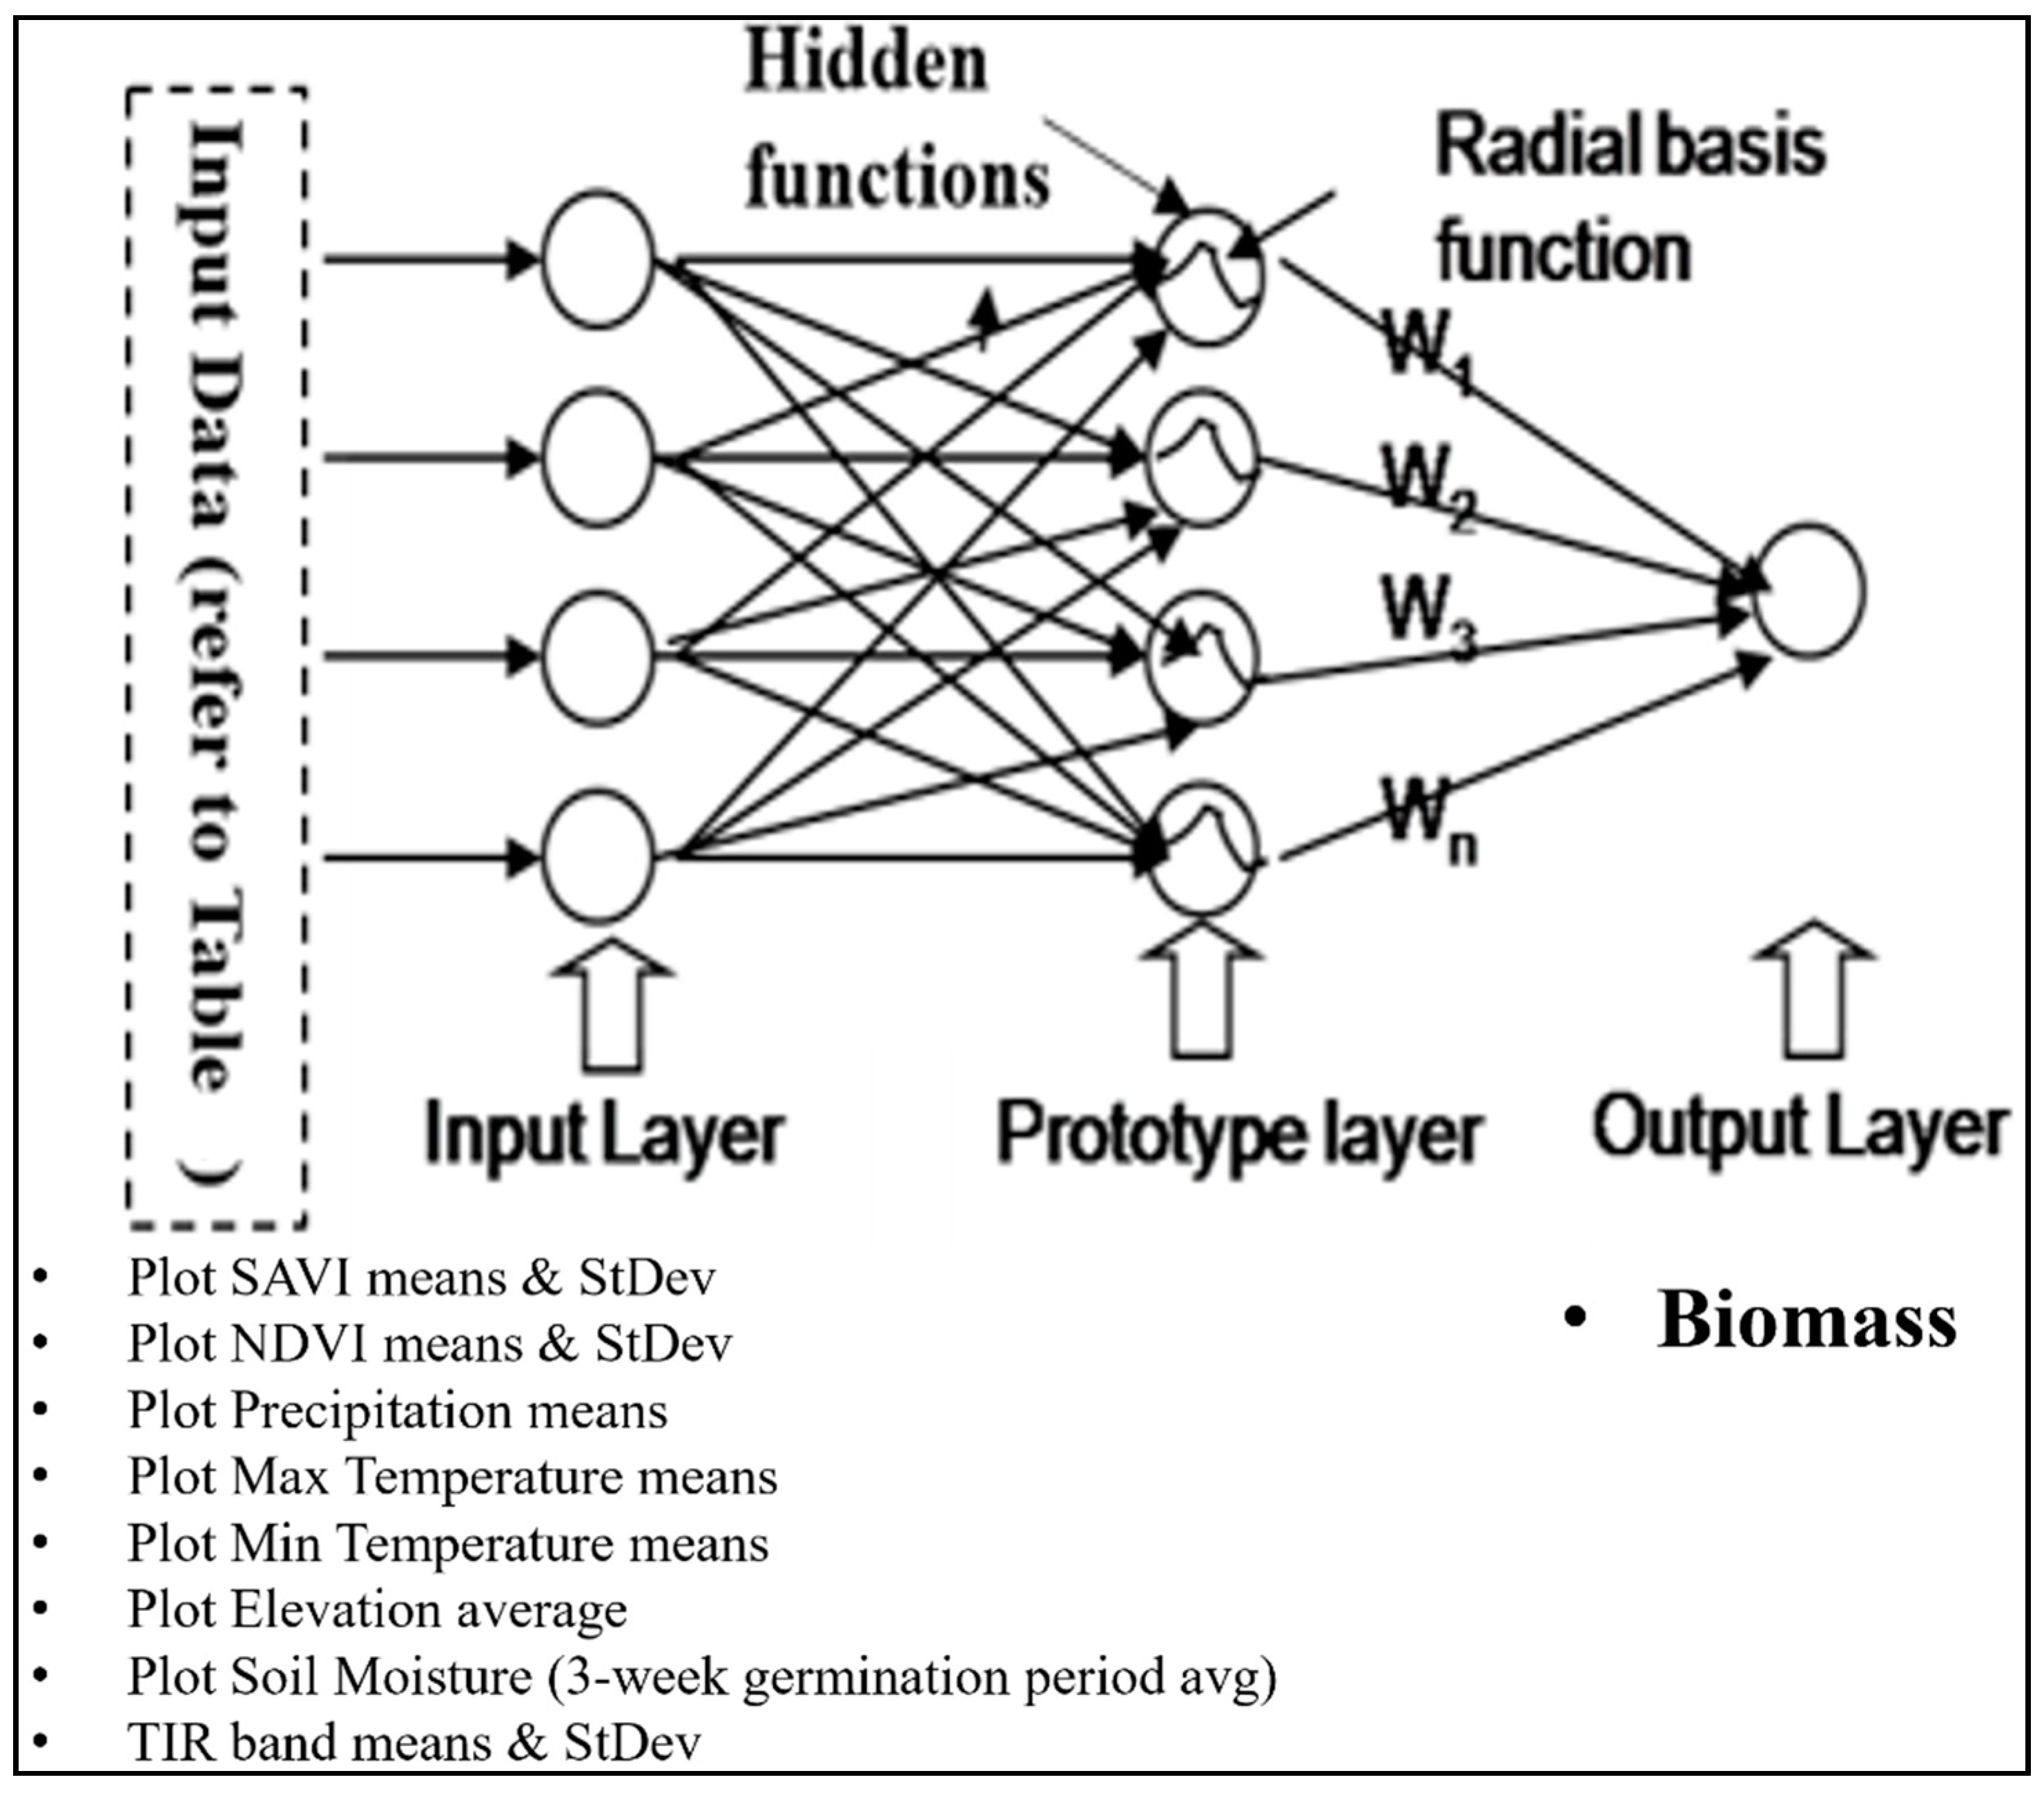
Figure 6.
The Delphi-based sericea lespedeza production suitability scale values on a scale of 1 (Least Suitable) and 5 (Most Suitable) of all 13 rasters, with each parameter shown in its corresponding Input Raster Text Box.
Figure 6.
The Delphi-based sericea lespedeza production suitability scale values on a scale of 1 (Least Suitable) and 5 (Most Suitable) of all 13 rasters, with each parameter shown in its corresponding Input Raster Text Box.
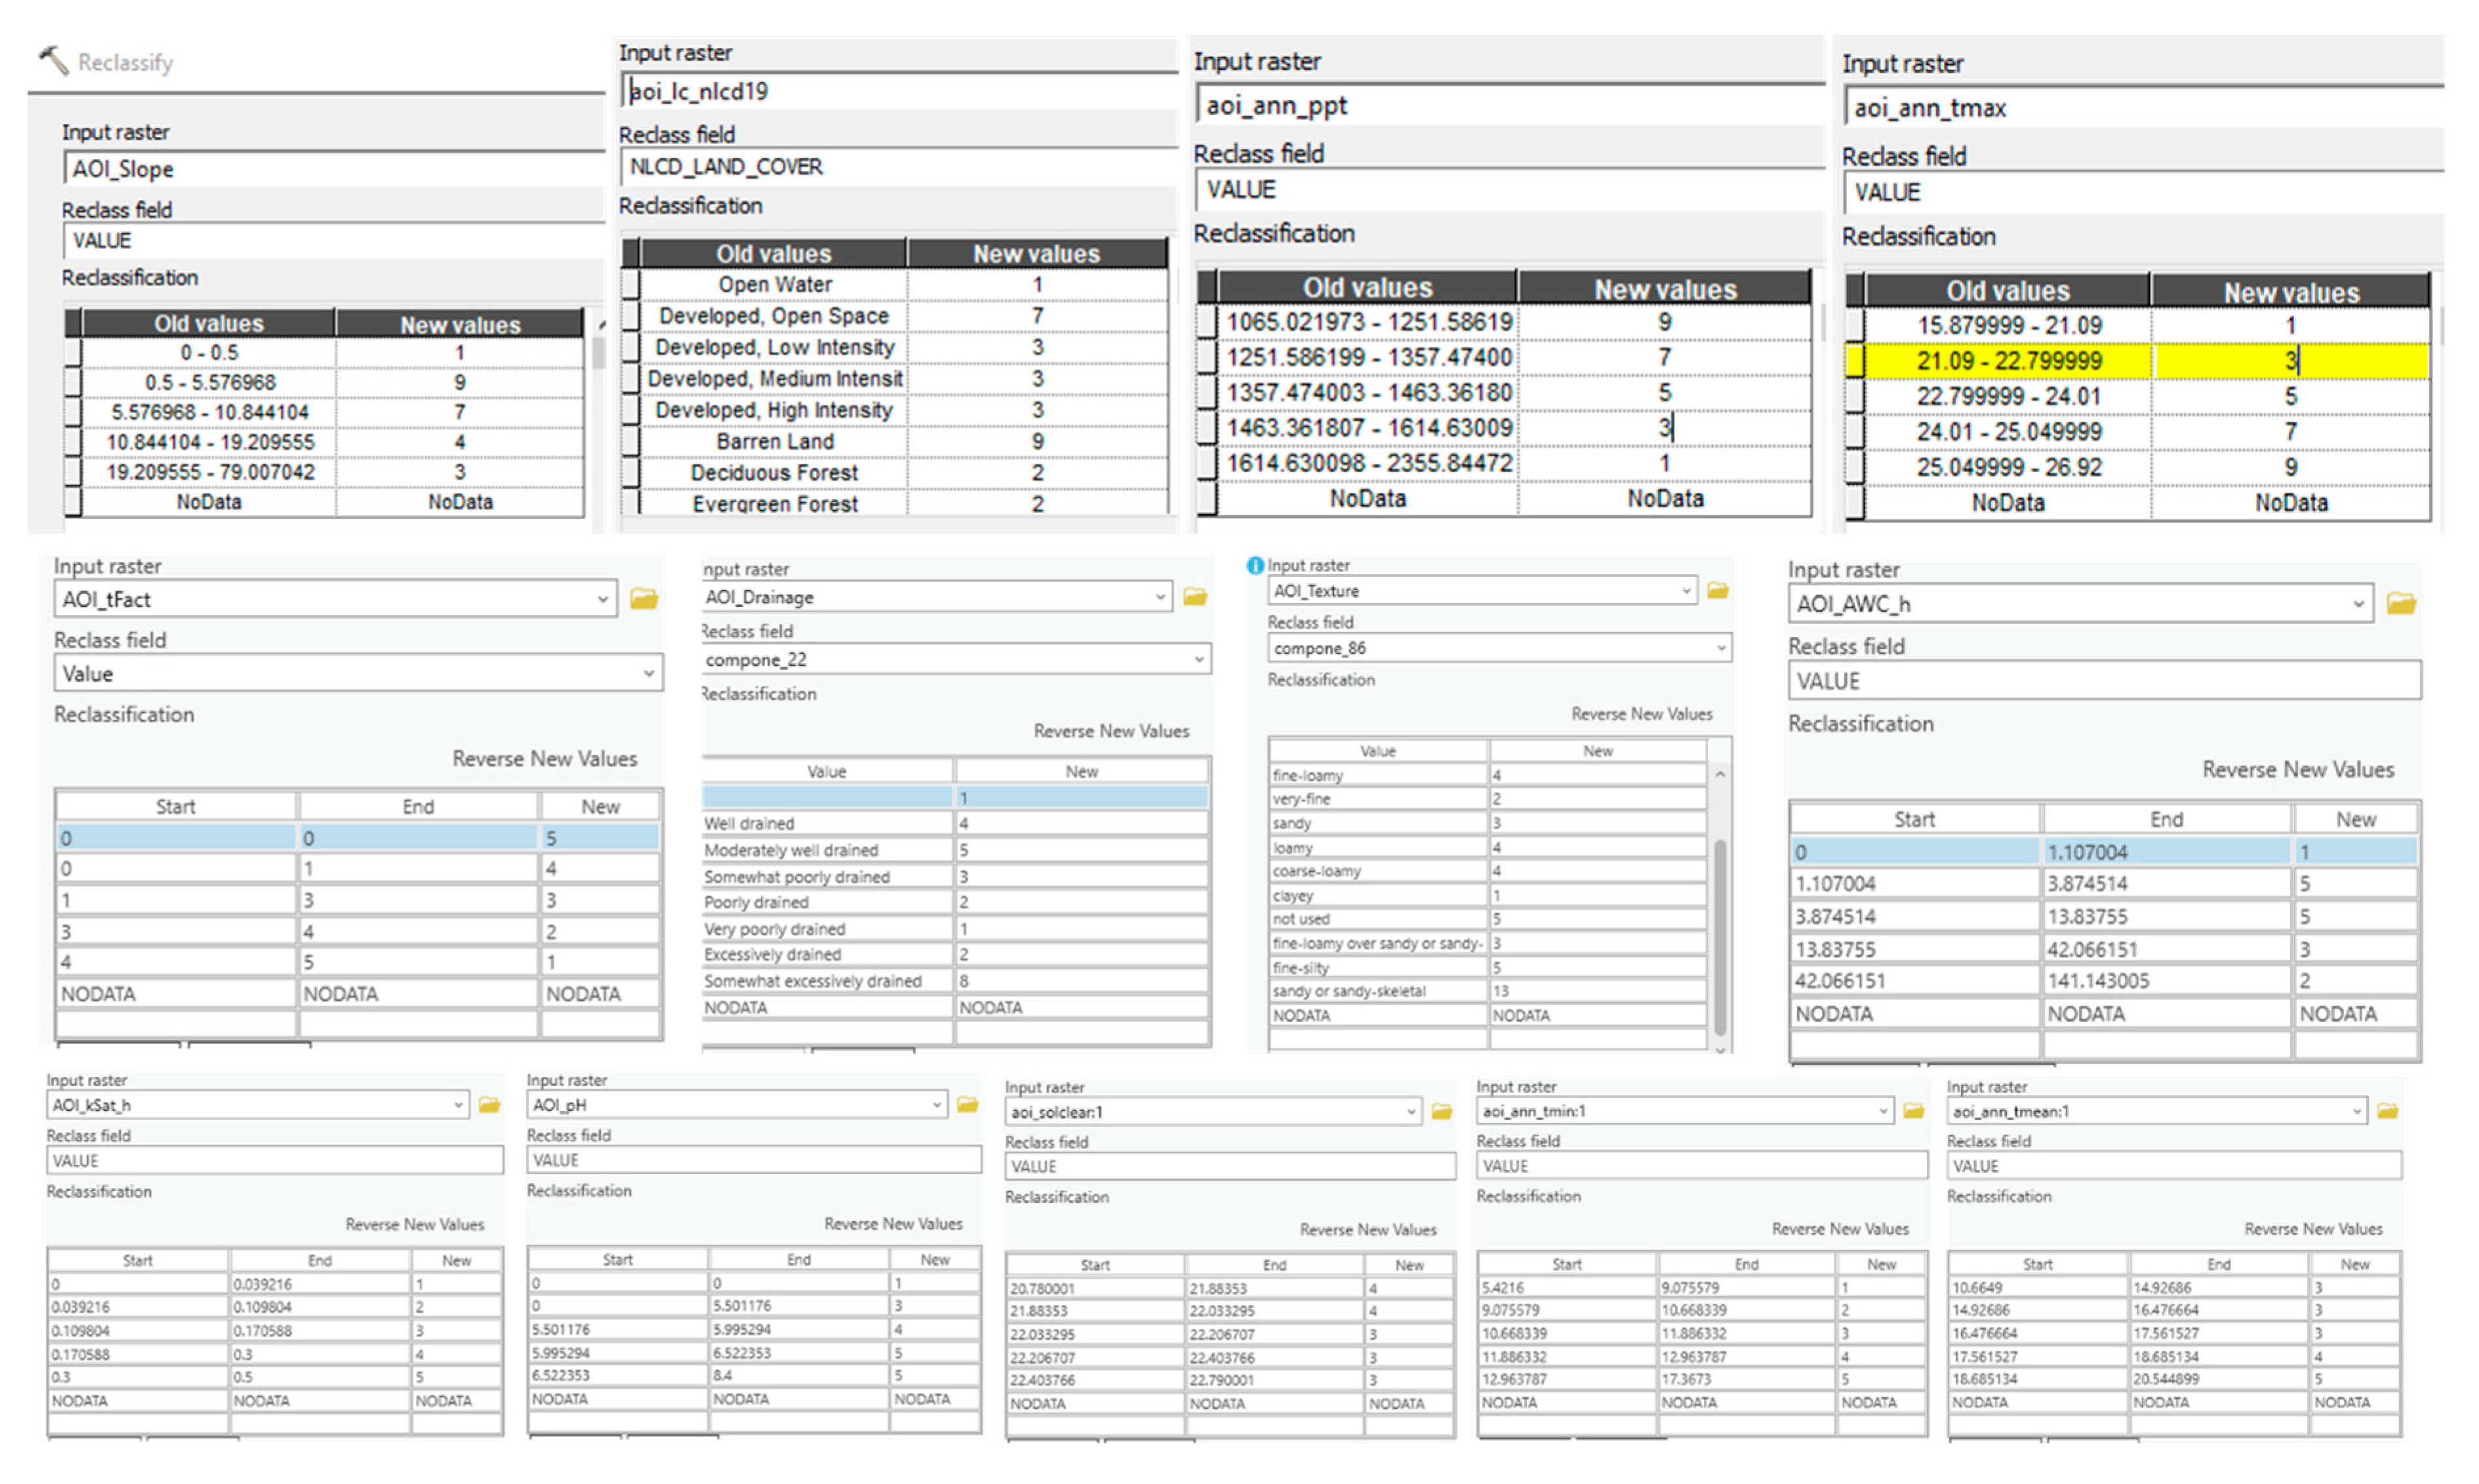
Figure 7.
Automated sericea lespedeza production suitability determination model (a) with the Weighted Sum process weighted scores shown in decimals (b).
Figure 7.
Automated sericea lespedeza production suitability determination model (a) with the Weighted Sum process weighted scores shown in decimals (b).
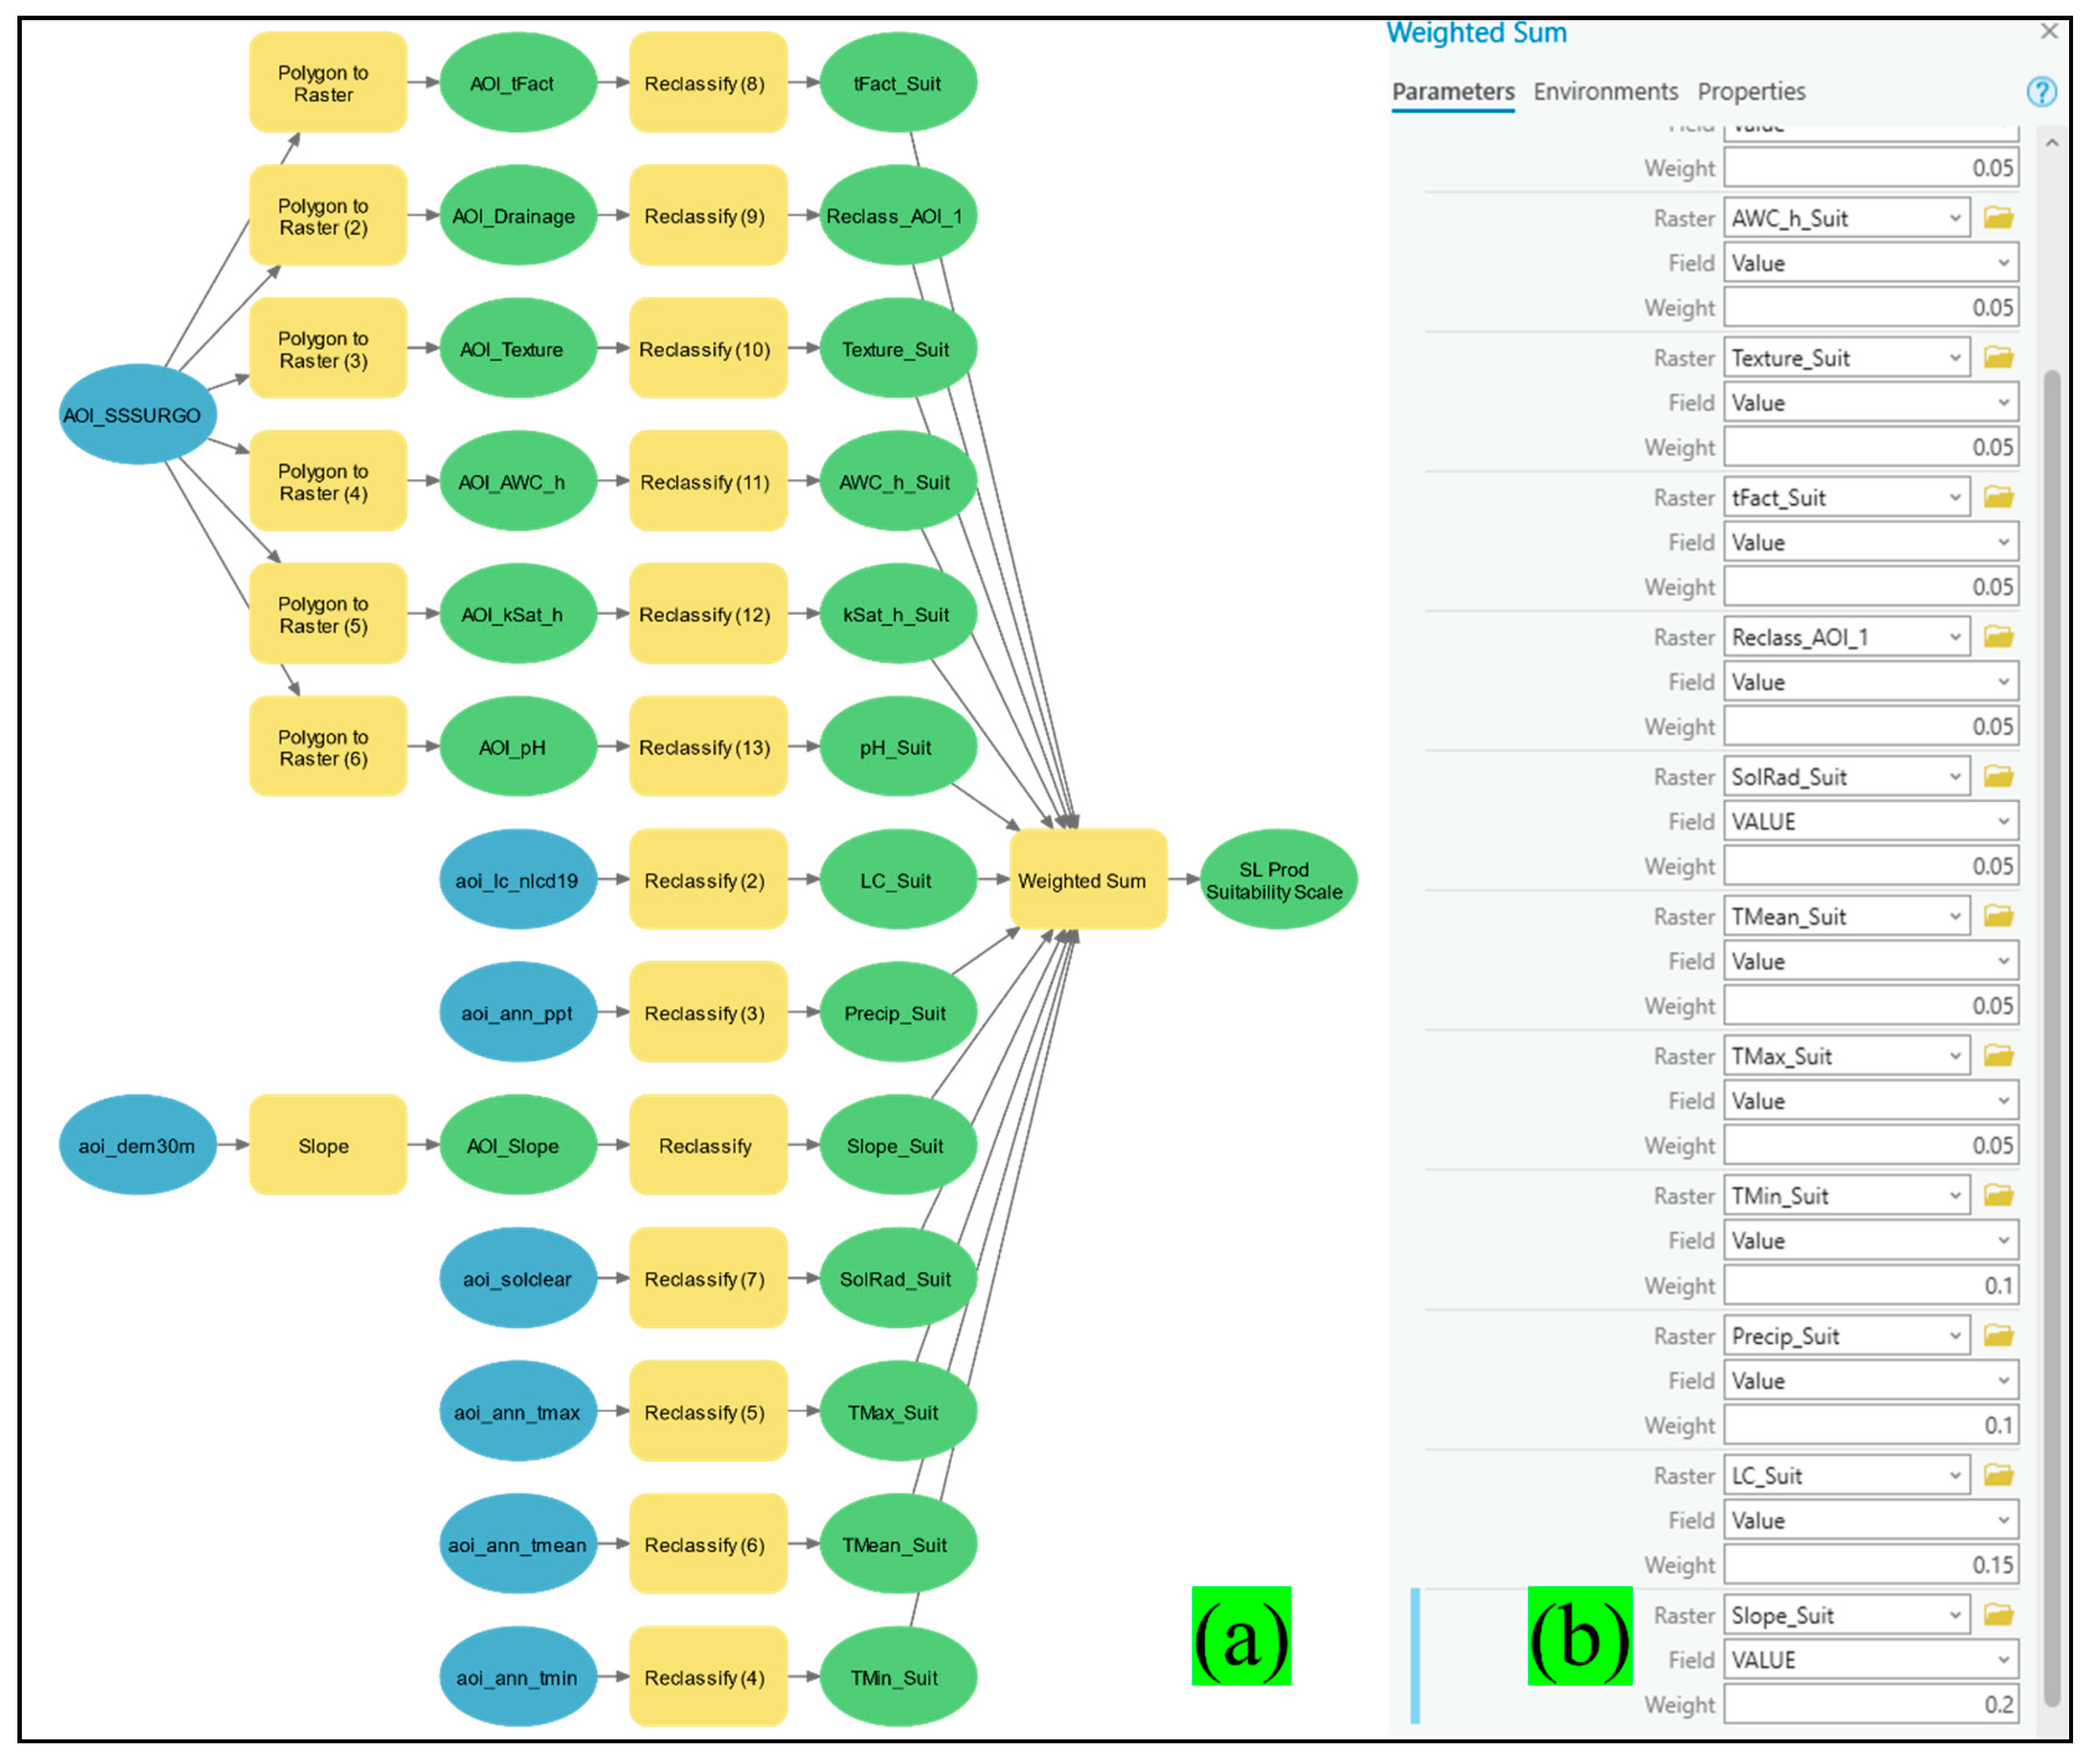
Figure 8.
Tristate SL production suitability decision support map as ArcGIS Dashboard for easy access by end-users.
Figure 8.
Tristate SL production suitability decision support map as ArcGIS Dashboard for easy access by end-users.
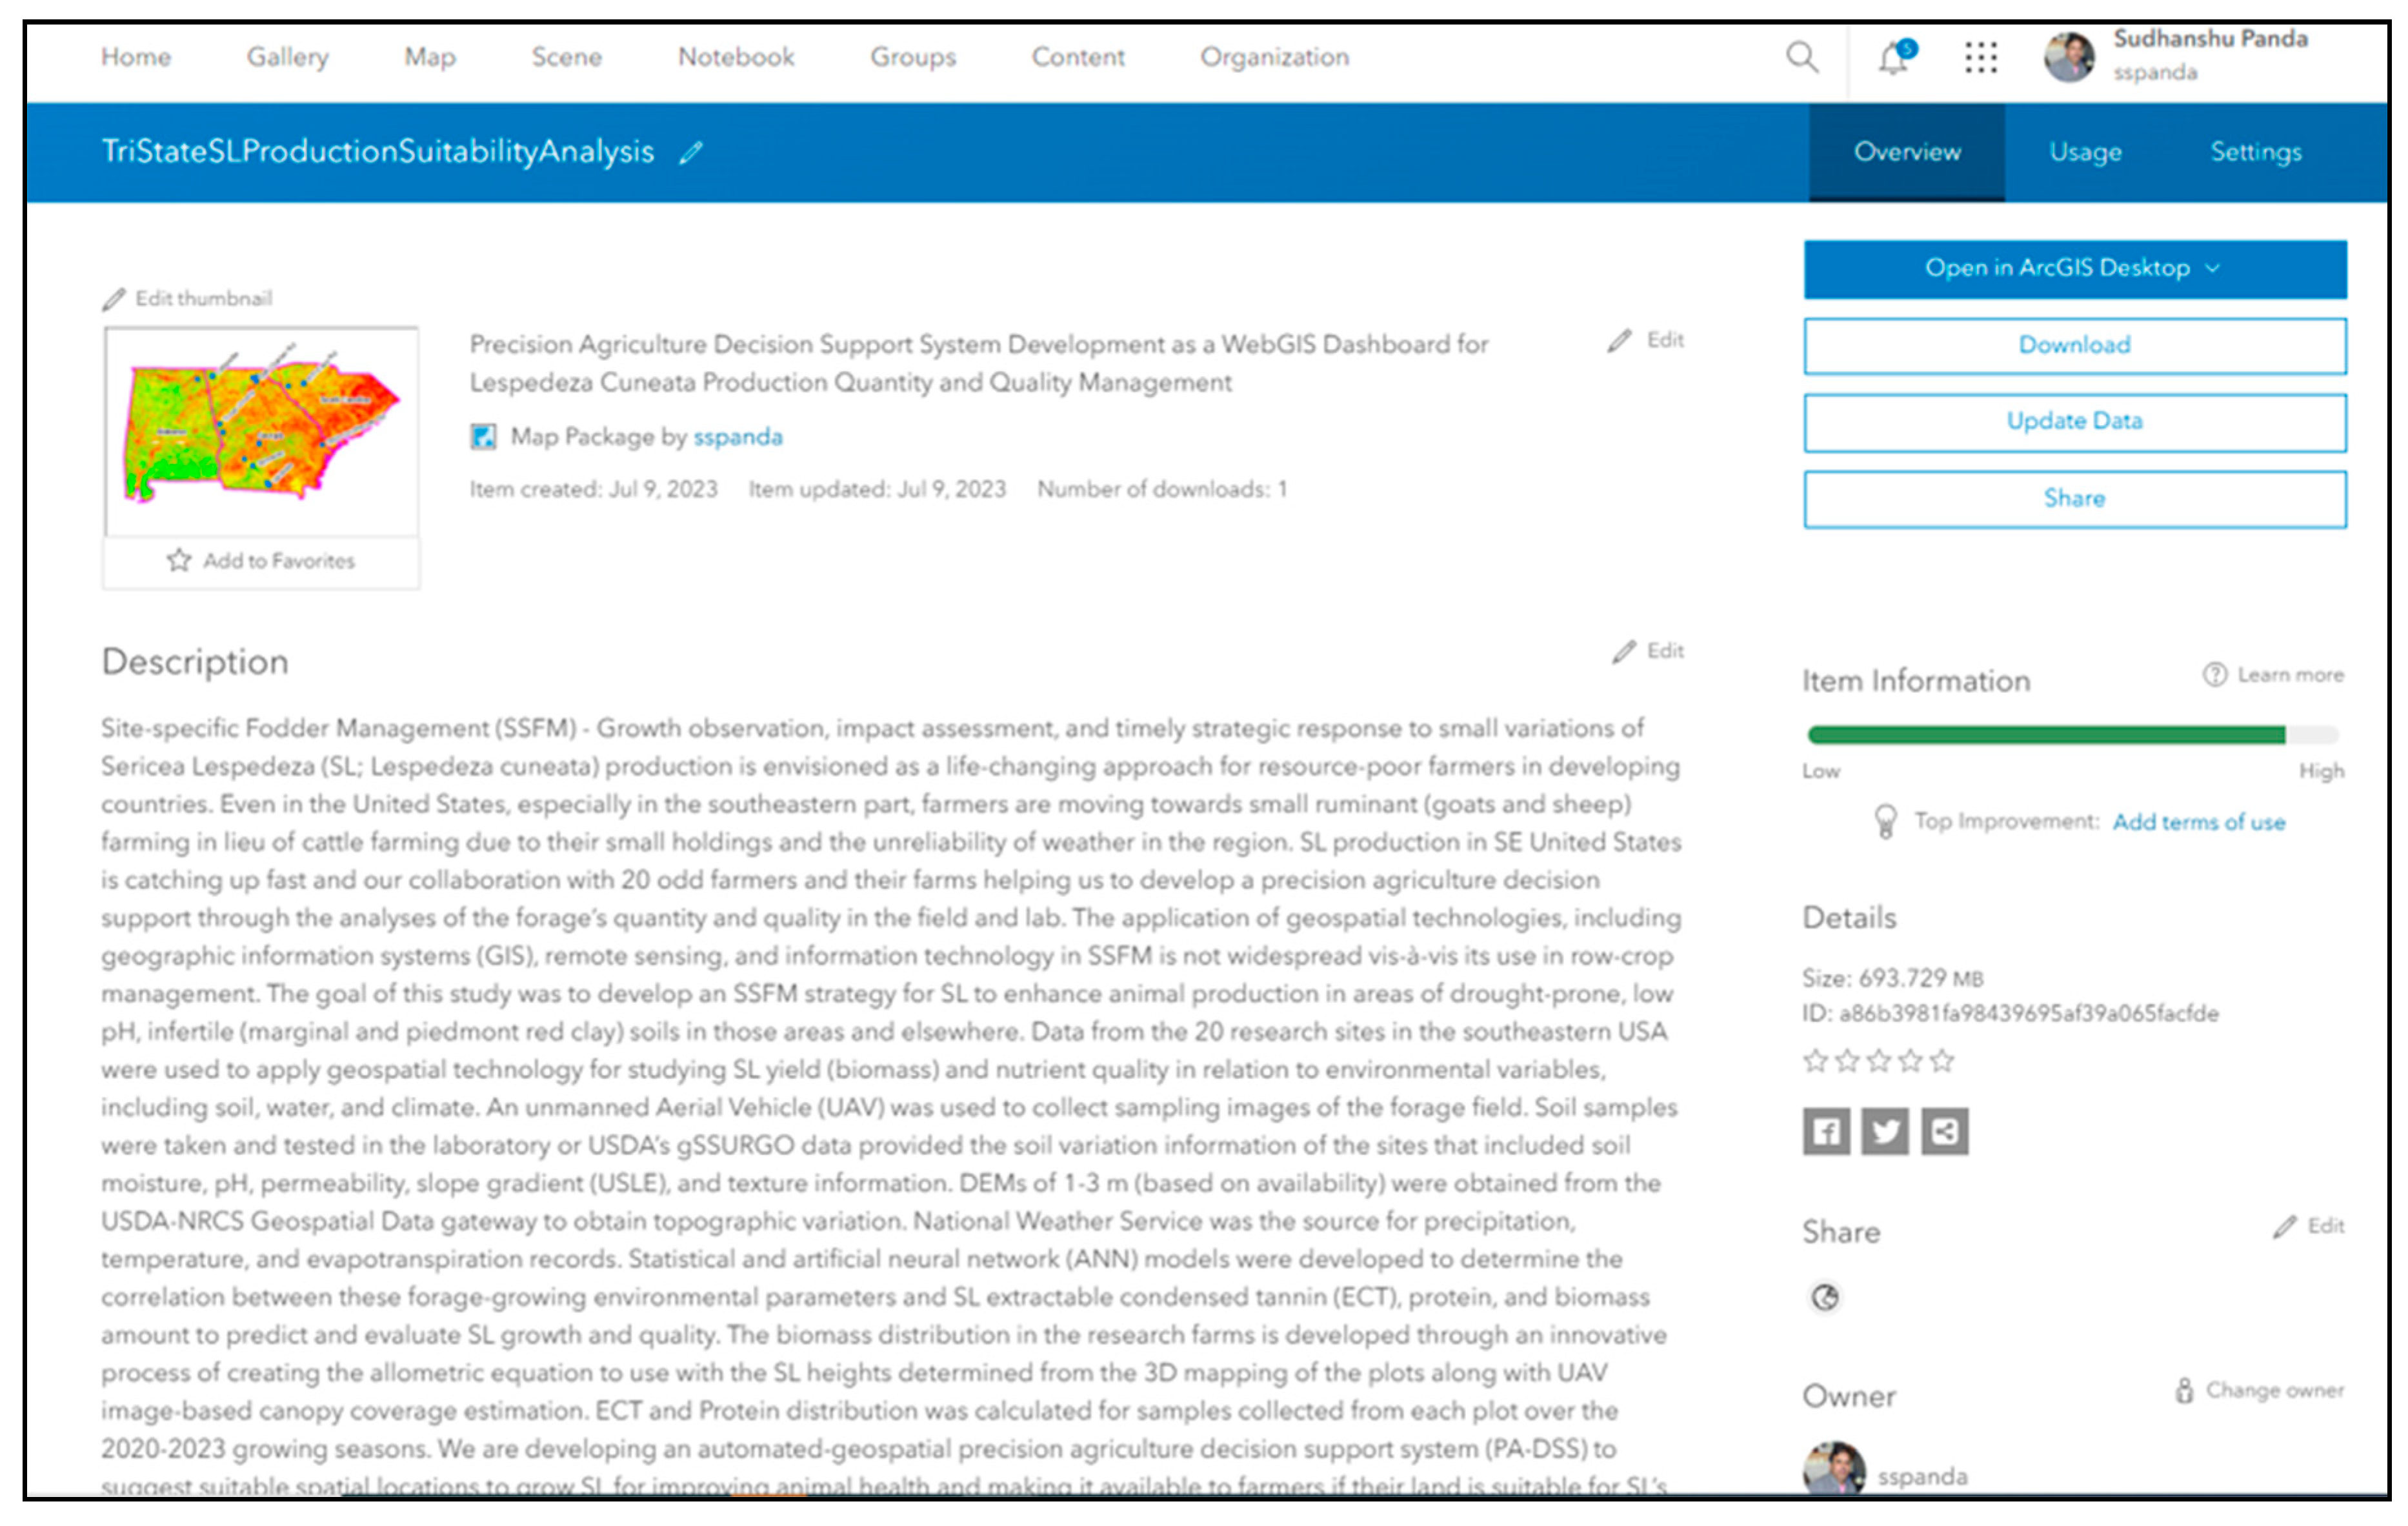
Figure 9.
a-m: Thirteen sericea lespedeza production agronomic factor suitability-scaled rasters through a scale of 1-5, with 1 indicating the least suitable, 2 = lowly suitable, 3 = moderately suitable, 4 = highly suitable, and 5 = most suitable.
Figure 9.
a-m: Thirteen sericea lespedeza production agronomic factor suitability-scaled rasters through a scale of 1-5, with 1 indicating the least suitable, 2 = lowly suitable, 3 = moderately suitable, 4 = highly suitable, and 5 = most suitable.
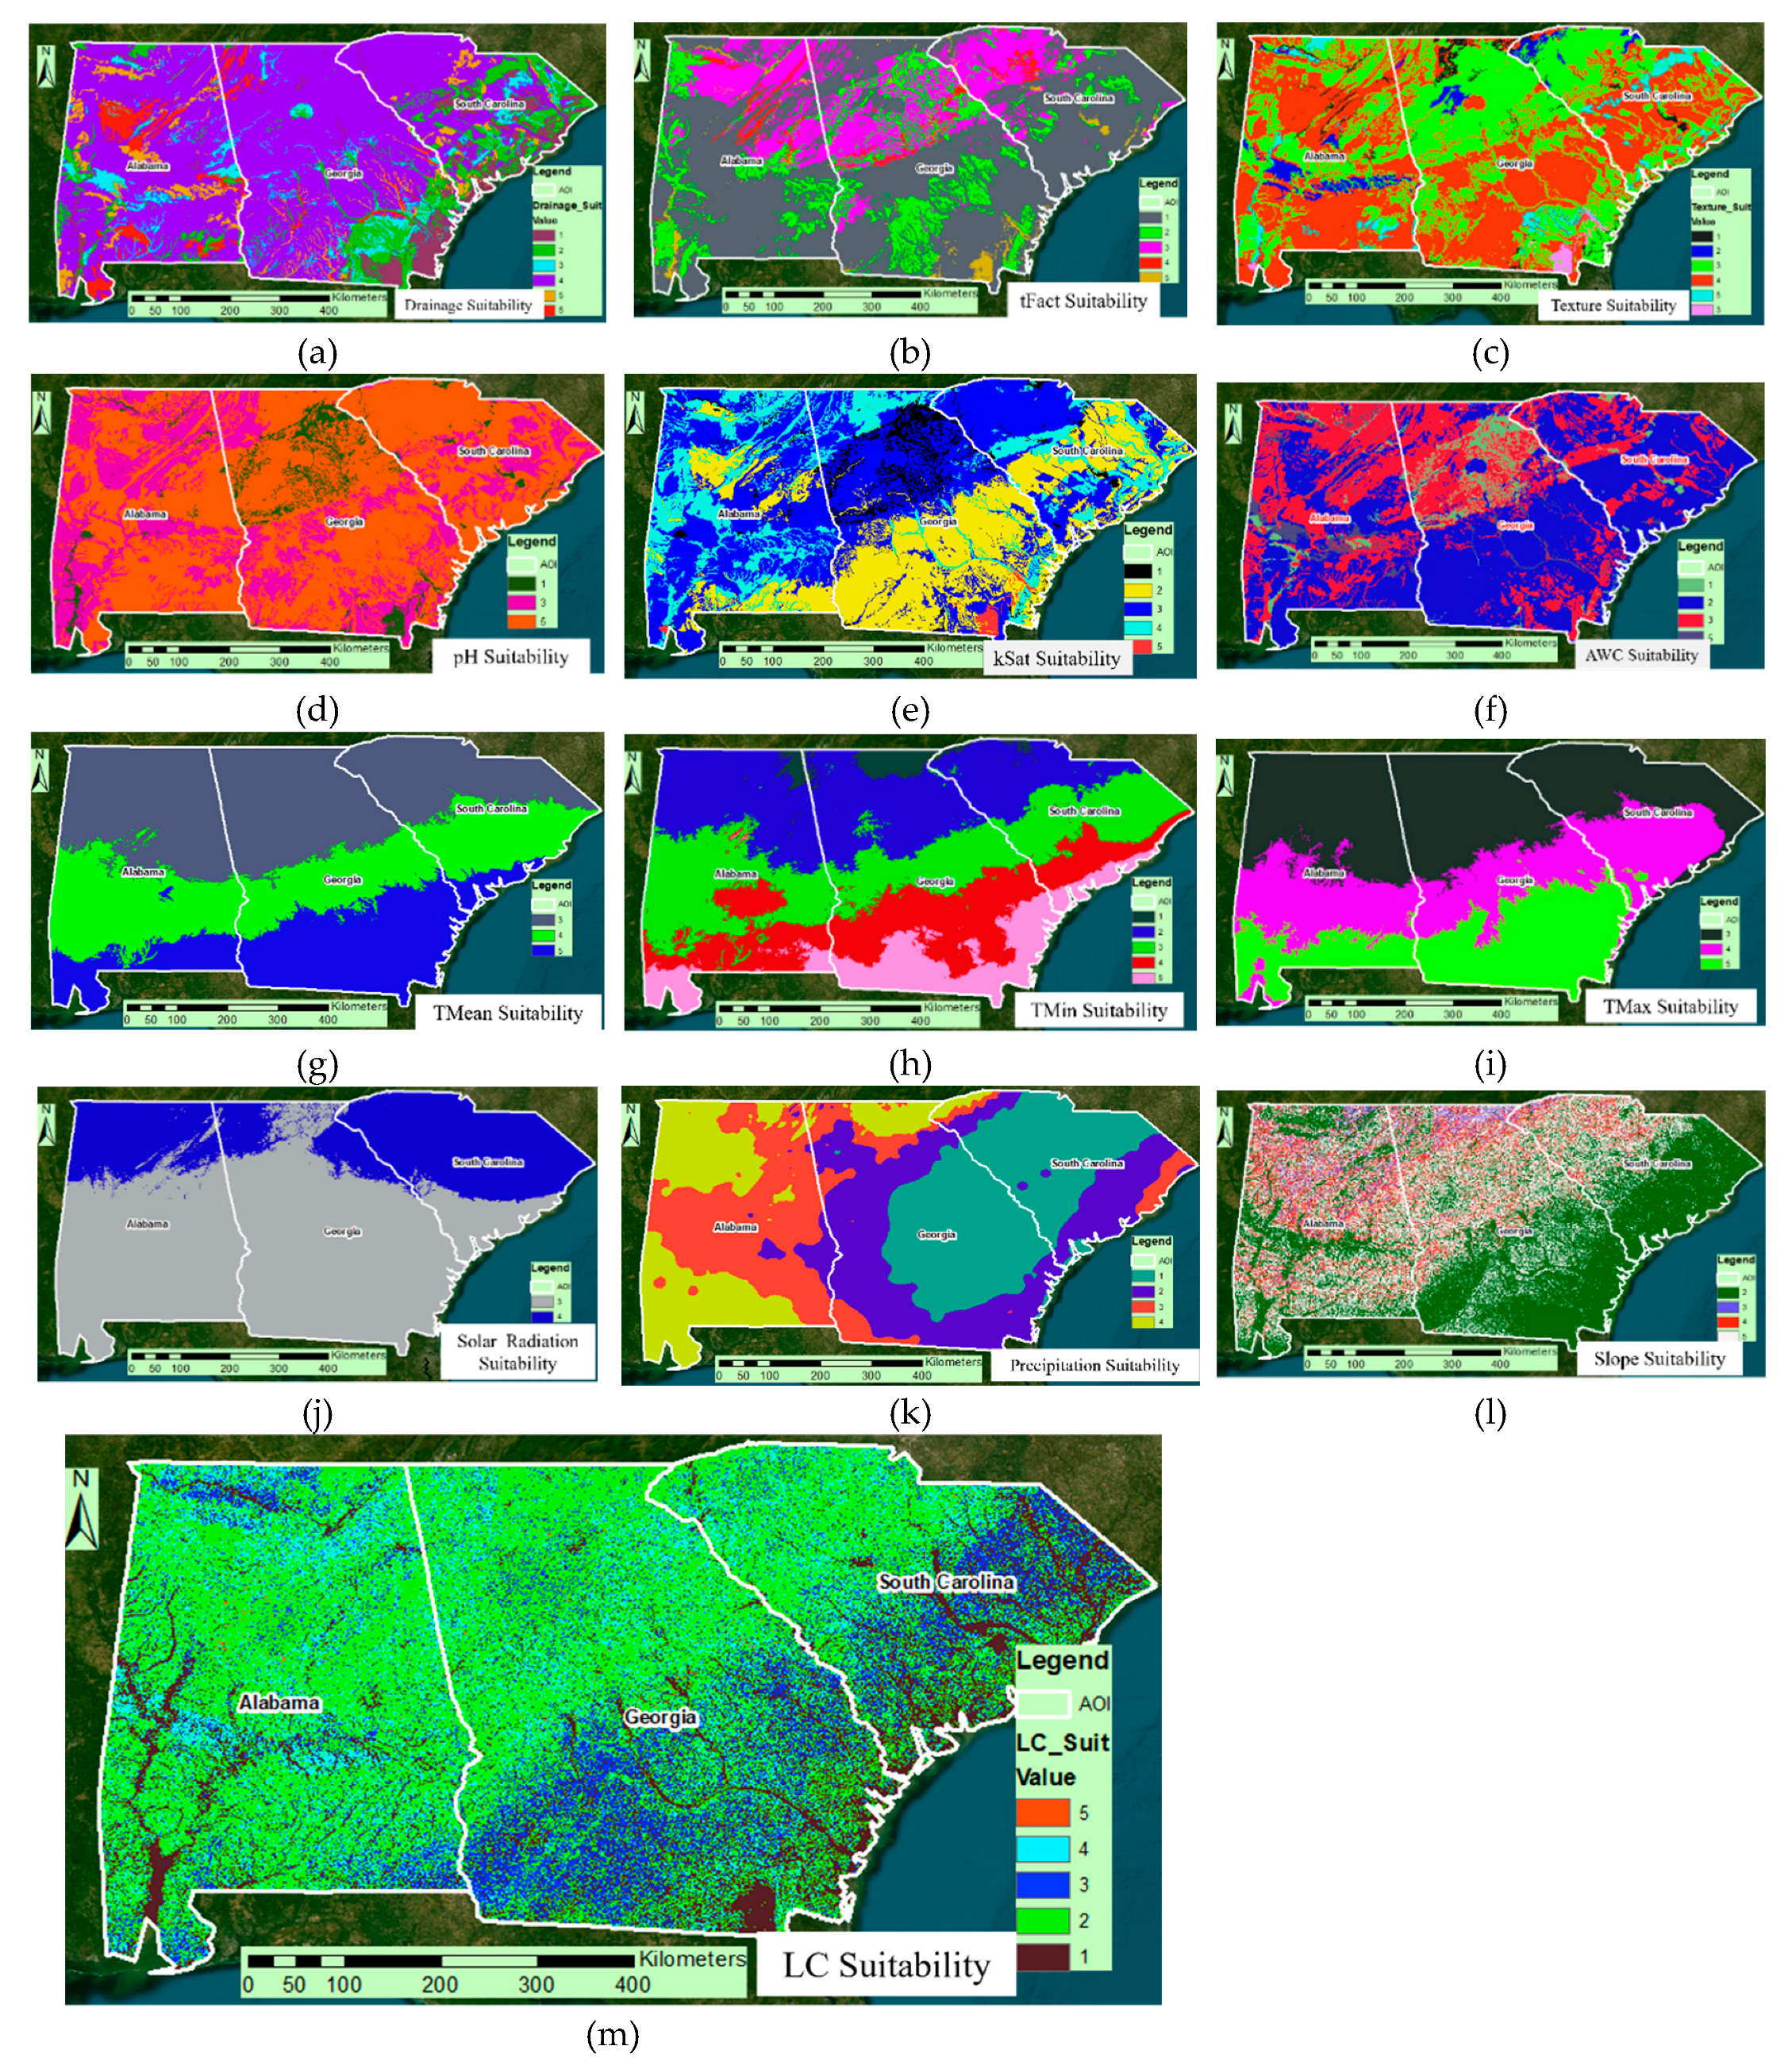
Figure 10.
Study resultant map showing the spatial suitability of SL production in a scale of 1-5 (lowest to Highest suitability) as generated through the use of Jenks algorithm while classifying the raster.
Figure 10.
Study resultant map showing the spatial suitability of SL production in a scale of 1-5 (lowest to Highest suitability) as generated through the use of Jenks algorithm while classifying the raster.
Disclaimer/Publisher’s Note: The statements, opinions and data contained in all publications are solely those of the individual author(s) and contributor(s) and not of MDPI and/or the editor(s). MDPI and/or the editor(s) disclaim responsibility for any injury to people or property resulting from any ideas, methods, instructions or products referred to in the content. |
© 2024 by the authors. Licensee MDPI, Basel, Switzerland. This article is an open access article distributed under the terms and conditions of the Creative Commons Attribution (CC BY) license (https://creativecommons.org/licenses/by/4.0/).
Copyright: This open access article is published under a Creative Commons CC BY 4.0 license, which permit the free download, distribution, and reuse, provided that the author and preprint are cited in any reuse.


