Submitted:
08 March 2024
Posted:
08 March 2024
You are already at the latest version
Abstract
Keywords:
1. Introduction
2. Materials and Methods
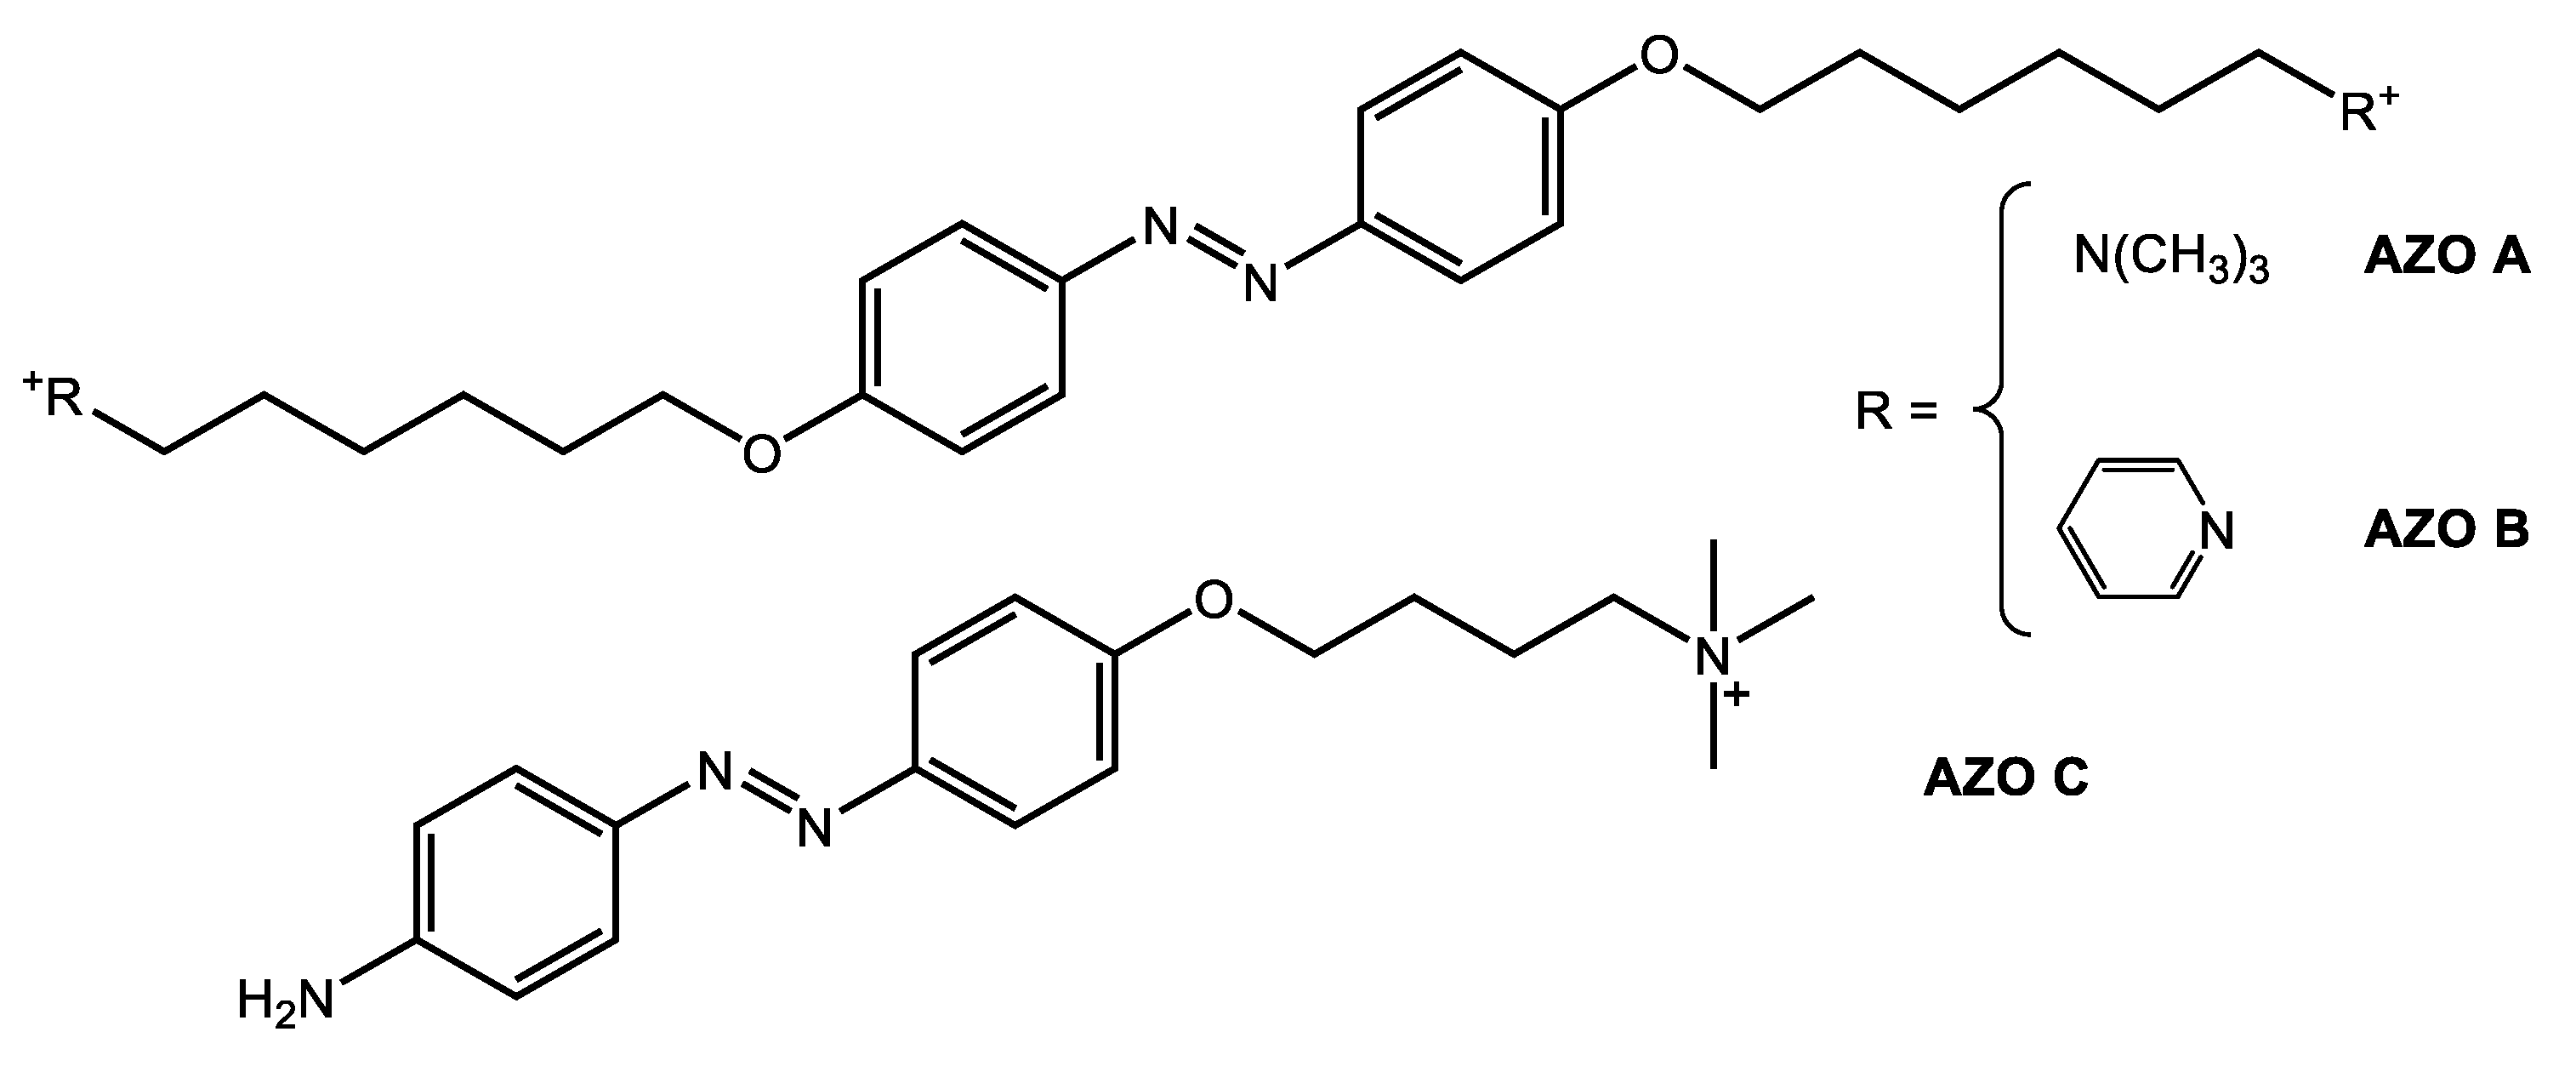
2.1. Synthesis of AZO A
Synthesis of 4,4’-(Diazene-1,2-diyl)diphenol (1 in Figure S1)
Synthesis of 1,2-Bis(4-((6-bromohexyl) oxy)phenyl) Diazene (2 in Figure S1)
Synthesis of 6,6'-((Diazene-1,2-diylbis(4,1-phenylene)) bis(oxy))bis(N,N,N-trimethylhexan-1-aminium) (AZO A, Figure S1)
2.2. Synthesis of AZO B
Synthesis of 1,1'-(((Diazene-1,2-diylbis(4,1-phenylene))bis(oxy))bis(hexane 6,1diyl))bis(pyridin-1-ium) (AZO B, in Figure S1)
2.3. Synthesis of AZO C
Synthesis of N-(4-((4-Hydroxyphenyl)diazenyl)phenyl)acetamide (1’ in Figure S2)
Synthesis of N-(4-((4-(4-Bromobutoxy)phenyl)diazenyl)phenyl)acetamide (2’ in Figure S2)
Synthesis of 4-(4-((4-Acetamidophenyl)diazenyl)phenoxy)-N,N,N-trimethylbutan-1-aminium (3’ in Figure S2)
Synthesis of 4-(4-((4-Aminophenyl)diazenyl)phenoxy)-N,N,N-trimethylbutan-1-aminium (AZO C)
3. Results and Discussion
3.1. Synthesis of Ionic Azobenzenes
3.2. Light-Responsive Behavior of Azobenzenes
3.3. Hydrogels Formation and Photoresponsivity Properties
3.4. FTIR Characterization of the Hydrogels
3.5. Hydrogels Morphology
4. Conclusions
Supplementary Materials
Author Contributions
Funding
Institutional Review Board Statement
Data Availability Statement
Conflicts of Interest
References
- Khademhosseini, A.; Langer, R. Microengineered hydrogels for tissue engineering. Biomaterials 2007, 28, 5087–5092. [Google Scholar] [CrossRef]
- Karimi, S.; Rasuli, H.; Mohammadi, R. , Facile preparation of pH-sensitive biocompatible alginate beads havening layered double hydroxide supported metal-organic framework for controlled release from doxorubicin to breast cancer cells. International Journal of Biological Macromolecules 2023, 123538. [Google Scholar] [CrossRef]
- Zhang, M.; Zhao, X. Alginate hydrogel dressings for advanced wound management. Int. J. Biol. Macromol. 2020, 162, 1414–1428. [Google Scholar] [CrossRef]
- Mura, S.; Nicolas, J.; Couvreur, P. Stimuli-responsive nanocarriers for drug delivery. Nat. Mater. 2013, 12, 991–1003. [Google Scholar] [CrossRef]
- Kowalski, P.S.; Bhattacharya, C.; Afewerki, S.; Langer, R.S. Smart Biomaterials: Recent Advances and Future Directions. ACS Biomater. Sci. Eng. 2018, 4, 3809–3817. [Google Scholar] [CrossRef]
- Echeverria, C.; Fernandes, S.N.; Godinho, M.H.; Borges, J.P.; Soares, P.I.P. Functional Stimuli-Responsive Gels: Hydrogels and Microgels. Gels 2018, 4, 54. [Google Scholar] [CrossRef]
- Di Martino, M.; Sessa, L.; Diana, R.; Piotto, S.; Concilio, S. Recent Progress in Photoresponsive Biomaterials. Molecules 2023, 28, 3712. [Google Scholar] [CrossRef]
- Dudek, M.; Pokładek, Z.; Deiana, M.; Matczyszyn, K. Molecular design and structural characterization of photoresponsive azobenzene-based polyamide units. Dye. Pigment. 2020, 180, 108501. [Google Scholar] [CrossRef]
- Sun, S.; Liang, S.; Xu, W.-C.; Xu, G.; Wu, S. Photoresponsive polymers with multi-azobenzene groups. Polym. Chem. 2019, 10, 4389–4401. [Google Scholar] [CrossRef]
- Giménez, V.M.M.; Arya, G.; Zucchi, I.A.; Galante, M.J.; Manucha, W. Photo-responsive polymeric nanocarriers for target-specific and controlled drug delivery. Soft Matter 2021, 17, 8577–8584. [Google Scholar] [CrossRef] [PubMed]
- Li, L.; Scheiger, J.M.; Levkin, P.A. Design and Applications of Photoresponsive Hydrogels. Adv. Mater. 2019, 31, e1807333. [Google Scholar] [CrossRef] [PubMed]
- Jerca, F.A.; Jerca, V.V.; Hoogenboom, R. Advances and opportunities in the exciting world of azobenzenes. Nat. Rev. Chem. 2021, 6, 51–69. [Google Scholar] [CrossRef] [PubMed]
- Bandara, H. M. D.; Burdette, S. C. , Photoisomerization in different classes of azobenzene. Chemical Society Reviews 2012, 41, (5), 1809–1825. [Google Scholar] [CrossRef]
- Kim, Y.; Jeong, D.; Shinde, V.V.; Hu, Y.; Kim, C.; Jung, S. Azobenzene-grafted carboxymethyl cellulose hydrogels with photo-switchable, reduction-responsive and self-healing properties for a controlled drug release system. Int. J. Biol. Macromol. 2020, 163, 824–832. [Google Scholar] [CrossRef] [PubMed]
- Rosales, A.M.; Rodell, C.B.; Chen, M.H.; Morrow, M.G.; Anseth, K.S.; Burdick, J.A. Reversible Control of Network Properties in Azobenzene-Containing Hyaluronic Acid-Based Hydrogels. Bioconjugate Chem. 2018, 29, 905–913. [Google Scholar] [CrossRef] [PubMed]
- Yang, R.; Peng, S.; Wan, W.; Hughes, T.C. Azobenzene based multistimuli responsive supramolecular hydrogels. J. Mater. Chem. C 2014, 2, 9122–9131. [Google Scholar] [CrossRef]
- de Luna, M.S.; Marturano, V.; Manganelli, M.; Santillo, C.; Ambrogi, V.; Filippone, G.; Cerruti, P. Light-responsive and self-healing behavior of azobenzene-based supramolecular hydrogels. J. Colloid Interface Sci. 2020, 568, 16–24. [Google Scholar] [CrossRef]
- Karcher, J.; Kirchner, S.; Leistner, A.-L.; Hald, C.; Geng, P.; Bantle, T.; Gödtel, P.; Pfeifer, J.; Pianowski, Z.L. Selective release of a potent anticancer agent from a supramolecular hydrogel using green light. RSC Advances, 2021; 11, 8546–8551. [Google Scholar] [CrossRef]
- Lv, J.-A.; Liu, Y.; Wei, J.; Chen, E.; Qin, L.; Yu, Y. Photocontrol of fluid slugs in liquid crystal polymer microactuators. Nature 2016, 537, 179–184. [Google Scholar] [CrossRef]
- Xu, G.; Li, S.; Liu, C.; Wu, S. Photoswitchable Adhesives Using Azobenzene-Containing Materials. Chem. – Asian J. 2020, 15, 547–554. [Google Scholar] [CrossRef]
- Di Martino, M.; Sessa, L.; Di Matteo, M.; Panunzi, B.; Piotto, S.; Concilio, S. Azobenzene as Antimicrobial Molecules. Molecules 2022, 27, 5643. [Google Scholar] [CrossRef]
- Peng, K.; Zheng, L.; Zhou, T.; Zhang, C.; Li, H. Light manipulation for fabrication of hydrogels and their biological applications. Acta Biomater. 2021, 137, 20–43. [Google Scholar] [CrossRef]
- Sessa, L.; Concilio, S.; Iannelli, P.; De Santis, F.; Porta, A.; Piotto, S. Antimicrobial azobenzene compounds and their potential use in biomaterials; AIP Conference Proceedings, 2016; AIP Publishing.
- Wang, T.; Gao, F.; Zhang, Y.; Wang, S.; Li, X.; Zhao, Z.; Dong, Y.; Li, X. Construction of multiresponsive supramacromolecular hydrogels with a novel azobenzene derivative as crosslinkers. J. Mater. Res. Technol. 2023, 22, 1781–1790. [Google Scholar] [CrossRef]
- Gao, F.; Bi, Z.; Wang, S.; Zhao, Z.; Dong, Y.; Li, X. An amphiphilic azobenzene derivative as a crosslinker in the construction of smart supramacromolecular hydrogels. Colloids Surfaces A: Physicochem. Eng. Asp. 2022, 647. [Google Scholar] [CrossRef]
- Leistner, A.-L.; Kistner, D.G.; Fengler, C.; Pianowski, Z.L. Reversible photodissipation of composite photochromic azobenzene-alginate supramolecular hydrogels. RSC Adv. 2022, 12, 4771–4776. [Google Scholar] [CrossRef]
- Yang, R.; Jin, W.; Huang, C.; Liu, Y. Azobenzene Based Photo-Responsive Hydrogel: Synthesis, Self-Assembly, and Antimicrobial Activity. Gels 2022, 8, 414. [Google Scholar] [CrossRef] [PubMed]
- Cheng, Q.; Zhang, Y.; Luan, T.; Wang, Z.; Tang, R.; Xing, P.; Hao, A. Hydrogels Self-Assembled from an Azobenzene Building Block: Stability toward UV Irradiation in the Gel and Thin-Film States. Chempluschem 2019, 84, 328–332. [Google Scholar] [CrossRef] [PubMed]
- Heeres, A.; van der Pol, C.; Stuart, M.; Friggeri, A.; Feringa, B.L.; van Esch, J. Orthogonal Self-Assembly of Low Molecular Weight Hydrogelators and Surfactants. J. Am. Chem. Soc. 2003, 125, 14252–14253. [Google Scholar] [CrossRef] [PubMed]
- Omar, J.; Ponsford, D.; Dreiss, C. A.; Lee, T. C.; Loh, X. J. , Supramolecular hydrogels: Design strategies and contemporary biomedical applications. Chemistry–An Asian Journal 2022, 17, (9), e202200081. [Google Scholar] [CrossRef]
- Wang, C.; Chen, Q.; Sun, F.; Zhang, D.; Zhang, G.; Huang, Y.; Zhao, R.; Zhu, D. Multistimuli Responsive Organogels Based on a New Gelator Featuring Tetrathiafulvalene and Azobenzene Groups: Reversible Tuning of the Gel−Sol Transition by Redox Reactions and Light Irradiation. J. Am. Chem. Soc. 2010, 132, 3092–3096. [Google Scholar] [CrossRef] [PubMed]
- Balamurugan, S.; Yeap, G.-Y.; Mahmood, W.A.K.; Tan, P.-L.; Cheong, K.-Y. Thermal and photo reversible gel–sol transition of azobenzene based liquid crystalline organogel. J. Photochem. Photobiol. A: Chem. 2014, 278, 19–24. [Google Scholar] [CrossRef]
- Lee, S.; Oh, S.; Lee, J.; Malpani, Y.; Jung, Y.-S.; Kang, B.; Lee, J.Y.; Ozasa, K.; Isoshima, T.; Lee, S.Y.; et al. Stimulus-Responsive Azobenzene Supramolecules: Fibers, Gels, and Hollow Spheres. Langmuir 2013, 29, 5869–5877. [Google Scholar] [CrossRef]
- Huang, Y.; Qiu, Z.; Xu, Y.; Shi, J.; Lin, H.; Zhang, Y. Supramolecular hydrogels based on short peptides linked with conformational switch. Org. Biomol. Chem. 2011, 9, 2149–2155. [Google Scholar] [CrossRef]
- Lin, Y.; Qiao, Y.; Tang, P.; Li, Z.; Huang, J. Controllable self-assembled laminated nanoribbons from dipeptide-amphiphile bearing azobenzene moiety. Soft Matter 2011, 7, 2762–2769. [Google Scholar] [CrossRef]
- Matsuzawa, Y.; Tamaoki, N. Photoisomerization of Azobenzene Units Controls the Reversible Dispersion and Reorganization of Fibrous Self-Assembled Systems. J. Phys. Chem. B 2010, 114, 1586–1590. [Google Scholar] [CrossRef]
- Ogawa, Y.; Yoshiyama, C.; Kitaoka, T. Helical Assembly of Azobenzene-Conjugated Carbohydrate Hydrogelators with Specific Affinity for Lectins. Langmuir 2012, 28, 4404–4412. [Google Scholar] [CrossRef] [PubMed]
- Hu, Y.; Zou, W.; Julita, V.; Ramanathan, R.; Tabor, R.F.; Nixon-Luke, R.; Bryant, G.; Bansal, V.; Wilkinson, B.L. Photomodulation of bacterial growth and biofilm formation using carbohydrate-based surfactants. Chem. Sci. 2016, 7, 6628–6634. [Google Scholar] [CrossRef] [PubMed]
- Peng, S.; Guo, Q.; Hughes, T.C.; Hartley, P.G. Reversible Photorheological Lyotropic Liquid Crystals. Langmuir 2014, 30, 866–872. [Google Scholar] [CrossRef] [PubMed]
- Yin, C.; Jiang, F.; Li, B.; Wu, L. Multiple modulations for supramolecular hydrogels of bola-form surfactants bearing rigid and flexible groups. Soft Matter 2019, 15, 5034–5041. [Google Scholar] [CrossRef] [PubMed]
- Chiang, C.-Y.; Chu, C.-C. Synthesis of photoresponsive hybrid alginate hydrogel with photo-controlled release behavior. Carbohydr. Polym. 2015, 119, 18–25. [Google Scholar] [CrossRef] [PubMed]
- Xie, M.; Wu, C.; Chen, C.; Liu, Y.; Zhao, C. Photo-adaptable shape memory hydrogels based on orthogonal supramolecular interactions. Polym. Chem. 2019, 10, 4852–4858. [Google Scholar] [CrossRef]
- He, F.; Wang, L.; Yang, S.; Qin, W.; Feng, Y.; Liu, Y.; Zhou, Y.; Yu, G.; Li, J. Highly stretchable and tough alginate-based cyclodextrin/Azo-polyacrylamide interpenetrating network hydrogel with self-healing properties. Carbohydr. Polym. 2021, 256, 117595. [Google Scholar] [CrossRef]
- Takashima, Y.; Nakayama, T.; Miyauchi, M.; Kawaguchi, Y.; Yamaguchi, H.; Harada, A. Complex Formation and Gelation between Copolymers Containing Pendant Azobenzene Groups and Cyclodextrin Polymers. Chem. Lett. 2004, 33, 890–891. [Google Scholar] [CrossRef]
- Concilio, S.; Sessa, L.; Petrone, A.M.; Porta, A.; Diana, R.; Iannelli, P.; Piotto, S. Structure Modification of an Active Azo-Compound as a Route to New Antimicrobial Compounds. Molecules 2017, 22, 875. [Google Scholar] [CrossRef]
- Zinchenko, A.A.; Tanahashi, M.; Murata, S. Photochemical Modulation of DNA Conformation by Organic Dications. ChemBioChem 2012, 13, 105–111. [Google Scholar] [CrossRef] [PubMed]
- Mutter, N. L.; Volarić, J.; Szymanski, W.; Feringa, B. L.; Maglia, G. , Reversible Photocontrolled Nanopore Assembly. Journal of the American Chemical Society 2019, 141, (36), 14356–14363. [Google Scholar] [CrossRef]
- Blevins, A.A.; Blanchard, G.J. Effect of Positional Substitution on the Optical Response of Symmetrically Disubstituted Azobenzene Derivatives. J. Phys. Chem. B 2004, 108, 4962–4968. [Google Scholar] [CrossRef]
- Maity, C.; Das, N. Alginate-Based Smart Materials and Their Application: Recent Advances and Perspectives. Top. Curr. Chem. 2021, 380, 1–67. [Google Scholar] [CrossRef] [PubMed]
- Afzal, S.; Maswal, M.; Dar, A.A. Rheological behavior of pH responsive composite hydrogels of chitosan and alginate: Characterization and its use in encapsulation of citral. Colloids Surfaces B: Biointerfaces 2018, 169, 99–106. [Google Scholar] [CrossRef] [PubMed]
- Pereira, R.; Carvalho, A.; Vaz, D.C.; Gil, M.; Mendes, A.; Bártolo, P. Development of novel alginate based hydrogel films for wound healing applications. Int. J. Biol. Macromol. 2013, 52, 221–230. [Google Scholar] [CrossRef]
- Wan, T.; Xu, H.; Yuan, Y.; He, W. Preparation and photochemical behavior of a cationic azobenzene dye-montmorillonite intercalation compound. J. Wuhan Univ. Technol. Sci. Ed. 2007, 22, 466–469. [Google Scholar] [CrossRef]
- Baysal, K.; Aroguz, A.Z.; Adiguzel, Z.; Baysal, B.M. Chitosan/alginate crosslinked hydrogels: Preparation, characterization and application for cell growth purposes. Int. J. Biol. Macromol. 2013, 59, 342–348. [Google Scholar] [CrossRef] [PubMed]
- Li, Z.; Ramay, H.R.; Hauch, K.D.; Xiao, D.; Zhang, M. Chitosan–alginate hybrid scaffolds for bone tissue engineering. Biomaterials 2005, 26, 3919–3928. [Google Scholar] [CrossRef]
- Xing, Y.; Zeng, B.; Yang, W. Light responsive hydrogels for controlled drug delivery. Front. Bioeng. Biotechnol. 2022, 10, 1075670. [Google Scholar] [CrossRef] [PubMed]
- Pourbadiei, B.; Adlsadabad, S.Y.; Rahbariasr, N.; Pourjavadi, A. Synthesis and characterization of dual light/temperature-responsive supramolecular injectable hydrogel based on host-guest interaction between azobenzene and starch-grafted β-cyclodextrin: Melanoma therapy with paclitaxel. Carbohydr. Polym. 2023, 313, 120667. [Google Scholar] [CrossRef] [PubMed]
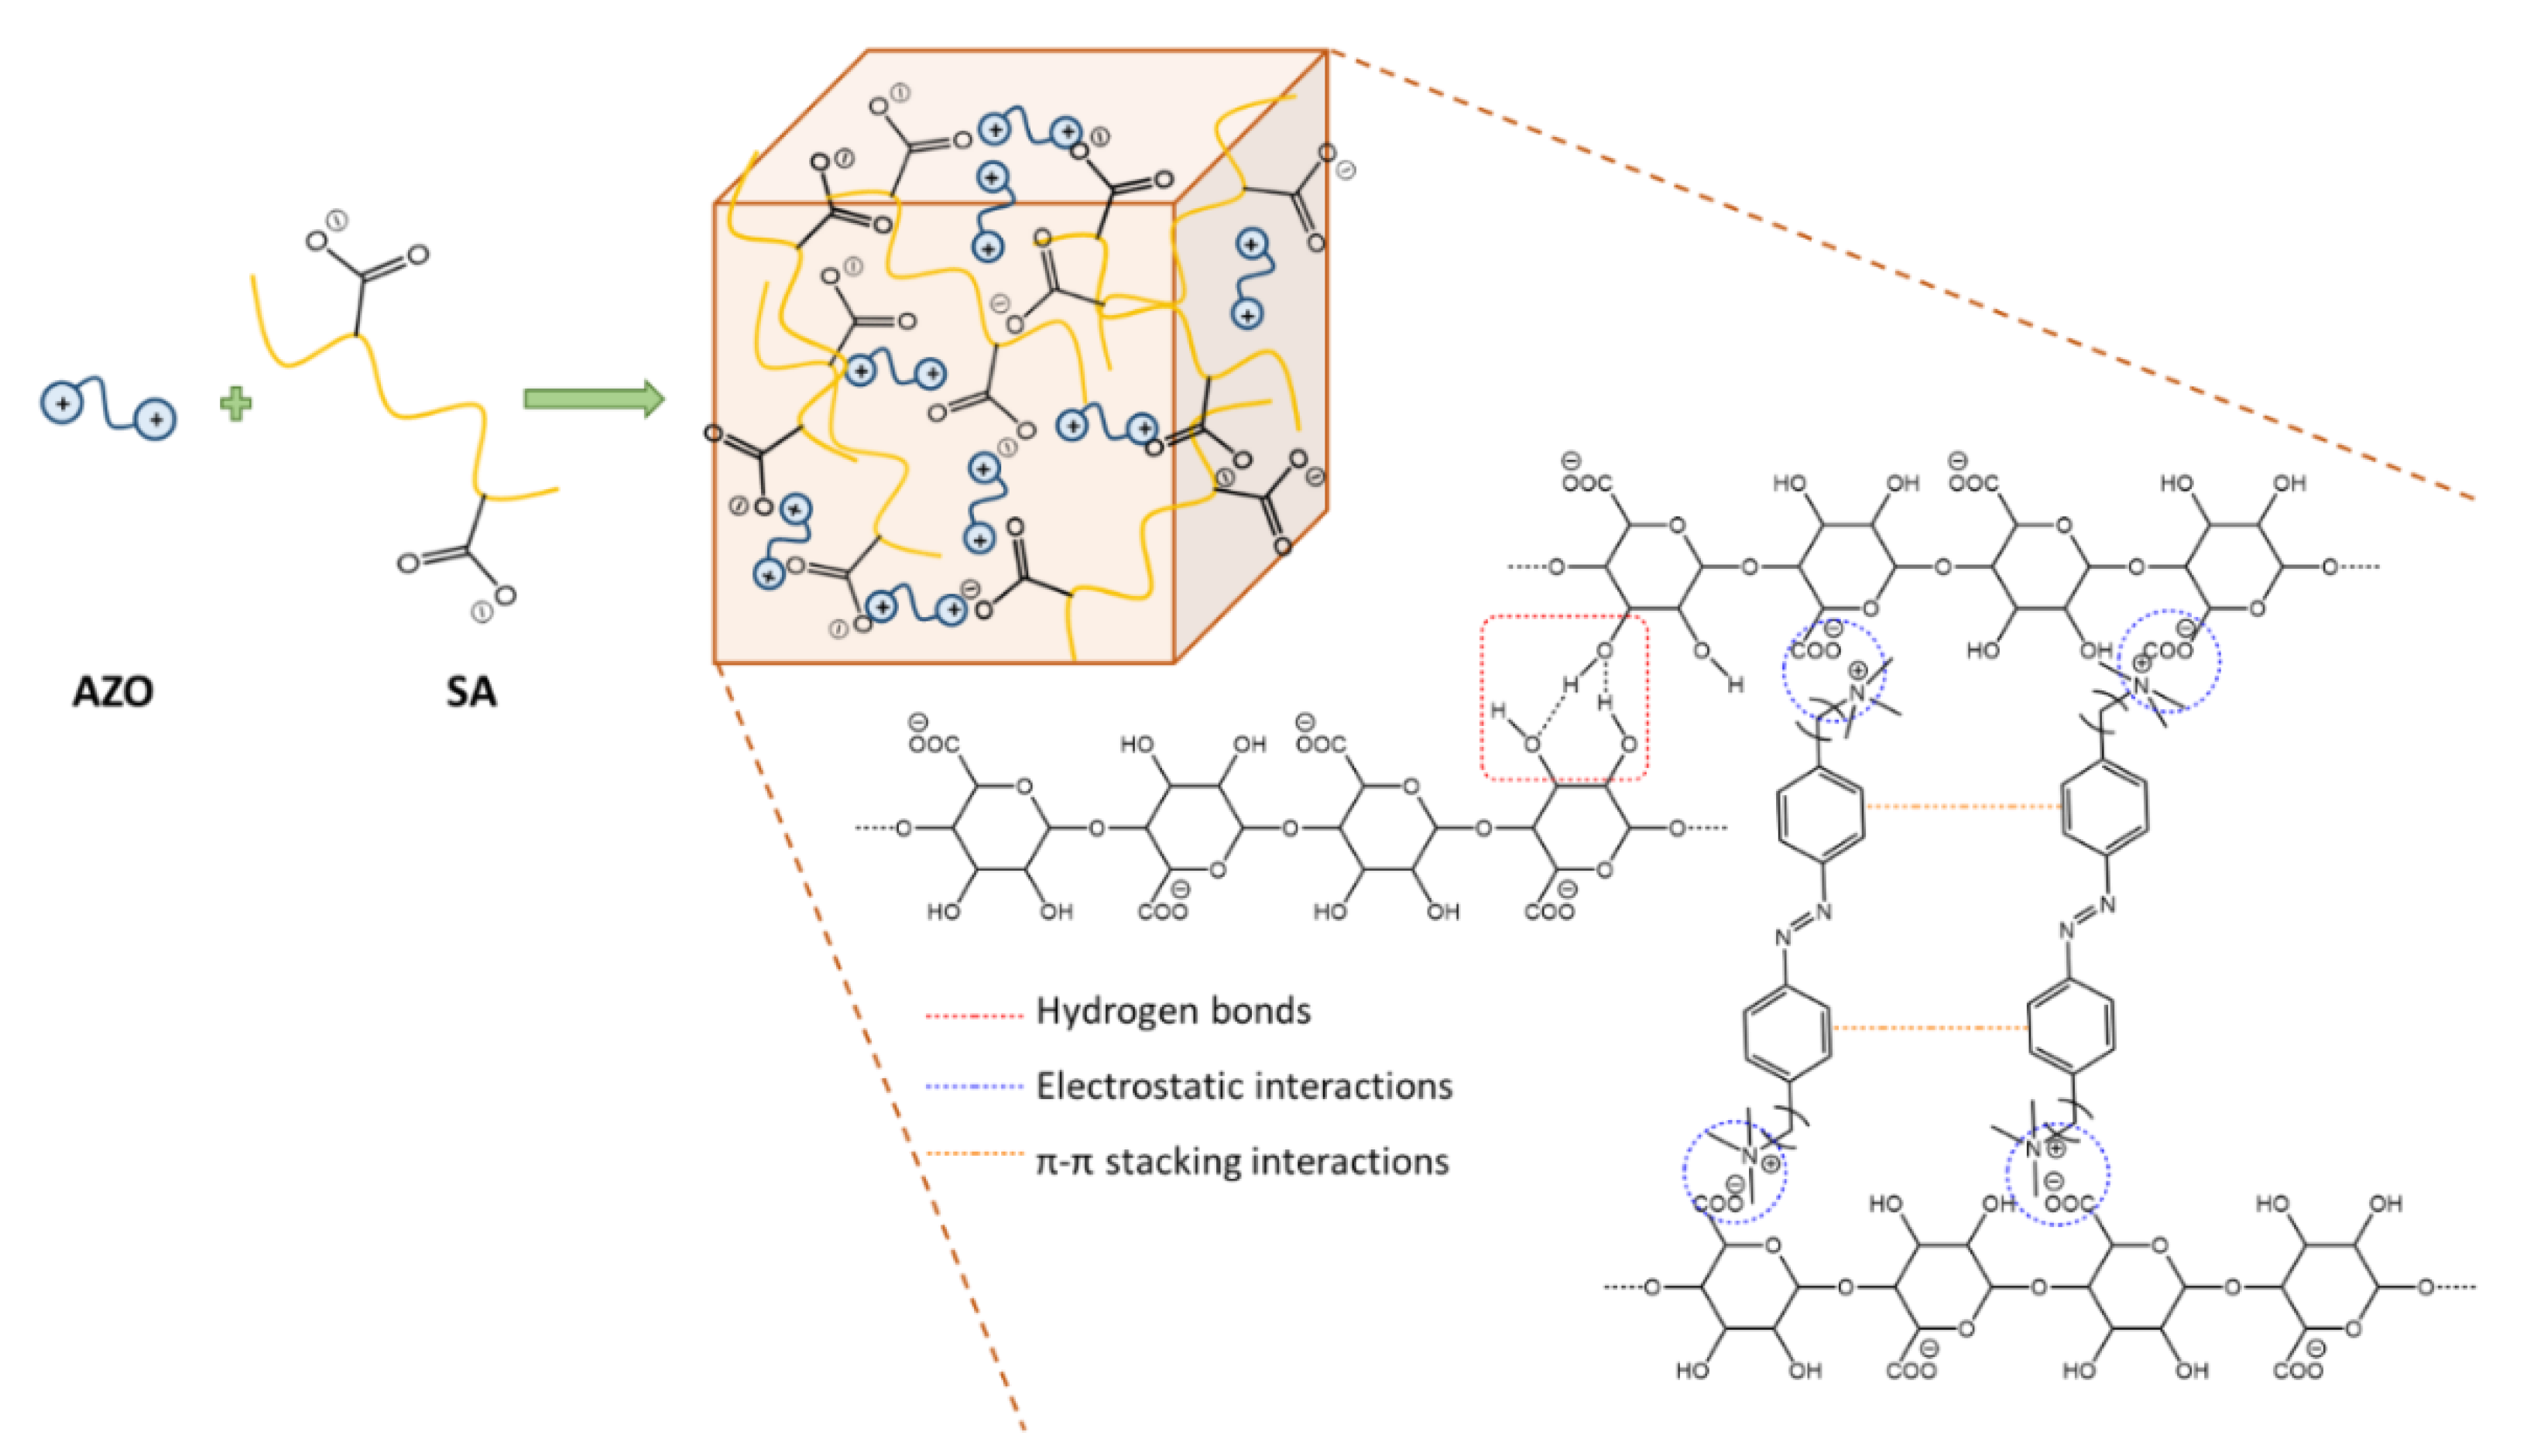

| % wt SA_% wt AZO | 8%/0.5% | 8%/1% | 5%/0.5% | 5%/1% |
|---|---|---|---|---|
| SA_AZO A | V | V | L | L |
| SA_AZO B | V | V | L | L |
| SA_AZO C | P | P | P | P |
| % wt SA_% wt AZO | 8%/0.5% | 8%/1% | 5%/0.5% | 5%/1% | 2%/0.5% | 2%/1% |
|---|---|---|---|---|---|---|
| SA_AZO A | G (2) | G (4) | L (1) | G (3) | * | * |
| SA_AZO B | * | * | G (5) | G (6) | L (7) | V (8) |
| SA_AZO C | * | * | G (9) | G (10) | L (11) | L (12) |
Disclaimer/Publisher’s Note: The statements, opinions and data contained in all publications are solely those of the individual author(s) and contributor(s) and not of MDPI and/or the editor(s). MDPI and/or the editor(s) disclaim responsibility for any injury to people or property resulting from any ideas, methods, instructions or products referred to in the content. |
© 2024 by the authors. Licensee MDPI, Basel, Switzerland. This article is an open access article distributed under the terms and conditions of the Creative Commons Attribution (CC BY) license (http://creativecommons.org/licenses/by/4.0/).


