3.7. Electrical Conductivity of NdBaInO4 and Ca-doped NdBaInO4 in the Dry Air
The electrical conductivities of NdBaInO
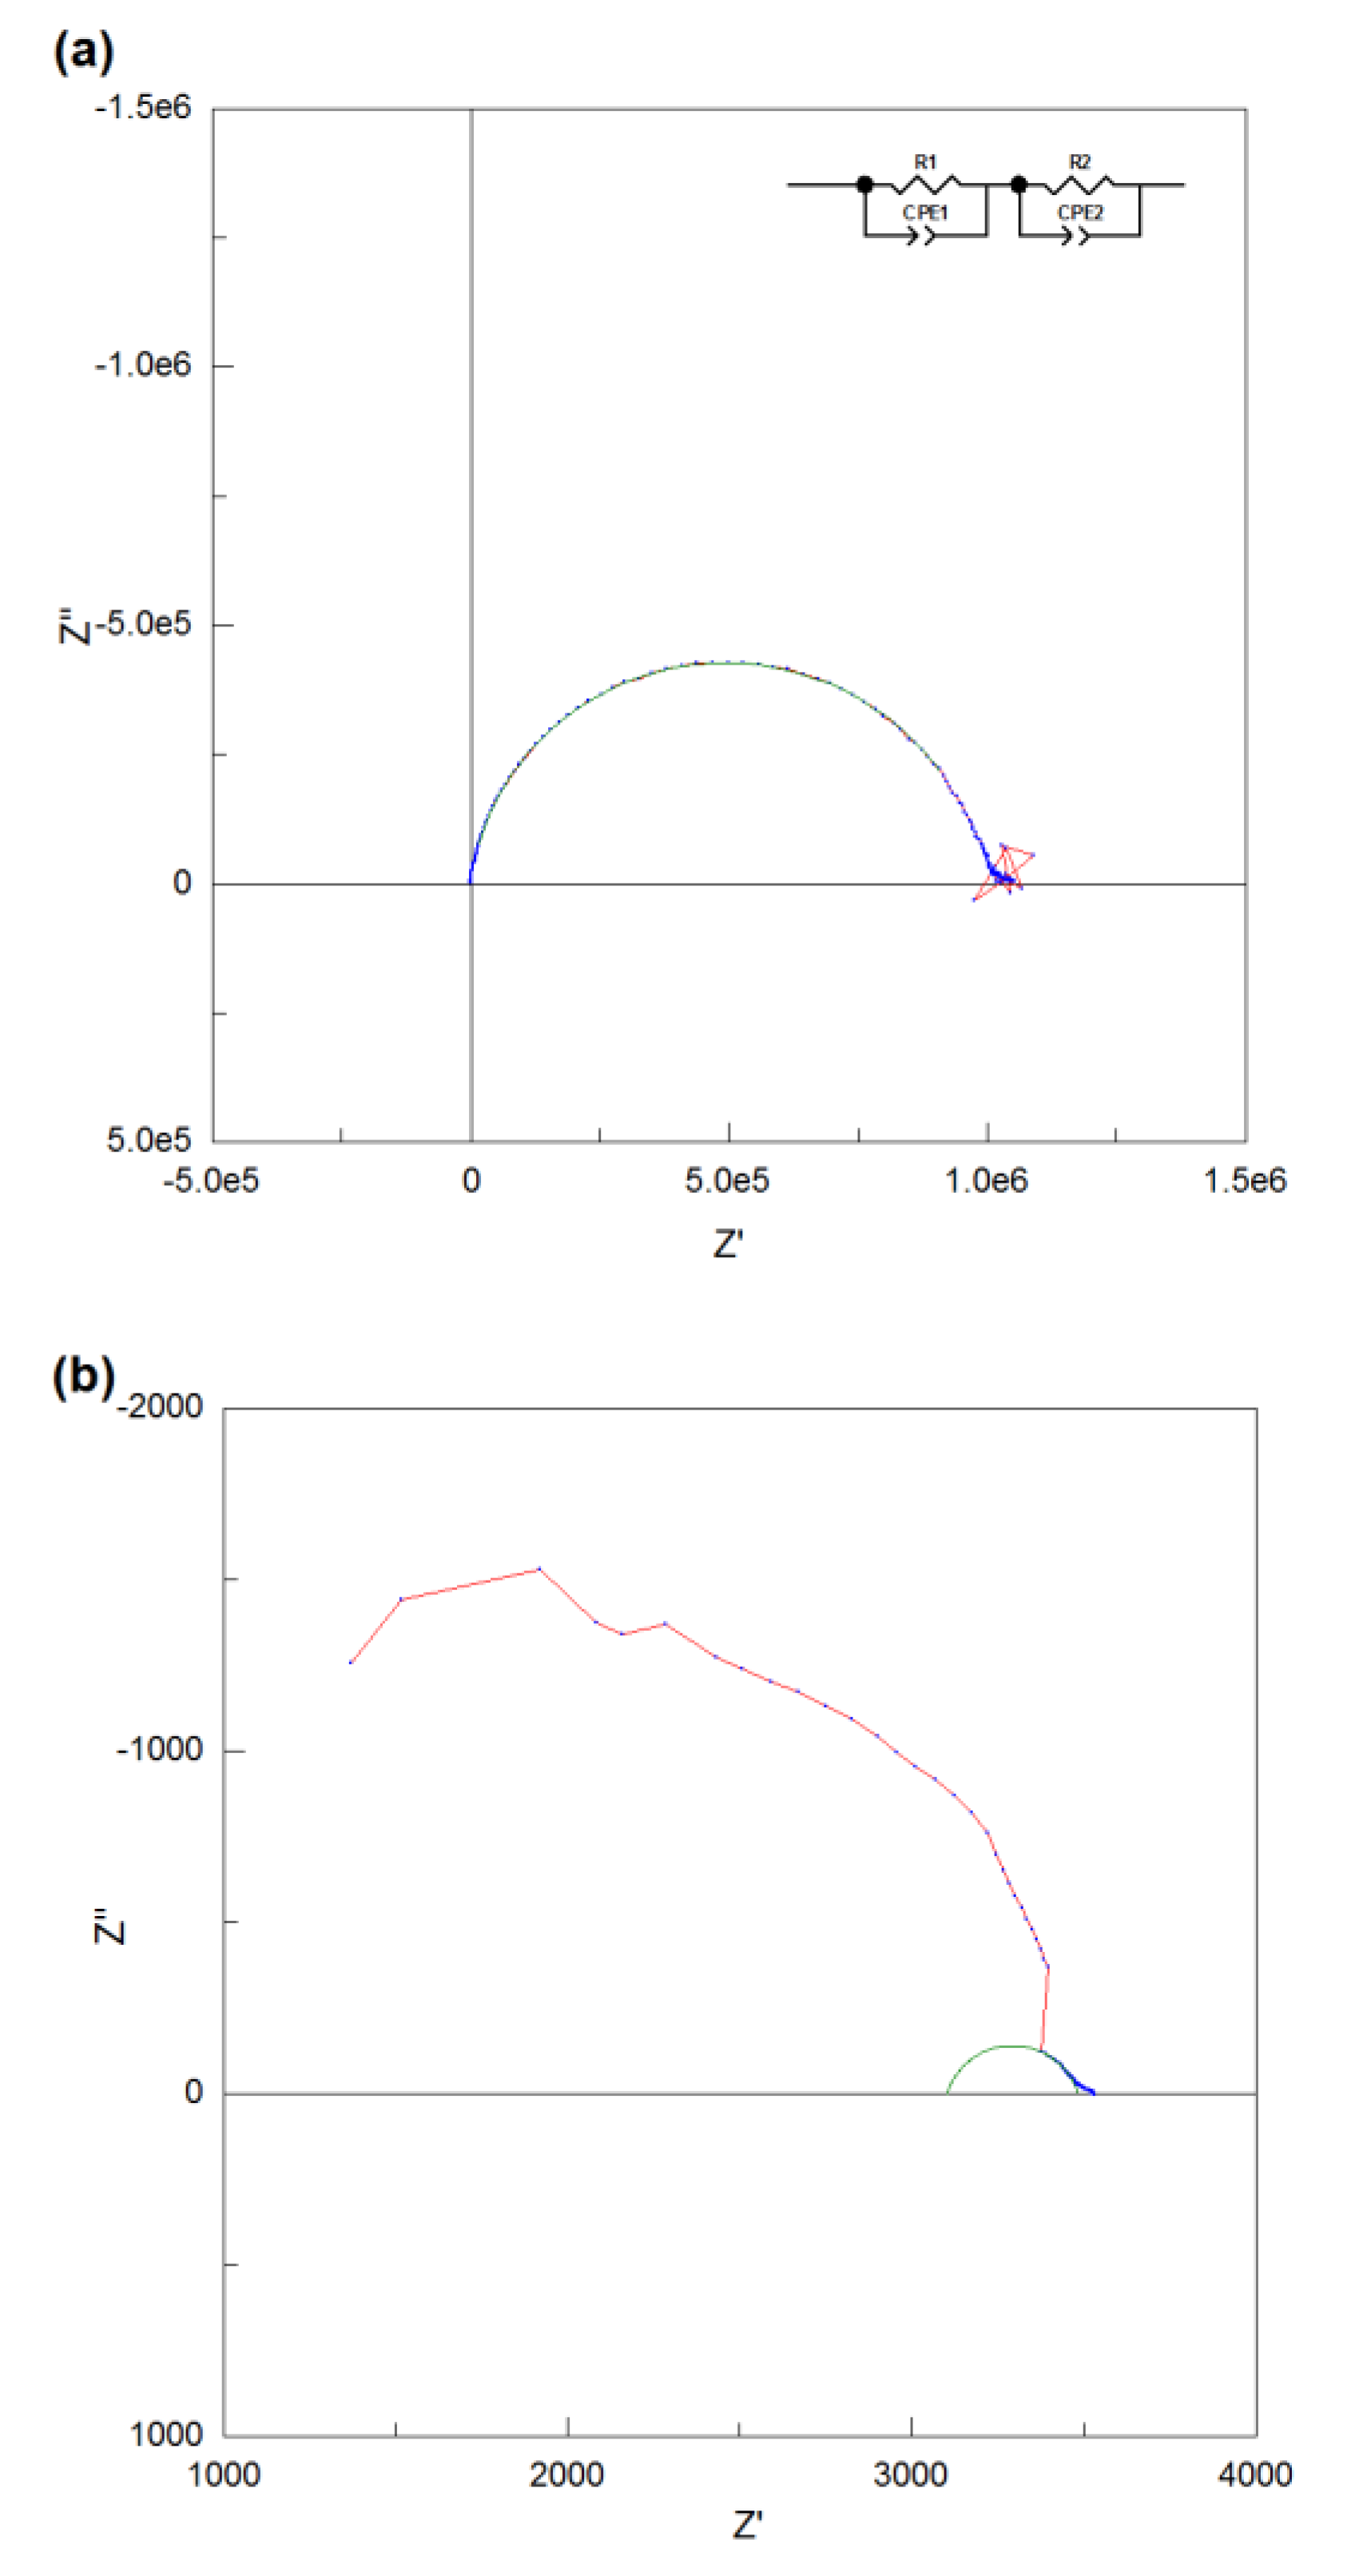
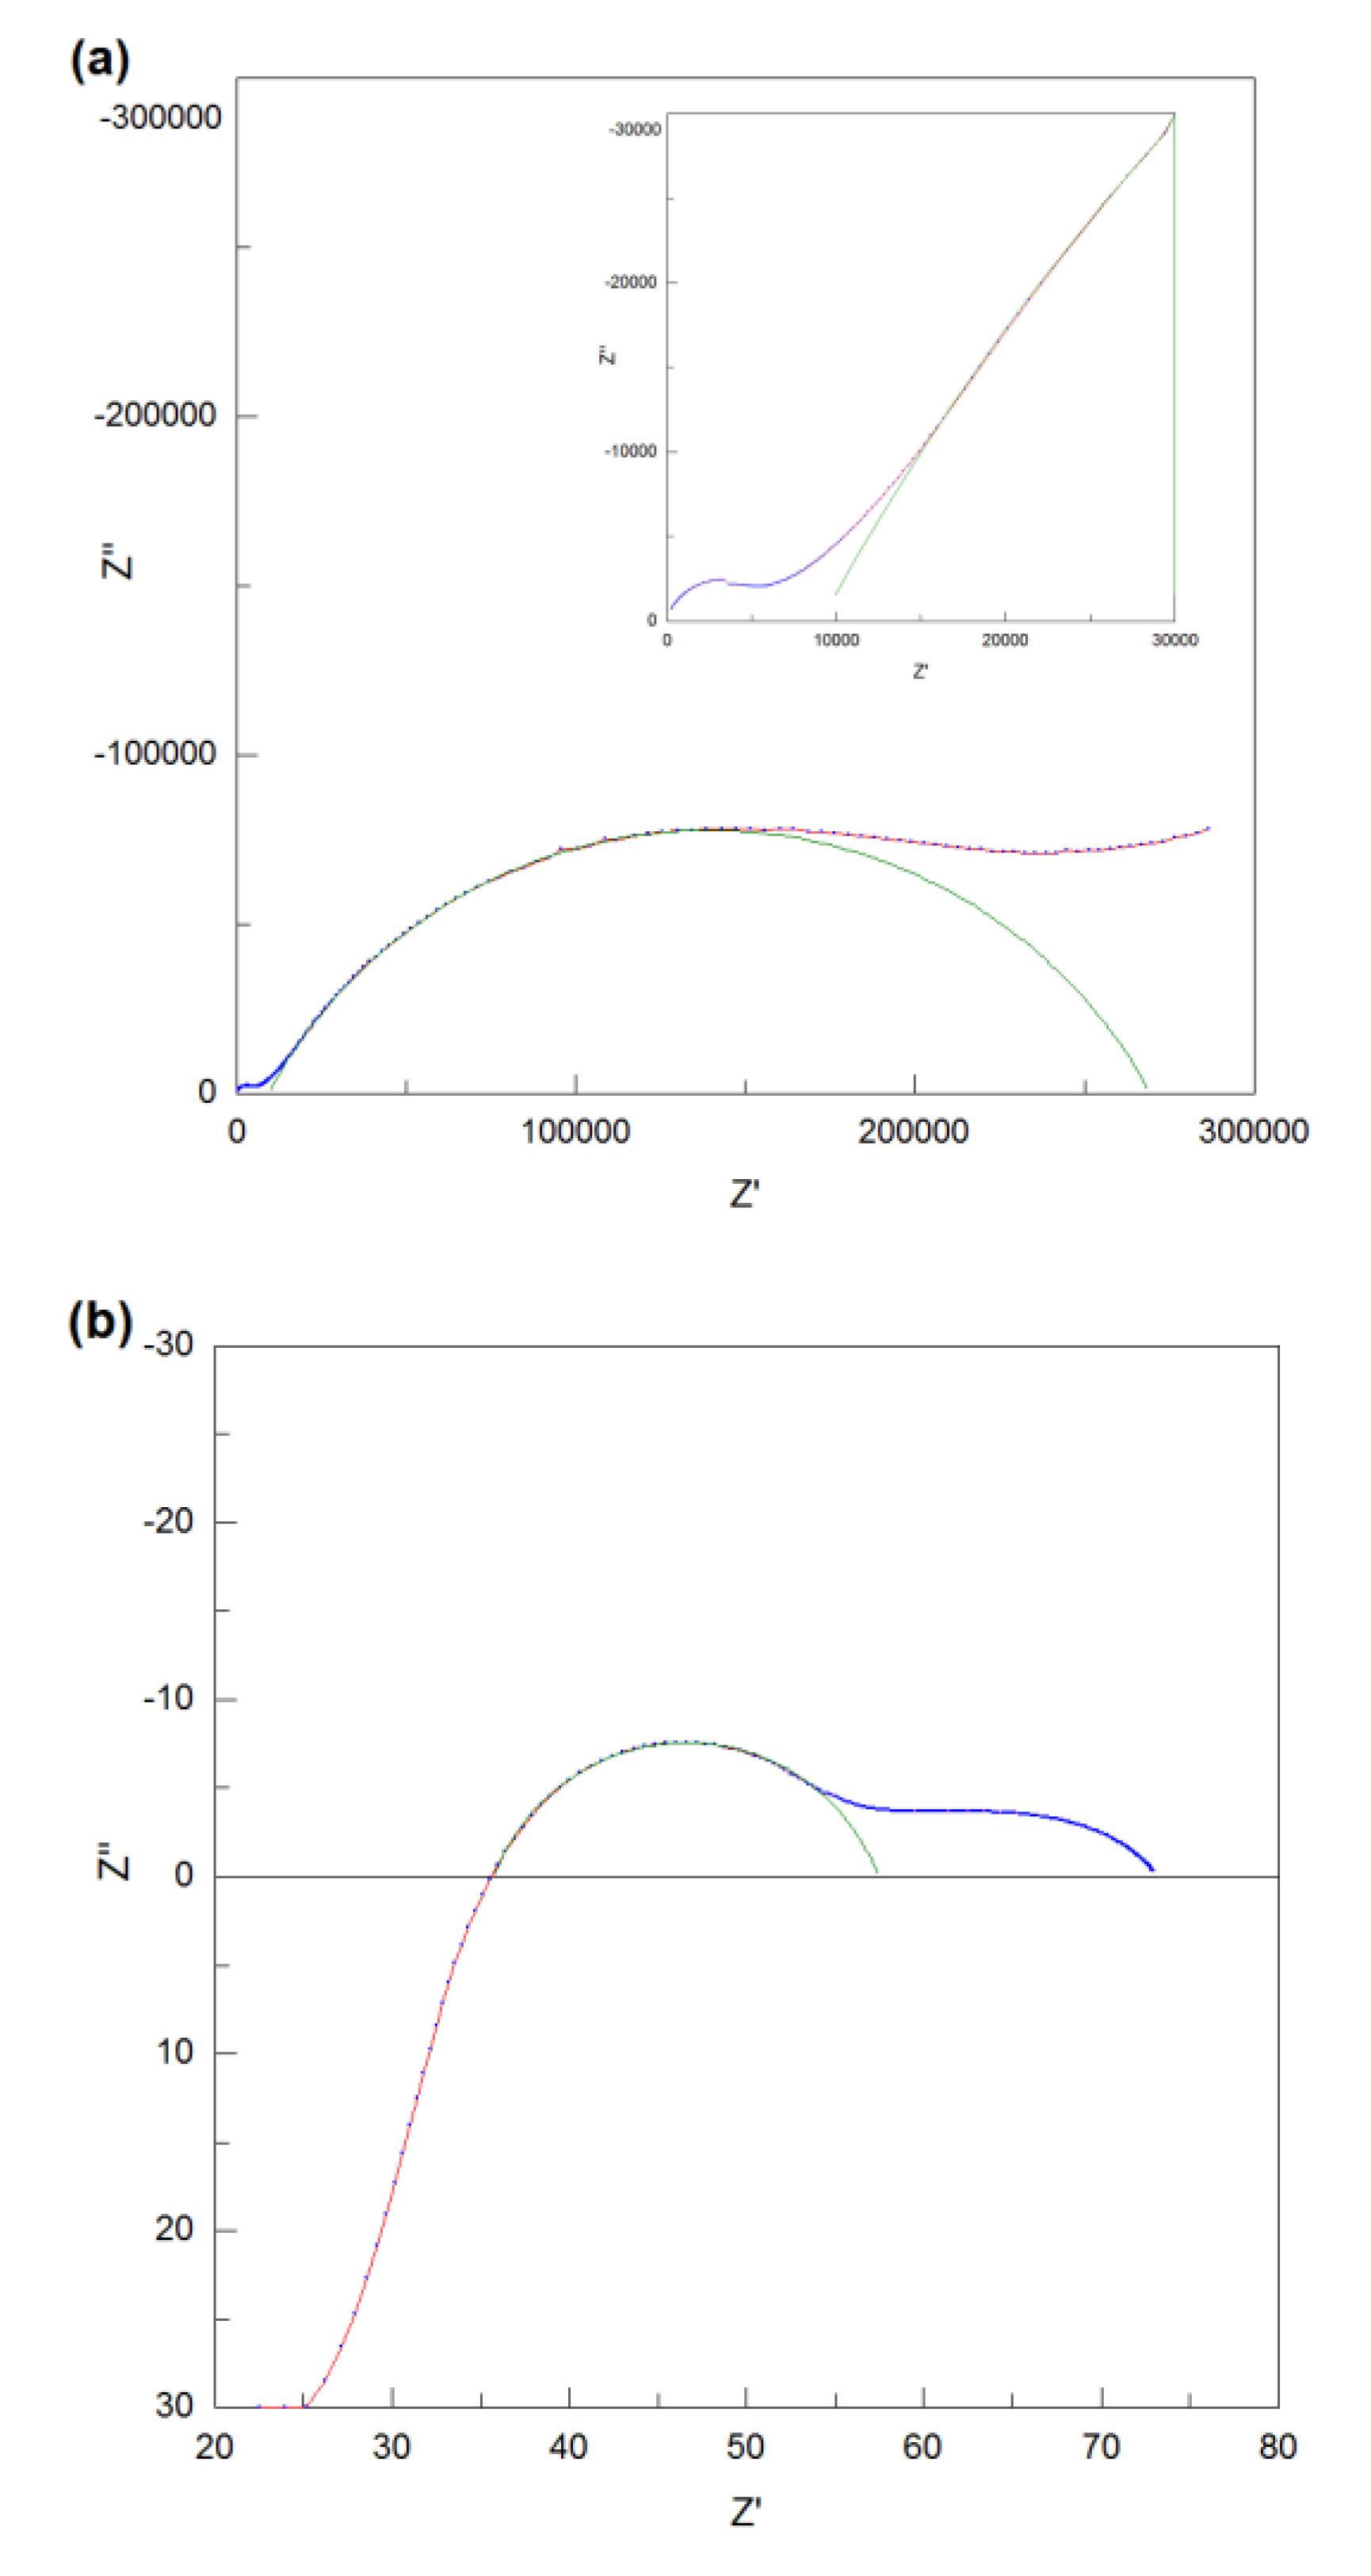
4 were measured in the dry air and the Nyquist plots of its impedance data at low temperature (280 °C) and high temperature (720 °C) are shown in
Figure 7 (a) and (b). The AC impedance data of NdBaInO
4 at low temperature was perfectly fitted with two equivalent circuits which are both composed of R-CPE elements. However, there is only one semicircle which is observable in
Figure 7 (a), which means the semicircle which corresponds to the bulk component overlaps with the semicircle which corresponds to the grain boundary component. Therefore, the total resistance of NdBaInO
4 at 280 °C can be calculated as the sum of the resistance of the bulk and grain boundary or can be obtained from the right intercept of the semicircle and the resulting value is 9.9 × 10
5 Ω. However, the resistance of the rig (about 4 Ω) also exists in the system, so it is necessary to get rid of the contribution of the rig resistance to obtain the actual resistance of the sample. It is so small when compared with the total resistance at low temperature, but it has significant contribution to the total resistance when the temperature goes higher.
At high temperature, the bulk response is absent due to the instrumental detection limit, so it is difficult to fit the whole impedance data. For the high frequency response, the shape of the semicircle is no longer observed, hence, only the low frequency response was fitted and the capacitance was estimated to be 4.4 × 10⁻¹⁰ F. In order to assign the corresponding semicircles to the different regions of the sample, it is multiplied by l/A=0.149 cm-1 of the pellet, giving the result of 6.56 × 10⁻¹¹ F. Therefore, this low frequency response corresponds to the grain boundary component and the total resistance of the sample can be obtained from the right intercepts of the semicircle. The resulting resistance is 3480 Ω after reduced by 4 Ω of the rig resistance.
The electrical conductivities of Nd
0.9Ca
0.1BaInO
3.95 and Nd
0.8Ca
0.2BaInO
3.90 in the dry air were also measured in this p and the Nyquist plots of their impedance data at low temperatures and high temperatures are shown in
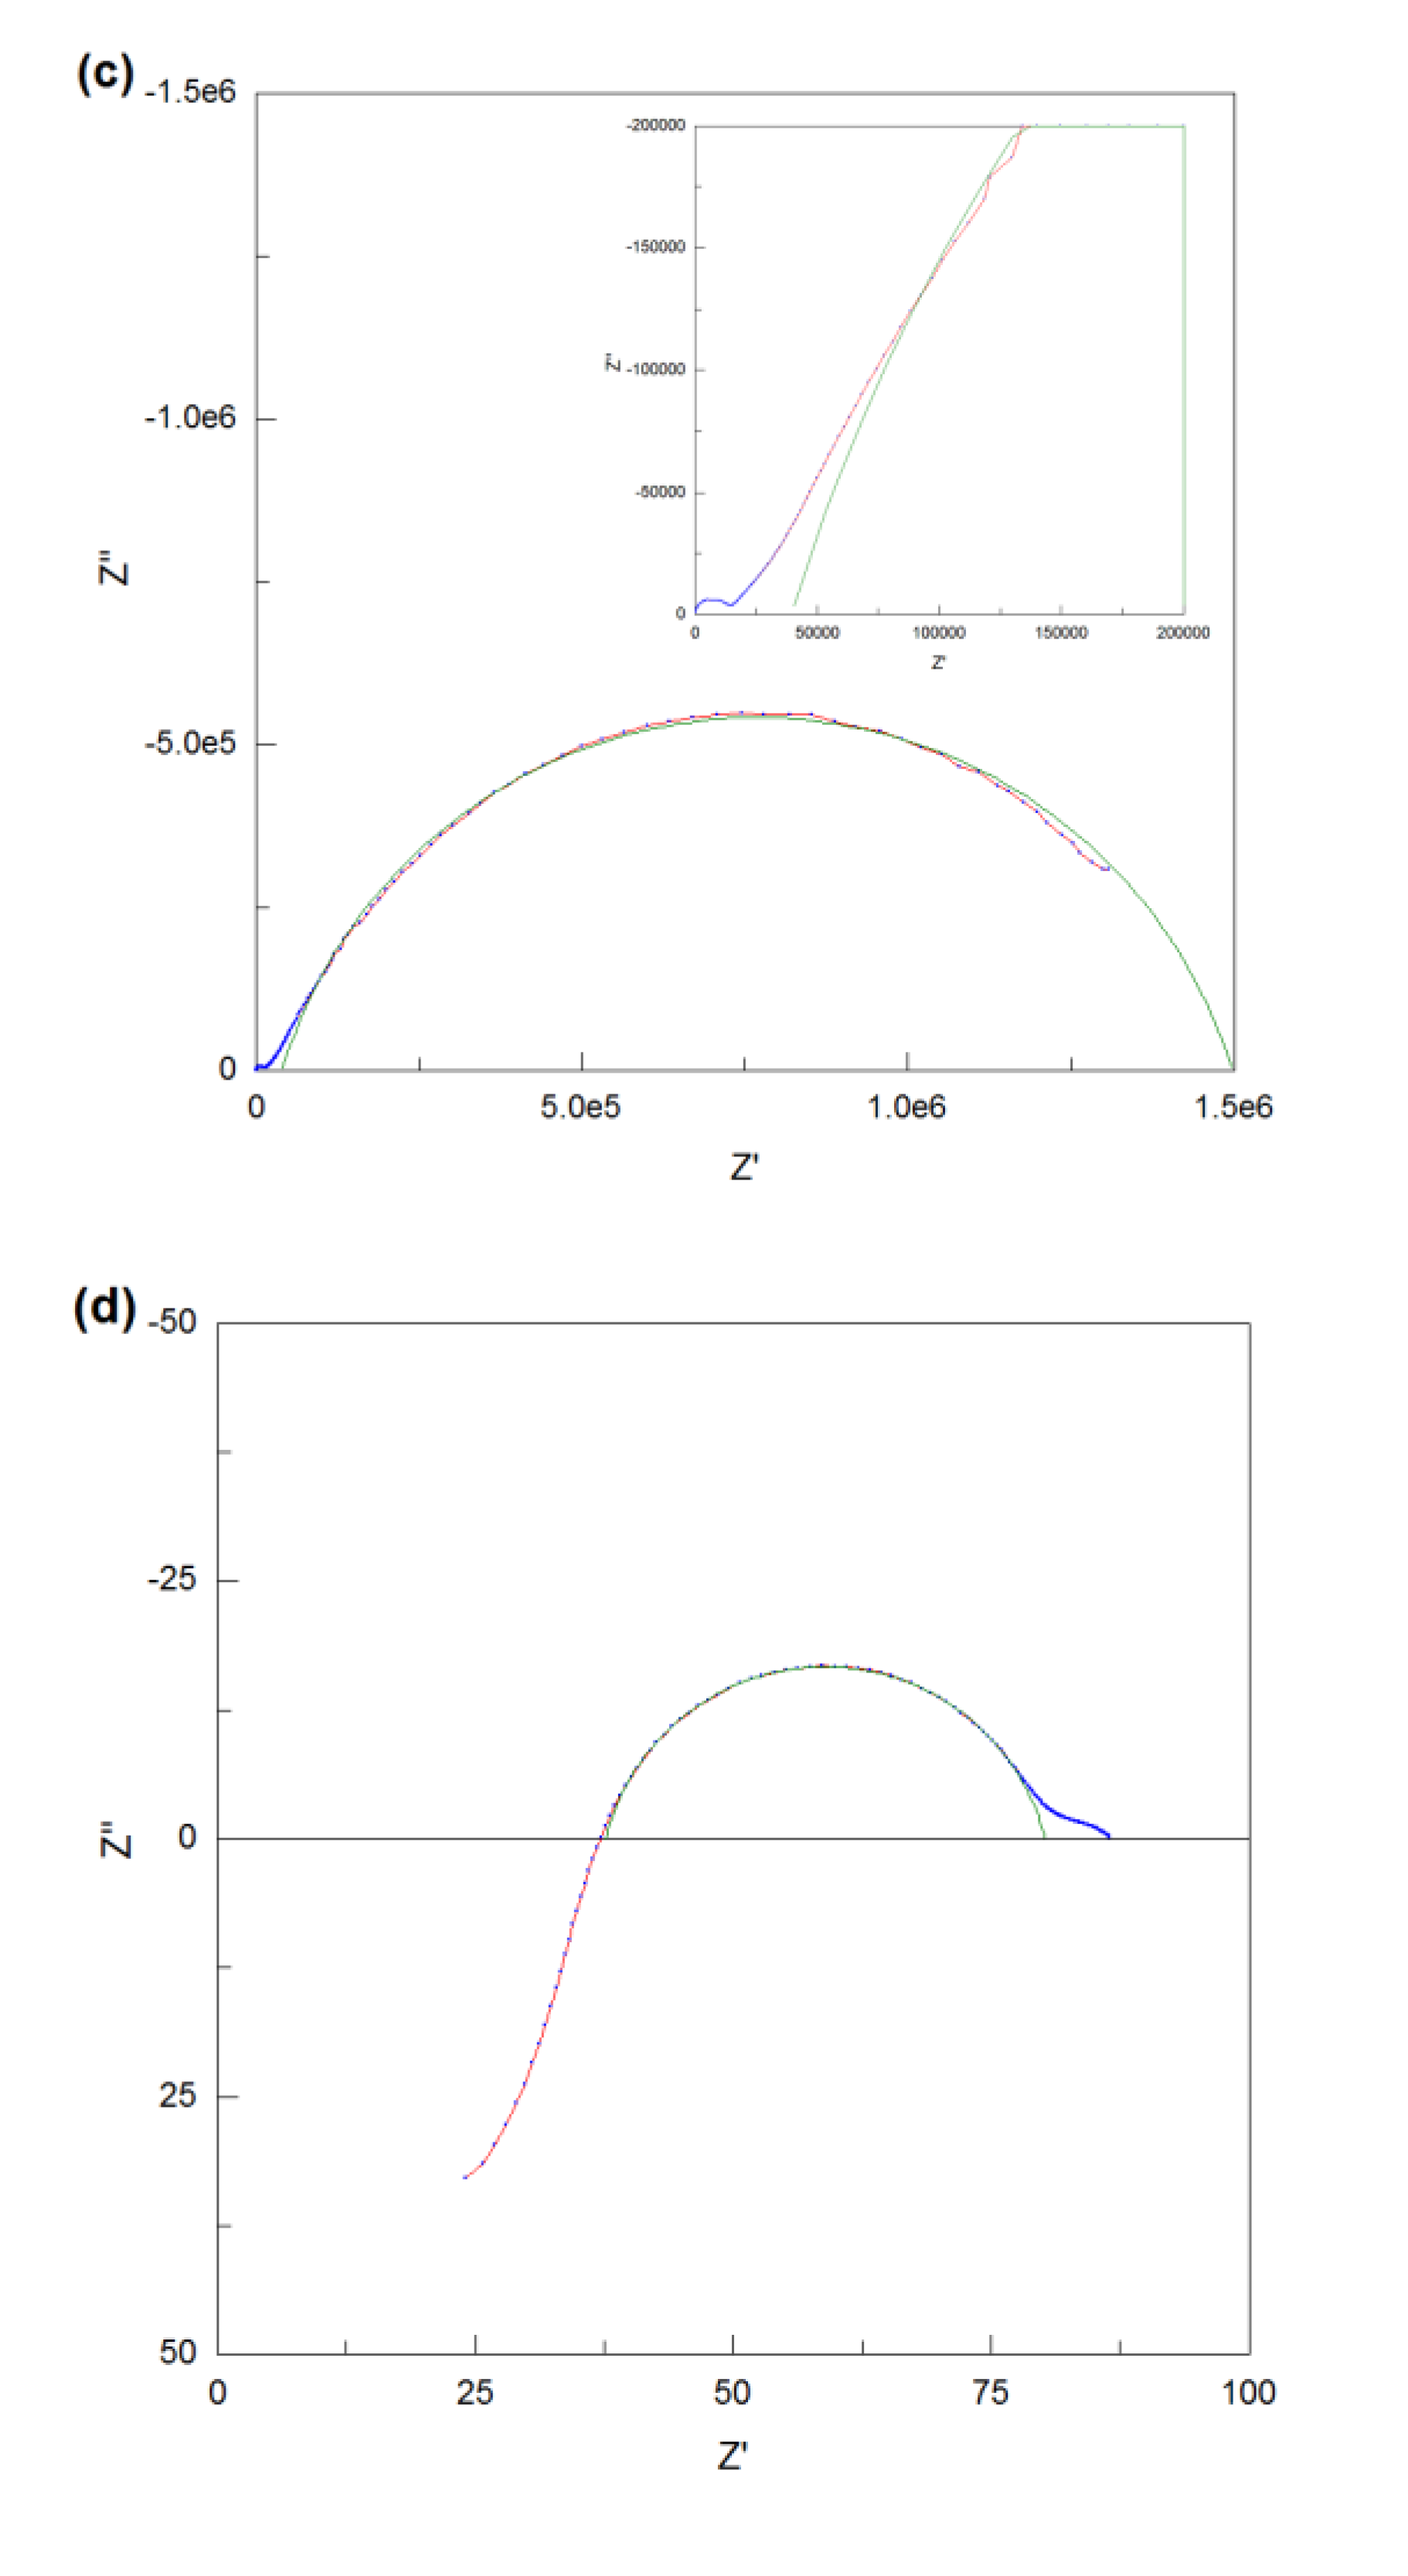
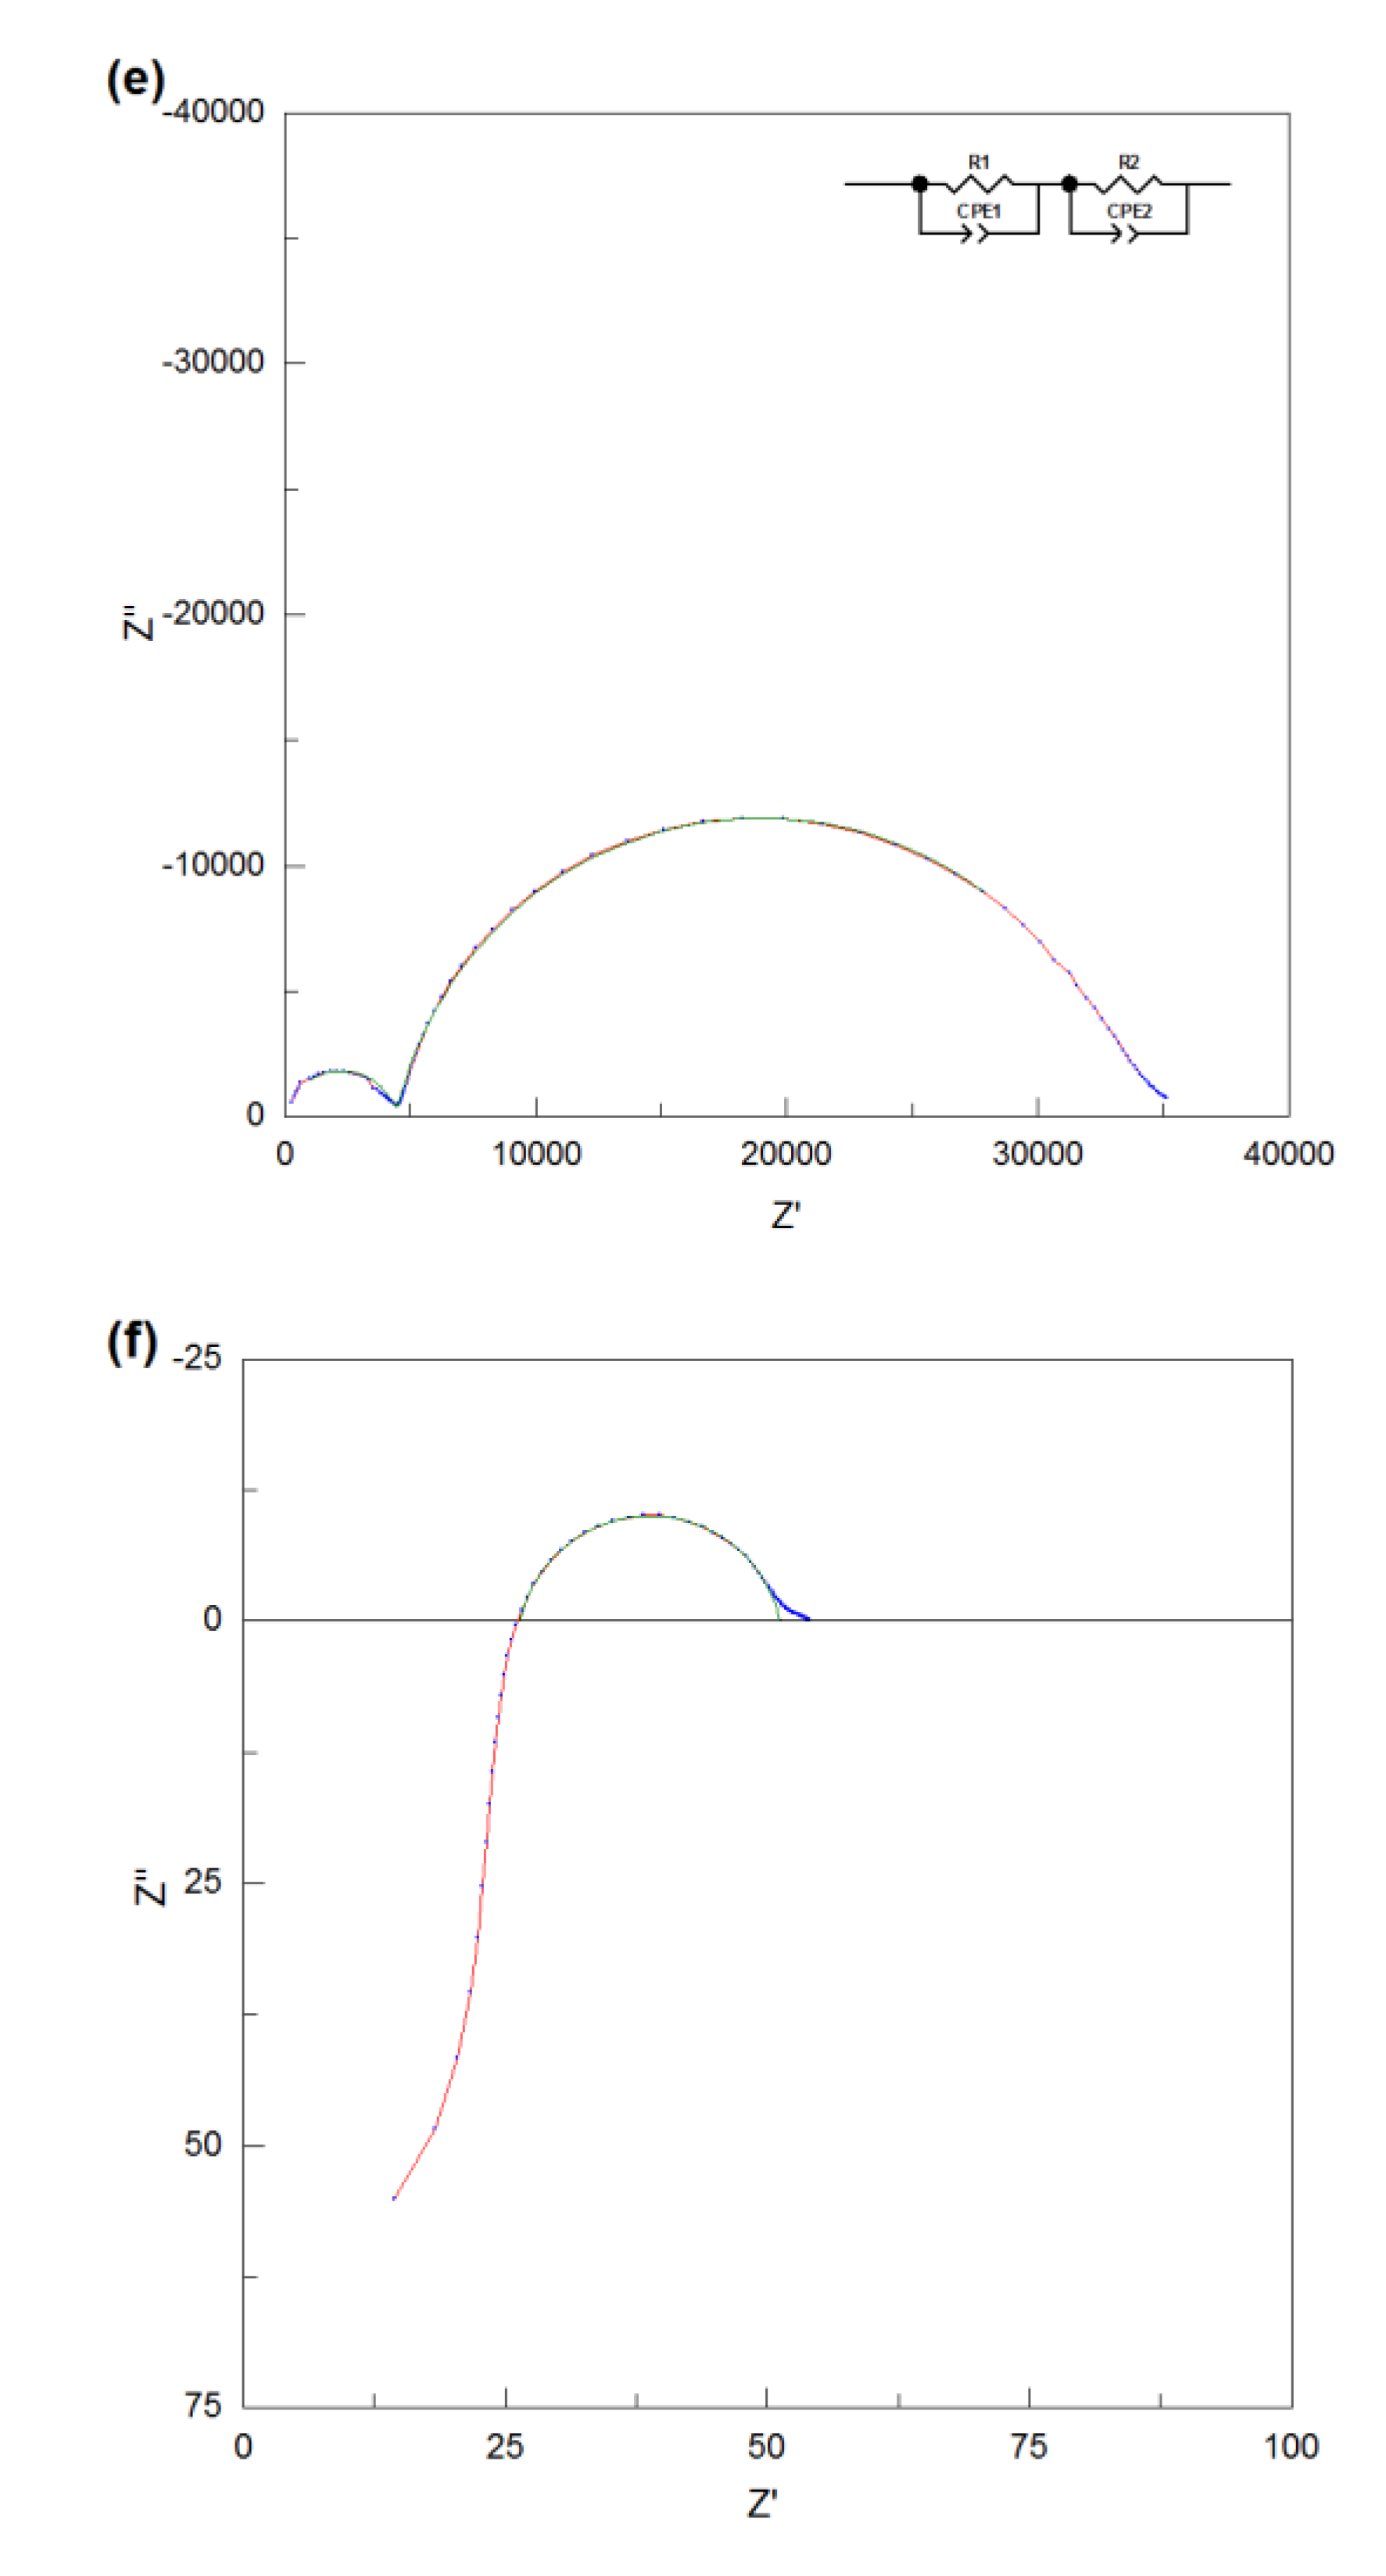
Figure 7 (c), (d), (e) and (f). As for Nd
0.9Ca
0.1BaInO
3.95 at low temperature (270 °C), from
Figure 7 (c) and the enlarged view in it, it is obviously observed that there are three frequency responses existing and the grain boundary region which corresponds to the middle frequency response is significantly overlapped with the sample-electrode interface region. But it’s difficult to use the R-CPE elements to fit them, hence, only the sample-electrode interface region was fitted manually and the total resistance of the sample at low temperature can be estimated to be the left intercept of the sample-electrode interface semicircle on Z
’ axis, giving the result of 39585 Ω. Compared with the impedance spectra at low temperature, it can be deduced that the semicircle in the middle of the high temperature impedance spectra corresponds to the sample-electrode interface component. As can be seen from the
Figure 7 (d), a part of the sample-electrode interface semicircle is in the positive imaginary impedance area, as a consequence, the intersection of this semicircle and Z
’ axis can be directly regarded as the total resistance of the pellet at high temperature. Then, after reduced by 4 Ω of the rig resistance, the resulting value of Nd
0.9Ca
0.1BaInO
3.95 was calculated to be 33.4 Ω for the dry atmosphere.
As for Nd
0.8Ca
0.2BaInO
3.90 at low temperature (390 °C) in
Figure 7 (e), it can be obviously seen that there are two complete semicircles which correspond two frequency responses. After multiplied by
l/A=0.196 cm
-1, the capacitance of the low frequency response was estimated to be 3.45 × 10
-9 F which can be assigned to the grain boundary component. Then, these two semicircles were perfectly fitted with two equivalent circuits which are both composed of R-CPE elements, and the corresponding resistances for the bulk and grain boundary were fitted to be 4469 Ω and 28981 Ω respectively. Therefore, the total electrical resistance of Nd
0.8Ca
0.2BaInO
3.90 at low temperature was calculated to be 33450 Ω. At high temperature (760 °C), the high frequency response is in the positive imaginary impedance area and the total resistance can be directly calculated to be the right intercept of the grain boundary semicircle (low frequency) on Z
’ axis, giving the result of 47.2 Ω. The same methodology was used to fit all of the data set.
The total resistance which was determined by impedance spectroscopy data can be transformed into the total conductivity by Equation (1)
where σ is the total conductivity (S m
-1),
l is the thickness of the pellet (m), A is the surface area of the pellet (cm
2), and R is the total resistance (Ω).
The total conductivity is expressed by the Arrhenius equation (Equation (2)):
where E
a is the activation energy (J mol
-1), R is the gas constant (J K
-1 mol
-1), T is the temperature (K), and σ
0 is a pre-exponential factor.
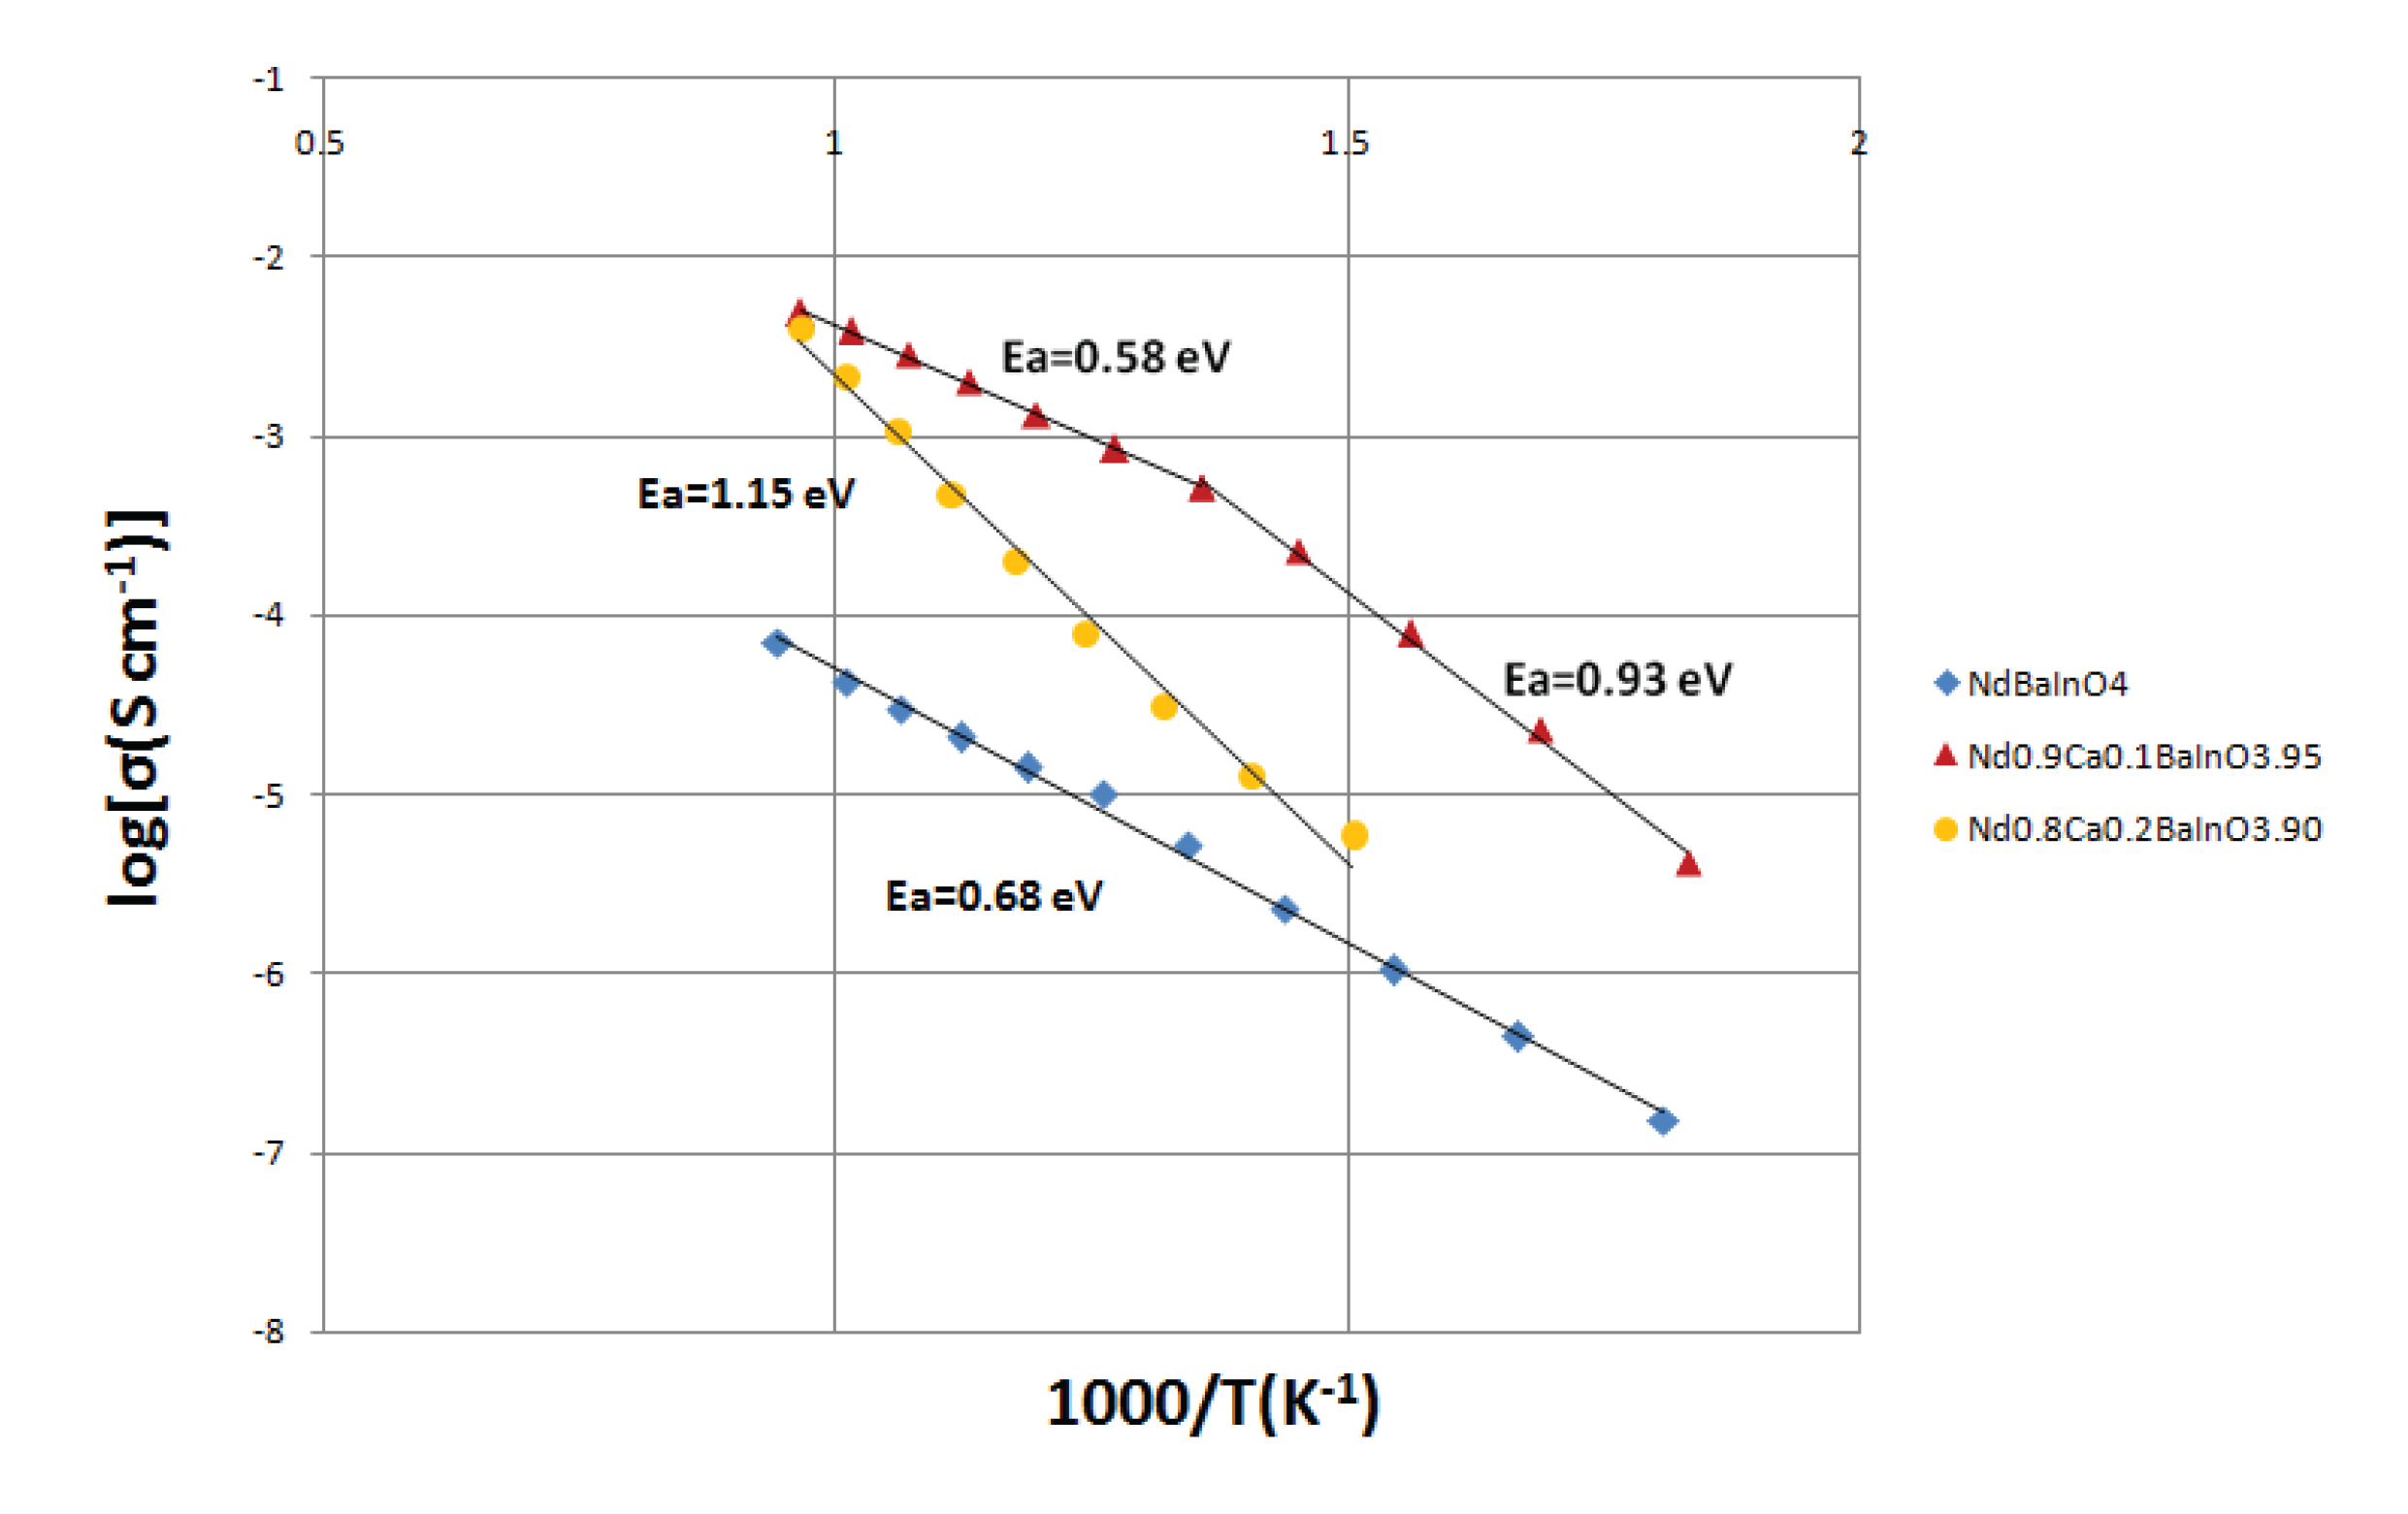
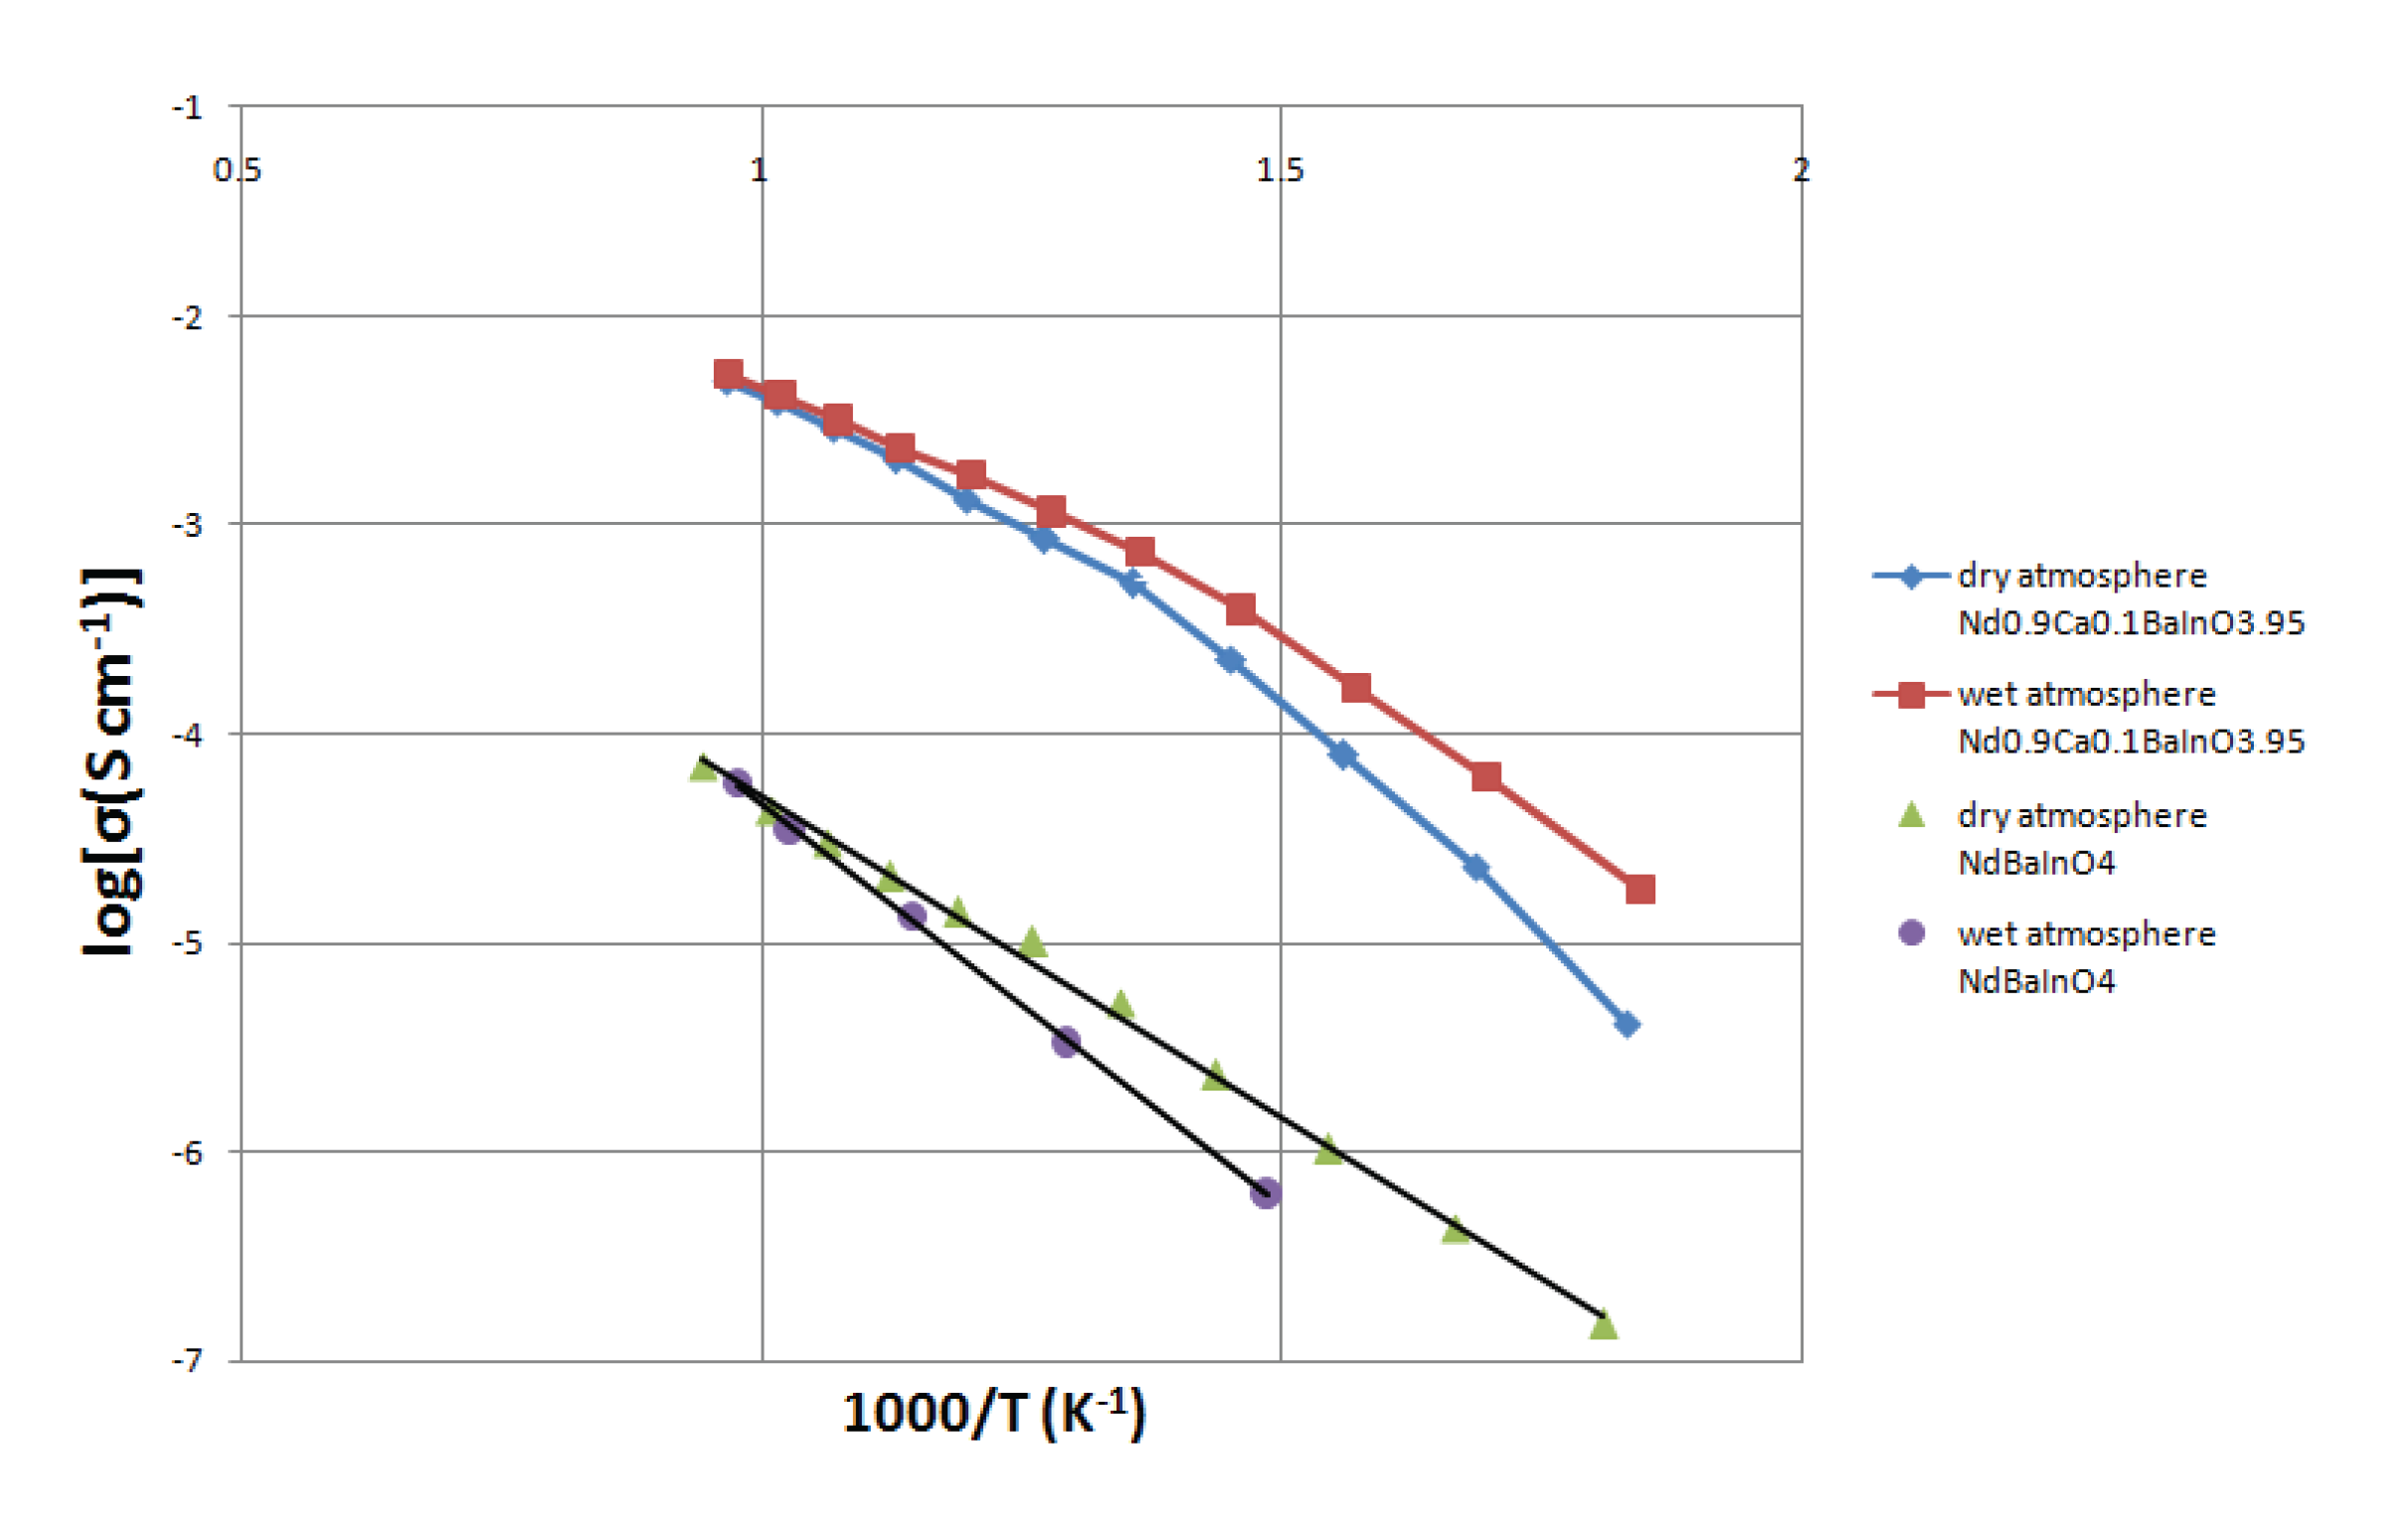
Therefore, the logarithm of the conductivity against the reciprocal of temperature is commonly plotted to get a linear relationship. The results of NdBaInO
4 and Ca-doped NdBaInO
4 which were measured in the dry air are shown in
Figure 8.
From the Arrhenius equation, it is obvious that low activation energy has the benefit of promoting the total electrical conductivity. Therefore, it is important to determine the activation energy and in order to obtain its value, the Arrhenius equation can be rearranged to Equation (3) by taking the natural logarithm:
Then a plot of the ln(σT) against the reciprocal of temperature gives a straight line and the activation energy (E
a) can be calculated from the gradient of the line by multiplying the gas constant R which is 8.314 J K
-1 mol
-1, giving the results of 0.68 eV for NdBaInO
4. It can be seen from
Figure 8 that the total electrical conductivity of NdBaInO
4 at 760 °C in the dry atmosphere is about 6.36 × 10
-5 S cm
-1. In addition, the activation energy E
a of Nd
0.9Ca
0.1BaInO
3.95 (0.93 eV) is relatively higher than that of NdBaInO
4 (0.68 eV) when the temperature is below 464 °C. The possible explanation for this phenomenon is that at low temperatures, the dopant aliovalent cations can be seen as the nucleation centers where oxygen vacancies and dopant cations bind together into defect clusters with low mobility. When the temperature is above 464 °C (737 K), those bound vacancies are dissolved and become mobile, which reduces the activation energy E
a to be 0.58 eV which is lower than that of NdBaInO
4, indicating better mobility of the oxygen species in Nd
0.9Ca
0.1BaInO
3.95. What is more, after doping the NdBaInO
4 with 10% molar fraction of Ca
2+, it can be seen from the
Figure 8 that the total electrical conductivity of the sample at 760 °C has been significantly increased by two orders of magnitude (4.91 × 10
-3 S cm
-1) due to the generation of oxygen vacancies.
When the Ca dopant concentration was increased to 20% molar fraction, the activation energy was raised to 1.15 eV which is even bigger than that of the NdBaInO4, but the total electrical conductivity was improved to a certain extent when compared with the undoped material. Above all, Nd0.9Ca0.1BaInO3.95 exhibited the highest total electrical conductivity and the lowest activation energy among Nd1-xCaxBaInO4-x/2 (x = 0, 0.1 and 0.2).
3.8. The Effects of the Humidified Atmosphere on the Conductivity of NdBaInO4 and Nd0.9Ca0.1BaInO3.95
The electrical conductivity measurements were also conducted in the wet atmosphere for NdBaInO
4 and Nd
0.9Ca
0.1BaInO
3.95 pellets separately with using AC impedance spectroscopy and the Nyquist plots of the impedance data for Nd
0.9Ca
0.1BaInO
3.95 at low temperature (270°C) and high temperature (760 °C) in the wet atmosphere are shown in
Figure 9. As the same with the Nyquist plots of the dry atmosphere, the sample-electrode interface region was fitted manually and the total resistance of the sample at low temperature can be estimated to be the left intercept of the sample-electrode interface semicircle on Z
’ axis, giving the result of 9089.4 Ω. At high temperature, the intersection of the semicircle and Z
’ axis can be directly regarded as the total resistance of the pellet. Then, after reduced by 4 Ω of the rig resistance, the resulting value of Nd
0.9Ca
0.1BaInO
3.95 was calculated to be 31.7 Ω for the wet atmosphere.
As before, the logarithm of the total conductivity against the inverse temperature of undoped and 10% Ca-doped material were also plotted to get linear relationships and the resulting graph is displayed in
Figure 10. It can be observed that the total conductivity of Nd
0.9Ca
0.1BaInO
3.95 measured in the wet atmosphere at moderate temperature is relatively higher than that in the dry atmosphere. On the contrary, the total conductivity of the undoped pellet which was performed in the dry atmosphere is lightly higher than that in the wet atmosphere. So this slight deviation at low temperature requires further investigation. Therefore, the excess conductivity of Nd
0.9Ca
0.1BaInO
3.95 in wet atmosphere suggests that potential proton conduction may exist because oxygen vacancies generally make contributions to the proton conduction. What is more, the proton conductivity of the doped material reaches the maximum and the total conductivity tends to be uniform at a certain high temperature (800 °C), which might results from the depleted proton charge carrier at elevated temperature. Similar behavior has been observed in other proton conducting system such as BaCeZr
3-d and Ca doped LaNbO
4 [
12].
