Submitted:
09 March 2024
Posted:
11 March 2024
You are already at the latest version
Abstract
Keywords:
1. Introduction
2. Materials and Methods
2.1. Fungal Strains, Plants, and Culture Conditions
2.2. Bioinformatics Analysis of SsDim5
2.3. Gene Knockout and Genetic Complementation of SsDim5
2.4. DNA Extraction, RNA Extraction and cDNA Synthesis
2.5. Quantitative Real-Time PCR (qRT-PCR) Analysis
2.6. Inoculation and Virulence Determination
2.7. Appressorium Observation and Oxalic Acid Analysis
2.8. Western Blot Analysis of H3K9 Trimethylates
2.9. Abiotic Stress Response Assay
2.10. RNA Sequencing and Data Analysis
3. Results
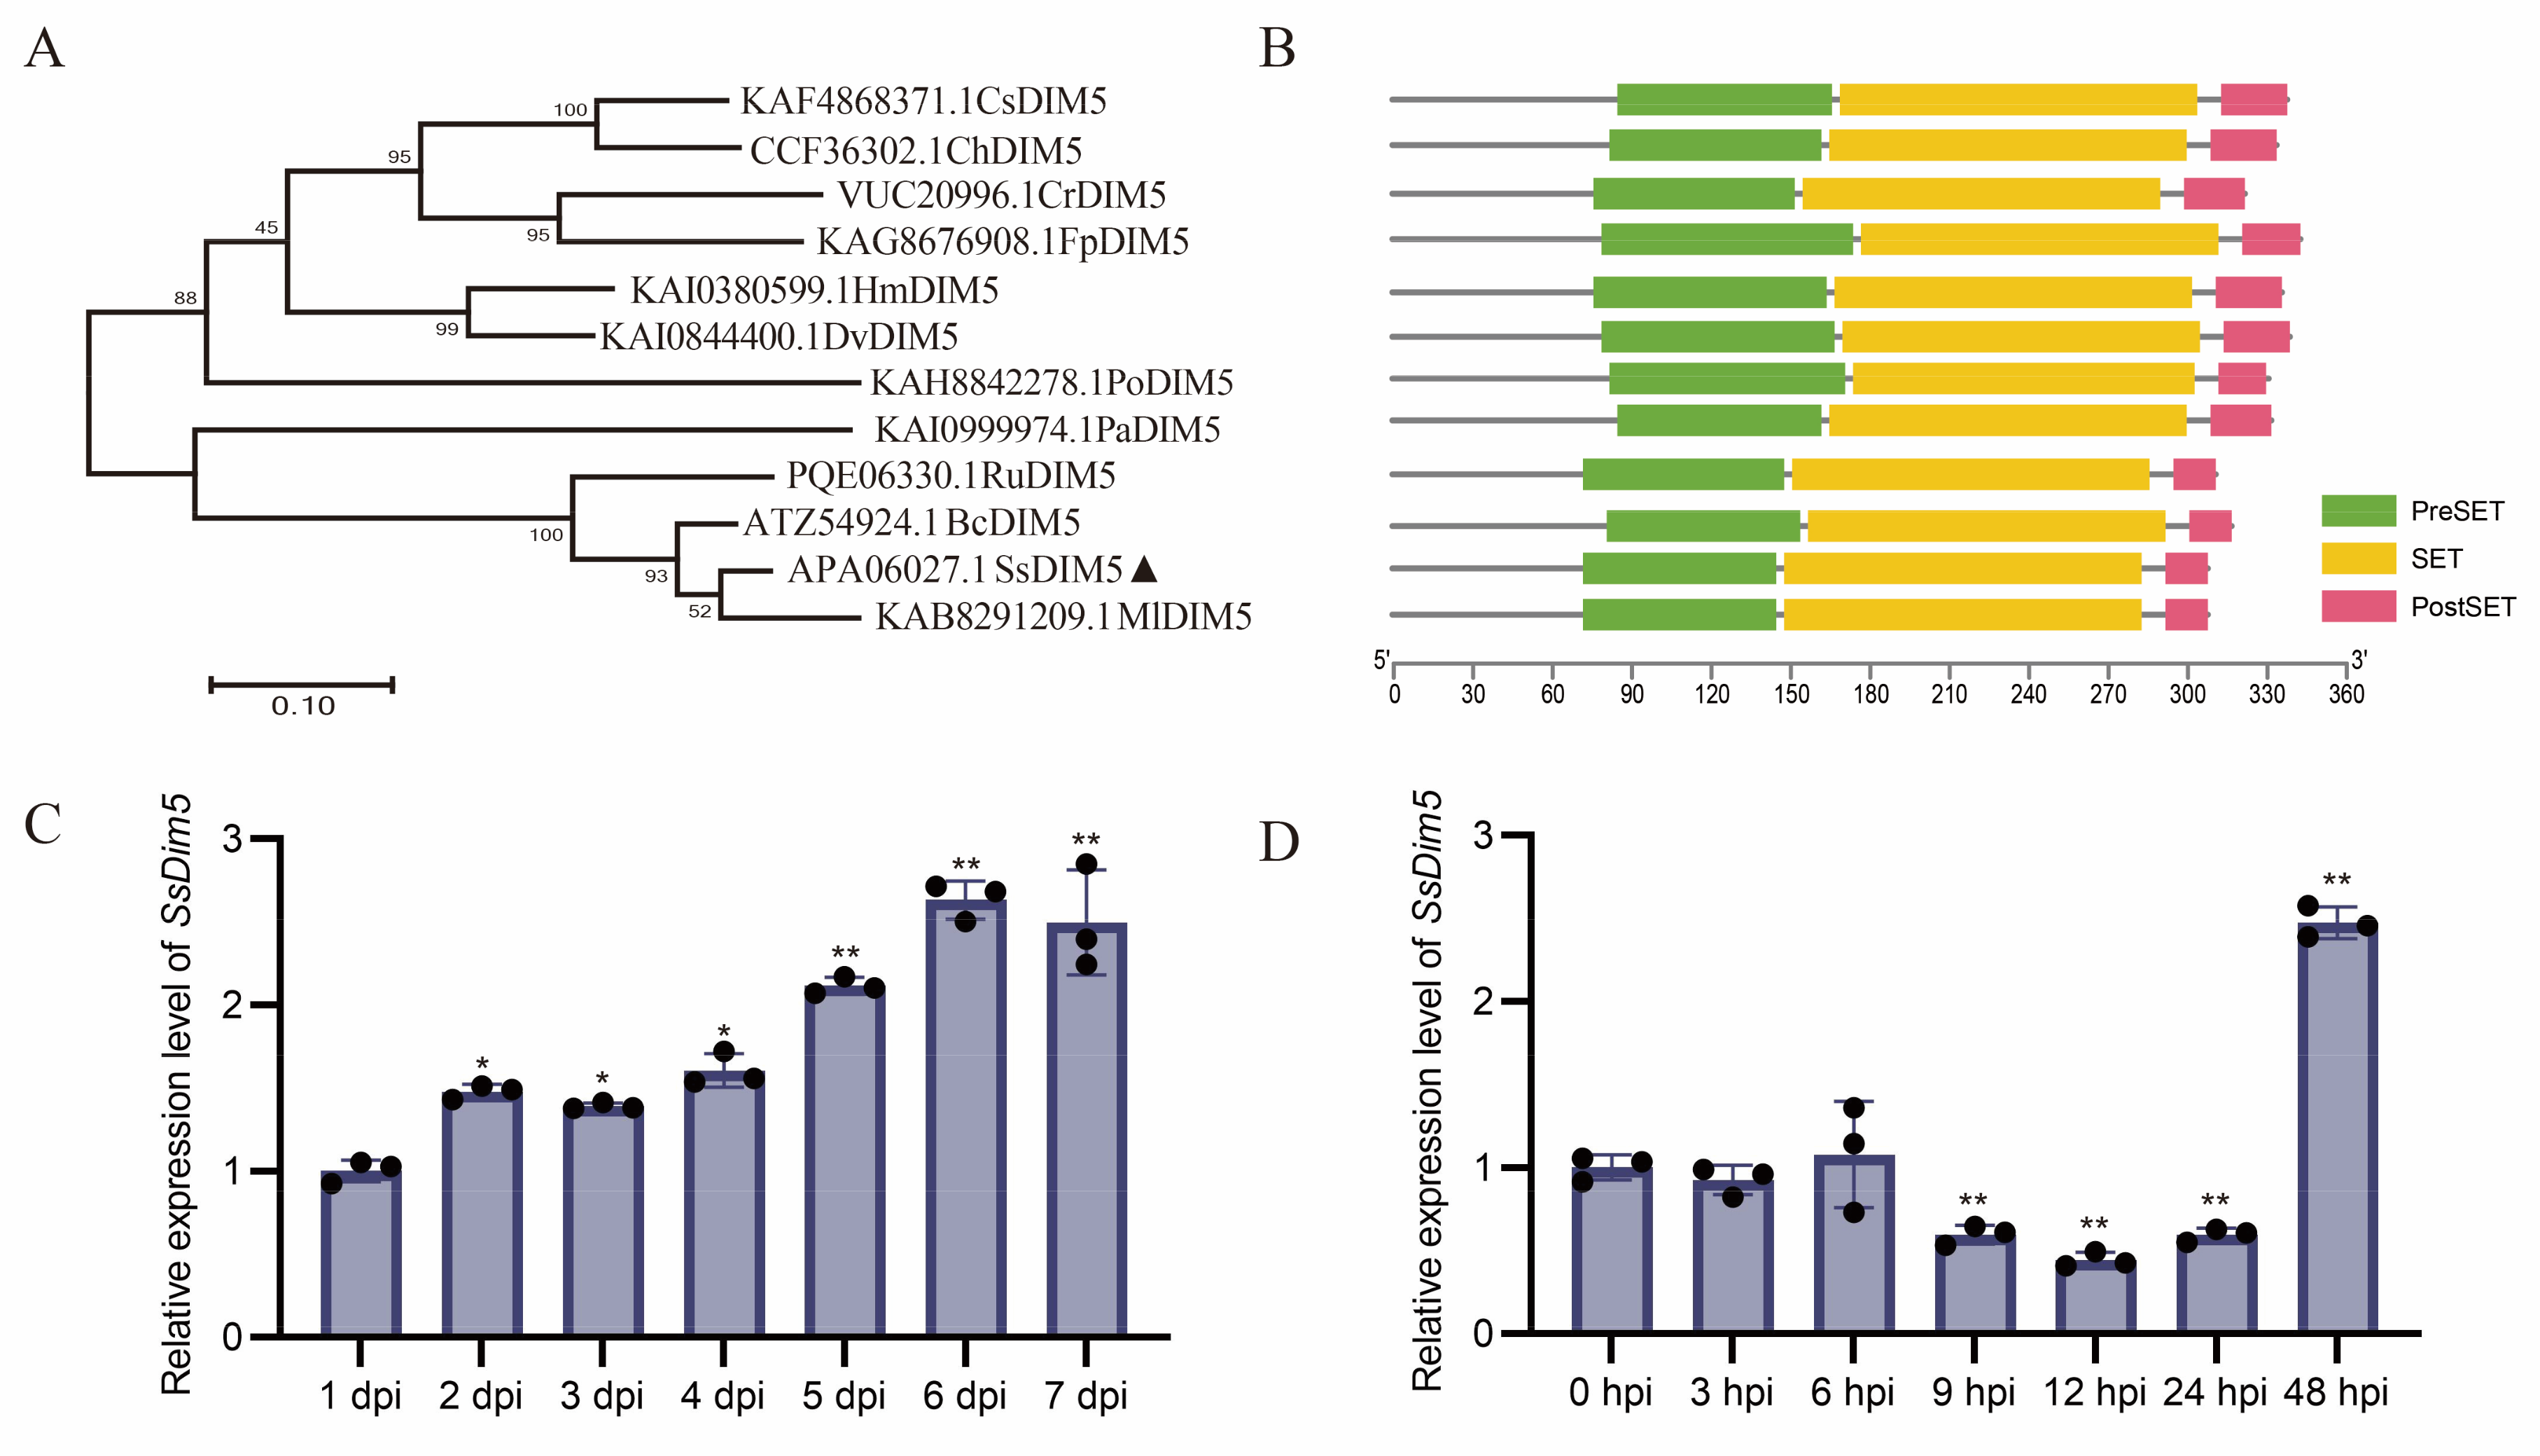
3.1. Identification of S. sclerotiorum Histone H3K9 Methyltransferase
3.2. Expression Patterns of SsDim5 during Development and Infection Stages
3.3. Generation of SsDim5 Knockout Mutants and Genetic Complementation Strains
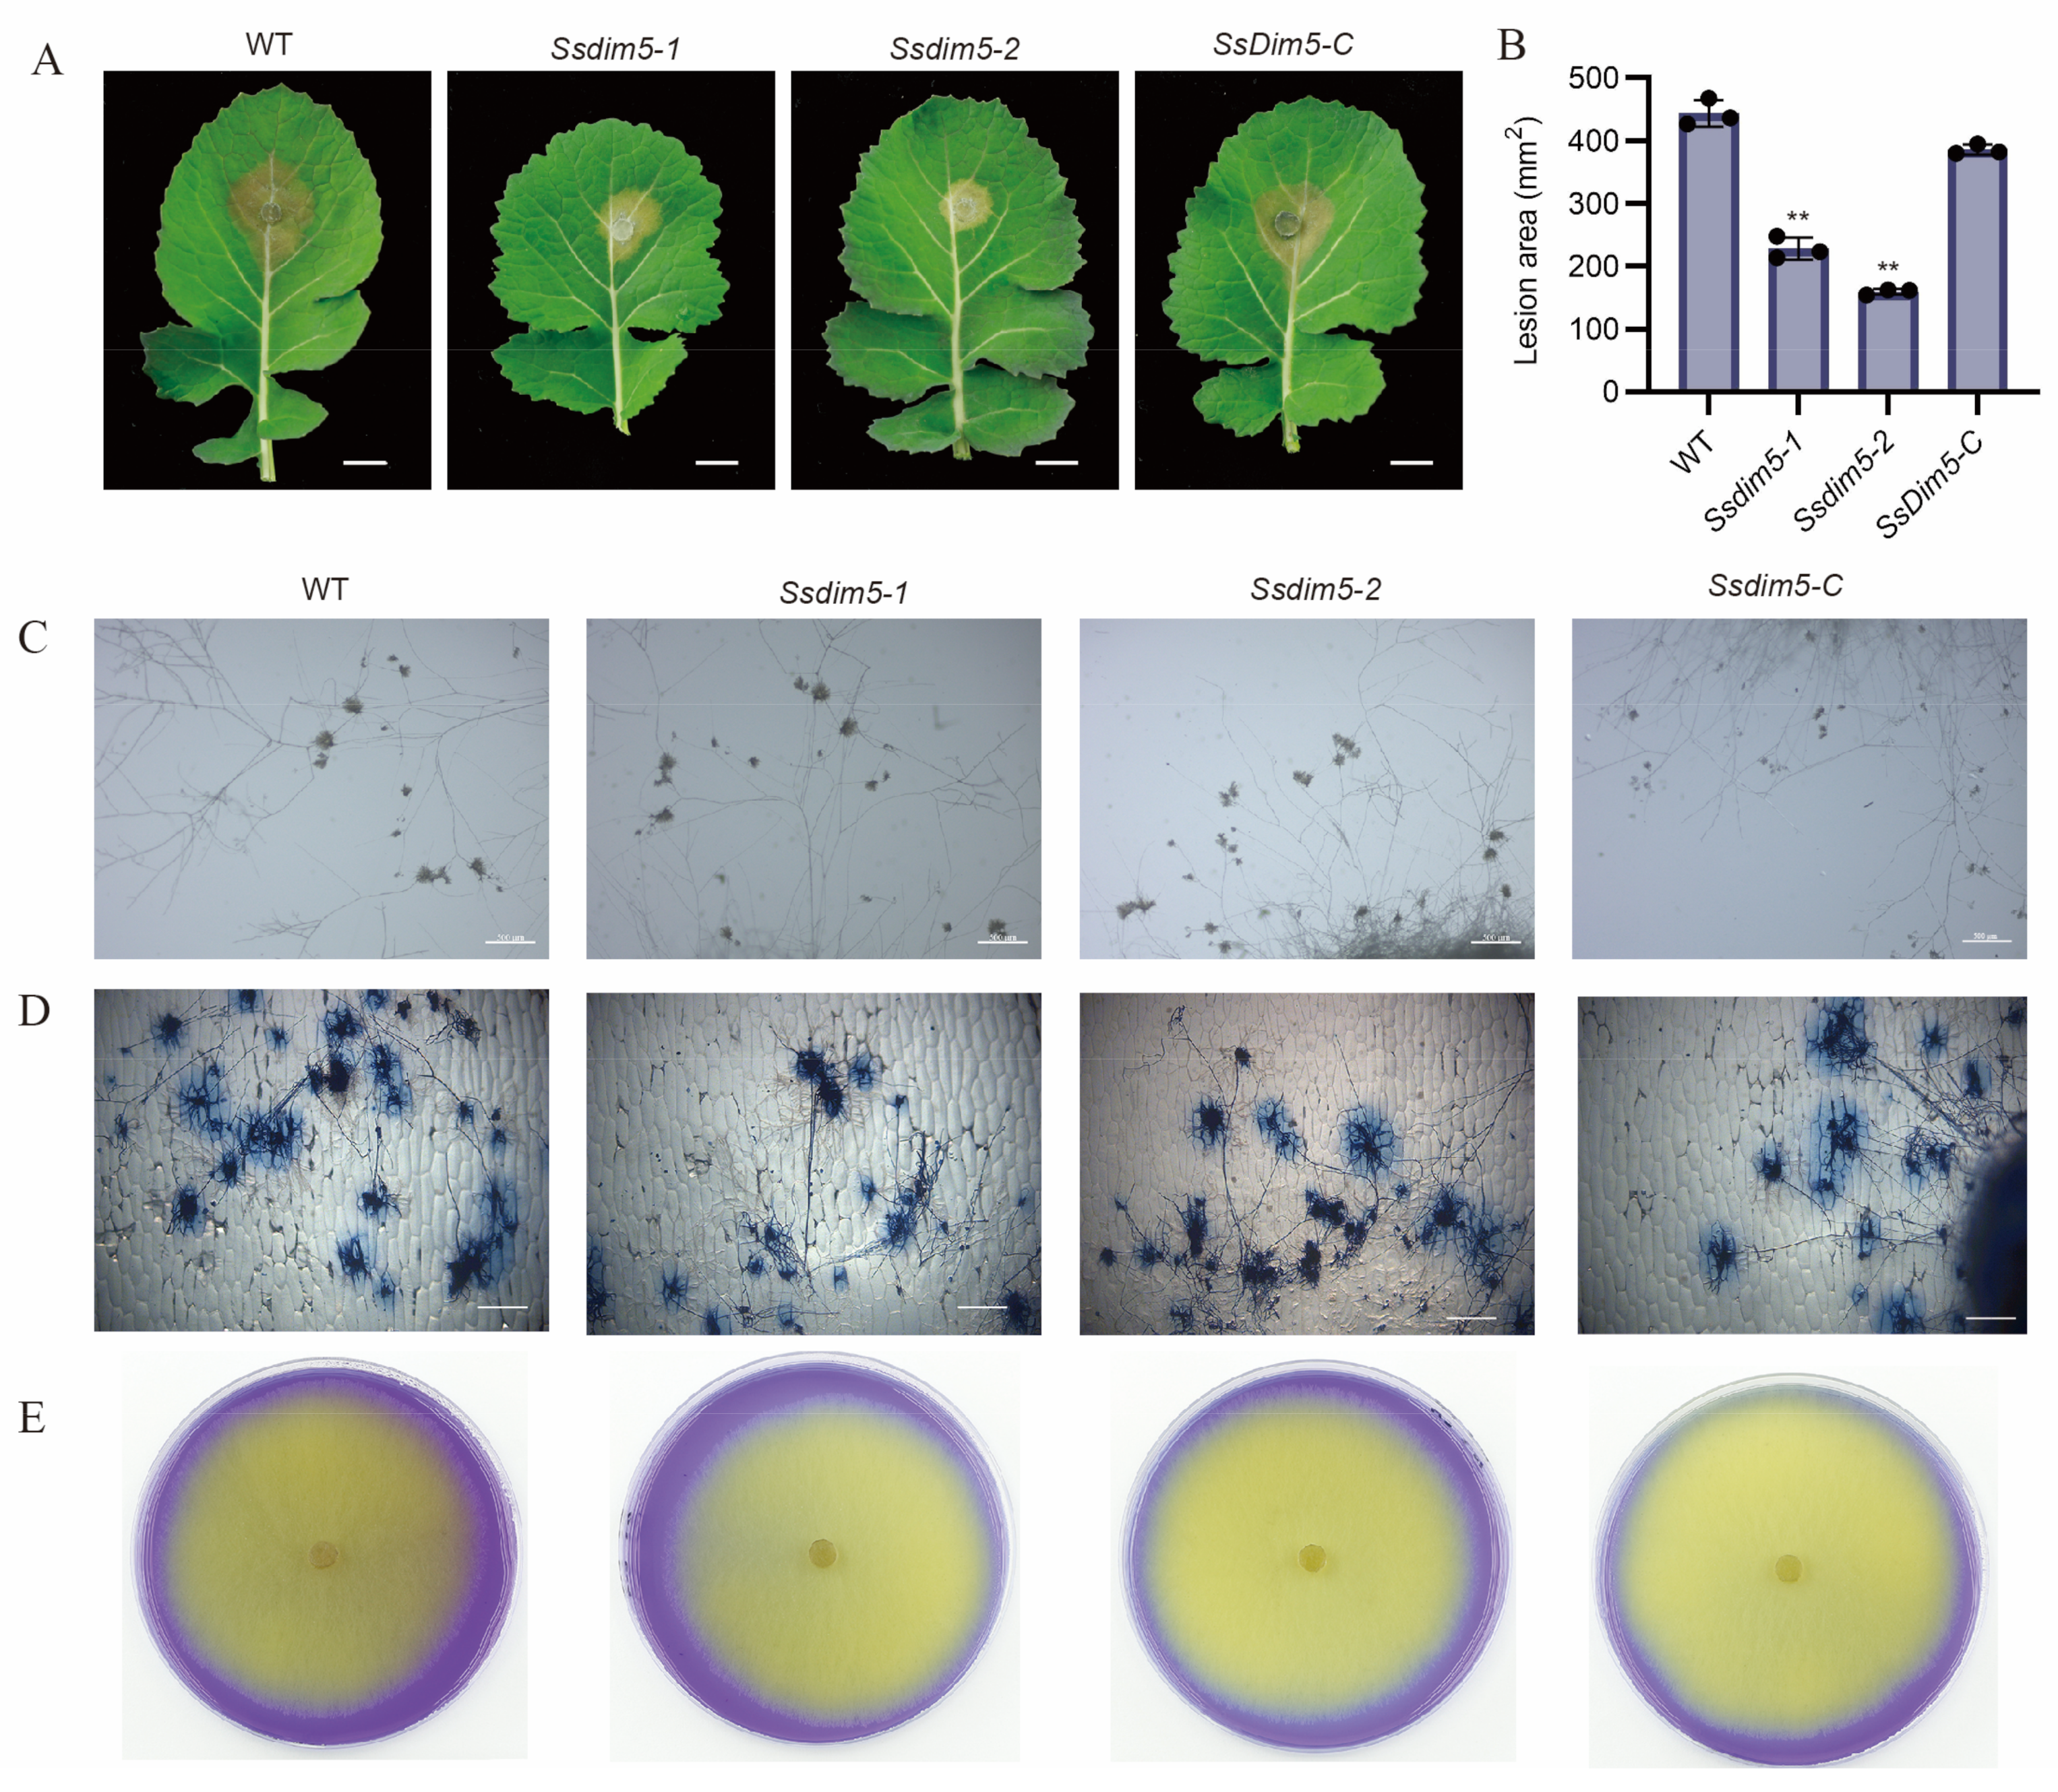
3.4. Deletion of SsDim5 Impairs the Virulence of S. sclerotiorum
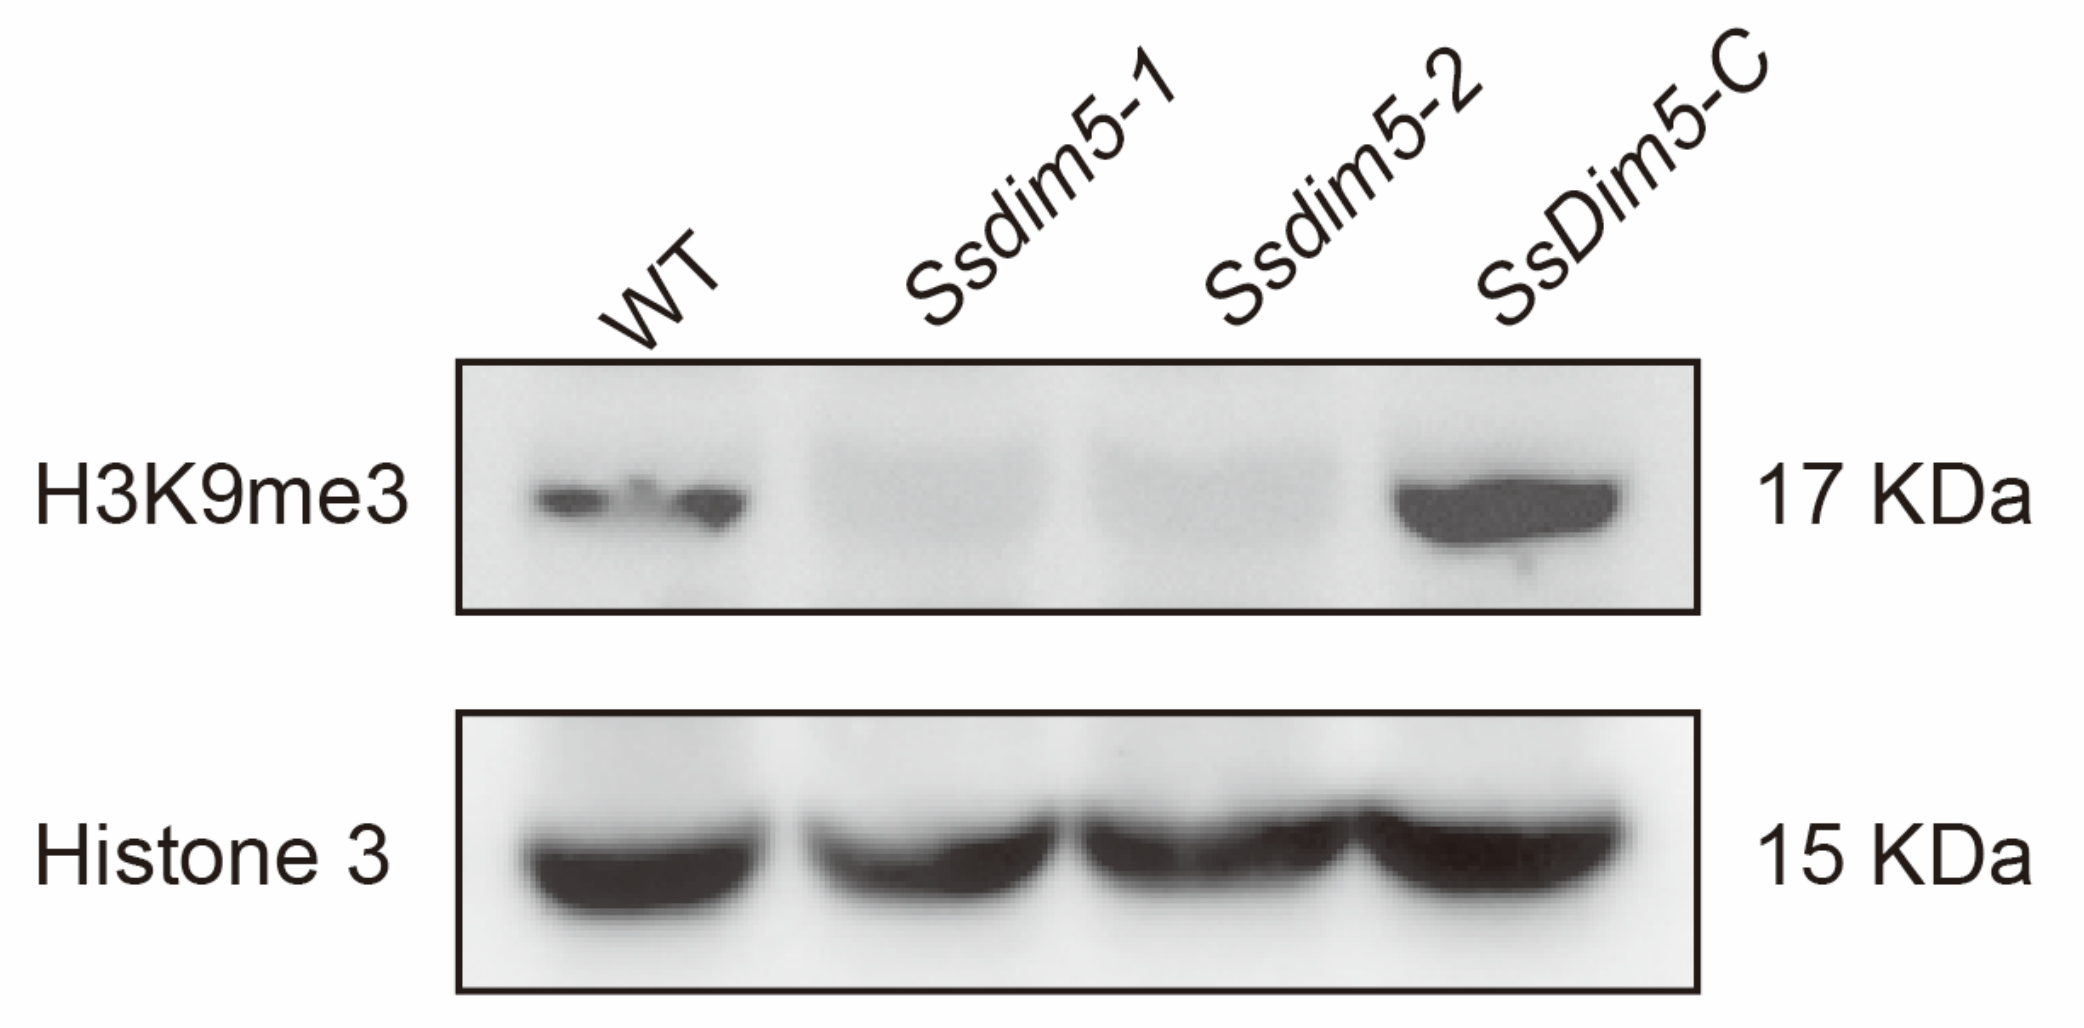
3.5. H3K9 Trimethylation Levels Are Significantly Reduced in SsDim5 Knockout Mutants
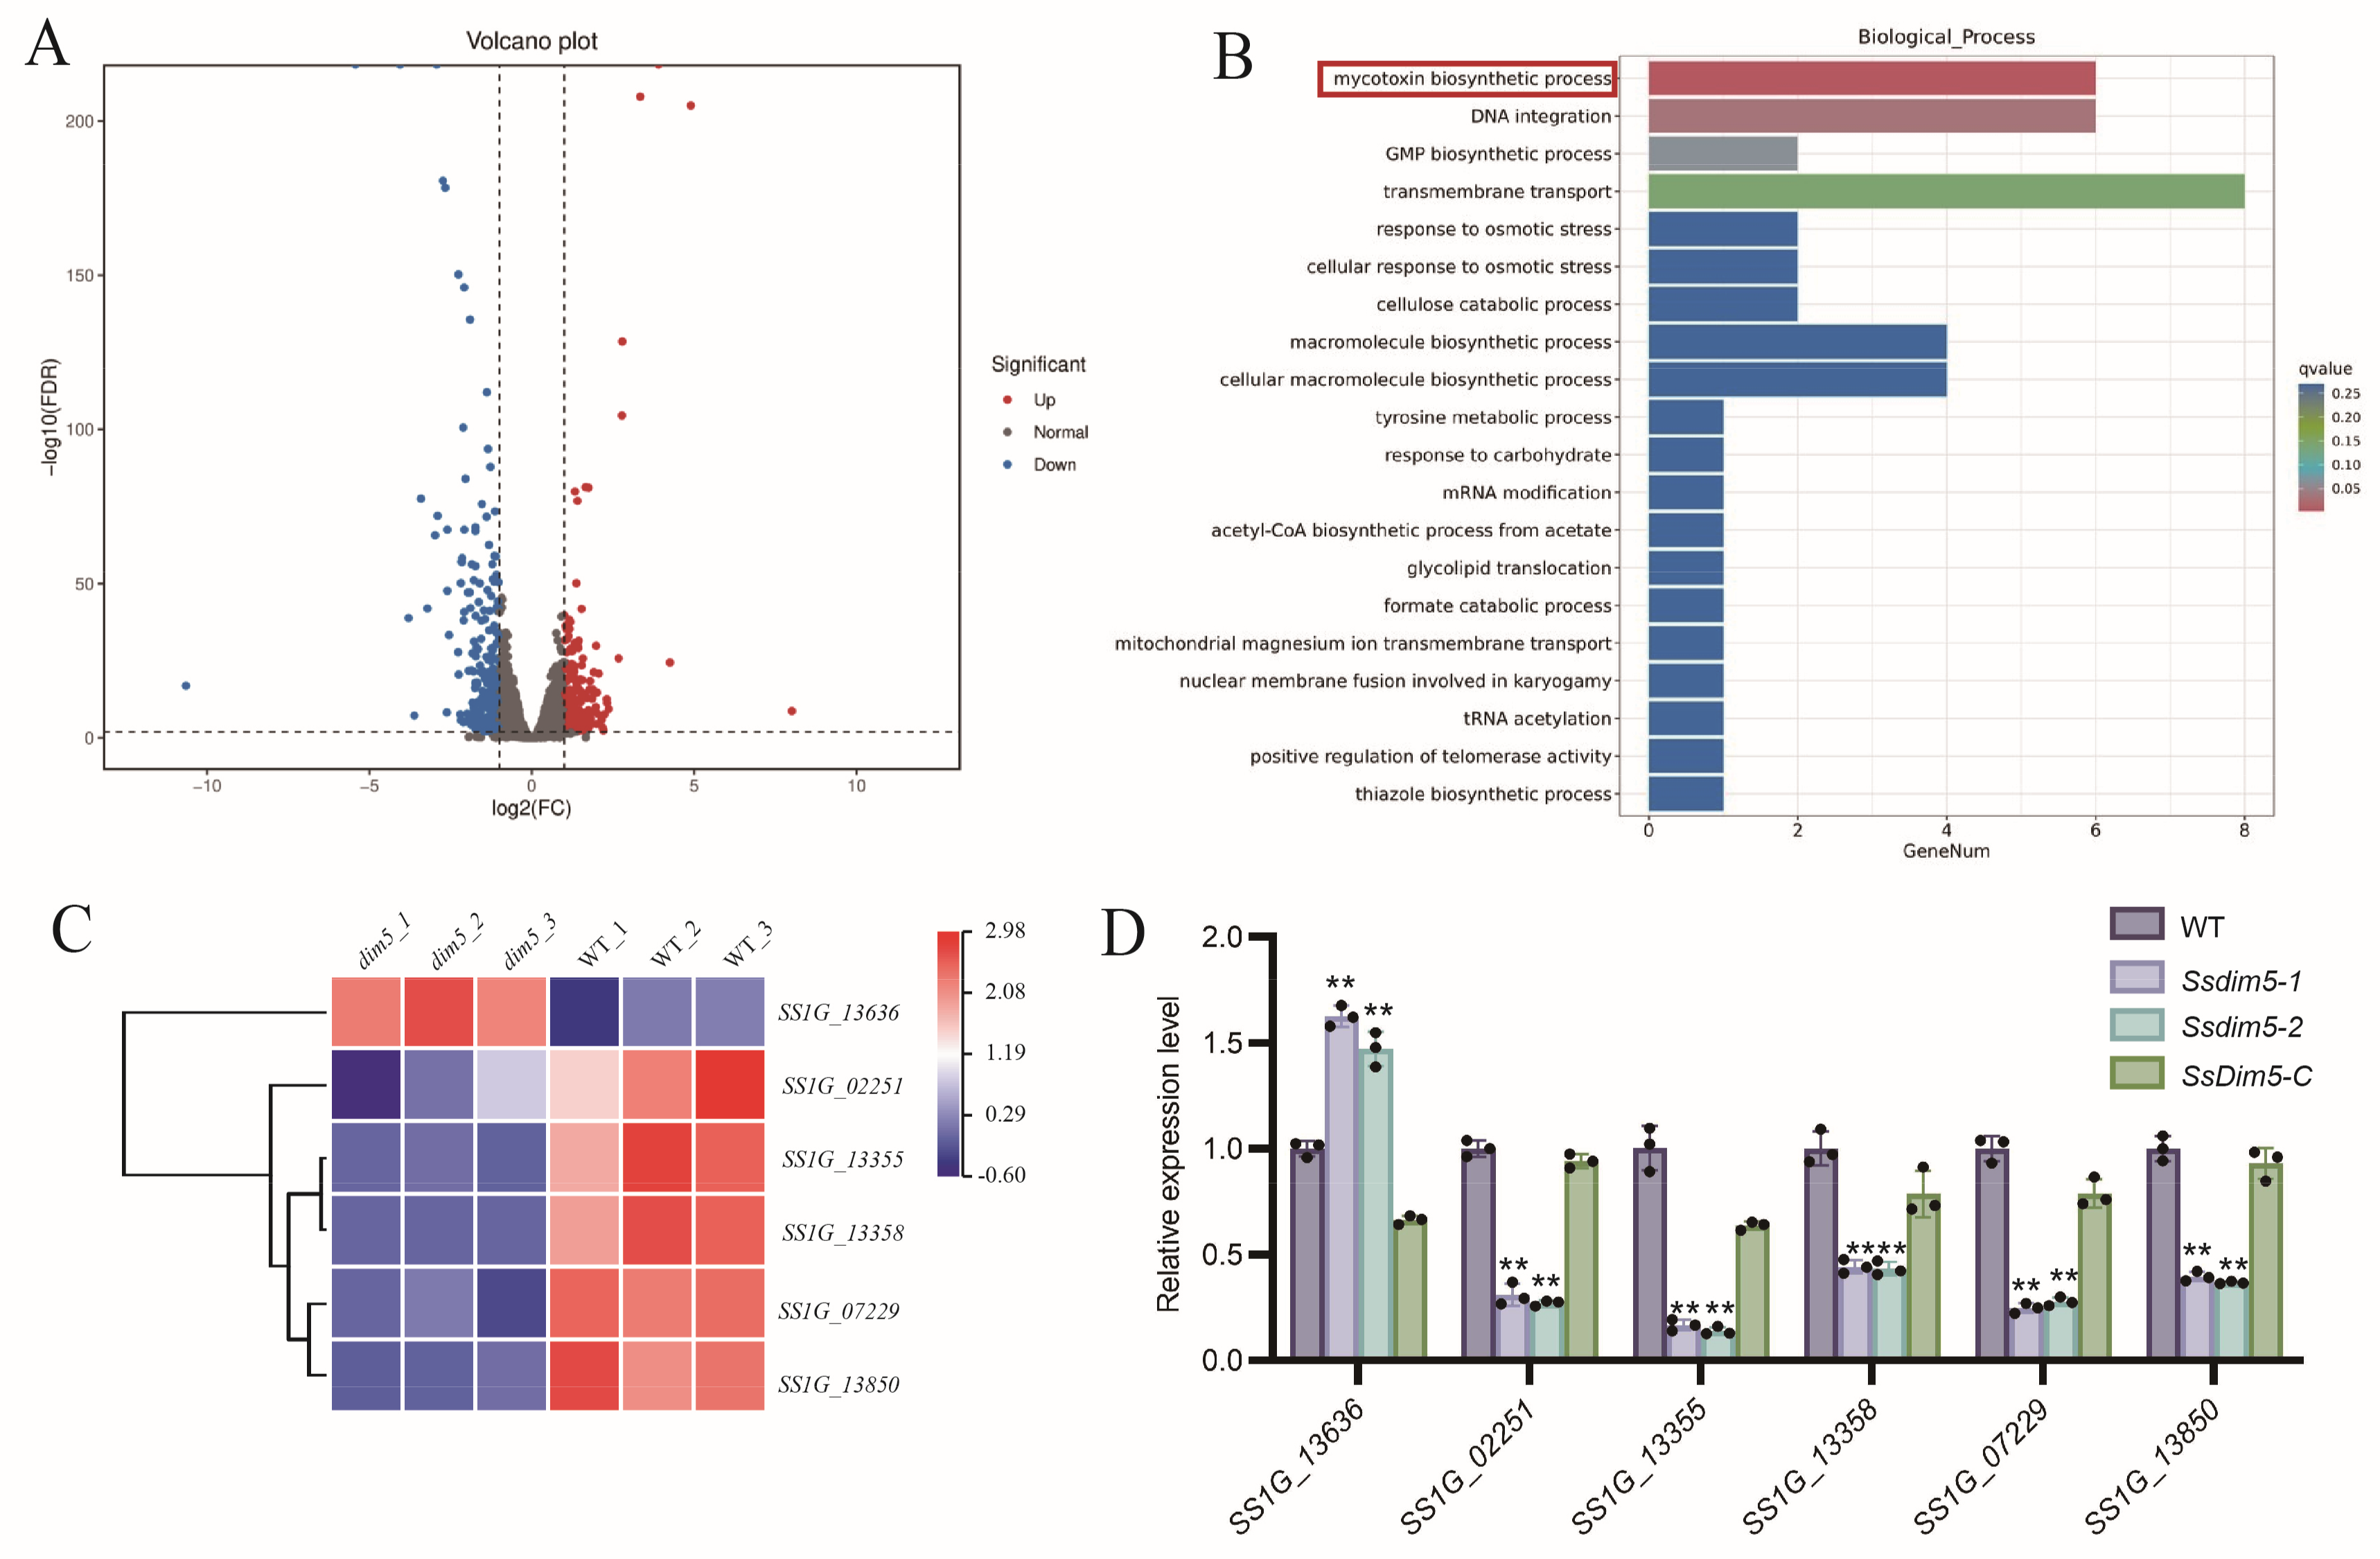
3.6. SsDim5 is Related to the Synthesis of Mycotoxins
3.7. Regulation of SsDim5 in Response to Environmental Stresses
4. Discussion
5. Conclusions
Supplementary Materials
Author Contributions
Funding
Institutional Review Board Statement
Informed Consent Statement
Data Availability Statement
Acknowledgments
Conflicts of Interest
References
- Boland, G.J.; Hall, R. Index of plant hosts of Sclerotinia sclerotiorum. Can. J. Plant Pathol. 1994, 16, 93–108. [Google Scholar] [CrossRef]
- Liang, X.; Rollins, J.A. Mechanisms of Broad Host Range Necrotrophic Pathogenesis in Sclerotinia sclerotiorum. Phytopathology 2018, 108, 1128–1140. [Google Scholar] [CrossRef]
- Bolton, M.D.; Thomma, B.P.H.J.; Nelson, B.D. Sclerotinia sclerotiorum (Lib.) de Bary: Biology and molecular traits of a cosmopolitanPathogen. Mol. Plant Pathol. 2010, 7, 1–16. [Google Scholar] [CrossRef]
- Burketová, M.N.a.I.D.V. Plant hormones in defense response of Brassica napus to Sclerotinia sclerotiorum—Reassessing the role of salicylic acid in the interaction with a necrotroph. Plant Physiol. Biochem. 2014, 80. [Google Scholar]
- Djamei, A.; Schipper, K.; Rabe, F.; Ghosh, A.; Vincon, V.; Kahnt, J.; Osorio, S.; Tohge, T.; Fernie, A.R.; Feussner, I.; et al. Metabolic priming by a secreted fungal effector. Nature 2011, 478, 395–398. [Google Scholar] [CrossRef] [PubMed]
- Zhu, W.; Wei, W.; Fu, Y.; Cheng, J.; Xie, J.; Li, G.; Yi, X.; Kang, Z.; Dickman, M.B.; Jiang, D. A secretory protein of necrotrophic fungus Sclerotinia sclerotiorum that suppresses host resistance. PLoS ONE 2013, 8, e53901. [Google Scholar] [CrossRef] [PubMed]
- Kabbage, M.; Williams, B.; Dickman, M.B. Cell death control: The interplay of apoptosis and autophagy in the pathogenicity of Sclerotinia sclerotiorum. PLoS Pathog 2013, 9, e1003287. [Google Scholar] [CrossRef]
- Lyu, X.; Shen, C.; Fu, Y.; Xie, J.; Jiang, D.; Li, G.; Cheng, J. Comparative genomic and transcriptional analyses of the carbohydrate-active enzymes and secretomes of phytopathogenic fungi reveal their significant roles during infection and development. Sci Rep 2015, 5, 15565. [Google Scholar] [CrossRef]
- Liang, Y.; Yajima, W.; Davis, M.R.; Kav, N.N.V.; Strelkov, S.E. Disruption of a gene encoding a hypothetical secreted protein from Sclerotinia sclerotiorum reduces its virulence on canola (Brassica napus). Can. J. Plant Pathol. 2013, 35, 46–55. [Google Scholar] [CrossRef]
- Sánchez-Vallet, A.; Tian, H.; Rodriguez-Moreno, L.; Valkenburg, D.J.; Saleem-Batcha, R.; Wawra, S.; Kombrink, A.; Verhage, L.; de Jonge, R.; van Esse, H.P.; et al. A secreted LysM effector protects fungal hyphae through chitin-dependent homodimer polymerization. PLoS Pathog 2020, 16, e1008652. [Google Scholar] [CrossRef]
- Gómez-Díaz, E.; Jordà, M.; Peinado, M.A.; Rivero, A. Epigenetics of host-pathogen interactions: The road ahead and the road behind. PLoS Pathog 2012, 8, e1003007. [Google Scholar] [CrossRef]
- Zhu, Q.H.; Shan, W.X.; Ayliffe, M.A.; Wang, M.B. Epigenetic Mechanisms: An Emerging Player in Plant-Microbe Interactions. Mol Plant Microbe Interact 2016, 29, 187–196. [Google Scholar] [CrossRef] [PubMed]
- Lai, Y.; Chen, H.; Wei, G.; Wang, G.; Li, F.; Wang, S. In vivo gene expression profiling of the entomopathogenic fungus Beauveria bassiana elucidates its infection stratagems in Anopheles mosquito. Sci China Life Sci 2017, 60, 839–851. [Google Scholar] [CrossRef] [PubMed]
- Meile, L.; Peter, J.; Puccetti, G.; Alassimone, J.; McDonald, B.A.; Sánchez-Vallet, A. Chromatin Dynamics Contribute to the Spatiotemporal Expression Pattern of Virulence Genes in a Fungal Plant Pathogen. mBio 2020, 11. [Google Scholar] [CrossRef] [PubMed]
- Lan, F.; Shi, Y. Epigenetic regulation: Methylation of histone and non-histone proteins. Sci China C Life Sci 2009, 52, 311–322. [Google Scholar] [CrossRef] [PubMed]
- Bedford, M.T.; Clarke, S.G. Protein arginine methylation in mammals: Who, what, and why. Mol Cell 2009, 33, 1–13. [Google Scholar] [CrossRef]
- Brosch, G.; Loidl, P.; Graessle, S. Histone modifications and chromatin dynamics: A focus on filamentous fungi. FEMS Microbiol Rev 2008, 32, 409–439. [Google Scholar] [CrossRef]
- Berger, S.L. The complex language of chromatin regulation during transcription. Nature 2007, 447, 407–412. [Google Scholar] [CrossRef]
- Freitag, M. Histone Methylation by SET Domain Proteins in Fungi. Annu Rev Microbiol 2017, 71, 413–439. [Google Scholar] [CrossRef]
- Zhang, X.; Liu, X.; Zhao, Y.; Cheng, J.; Xie, J.; Fu, Y.; Jiang, D.; Chen, T. Histone H3 Lysine 9 Methyltransferase DIM5 Is Required for the Development and Virulence of Botrytis cinerea. Front Microbiol 2016, 7, 1289. [Google Scholar] [CrossRef]
- Gu, Q.; Ji, T.; Sun, X.; Huang, H.; Zhang, H.; Lu, X.; Wu, L.; Huo, R.; Wu, H.; Gao, X. Histone H3 lysine 9 methyltransferase FvDim5 regulates fungal development, pathogenicity and osmotic stress responses in Fusarium verticillioides. FEMS Microbiol Lett 2017, 364. [Google Scholar] [CrossRef]
- Atanasoff-Kardjalieff, A.K.; Lünne, F.; Kalinina, S.; Strauss, J.; Humpf, H.U.; Studt, L. Biosynthesis of Fusapyrone Depends on the H3K9 Methyltransferase, FmKmt1, in Fusarium mangiferae. Front Fungal Biol 2021, 2, 671796. [Google Scholar] [CrossRef]
- Godoy, G.; Steadman, J.R.; Dickman, M.B.; Dam, R. Use of mutants to demonstrate the role of oxalic acid in pathogenicity of Sclerotinia sclerotiorum on Phaseolus vulgaris. Physiol. Mol. Plant Pathol. 1990, 37, 179–191. [Google Scholar] [CrossRef]
- Chenna, R.; Sugawara, H.; Koike, T.; Lopez, R.; Gibson, T.J.; Higgins, D.G.; Thompson, J.D. Multiple sequence alignment with the Clustal series of programs. Nucleic Acids Res 2003, 31, 3497–3500. [Google Scholar] [CrossRef]
- Qin, L.; Nong, J.; Cui, K.; Tang, X.; Gong, X.; Xia, Y.; Xu, Y.; Qiu, Y.; Li, X.; Xia, S. SsCak1 Regulates Growth and Pathogenicity in Sclerotinia sclerotiorum. Int J Mol Sci 2023, 24. [Google Scholar] [CrossRef]
- Lan, C.; Qiao, L.; Niu, D. Sclerotinia sclerotiorum Protoplast Preparation and Transformation. Bio Protoc 2023, 13, e4581. [Google Scholar] [CrossRef] [PubMed]
- Allen, G.C.; Flores-Vergara, M.A.; Krasynanski, S.; Kumar, S.; Thompson, W.F. A modified protocol for rapid DNA isolation from plant tissues using cetyltrimethylammonium bromide. Nat Protoc 2006, 1, 2320–2325. [Google Scholar] [CrossRef] [PubMed]
- Livak, K.J.; Schmittgen, T.D. Analysis of relative gene expression data using real-time quantitative PCR and the 2(-Delta Delta C(T)) Method. Methods 2001, 25, 402–408. [Google Scholar] [CrossRef] [PubMed]
- Mei, J.; Liu, Y.; Wei, D.; Wittkop, B.; Ding, Y.; Li, Q.; Li, J.; Wan, H.; Li, Z.; Ge, X.; et al. Transfer of sclerotinia resistance from wild relative of Brassica oleracea into Brassica napus using a hexaploidy step. Theor Appl Genet 2015, 128, 639–644. [Google Scholar] [CrossRef]
- Gessaman, J.D.; Selker, E.U. Induction of H3K9me3 and DNA methylation by tethered heterochromatin factors in Neurospora crassa. Proc Natl Acad Sci USA 2017, 114, E9598–E9607. [Google Scholar] [CrossRef]
- Kouzarides, T. Chromatin modifications and their function. Cell 2007, 128, 693–705. [Google Scholar] [CrossRef] [PubMed]
- Allis, C.D.; Berger, S.L.; Cote, J.; Dent, S.; Jenuwien, T.; Kouzarides, T.; Pillus, L.; Reinberg, D.; Shi, Y.; Shiekhattar, R.; et al. New nomenclature for chromatin-modifying enzymes. Cell 2007, 131, 633–636. [Google Scholar] [CrossRef] [PubMed]
- Eissenberg, J.C.; James, T.C.; Foster-Hartnett, D.M.; Hartnett, T.; Ngan, V.; Elgin, S.C. Mutation in a heterochromatin-specific chromosomal protein is associated with suppression of position-effect variegation in Drosophila melanogaster. Proc Natl Acad Sci USA 1990, 87, 9923–9927. [Google Scholar] [CrossRef]
- Rea, S.; Eisenhaber, F.; O’Carroll, D.; Strahl, B.D.; Sun, Z.W.; Schmid, M.; Opravil, S.; Mechtler, K.; Ponting, C.P.; Allis, C.D.; et al. Regulation of chromatin structure by site-specific histone H3 methyltransferases. Nature 2000, 406, 593–599. [Google Scholar] [CrossRef] [PubMed]
- Kusevic, D.; Kudithipudi, S.; Iglesias, N.; Moazed, D.; Jeltsch, A. Clr4 specificity and catalytic activity beyond H3K9 methylation. Biochimie 2017, 135, 83–88. [Google Scholar] [CrossRef] [PubMed]
- Ren, K.; Mou, Y.N.; Tong, S.M.; Ying, S.H.; Feng, M.G. DIM5/KMT1 controls fungal insect pathogenicity and genome stability by methylation of histone H3K4, H3K9 and H3K36. Virulence 2021, 12, 1306–1322. [Google Scholar] [CrossRef]
- Wang, L.; Liu, J.; Li, X.; Lyu, X.; Liu, Z.; Zhao, H.; Jiao, X.; Zhang, W.; Xie, J.; Liu, W. A histone H3K9 methyltransferase Dim5 mediates repression of sorbicillinoid biosynthesis in Trichoderma reesei. Microb Biotechnol 2022, 15, 2533–2546. [Google Scholar] [CrossRef]
- Nierman, W.C.; Pain, A.; Anderson, M.J.; Wortman, J.R.; Kim, H.S.; Arroyo, J.; Berriman, M.; Abe, K.; Archer, D.B.; Bermejo, C.; et al. Genomic sequence of the pathogenic and allergenic filamentous fungus Aspergillus fumigatus. Nature 2005, 438, 1151–1156. [Google Scholar] [CrossRef]
- Audergon, P.N.; Catania, S.; Kagansky, A.; Tong, P.; Shukla, M.; Pidoux, A.L.; Allshire, R.C. Epigenetics. Restricted epigenetic inheritance of H3K9 methylation. Science 2015, 348, 132–135. [Google Scholar] [CrossRef]
- Reyes-Dominguez, Y.; Bok, J.W.; Berger, H.; Shwab, E.K.; Basheer, A.; Gallmetzer, A.; Scazzocchio, C.; Keller, N.; Strauss, J. Heterochromatic marks are associated with the repression of secondary metabolism clusters in Aspergillus nidulans. Mol Microbiol 2010, 76, 1376–1386. [Google Scholar] [CrossRef]
- Reyes-Dominguez, Y.; Boedi, S.; Sulyok, M.; Wiesenberger, G.; Stoppacher, N.; Krska, R.; Strauss, J. Heterochromatin influences the secondary metabolite profile in the plant pathogen Fusarium graminearum. Fungal Genet Biol 2012, 49, 39–47. [Google Scholar] [CrossRef] [PubMed]
- Stępień, Ł.; Lalak-Kańczugowska, J.; Witaszak, N.; Urbaniak, M. Fusarium Secondary Metabolism Biosynthetic Pathways: So Close but So Far Away. 2019.
- Reverberi, M.; Ricelli, A.; Zjalic, S.; Fabbri, A.A.; Fanelli, C. Natural functions of mycotoxins and control of their biosynthesis in fungi. Appl Microbiol Biotechnol 2010, 87, 899–911. [Google Scholar] [CrossRef]
- Reverberi, M.; Fabbri, A.A.; Zjalic, S.; Ricelli, A.; Punelli, F.; Fanelli, C. Antioxidant enzymes stimulation in Aspergillus parasiticus by Lentinula edodes inhibits aflatoxin production. Appl Microbiol Biotechnol 2005, 69, 207–215. [Google Scholar] [CrossRef] [PubMed]
- Kim, H.J.; Chen, C.; Kabbage, M.; Dickman, M.B. Identification and characterization of Sclerotinia sclerotiorum NADPH oxidases. Appl Env. Microbiol 2011, 77, 7721–7729. [Google Scholar] [CrossRef] [PubMed]
- Fan, H.; Yu, G.; Liu, Y.; Zhang, X.; Liu, J.; Zhang, Y.; Rollins, J.A.; Sun, F.; Pan, H. An atypical forkhead-containing transcription factor SsFKH1 is involved in sclerotial formation and is essential for pathogenicity in Sclerotinia sclerotiorum. Mol Plant Pathol 2017, 18, 963–975. [Google Scholar] [CrossRef]
- Lyu, X.; Shen, C.; Fu, Y.; Xie, J.; Jiang, D.; Li, G.; Cheng, J. The Microbial Opsin Homolog Sop1 is involved in Sclerotinia sclerotiorum Development and Environmental Stress Response. Front. Microbiol. 2016, 6, 1504. [Google Scholar] [CrossRef]
- Veluchamy, S.; Williams, B.; Kim, K.; Dickman, M.B. The CuZn superoxide dismutase from Sclerotinia sclerotiorum is involved with oxidative stress tolerance, virulence, and oxalate production. Physiol. Mol. Plant Pathol. 2012, 78, 14–23. [Google Scholar] [CrossRef]
- Xu, L.; Chen, W. Random T-DNA mutagenesis identifies a Cu/Zn superoxide dismutase gene as a virulence factor of Sclerotinia sclerotiorum. Mol Plant Microbe Interact 2013, 26, 431–441. [Google Scholar] [CrossRef]
- Yu, Y.; Xiao, J.; Yang, Y.; Bi, C.; Qing, L.; Tan, W. Ss-Bi1 encodes a putative BAX inhibitor-1 protein that is required for full virulence of Sclerotinia sclerotiorum. Physiol. Mol. Plant Pathol. 2015, 90, 115–122. [Google Scholar] [CrossRef]

Disclaimer/Publisher’s Note: The statements, opinions and data contained in all publications are solely those of the individual author(s) and contributor(s) and not of MDPI and/or the editor(s). MDPI and/or the editor(s) disclaim responsibility for any injury to people or property resulting from any ideas, methods, instructions or products referred to in the content. |
© 2024 by the authors. Licensee MDPI, Basel, Switzerland. This article is an open access article distributed under the terms and conditions of the Creative Commons Attribution (CC BY) license (http://creativecommons.org/licenses/by/4.0/).


