Submitted:
08 March 2024
Posted:
11 March 2024
You are already at the latest version
Abstract
Keywords:
1. Introduction:
2. Materials & Methods
3. Results and Discussion
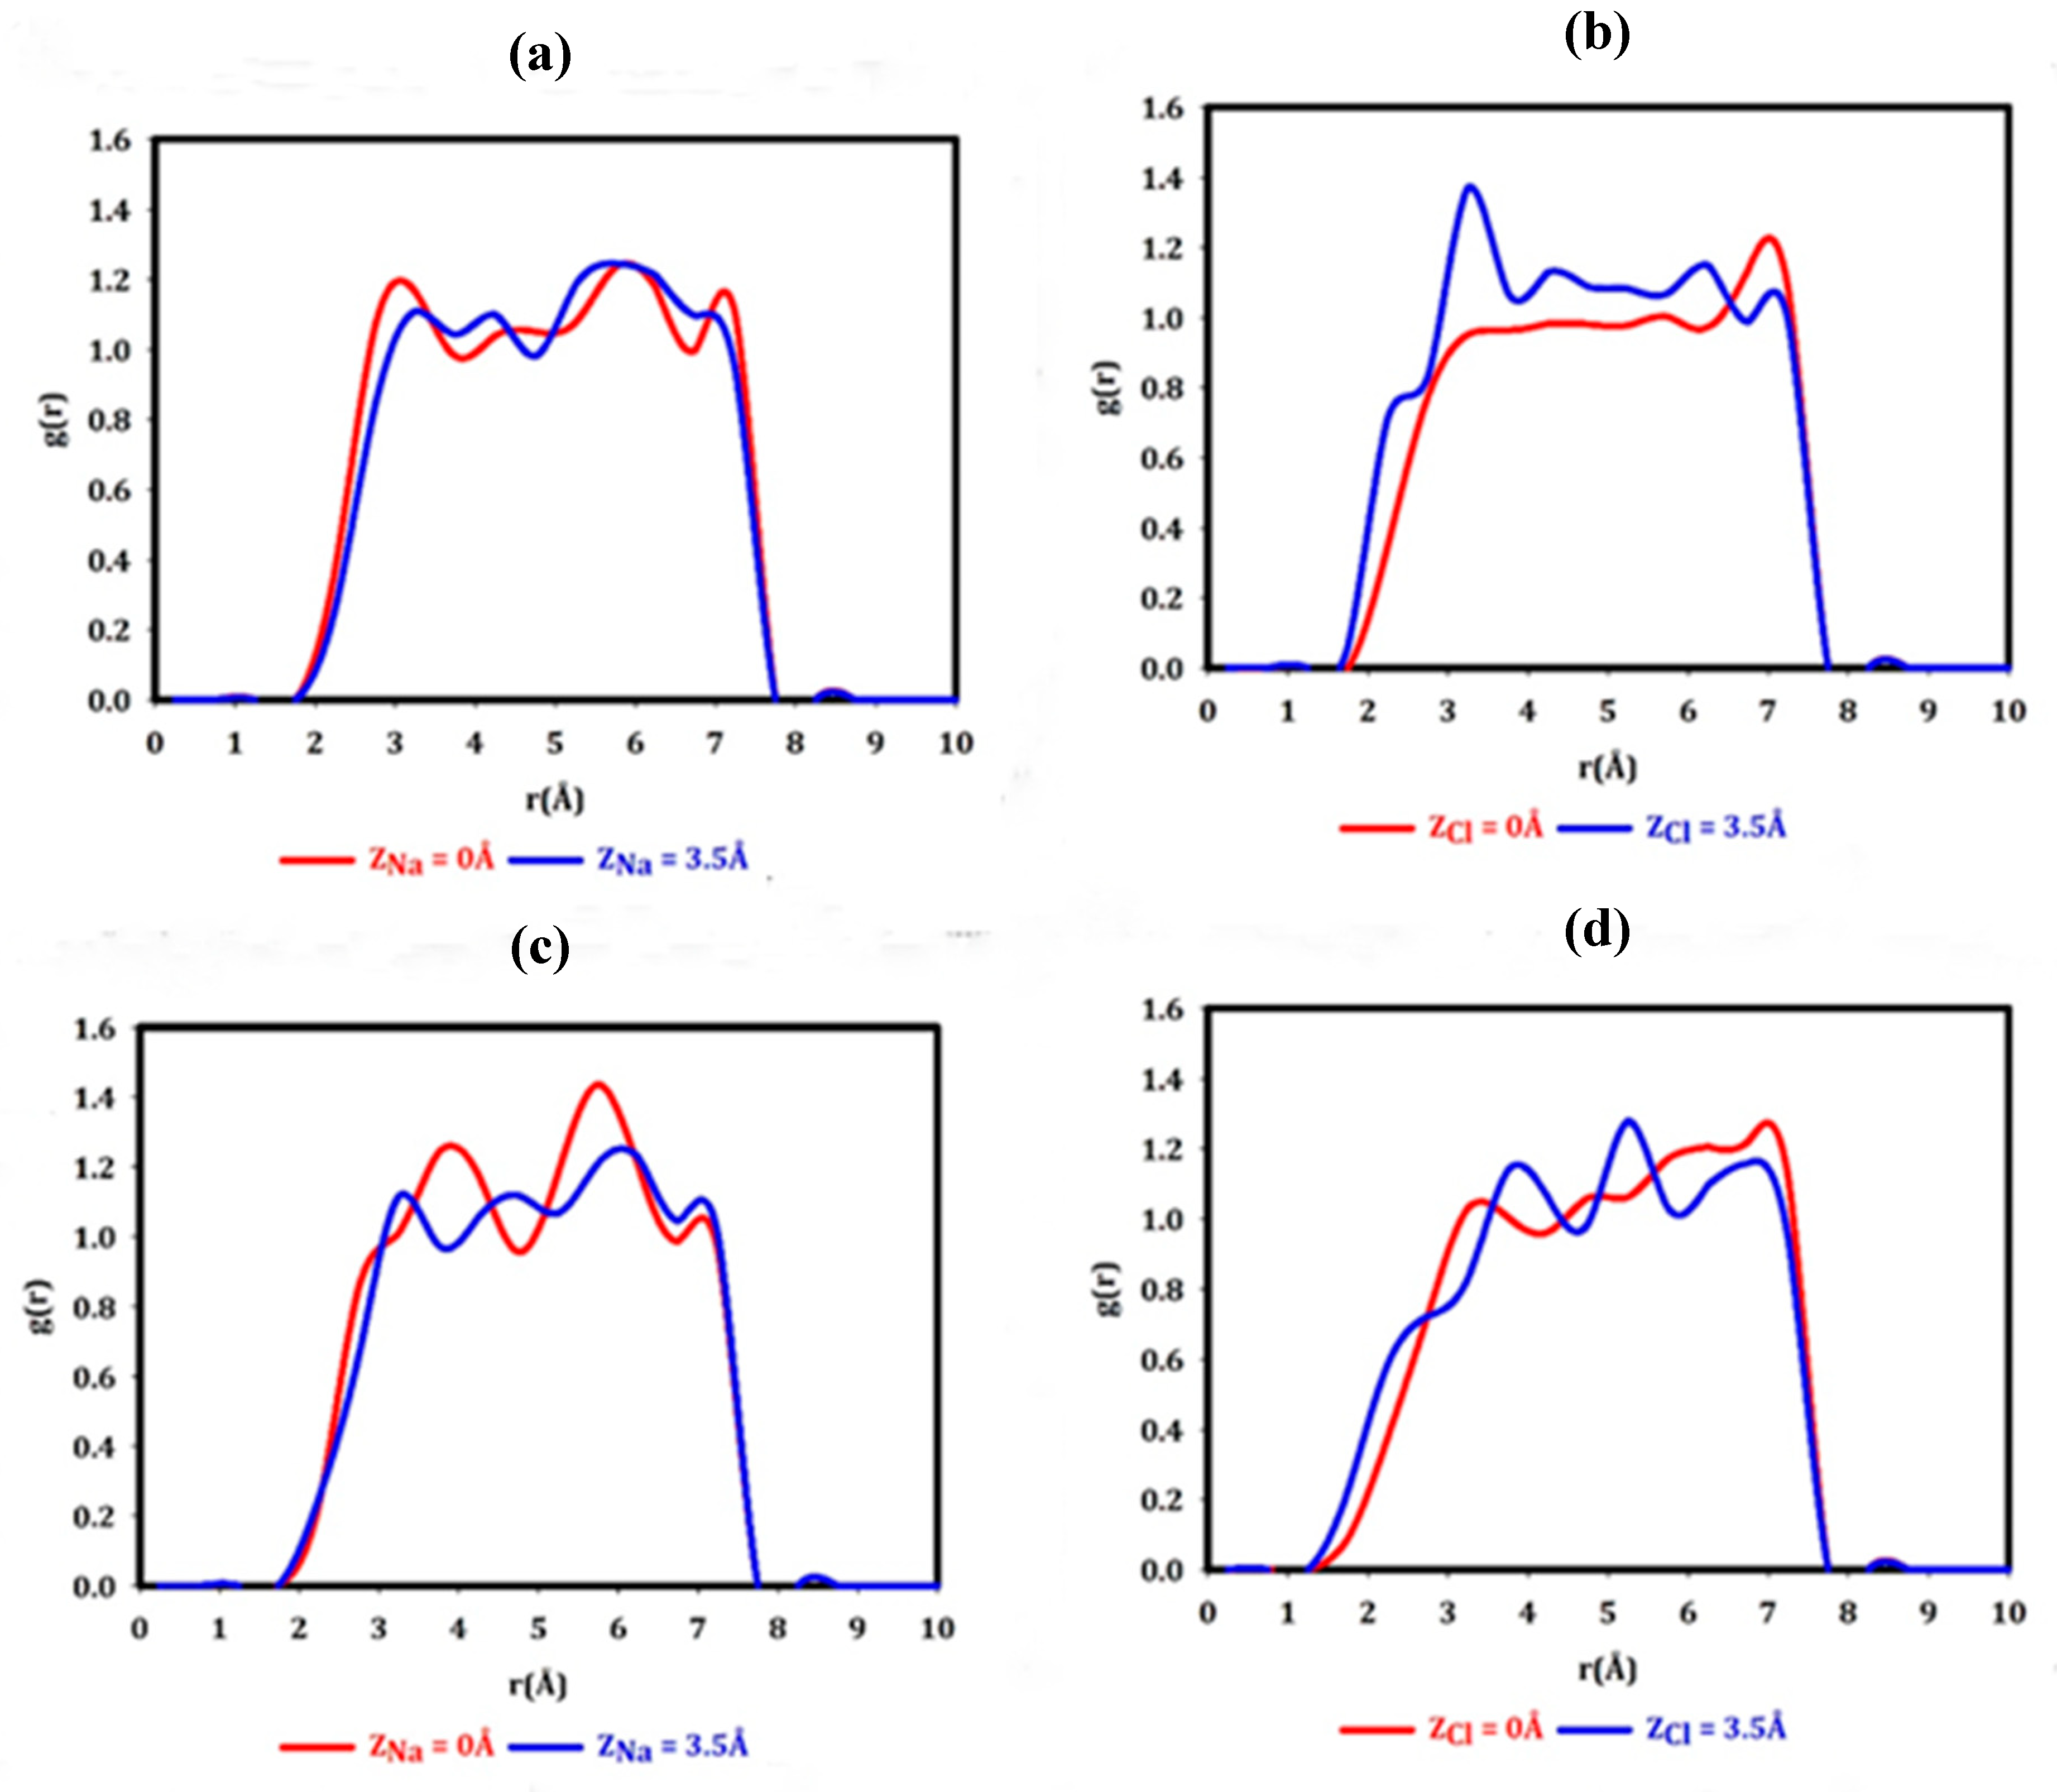
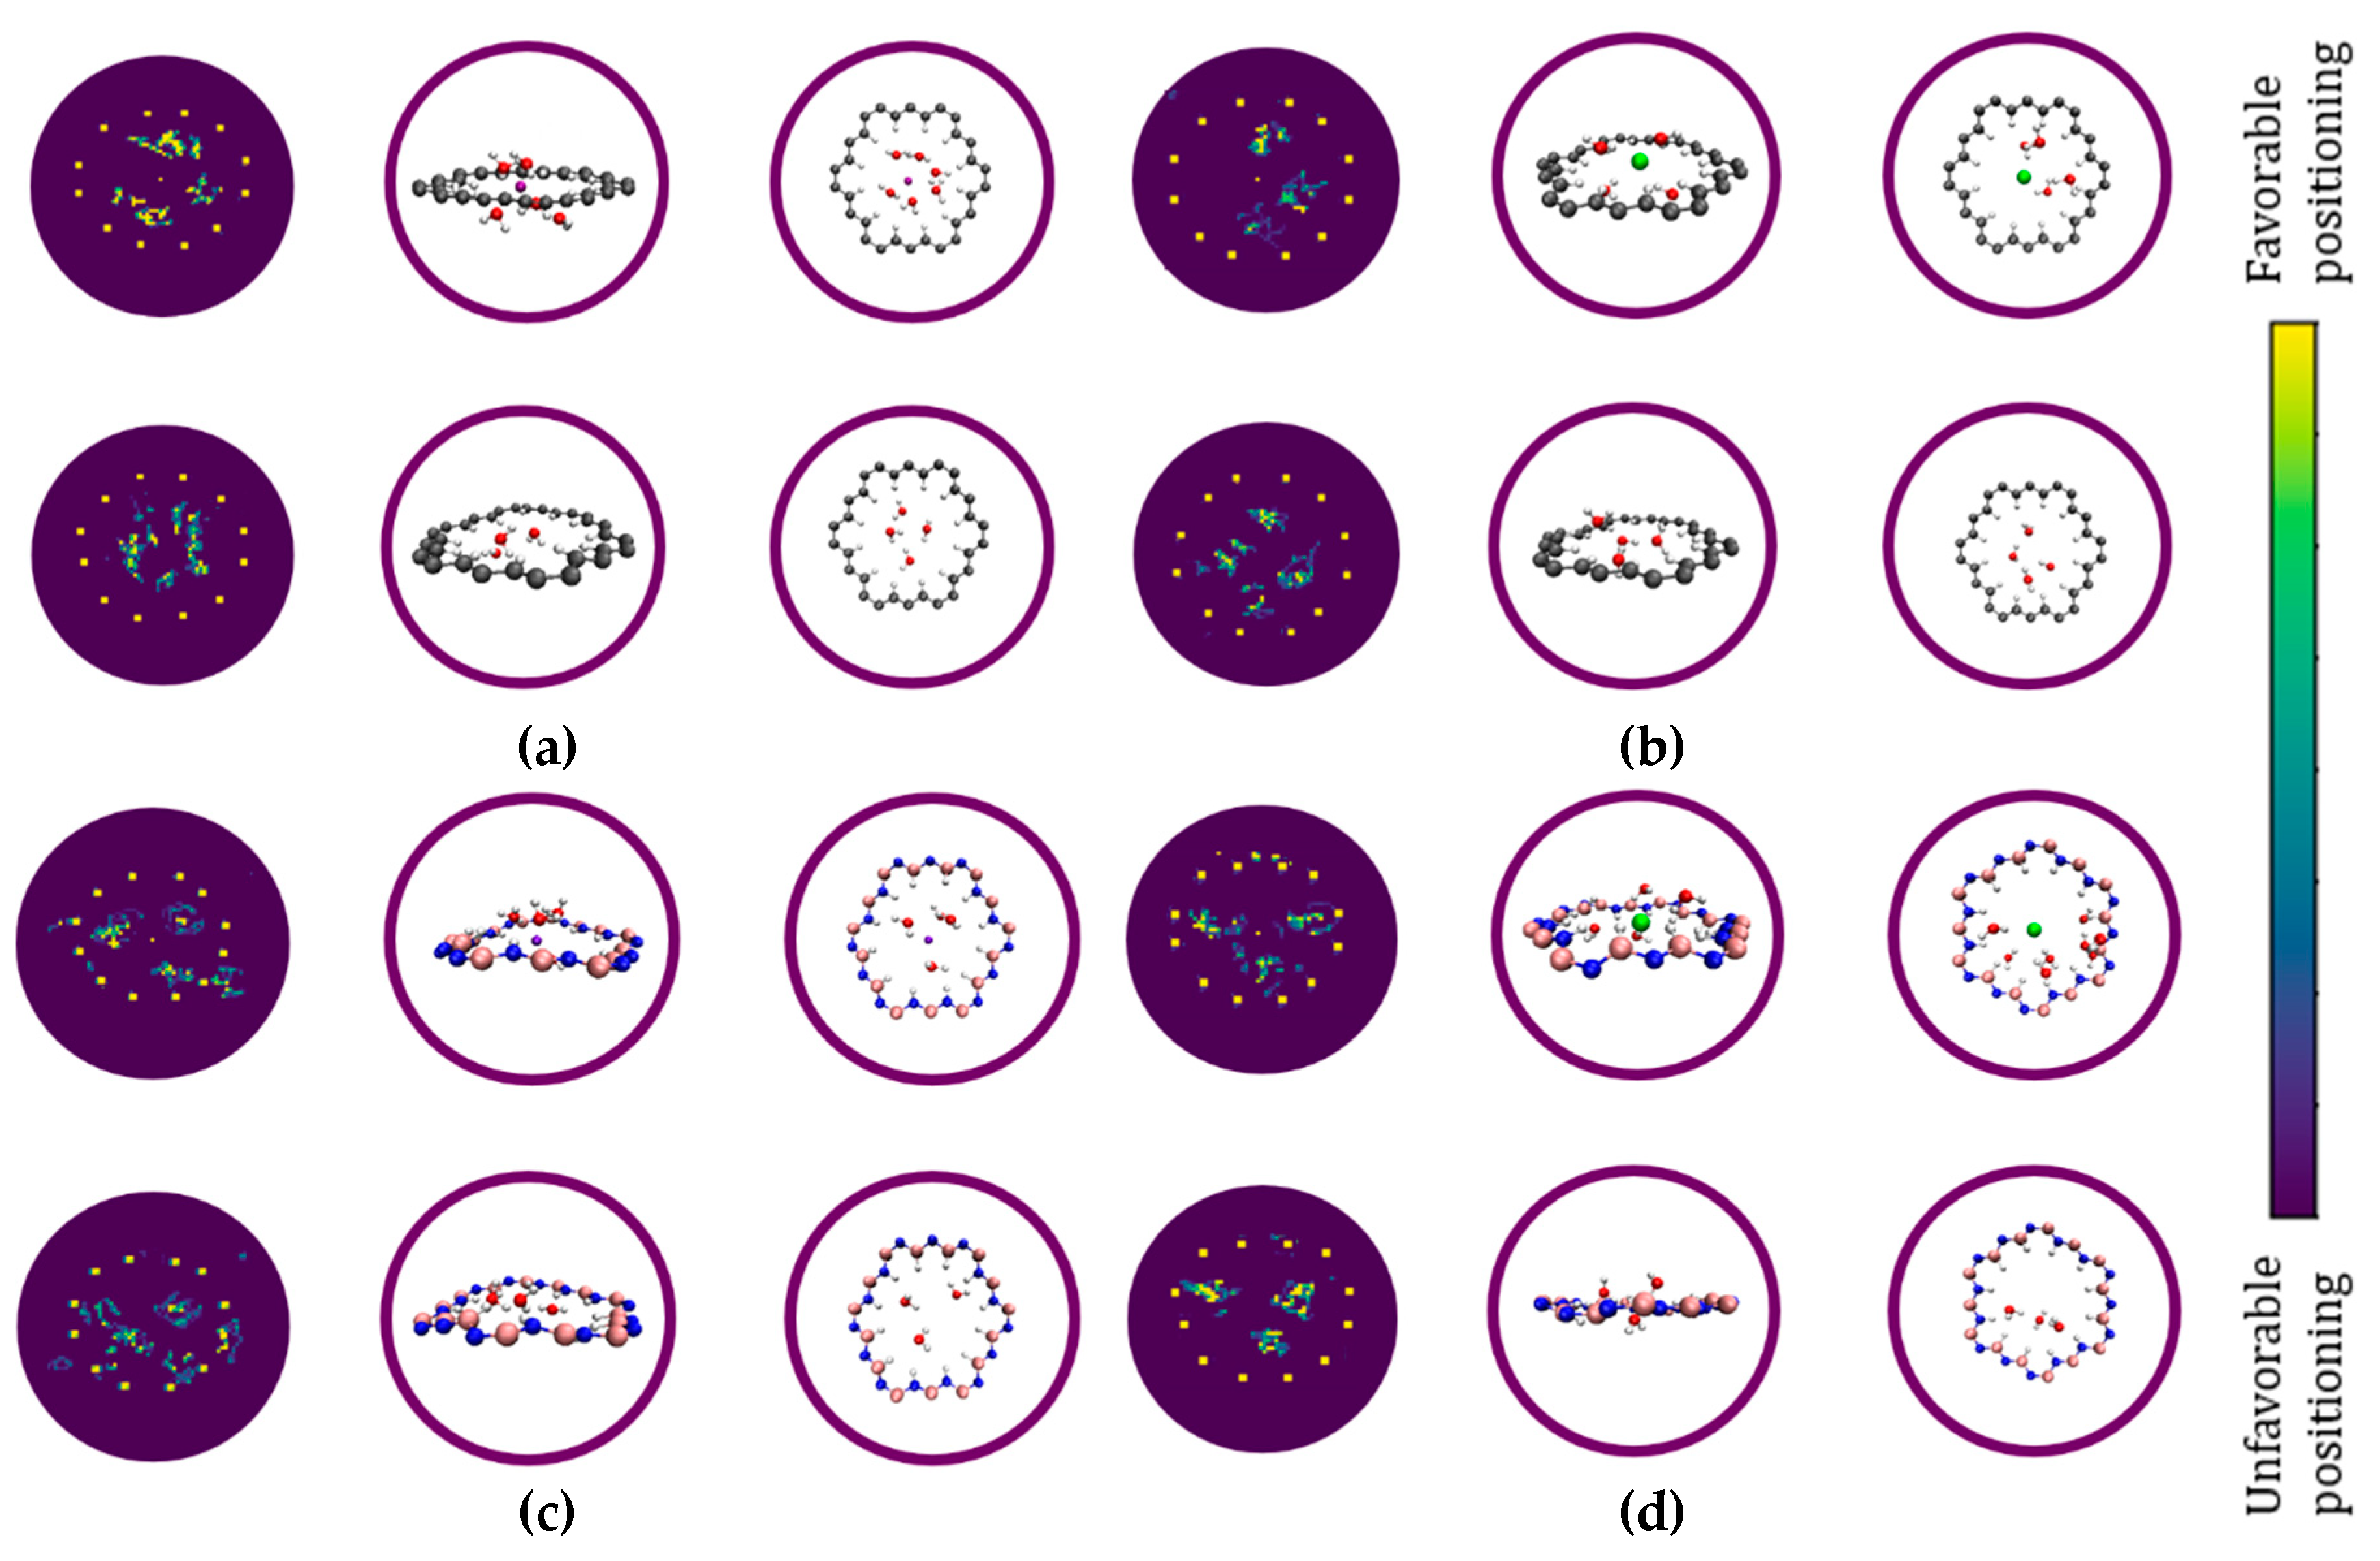
- To what extent do the electrostatically attracted water molecules to anion or cation get dehydrated?
- Does the nanopore provide the available space for ion permeation?
- How do these surrounded ions or partially surrounded ions interact with the nanopore edges?
4. Conclusion
Supplementary Materials
Author Contributions
Funding
Conflicts of Interest
References
- https://www.unwater.org/water-facts/water-scarcity.
- Elimelech, M. and Phillip, W.A., 2011. The future of seawater desalination: energy, technology, and the environment. Science, 333(6043), pp.712-717. [CrossRef]
- Shannon, M.A., Bohn, P.W., Elimelech, M., Georgiadis, J.G., Mariñas, B.J. and Mayes, A.M., 2008. Science and technology for water purification in the coming decades. Nature, 452(7185), pp.301-310. [CrossRef]
- Fritzmann, C., Löwenberg, J., Wintgens, T. and Melin, T., 2007. State-of-the-art of reverse osmosis desalination. Desalination, 216(1-3), pp.1-76. [CrossRef]
- Lee, K.P., Arnot, T.C. and Mattia, D., 2011. A review of reverse osmosis membrane materials for desalination—Development to date and future potential. Journal of Membrane Science, 370(1-2), pp.1-22. [CrossRef]
- LOEB, S. and Sourirajan, S., 1962. Sea Water Demineralization by Means of an Osmotic Membrane. Advances in Chemistry, 38, pp.117-132. [CrossRef]
- Larson, R.E., Cadotte, J.E. and Petersen, R.J., 1981. The FT-30 seawater reverse osmosis membrane--element test results. Desalination, 38, pp.473-483. [CrossRef]
- Greenlee, L.F., Lawler, D.F., Freeman, B.D., Marrot, B. and Moulin, P., 2009. Reverse osmosis desalination: water sources, technology, and today’s challenges. Water research, 43(9), pp.2317-2348. [CrossRef]
- Matin, A., Khan, Z., Zaidi, S.M.J. and Boyce, M.C., 2011. Biofouling in reverse osmosis membranes for seawater desalination: phenomena and prevention. Desalination, 281, pp.1-16. [CrossRef]
- Raluy, G., Serra, L. and Uche, J., 2006. Life cycle assessment of MSF, MED and RO desalination technologies. Energy, 31(13), pp.2361-2372. [CrossRef]
- Von Medeazza, G.M., 2005. “Direct” and socially-induced environmental impacts of desalination. Desalination, 185(1-3), pp.57-70. [CrossRef]
- Yankovych, H.B., Abreu-Jaureguí, C., Farrando-Perez, J., Melnyk, I., Václavíková, M. and Silvestre-Albero, J., 2024. Advanced Removal of Dyes with Tuning Carbon/TiO2 Composite Properties. Nanomaterials, 14(3), p.309. [CrossRef]
- Maio, A., Pibiri, I., Morreale, M., Mantia, F.P.L. and Scaffaro, R., 2021. An overview of functionalized graphene nanomaterials for advanced applications. Nanomaterials, 11(7), p.1717. [CrossRef]
- Kiakojouri, A., Frank, I. and Nadimi, E., 2023. Exploring the dynamics of DNA nucleotides in graphene/h-BN nanopores: insights from ab initio molecular dynamics. Physical Chemistry Chemical Physics, 25(19), pp.13452-13464. [CrossRef]
- Ma, X., Janowska, K., Boffa, V., Fabbri, D., Magnacca, G., Calza, P. and Yue, Y., 2019. Surfactant-assisted fabrication of alumina-doped amorphous silica nanofiltration membranes with enhanced water purification performances. Nanomaterials, 9(10), p.1368. [CrossRef]
- Rashid, M.H.O. and Ralph, S.F., 2017. Carbon nanotube membranes: synthesis, properties, and future filtration applications. Nanomaterials, 7(5), p.99. [CrossRef]
- Sharma, B.B. and Parashar, A., 2020. Mechanical strength of a nanoporous bicrystalline h-BN nanomembrane in a water submerged state. Physical Chemistry Chemical Physics, 22(36), pp.20453-20465. [CrossRef]
- Sapkota, B., Liang, W., VahidMohammadi, A., Karnik, R., Noy, A. and Wanunu, M., 2020. High permeability sub-nanometre sieve composite MoS2 membranes. Nature Communications, 11(1), pp.1-9. [CrossRef]
- Folaranmi, G., Bechelany, M., Sistat, P., Cretin, M. and Zaviska, F., 2021. Activated carbon blended with reduced graphene oxide nanoflakes for capacitive deionization. Nanomaterials, 11(5), p.1090. [CrossRef]
- Zhang, X., Lian, G., Zhang, S., Cui, D. and Wang, Q., 2012. Boron nitride nanocarpets: controllable synthesis and their adsorption performance to organic pollutants. CrystEngComm, 14(14), pp.4670-4676. [CrossRef]
- Peng, H., Wang, R., Mei, L., Zhang, Q., Ying, T., Qian, Z., Farimani, A.B., Voiry, D. and Zeng, Z., 2023. Transition metal dichalcogenide-based functional membrane: Synthesis, modification, and water purification applications. Matter, 6(1), pp.59-96. [CrossRef]
- Wang, R., Chen, D., Wang, Q., Ying, Y., Gao, W. and Xie, L., 2020. Recent advances in applications of carbon nanotubes for desalination: A review. Nanomaterials, 10(6), p.1203. [CrossRef]
- Oliveira, A.R., Correia, A.A. and Rasteiro, M.G., 2021. Heavy metals removal from aqueous solutions by multiwall carbon nanotubes: Effect of MWCNTs dispersion. Nanomaterials, 11(8), p.2082. [CrossRef]
- Chae, J., Lim, T., Cheng, H., Hu, J., Kim, S. and Jung, W., 2021. Graphene oxide and carbon nanotubes-based polyvinylidene fluoride membrane for highly increased water treatment. Nanomaterials, 11(10), p.2498. [CrossRef]
- Koenig, S.P., Wang, L., Pellegrino, J. and Bunch, J.S., 2012. Selective molecular sieving through porous graphene. Nature Nanotechnology, 7(11), pp.728-732. [CrossRef]
- Lehtinen, O., Dumur, E., Kotakoski, J., Krasheninnikov, A.V., Nordlund, K. and Keinonen, J., 2011. Production of defects in hexagonal boron nitride monolayer under ion irradiation. Nuclear Instruments and Methods in Physics Research Section B: Beam Interactions with Materials and Atoms, 269(11), pp.1327-1331. [CrossRef]
- Lehtinen, O., Kotakoski, J., Krasheninnikov, A.V. and Keinonen, J., 2011. Cutting and controlled modification of graphene with ion beams. Nanotechnology, 22(17), p.175306. [CrossRef]
- Lehtinen, O., Tsai, I.L., Jalil, R., Nair, R.R., Keinonen, J., Kaiser, U. and Grigorieva, I.V., 2014. Non-invasive transmission electron microscopy of vacancy defects in graphene produced by ion irradiation. Nanoscale, 6(12), pp.6569-6576. [CrossRef]
- Lucchese, M.M., Stavale, F., Ferreira, E.M., Vilani, C., Moutinho, M.V.D.O., Capaz, R.B., Achete, C.A. and Jorio, A., 2010. Quantifying ion-induced defects and Raman relaxation length in graphene. Carbon, 48(5), pp.1592-1597. [CrossRef]
- Russo, C.J. and Golovchenko, J.A., 2012. Atom-by-atom nucleation and growth of graphene nanopores. Proceedings of the National Academy of Sciences, 109(16), pp.5953-5957. [CrossRef]
- Rozada, R., Solís-Fernández, P., Paredes, J.I., Martínez-Alonso, A., Ago, H. and Tascón, J.M.D., 2014. Controlled generation of atomic vacancies in chemical vapor deposited graphene by microwave oxygen plasma. Carbon, 79, pp.664-669. [CrossRef]
- Xie, G., Yang, R., Chen, P., Zhang, J., Tian, X., Wu, S., Zhao, J., Cheng, M., Yang, W., Wang, D. and He, C., 2014. A general route towards defect and pore engineering in graphene. Small, 10(11), pp.2280-2284. [CrossRef]
- Yamada, Y., Murota, K., Fujita, R., Kim, J., Watanabe, A., Nakamura, M., Sato, S., Hata, K., Ercius, P., Ciston, J. and Song, C.Y., 2014. Subnanometer vacancy defects introduced on graphene by oxygen gas. Journal of the American Chemical Society, 136(6), pp.2232-2235. [CrossRef]
- Garaj, S., Hubbard, W., Reina, A., Kong, J., Branton, D. and Golovchenko, J.A., 2010. Graphene as a subnanometre trans-electrode membrane. Nature, 467(7312), pp.190-193. [CrossRef]
- Jain, T., Rasera, B.C., Guerrero, R.J.S., Boutilier, M.S., O’hern, S.C., Idrobo, J.C. and Karnik, R., 2015. Heterogeneous sub-continuum ionic transport in statistically isolated graphene nanopores. Nature Nanotechnology, 10(12), pp.1053-1057. [CrossRef]
- O’Hern, S.C., Boutilier, M.S., Idrobo, J.C., Song, Y., Kong, J., Laoui, T., Atieh, M. and Karnik, R., 2014. Selective ionic transport through tunable subnanometer pores in single-layer graphene membranes. Nano Letters, 14(3), pp.1234-1241. [CrossRef]
- Rollings, R.C., Kuan, A.T. and Golovchenko, J.A., 2016. Ion selectivity of graphene nanopores. Nature Communications, 7(1), pp.1-7. [CrossRef]
- Feng, J., Liu, K., Graf, M., Dumcenco, D., Kis, A., Di Ventra, M. and Radenovic, A., 2016. Observation of ionic Coulomb blockade in nanopores. Nature Materials, 15(8), pp.850-855. [CrossRef]
- Tay, R.Y., Griep, M.H., Mallick, G., Tsang, S.H., Singh, R.S., Tumlin, T., Teo, E.H.T. and Karna, S.P., 2014. Growth of large single-crystalline two-dimensional boron nitride hexagons on electropolished copper. Nano Letters, 14(2), pp.839-846. [CrossRef]
- Li, J., Lin, J., Xu, X., Zhang, X., Xue, Y., Mi, J., Mo, Z., Fan, Y., Hu, L., Yang, X. and Zhang, J., 2013. Porous boron nitride with a high surface area: hydrogen storage and water treatment. Nanotechnology, 24(15), p.155603. [CrossRef]
- de Souza, F.A., Amorim, R.G., Scopel, W.L. and Scheicher, R.H., 2017. Electrical detection of nucleotides via nanopores in a hybrid graphene/h-BN sheet. Nanoscale, 9(6), pp.2207-2212. [CrossRef]
- Ziolkowski, R.W., Balmain, K.G., Pendry, J.B., Wiltshire, M.C.K. and Itoh, T., 2014. Applications M., Shalaev VM, Schurig D., Smith DR, Engheta N., et al. Heteroepitaxial growth of two-dimensional hexagonal boron nitride templated by graphene edges. Science, 343, pp.163-167. [CrossRef]
- Chen, Z.G., Zou, J., Liu, G., Li, F., Wang, Y., Wang, L., Yuan, X.L., Sekiguchi, T., Cheng, H.M. and Lu, G.Q., 2008. Novel boron nitride hollow nanoribbons. Acs Nano, 2(10), pp.2183-2191. [CrossRef]
- Jin, C., Lin, F., Suenaga, K. and Iijima, S., 2009. Fabrication of a freestanding boron nitride single layer and its defect assignments. Physical Review Letters, 102(19), p.195505. [CrossRef]
- Lei, W., Portehault, D., Liu, D., Qin, S. and Chen, Y., 2013. Porous boron nitride nanosheets for effective water cleaning. Nature Communications, 4(1), pp.1-7. [CrossRef]
- Prasad, V., Kannam, S.K., Hartkamp, R. and Sathian, S.P., 2018. Water desalination using graphene nanopores: influence of the water models used in simulations. Physical Chemistry Chemical Physics, 20(23), pp.16005-16011. [CrossRef]
- Verma, A., Zhang, W. and Van Duin, A.C., 2021. ReaxFF reactive molecular dynamics simulations to study the interfacial dynamics between defective h-BN nanosheets and water nanodroplets. Physical Chemistry Chemical Physics, 23(18), pp.10822-10834. [CrossRef]
- Nguyen, C.T. and Beskok, A., 2019. Charged nanoporous graphene membranes for water desalination. Physical Chemistry Chemical Physics, 21(18), pp.9483-9494. [CrossRef]
- Sahu, P. and Ali, S.M., 2019. Breakdown of continuum model for water transport and desalination through ultrathin graphene nanopores: insights from molecular dynamics simulations. Physical Chemistry Chemical Physics, 21(38), pp.21389-21406. [CrossRef]
- Fu, Y., Su, S., Zhang, N., Wang, Y., Guo, X. and Xue, J., 2020. Dehydration-determined ion selectivity of graphene subnanopores. ACS Applied Materials & Interfaces, 12(21), pp.24281-24288. [CrossRef]
- Konatham, D., Yu, J., Ho, T.A. and Striolo, A., 2013. Simulation insights for graphene-based water desalination membranes. Langmuir, 29(38), pp.11884-11897. [CrossRef]
- Liu, L., Liu, Y., Qi, Y., Song, M., Jiang, L., Fu, G. and Li, J., 2020. Hexagonal boron nitride with nanoslits as a membrane for water desalination: a molecular dynamics investigation. Separation and Purification Technology, 251, p.117409. [CrossRef]
- Rajasekaran, M. and Ayappa, K.G., 2022. Influence of the extent of hydrophobicity on water organization and dynamics on 2D graphene oxide surfaces. Physical Chemistry Chemical Physics, 24(24), pp.14909-14923. [CrossRef]
- Abal, J.P. and Barbosa, M.C., 2021. Water mobility in MoS2 nanopores: effects of the dipole–dipole interaction on the physics of fluid transport. Physical Chemistry Chemical Physics, 23(21), pp.12075-12081. [CrossRef]
- Berne, B.J., Ciccotti, G. and Coker, D.F. eds., 1998. Classical and quantum dynamics in condensed phase simulations: Proceedings of the International School of Physics. World Scientific.
- Frenkel, D., Smit, B. and Ratner, M.A., 1996. Understanding molecular simulation: from algorithms to applications (Vol. 2). San Diego: Academic press. [CrossRef]
- Guerrero-Avilés, R. and Orellana, W., 2017. Energetics and diffusion of liquid water and hydrated ions through nanopores in graphene: ab initio molecular dynamics simulation. Physical Chemistry Chemical Physics, 19(31), pp.20551-20558. [CrossRef]
- Tocci, G., Joly, L. and Michaelides, A., 2014. Friction of water on graphene and hexagonal boron nitride from ab initio methods: very different slippage despite very similar interface structures. Nano Letters, 14(12), pp.6872-6877. [CrossRef]
- Grosjean, B., Bocquet, M.L. and Vuilleumier, R., 2019. Versatile electrification of two-dimensional nanomaterials in water. Nature Communications, 10(1), pp.1-8. [CrossRef]
- Hohenberg, P. and Kohn, W., 1964. Inhomogeneus Electron Gas. Physical Review, 136, pp.864-871. [CrossRef]
- Kohn, W. and Sham, L.J., 1965. Self-consistent equations including exchange and correlation effects. Physical Review, 140(4A), p.A1133. [CrossRef]
- Soler, J.M., Artacho, E., Gale, J.D., García, A., Junquera, J., Ordejón, P. and Sánchez-Portal, D., 2002. The SIESTA method for ab initio order-N materials simulation. Journal of Physics: Condensed Matter, 14(11), p.2745. [CrossRef]
- Perdew, J.P., Burke, K. and Ernzerhof, M., 1996. Generalized gradient approximation made simple. Physical Review Letters, 77(18), p.3865. [CrossRef]
- Lee, K., Murray, É.D., Kong, L., Lundqvist, B.I. and Langreth, D.C., 2010. Higher-accuracy van der Waals density functional. Physical Review B, 82(8), p.081101. [CrossRef]
- Troullier, N. and Martins, J.L., 1991. Efficient pseudopotentials for plane-wave calculations. Physical Review B, 43(3), p.1993. [CrossRef]
- Car, R. and Parrinello, M., 1985. Unified approach for molecular dynamics and density-functional theory. Physical Review Letters, 55(22), p.2471. [CrossRef]
- CPMD, Version 4.1, J. Hutter. https://www.cpmd.org/, Copyright IBM Corp. 1990–2015, Copyright MPI für Festkörperforschung, Stuttgart 1997– 2001.
- Grimme, S., 2006. Semiempirical GGA-type density functional constructed with a long-range dispersion correction. Journal of Computational Chemistry, 27(15), pp.1787-1799. [CrossRef]
- Hoover, W.G., 1985. Canonical dynamics: Equilibrium phase-space distributions. Physical Review A, 31(3), p.1695. [CrossRef]
- Nosé, S., 1984. A molecular dynamics method for simulations in the canonical ensemble. Molecular Physics, 52(2), pp.255-268. [CrossRef]
- Tuckerman, M.E. and Parrinello, M., 1994. Integrating the Car–Parrinello equations. I. Basic integration techniques. The Journal of Chemical Physics, 101(2), pp.1302-1315. [CrossRef]
- Skinner, L.B., Huang, C., Schlesinger, D., Pettersson, L.G., Nilsson, A. and Benmore, C.J., 2013. Benchmark oxygen-oxygen pair-distribution function of ambient water from x-ray diffraction measurements with a wide Q-range. The Journal of Chemical Physics, 138(7), p.074506. [CrossRef]
- Soper, A.K. and Benmore, C.J., 2008. Quantum differences between heavy and light water. Physical Review Letters, 101(6), p.065502. [CrossRef]
- Lee, C.Y., McCammon, J.A. and Rossky, P.J., 1984. The structure of liquid water at an extended hydrophobic surface. The Journal of Chemical Physics, 80(9), pp.4448-4455. [CrossRef]
- Cicero, G., Grossman, J.C., Schwegler, E., Gygi, F. and Galli, G., 2008. Water confined in nanotubes and between graphene sheets: A first principle study. Journal of the American Chemical Society, 130(6), pp.1871-1878. [CrossRef]
- Tocci, G. and Michaelides, A., 2014. Solvent-induced proton hopping at a water–oxide interface. The Journal of Physical Chemistry Letters, 5(3), pp.474-480. [CrossRef]
- Zuo, K., Zhang, X., Huang, X., Oliveira, E.F., Guo, H., Zhai, T., Wang, W., Alvarez, P.J., Elimelech, M., Ajayan, P.M. and Lou, J., 2022. Ultrahigh resistance of hexagonal boron nitride to mineral scale formation. Nature Communications, 13(1), p.4523. [CrossRef]
- Cohen-Tanugi, D. and Grossman, J.C., 2015. Nanoporous graphene as a reverse osmosis membrane: recent insights from theory and simulation. Desalination, 366, pp.59-70. [CrossRef]
- Marcus, Y., 1991. Thermodynamics of solvation of ions. Part 5.—Gibbs free energy of hydration at 298.15 K. Journal of the Chemical Society, Faraday Transactions, 87(18), pp.2995-2999. [CrossRef]
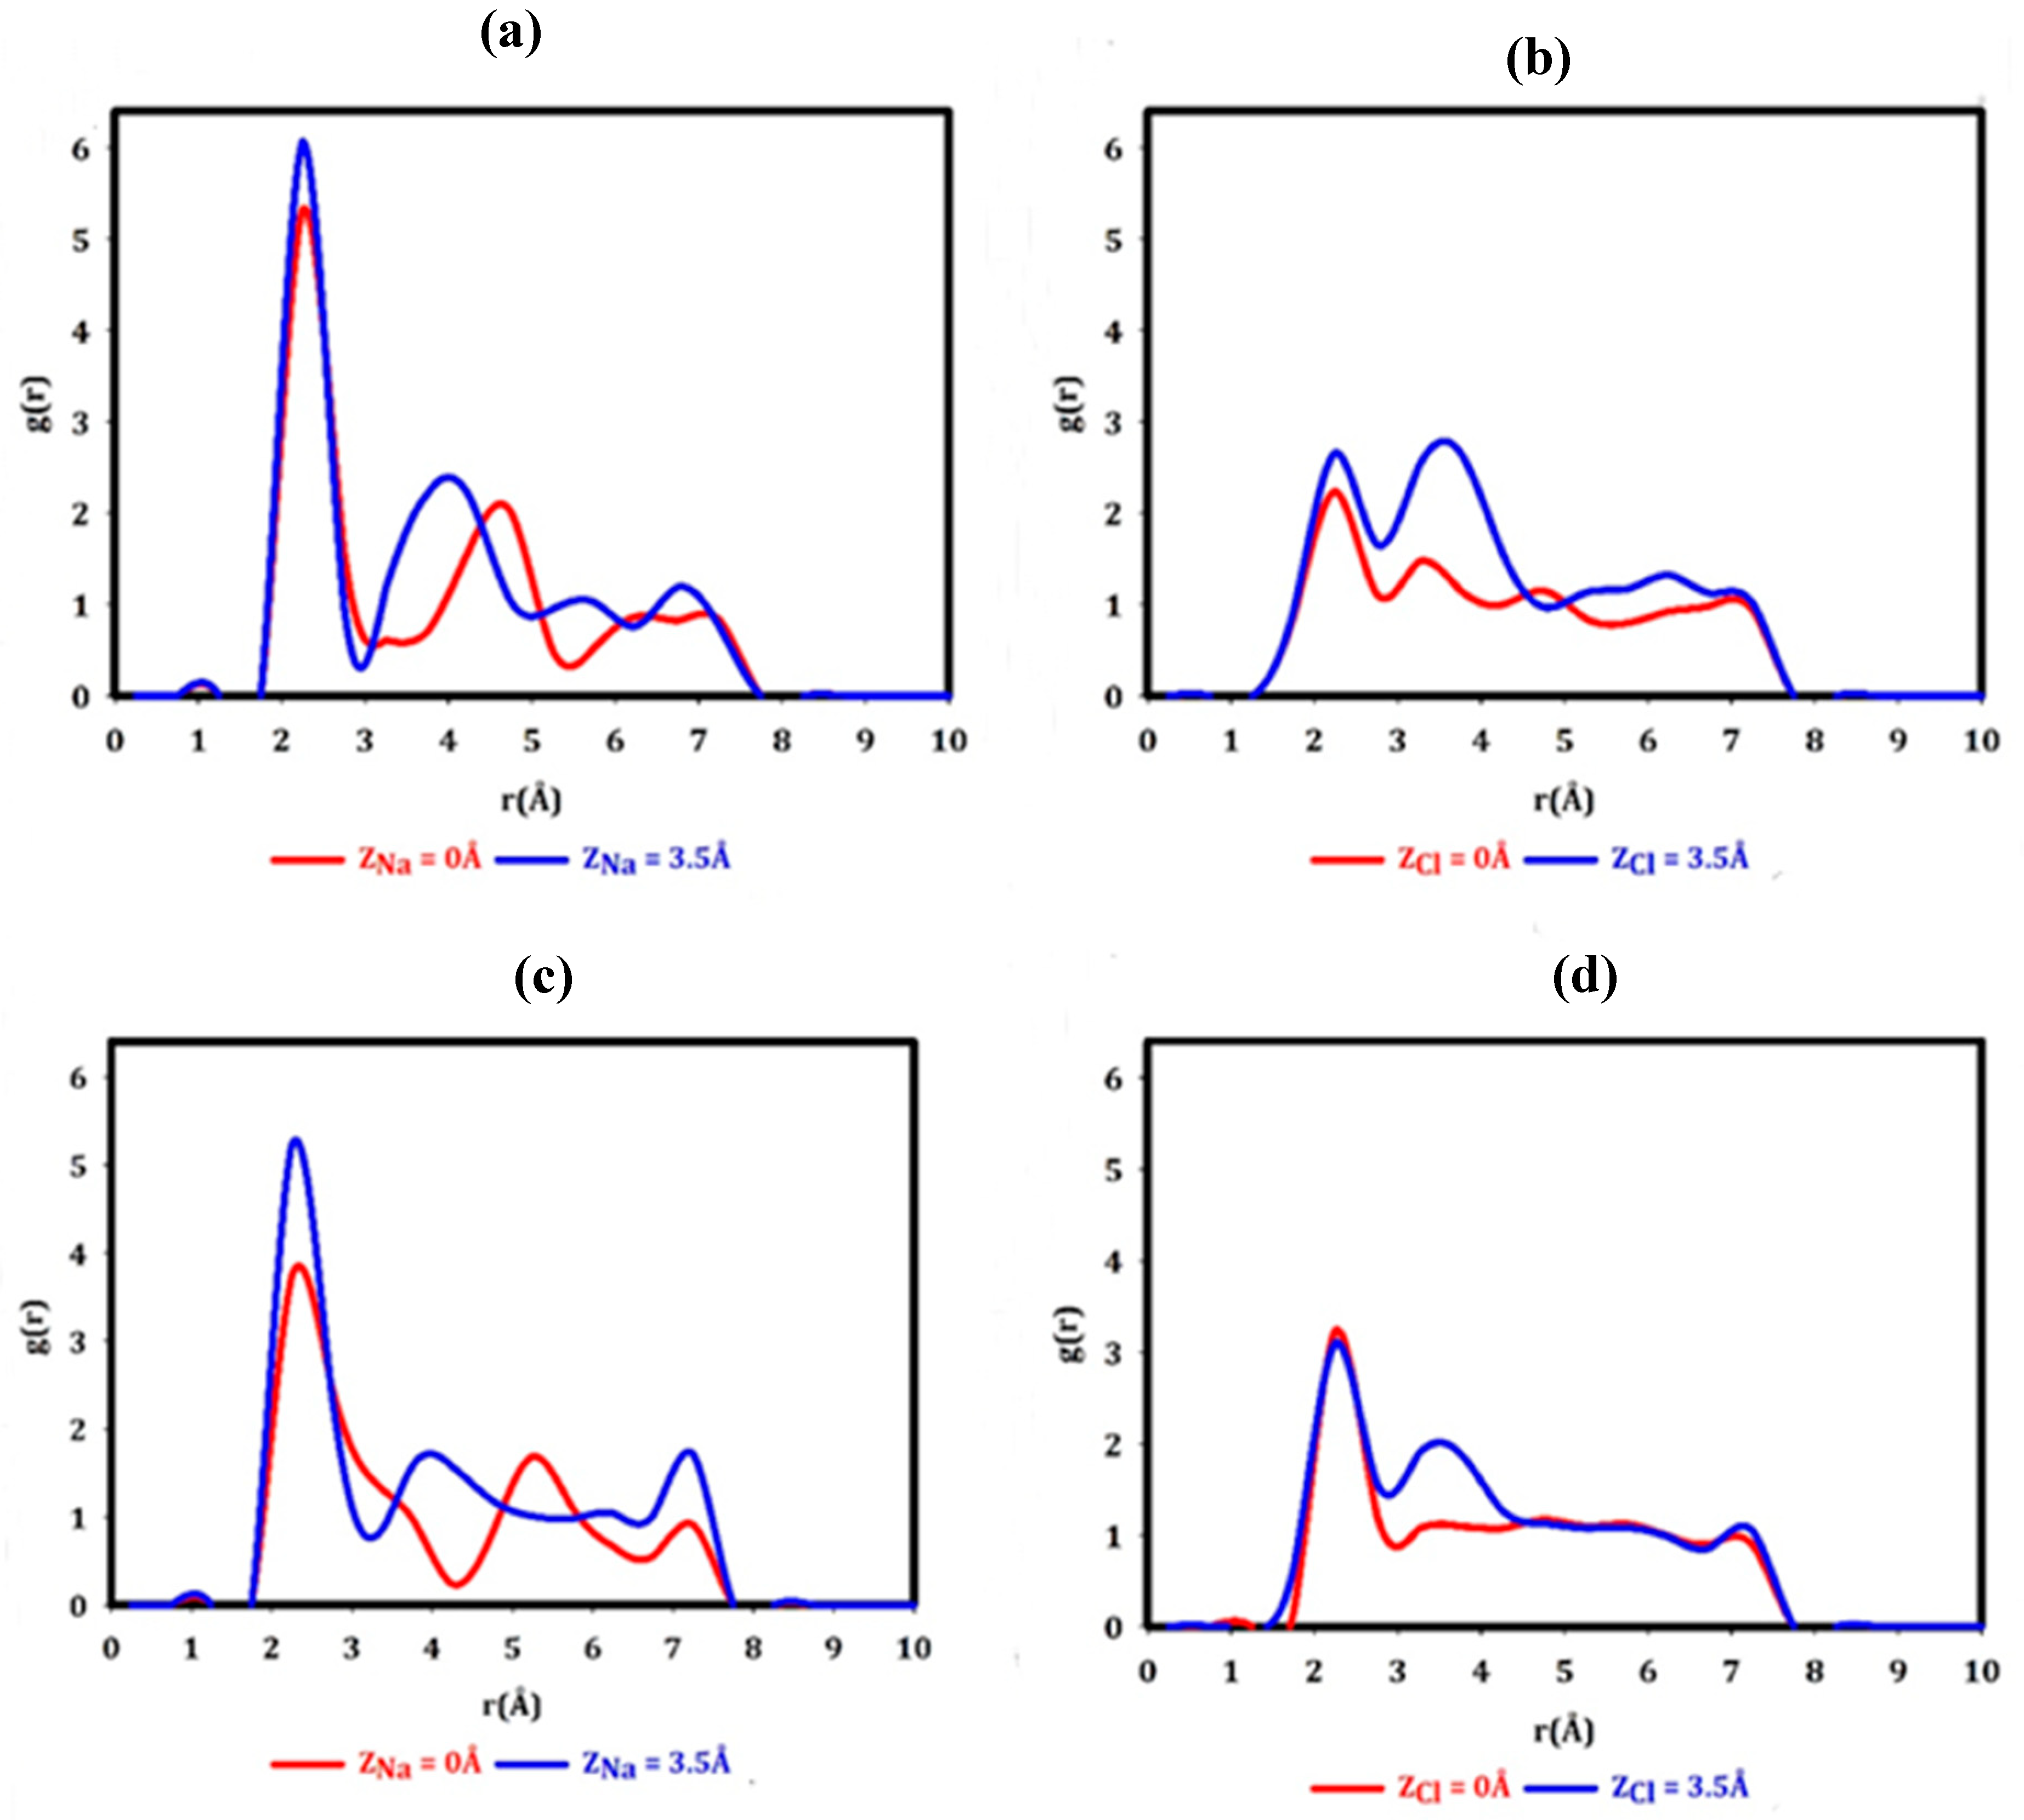
| Graphene | h-BN | ||||
|---|---|---|---|---|---|
| Ion position (Å) | |||||
| Na+ | Z = 3.5 | 6.07 | 2.25 | 5.22 | 2.25 |
| Z = 0 | 5.33 | 2.25 | 3.73 | 2.25 | |
| Cl- | Z = 3.5 | 2.66 | 2.25 | 3.11 | 2.25 |
| Z = 0 | 2.23 | 2.25 | 3.24 | 2.25 | |
| Ion position (Å) | Graphene nanopore | h-BN nanopore | |
| Na Cation | ZNa = 0 | 3.24 | 2.95 |
| ZNa = 3.5 | 2.76 | 2.25 | |
| Cl anion | ZCl = 0 | 1.34 | 1.71 |
| ZCl = 3.5 | 3.64 | 3.31 |
Disclaimer/Publisher’s Note: The statements, opinions and data contained in all publications are solely those of the individual author(s) and contributor(s) and not of MDPI and/or the editor(s). MDPI and/or the editor(s) disclaim responsibility for any injury to people or property resulting from any ideas, methods, instructions or products referred to in the content. |
© 2024 by the authors. Licensee MDPI, Basel, Switzerland. This article is an open access article distributed under the terms and conditions of the Creative Commons Attribution (CC BY) license (http://creativecommons.org/licenses/by/4.0/).


