Submitted:
08 March 2024
Posted:
11 March 2024
You are already at the latest version
Abstract
Keywords:
1. Introduction
2. Modeling Sea Surfaces
2.1. Background on Sea Spectra
PM Spectrum
ECKV Spectrum
Spectra Comparison
2.2. Generating Pseudorandom Sea Surfaces
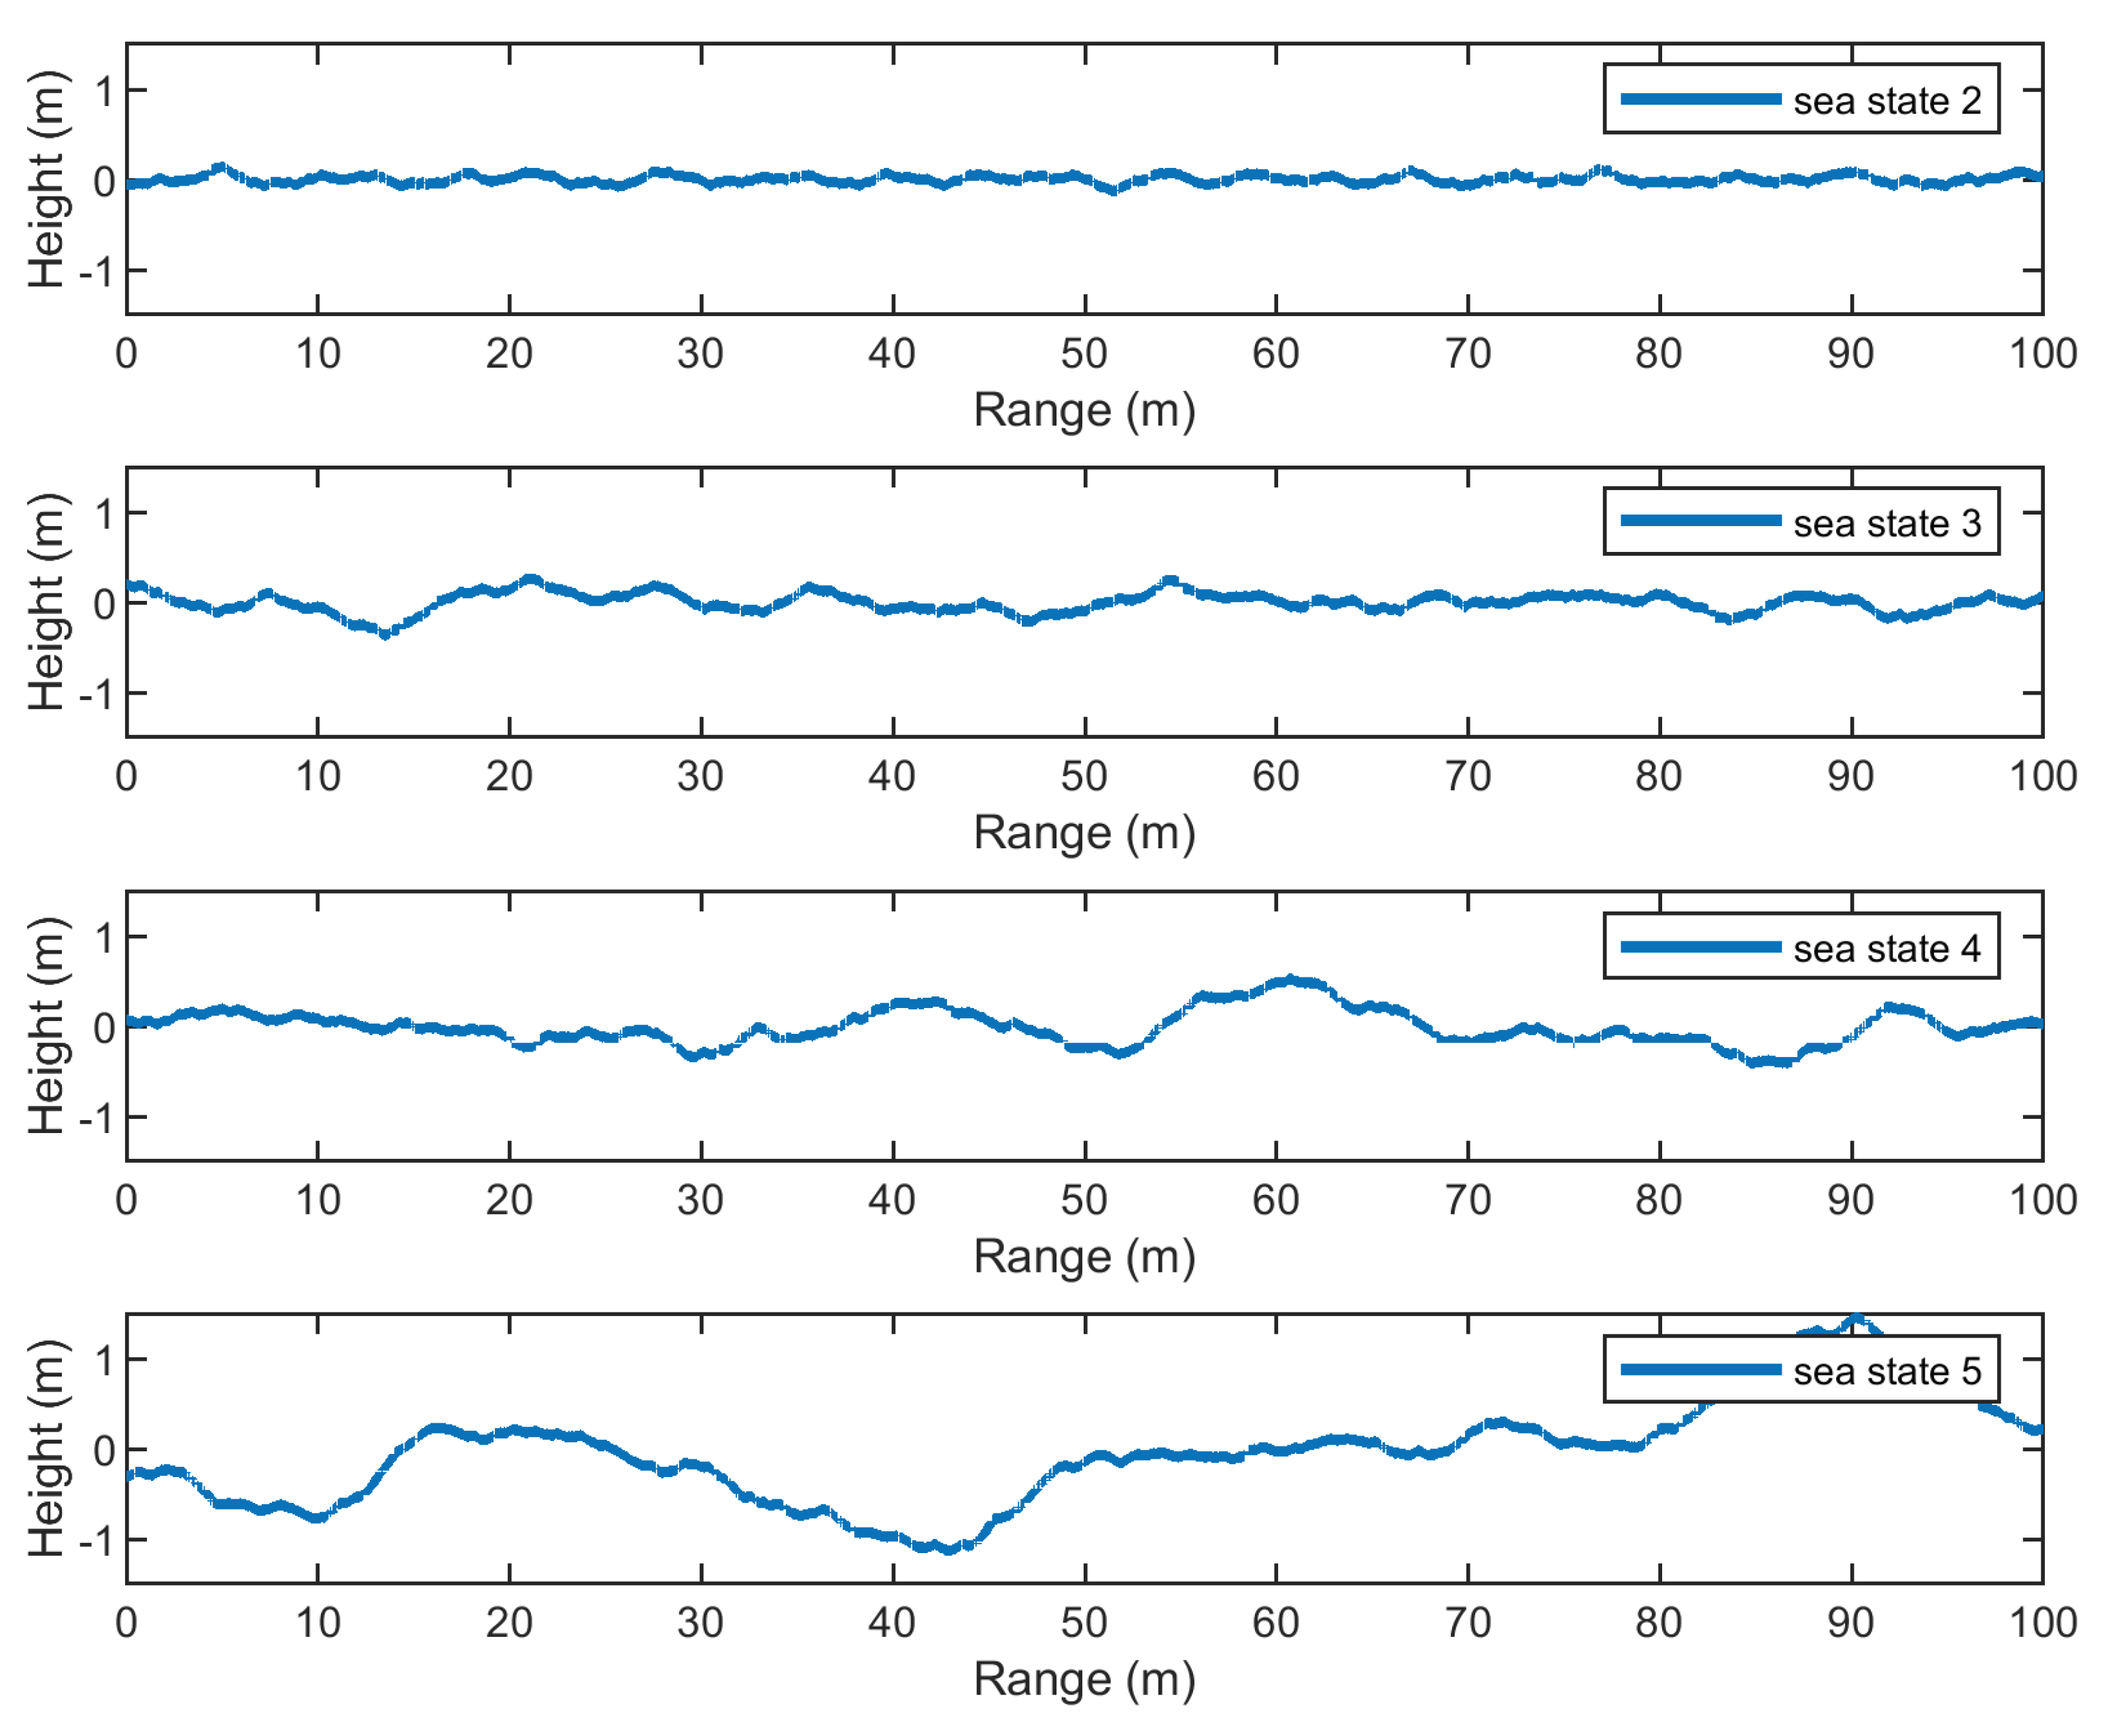
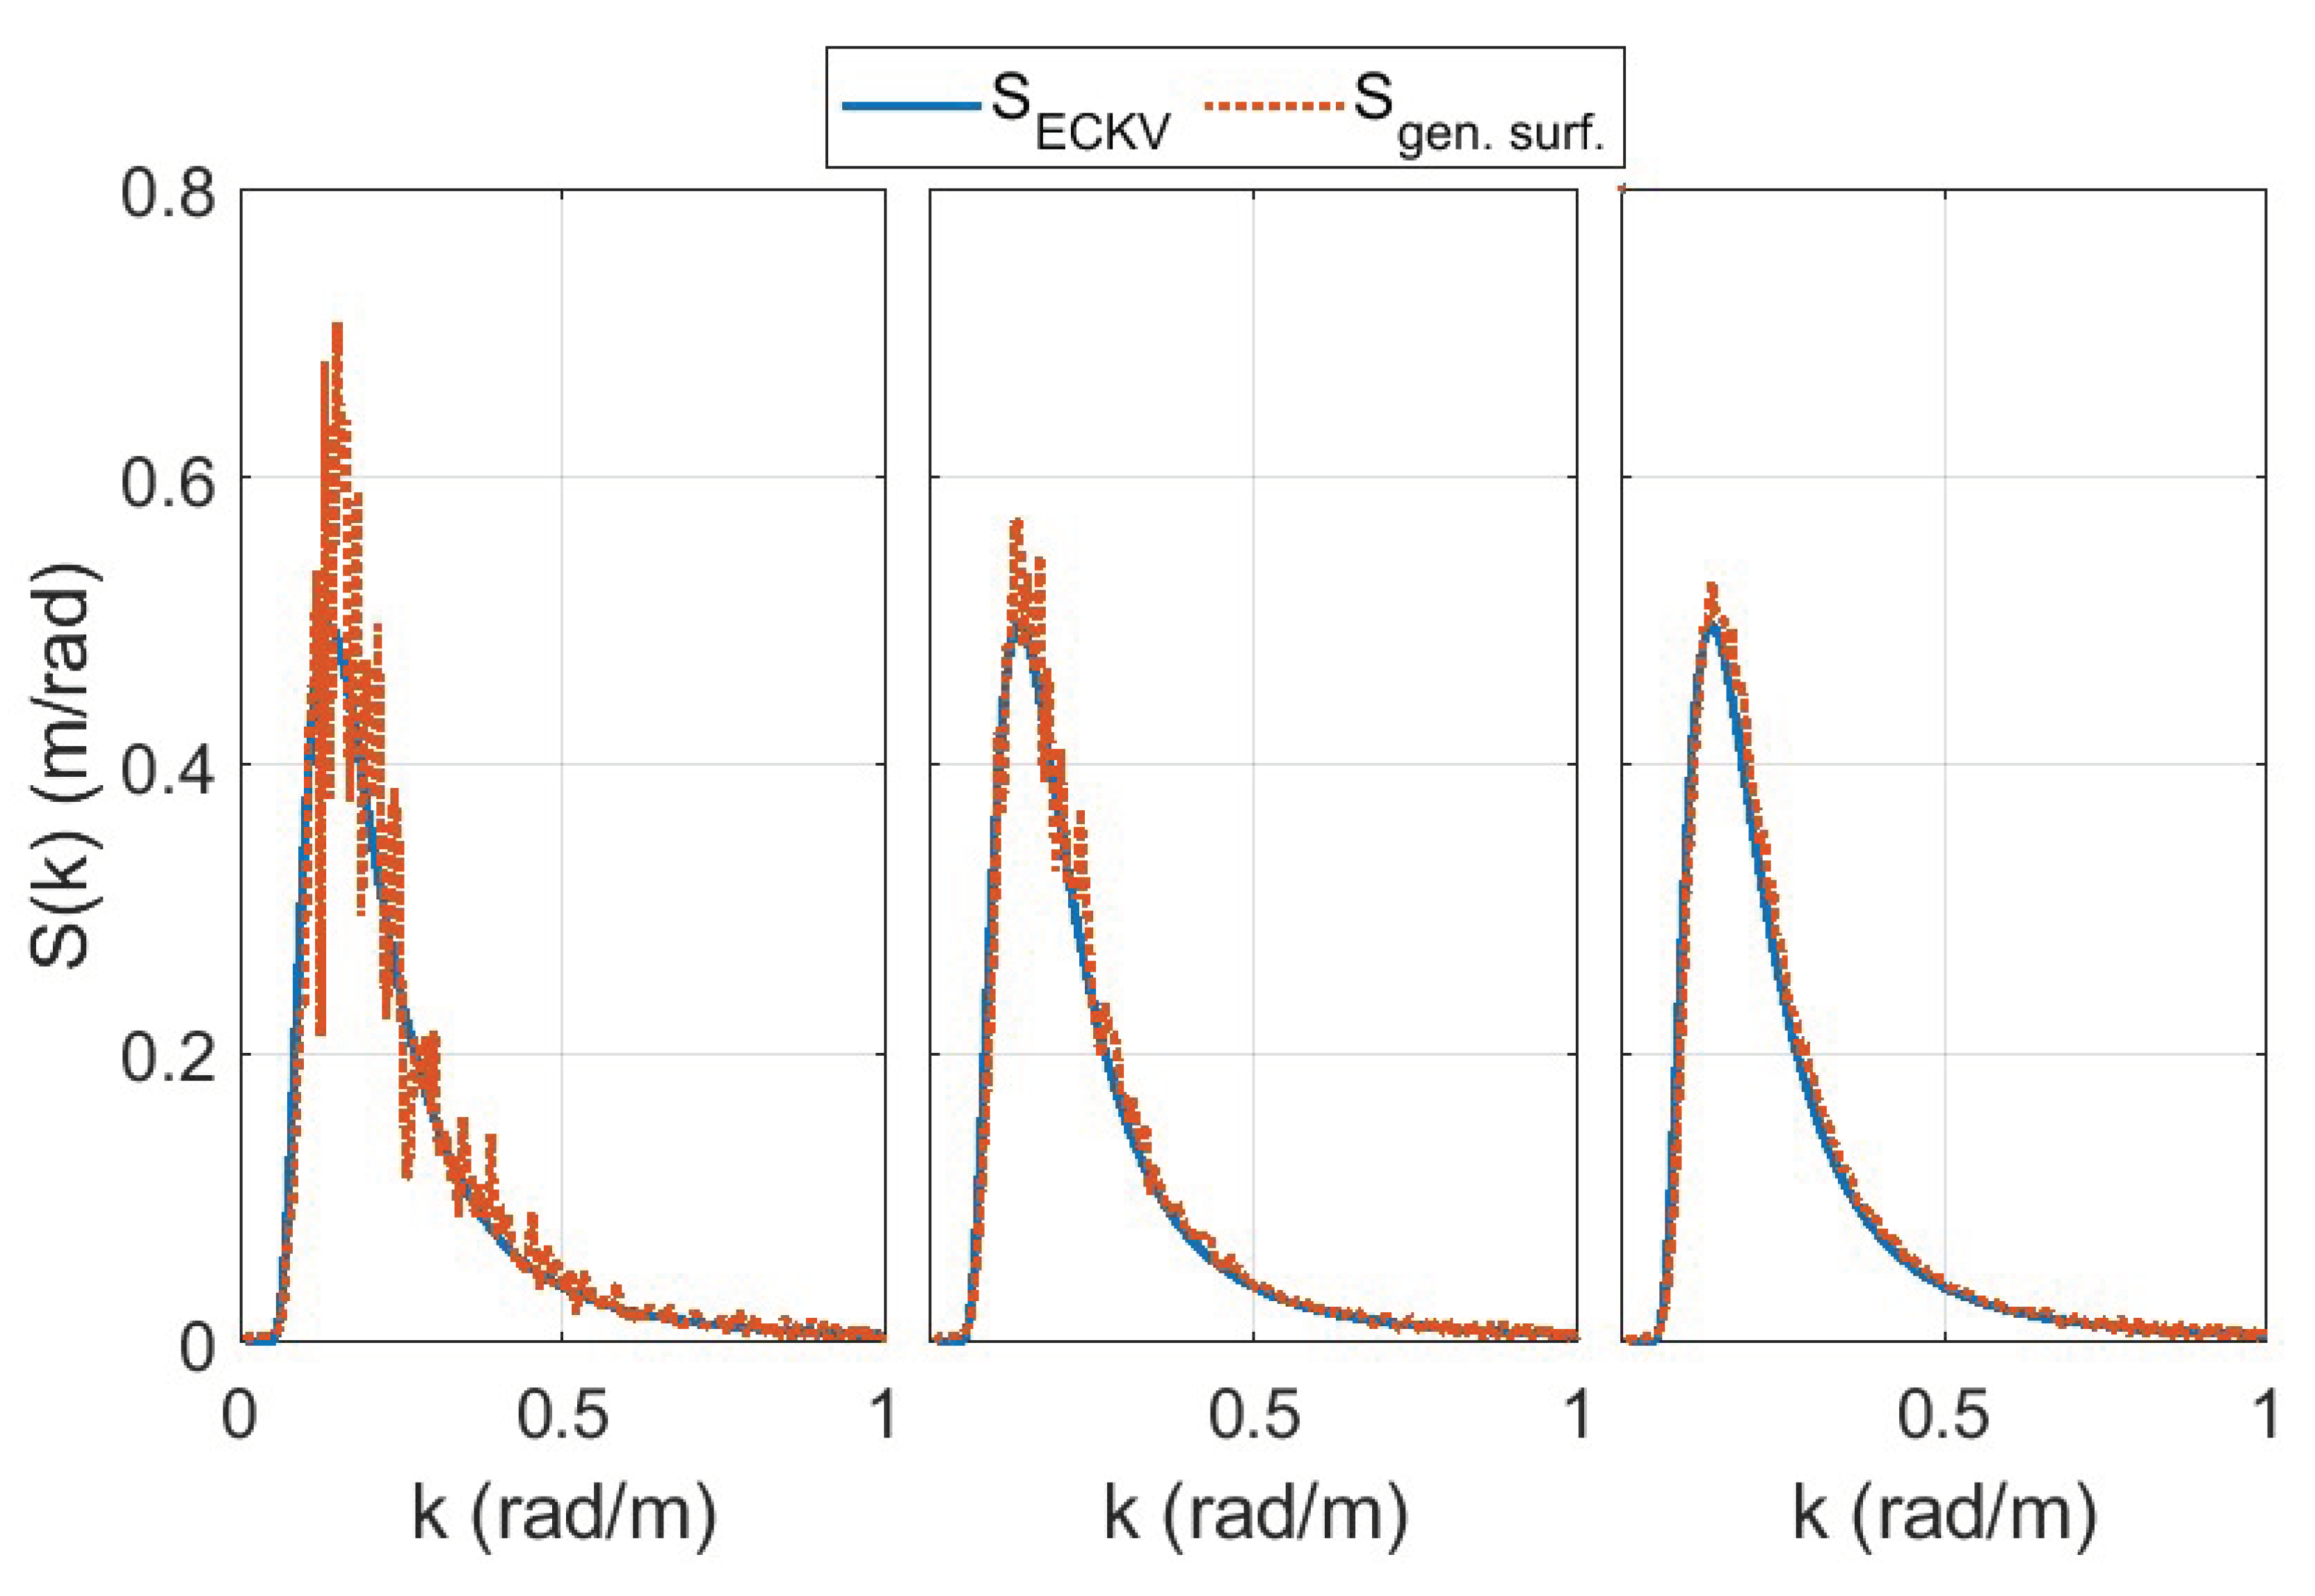
3. Modeling Refraction
3.1. Monin-Obukhov Similarity Theory
3.2. Meteorological Data
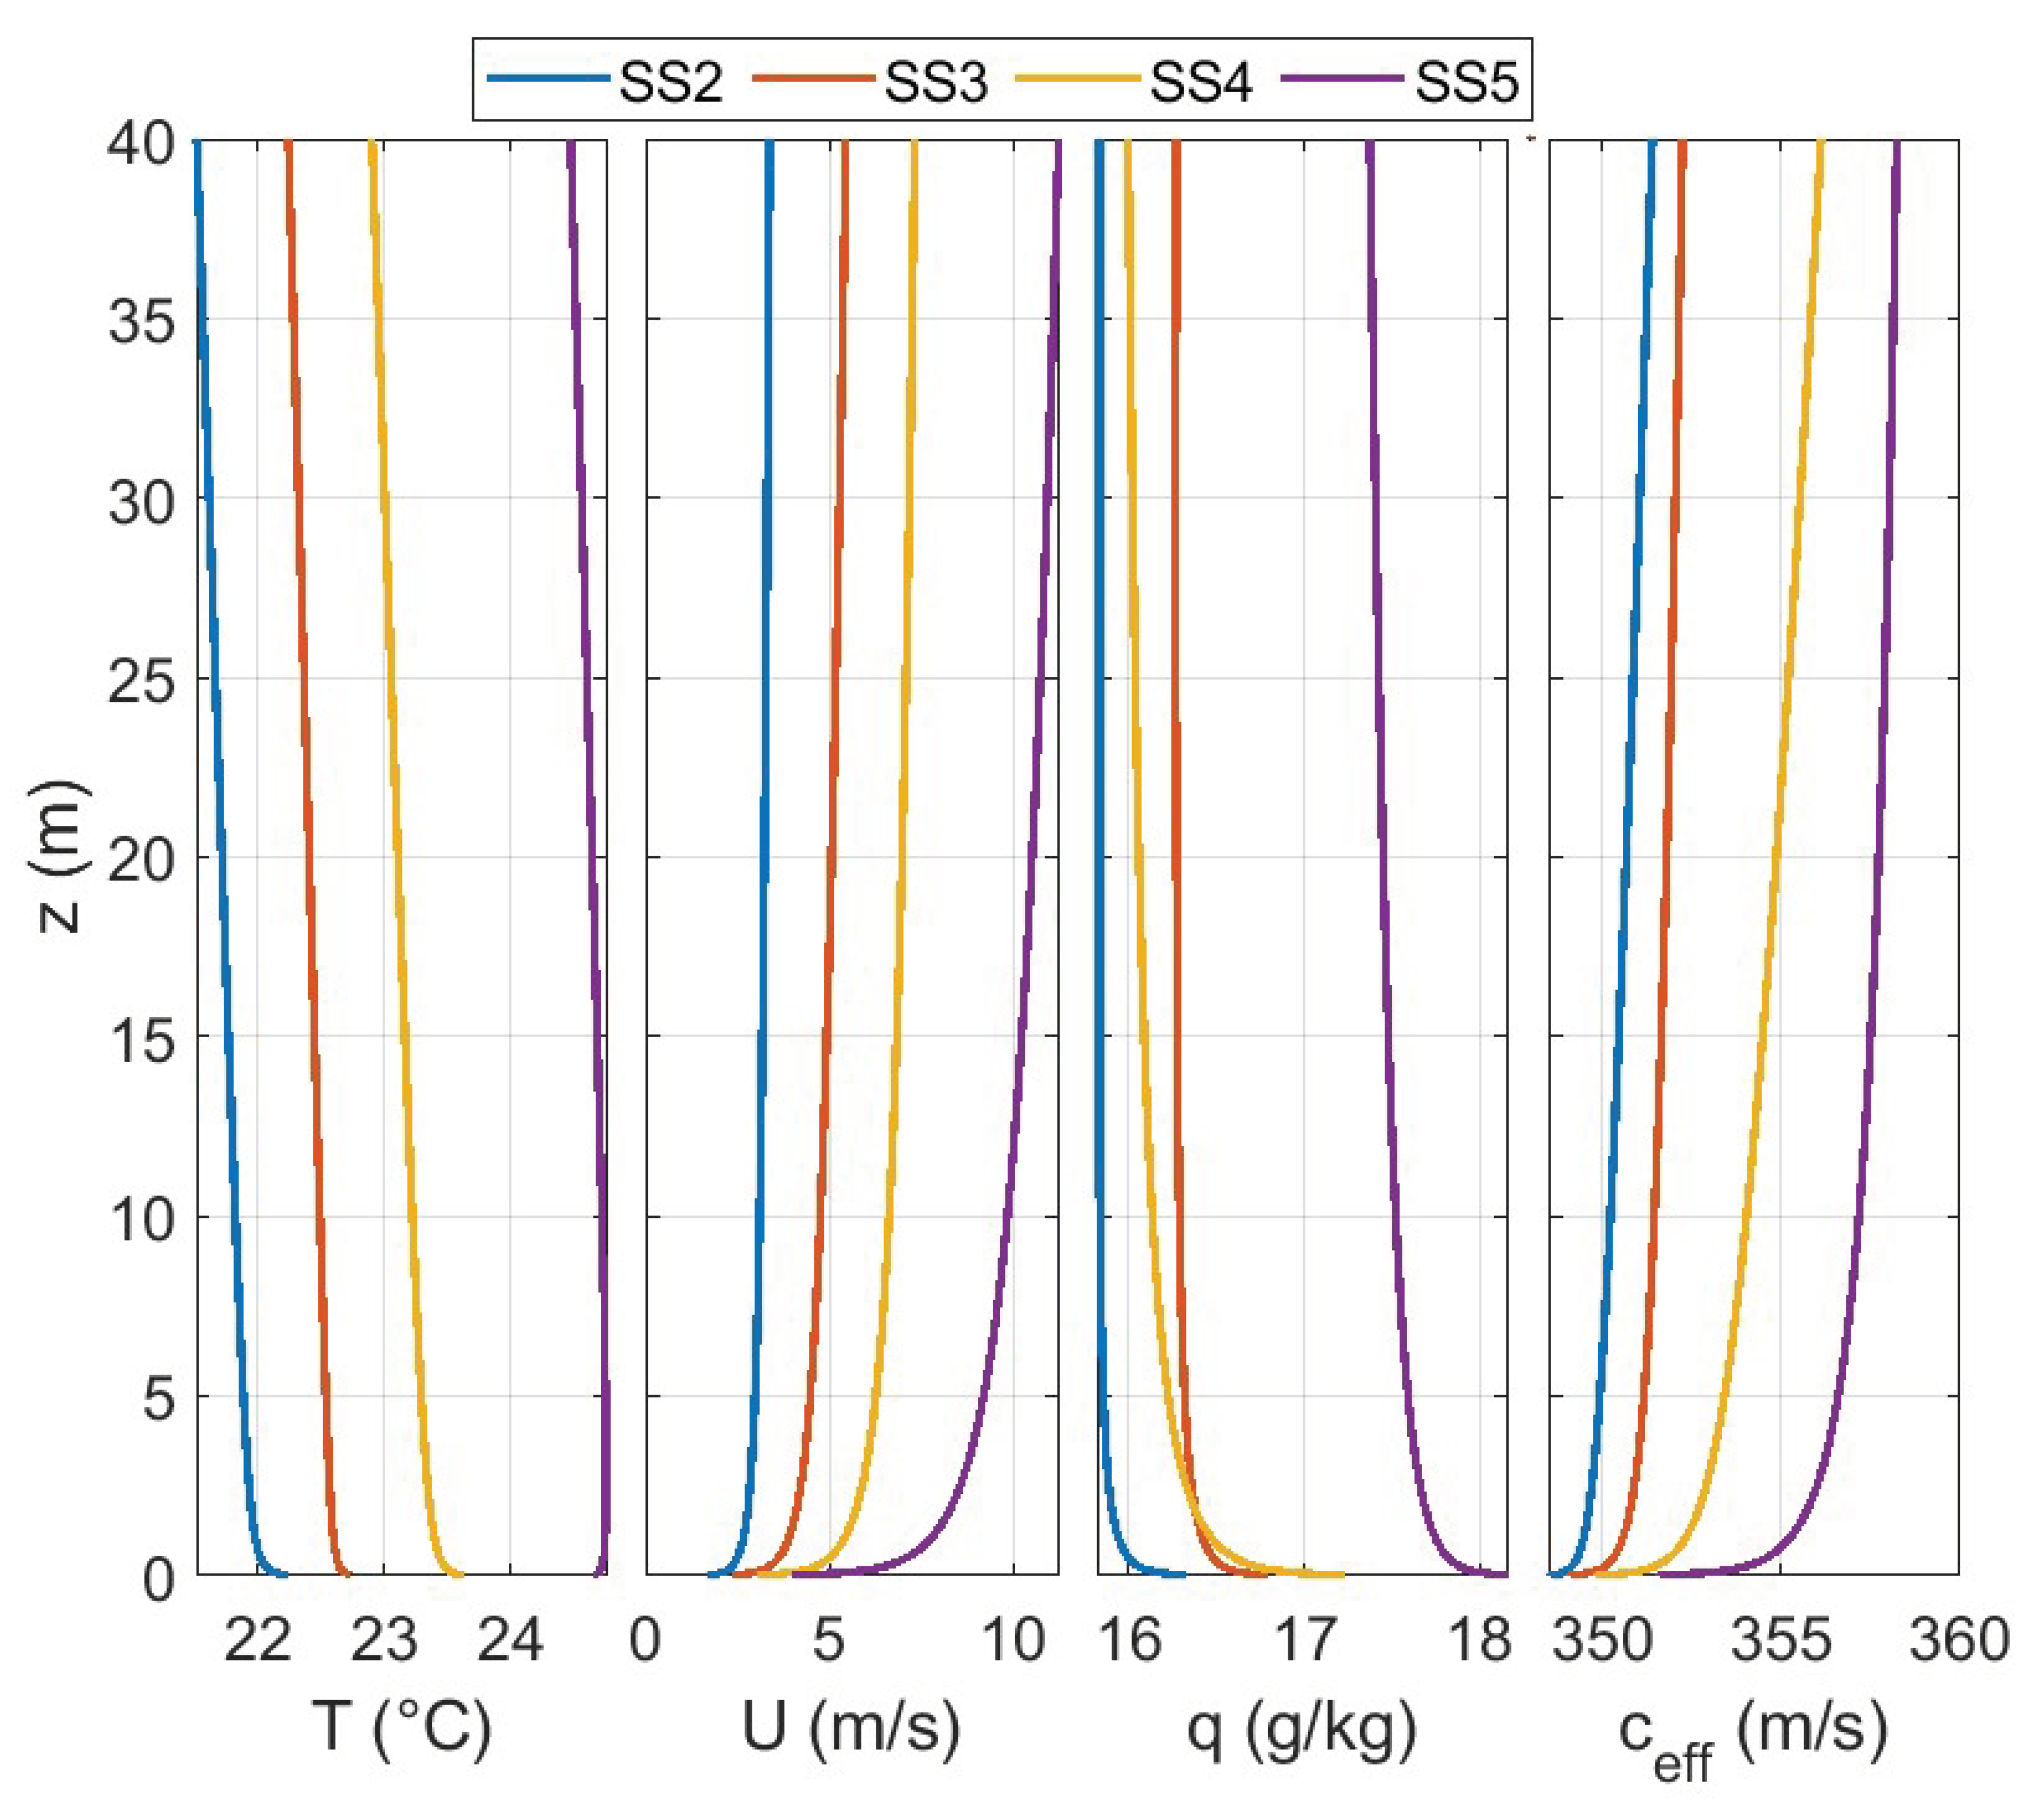
4. GTPE Predictions
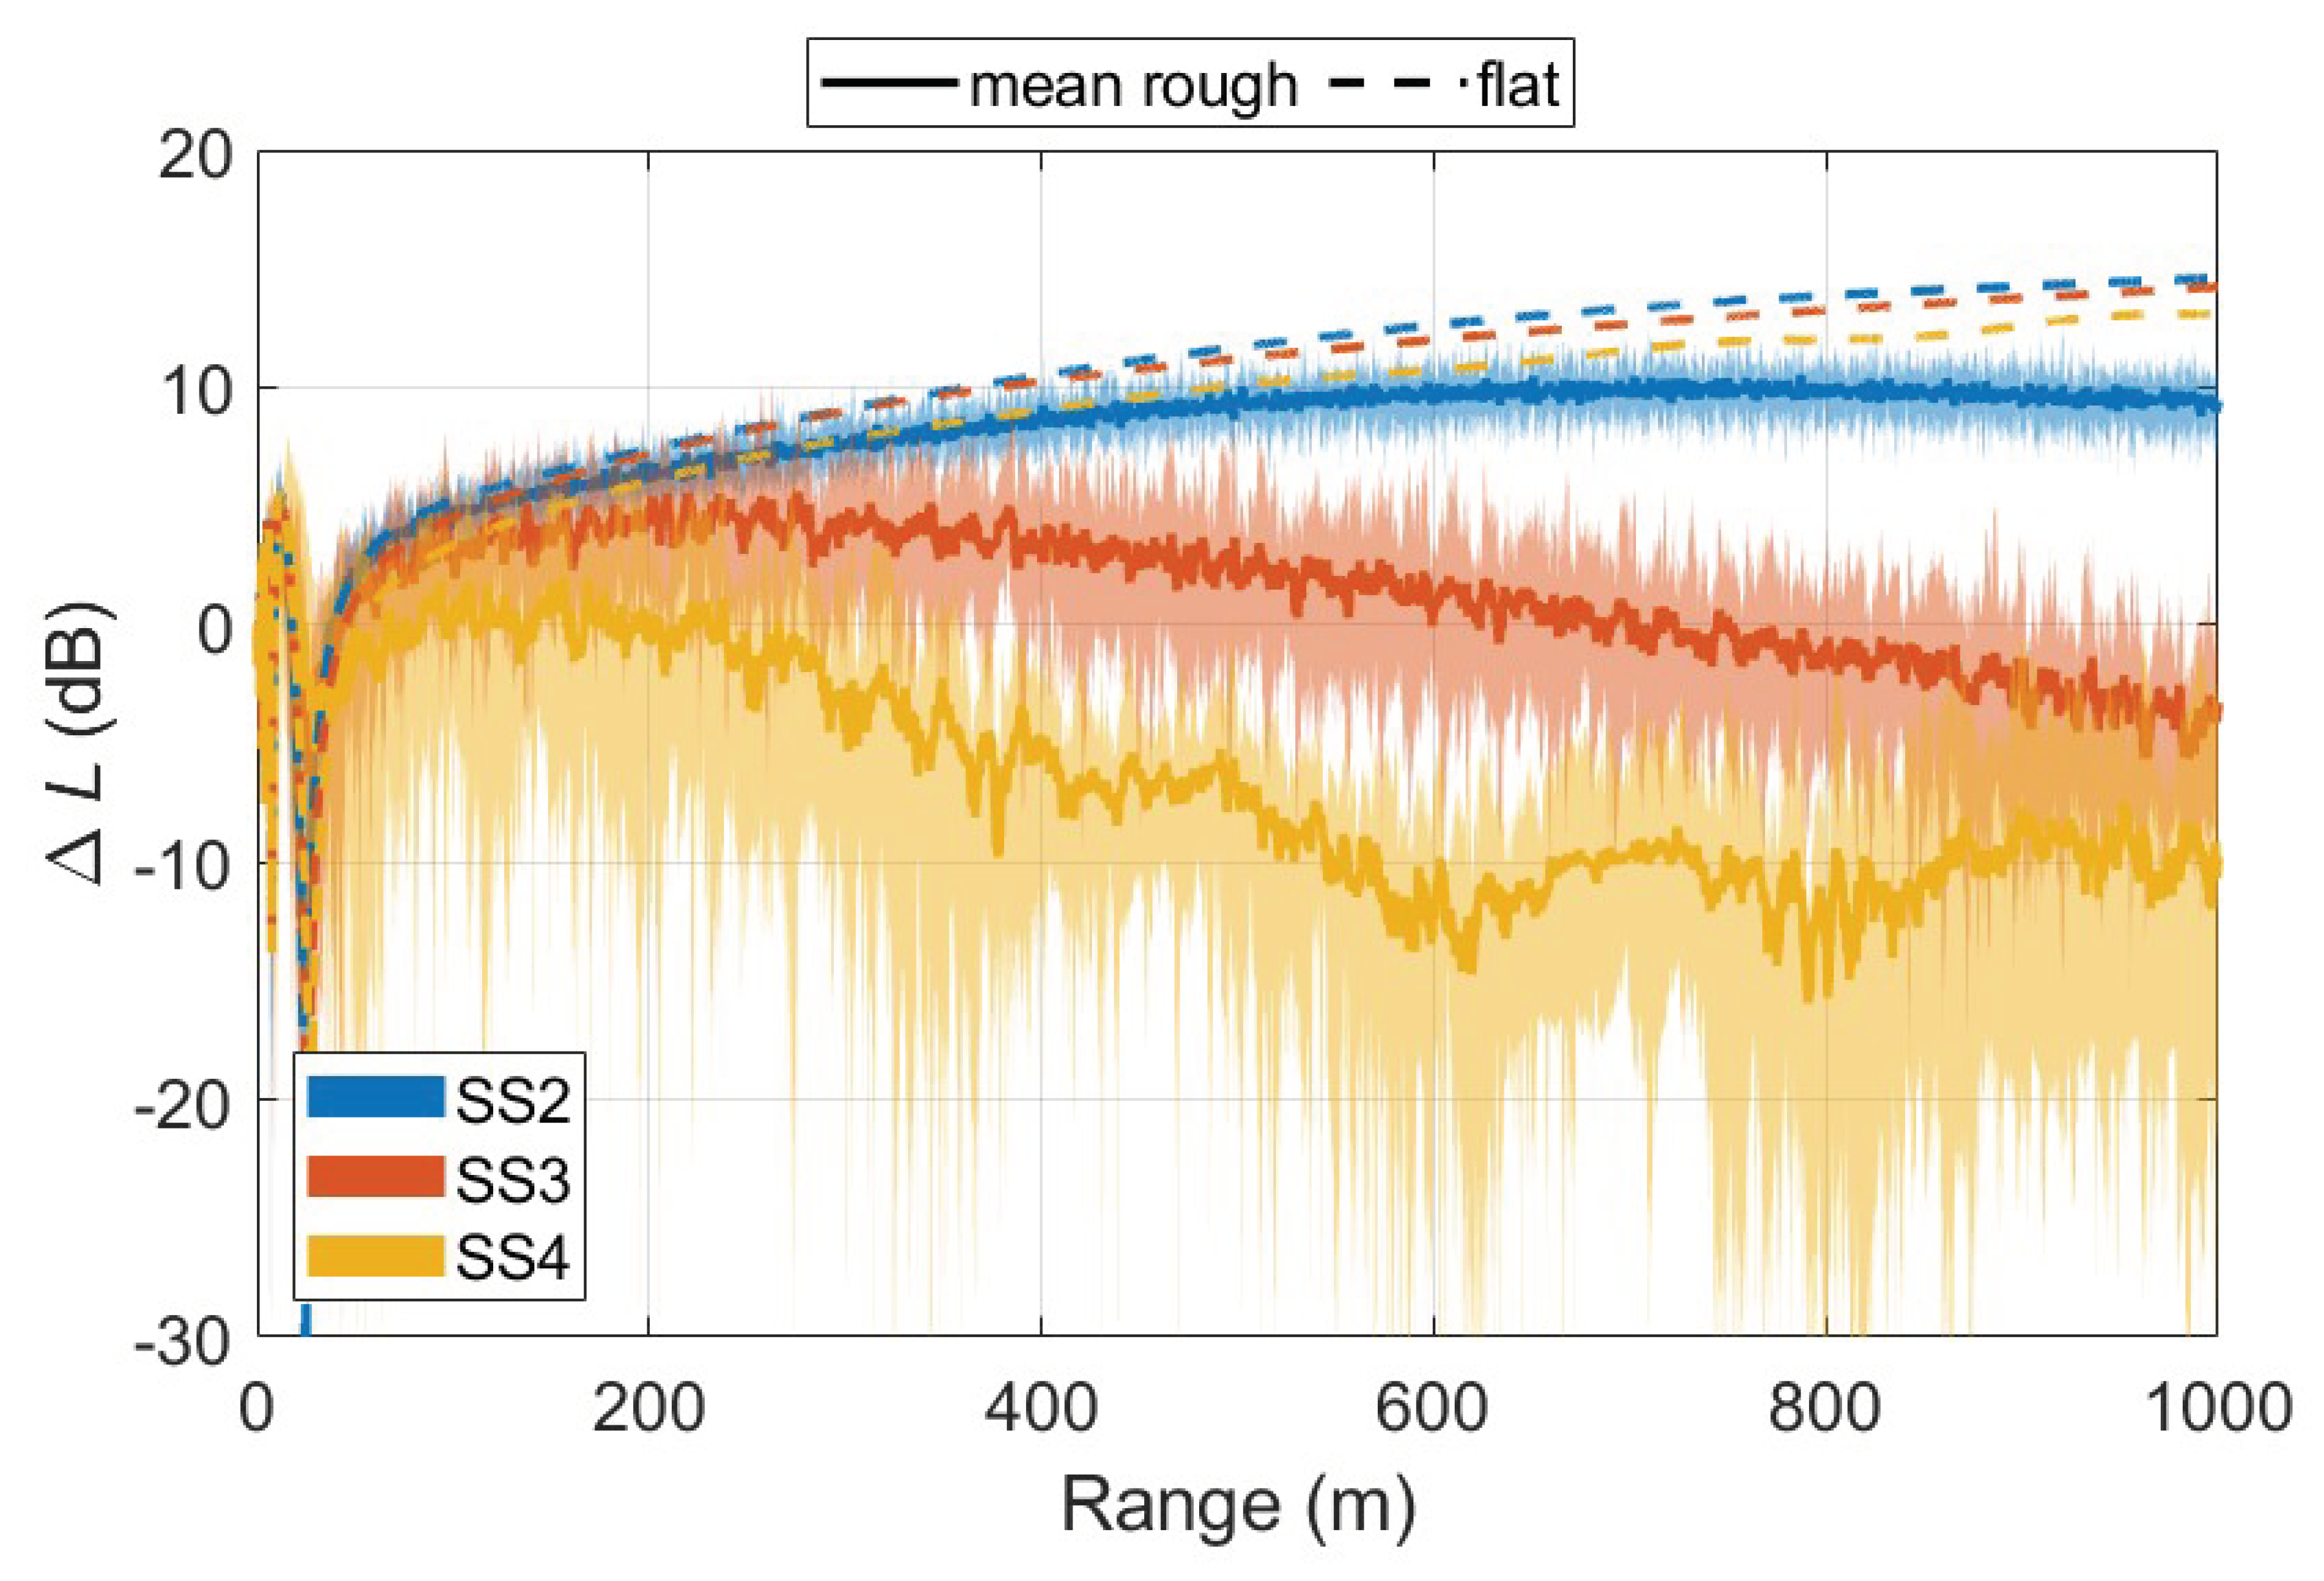
5. Equivalent Impedance Methods
Bolin et al
Van Renterghem et al
6. Results
6.1. Surface Impedance Parameterization
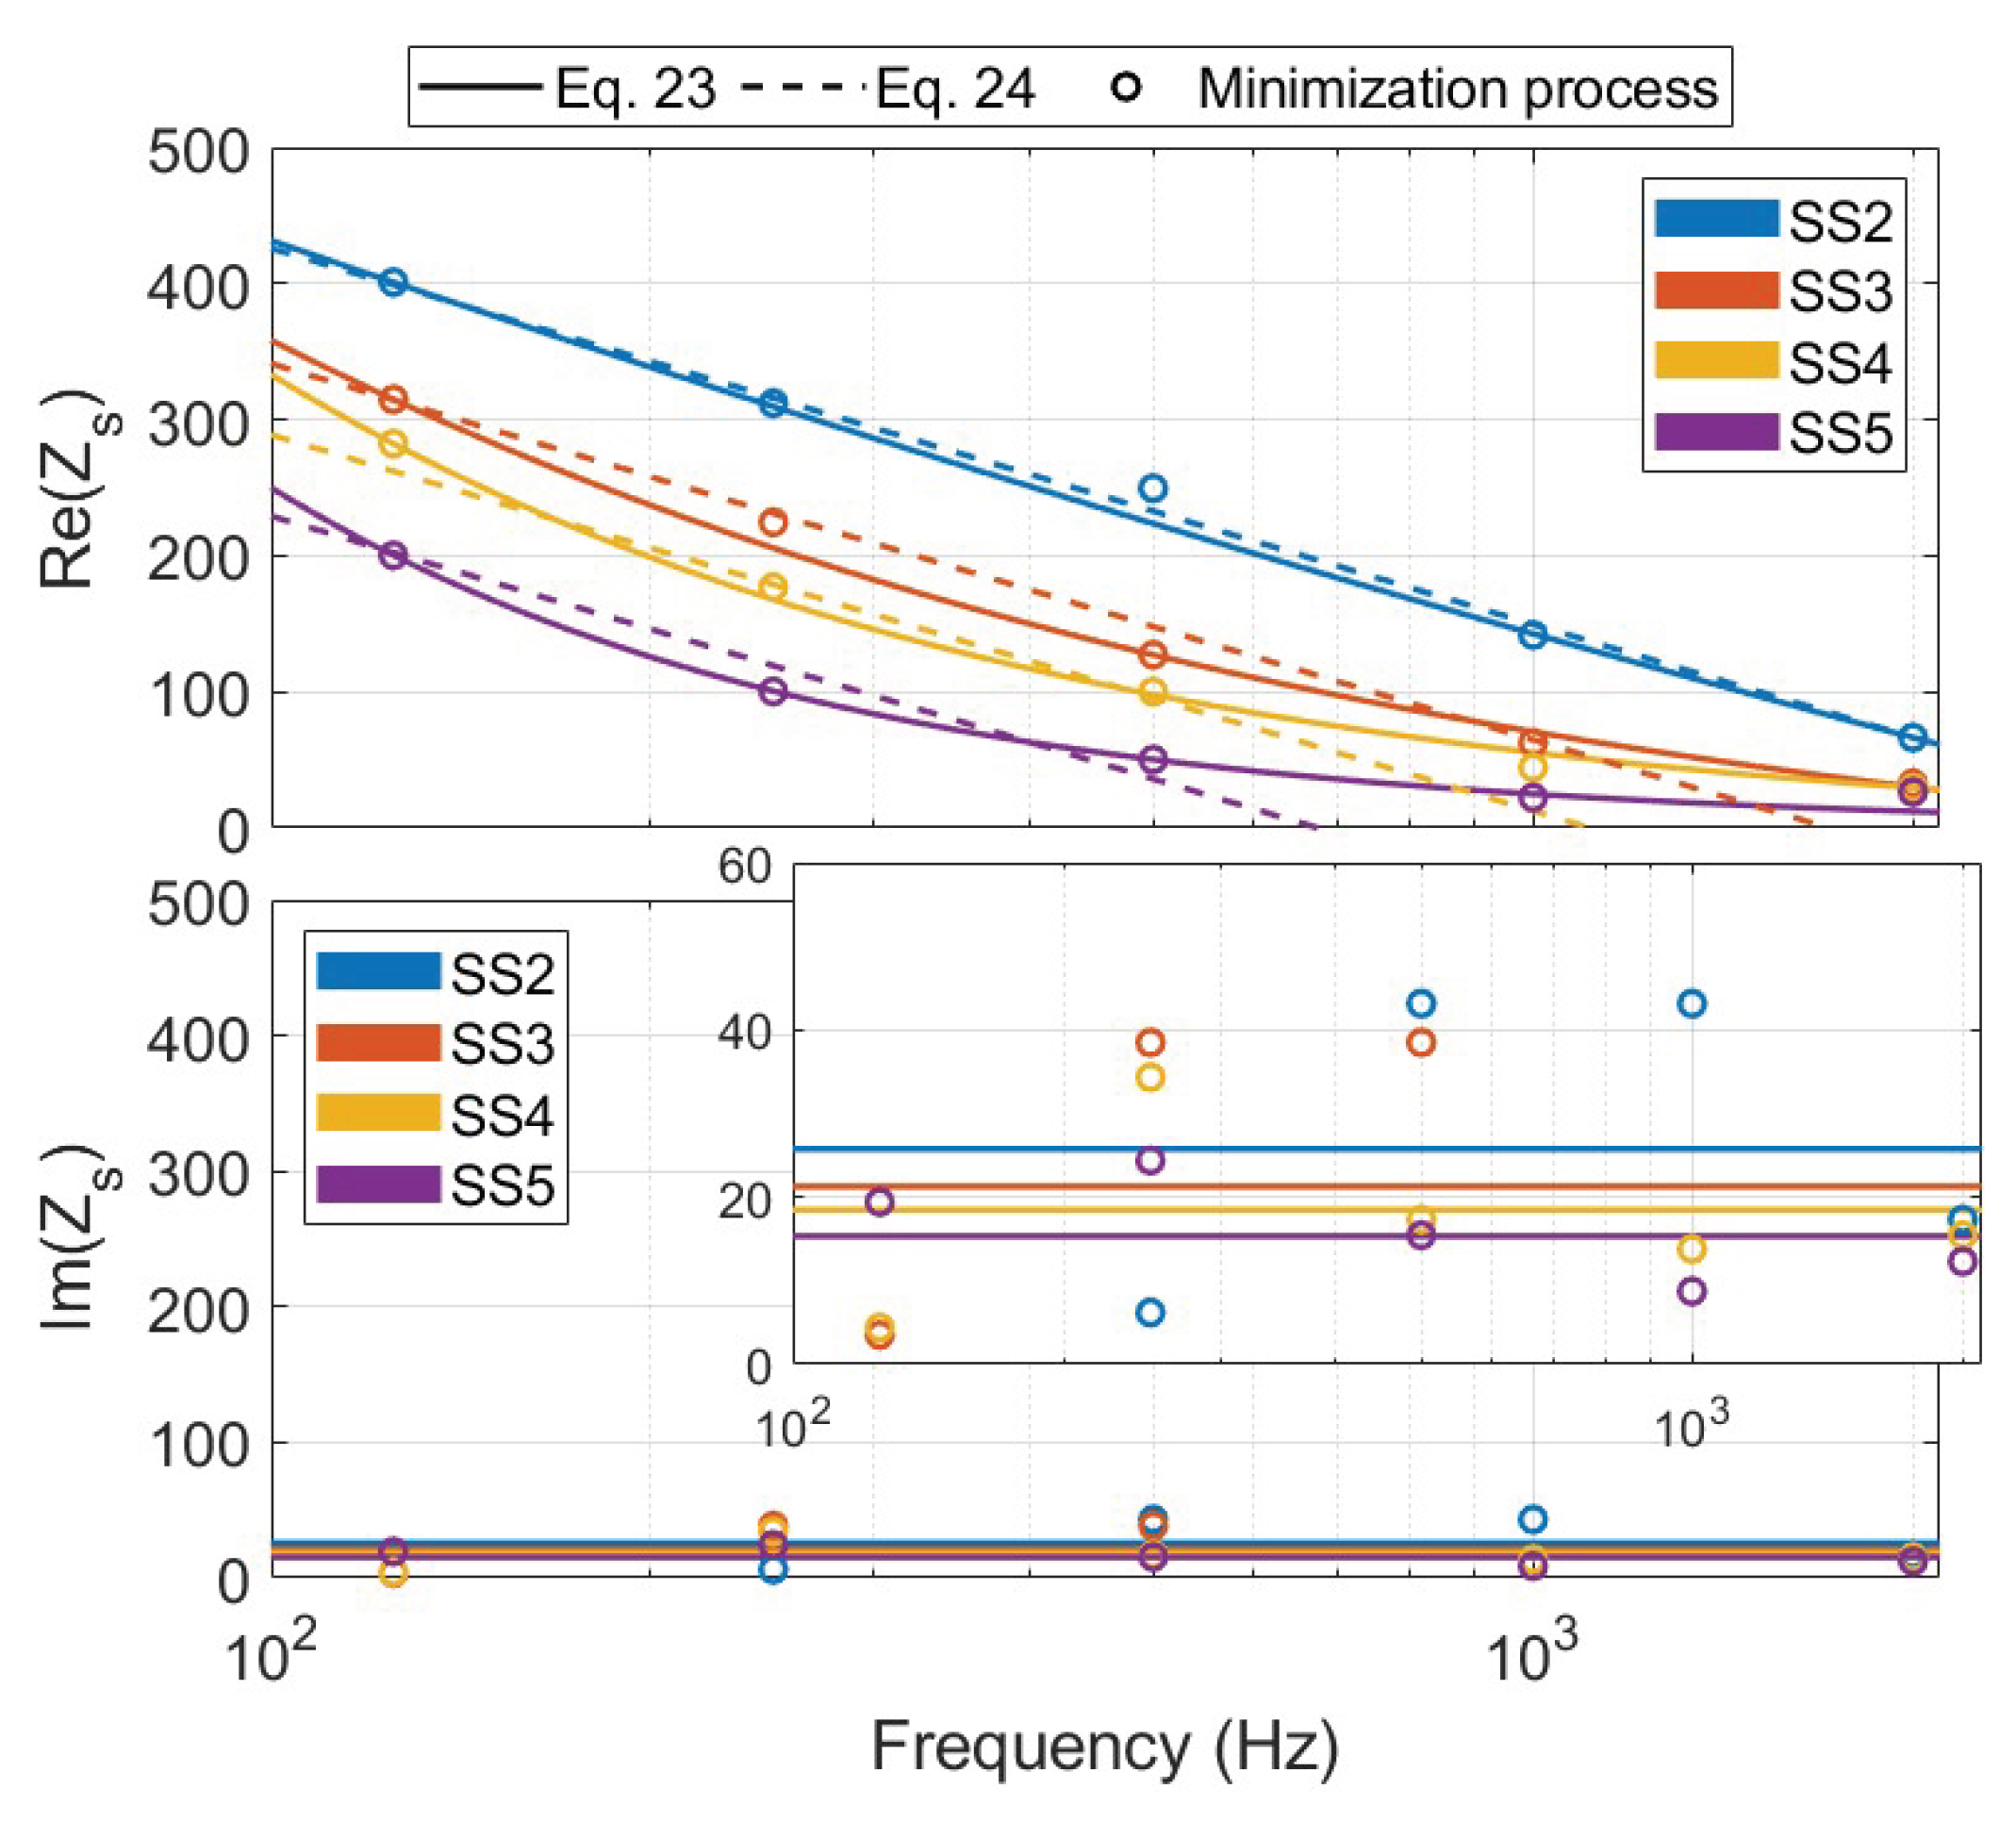
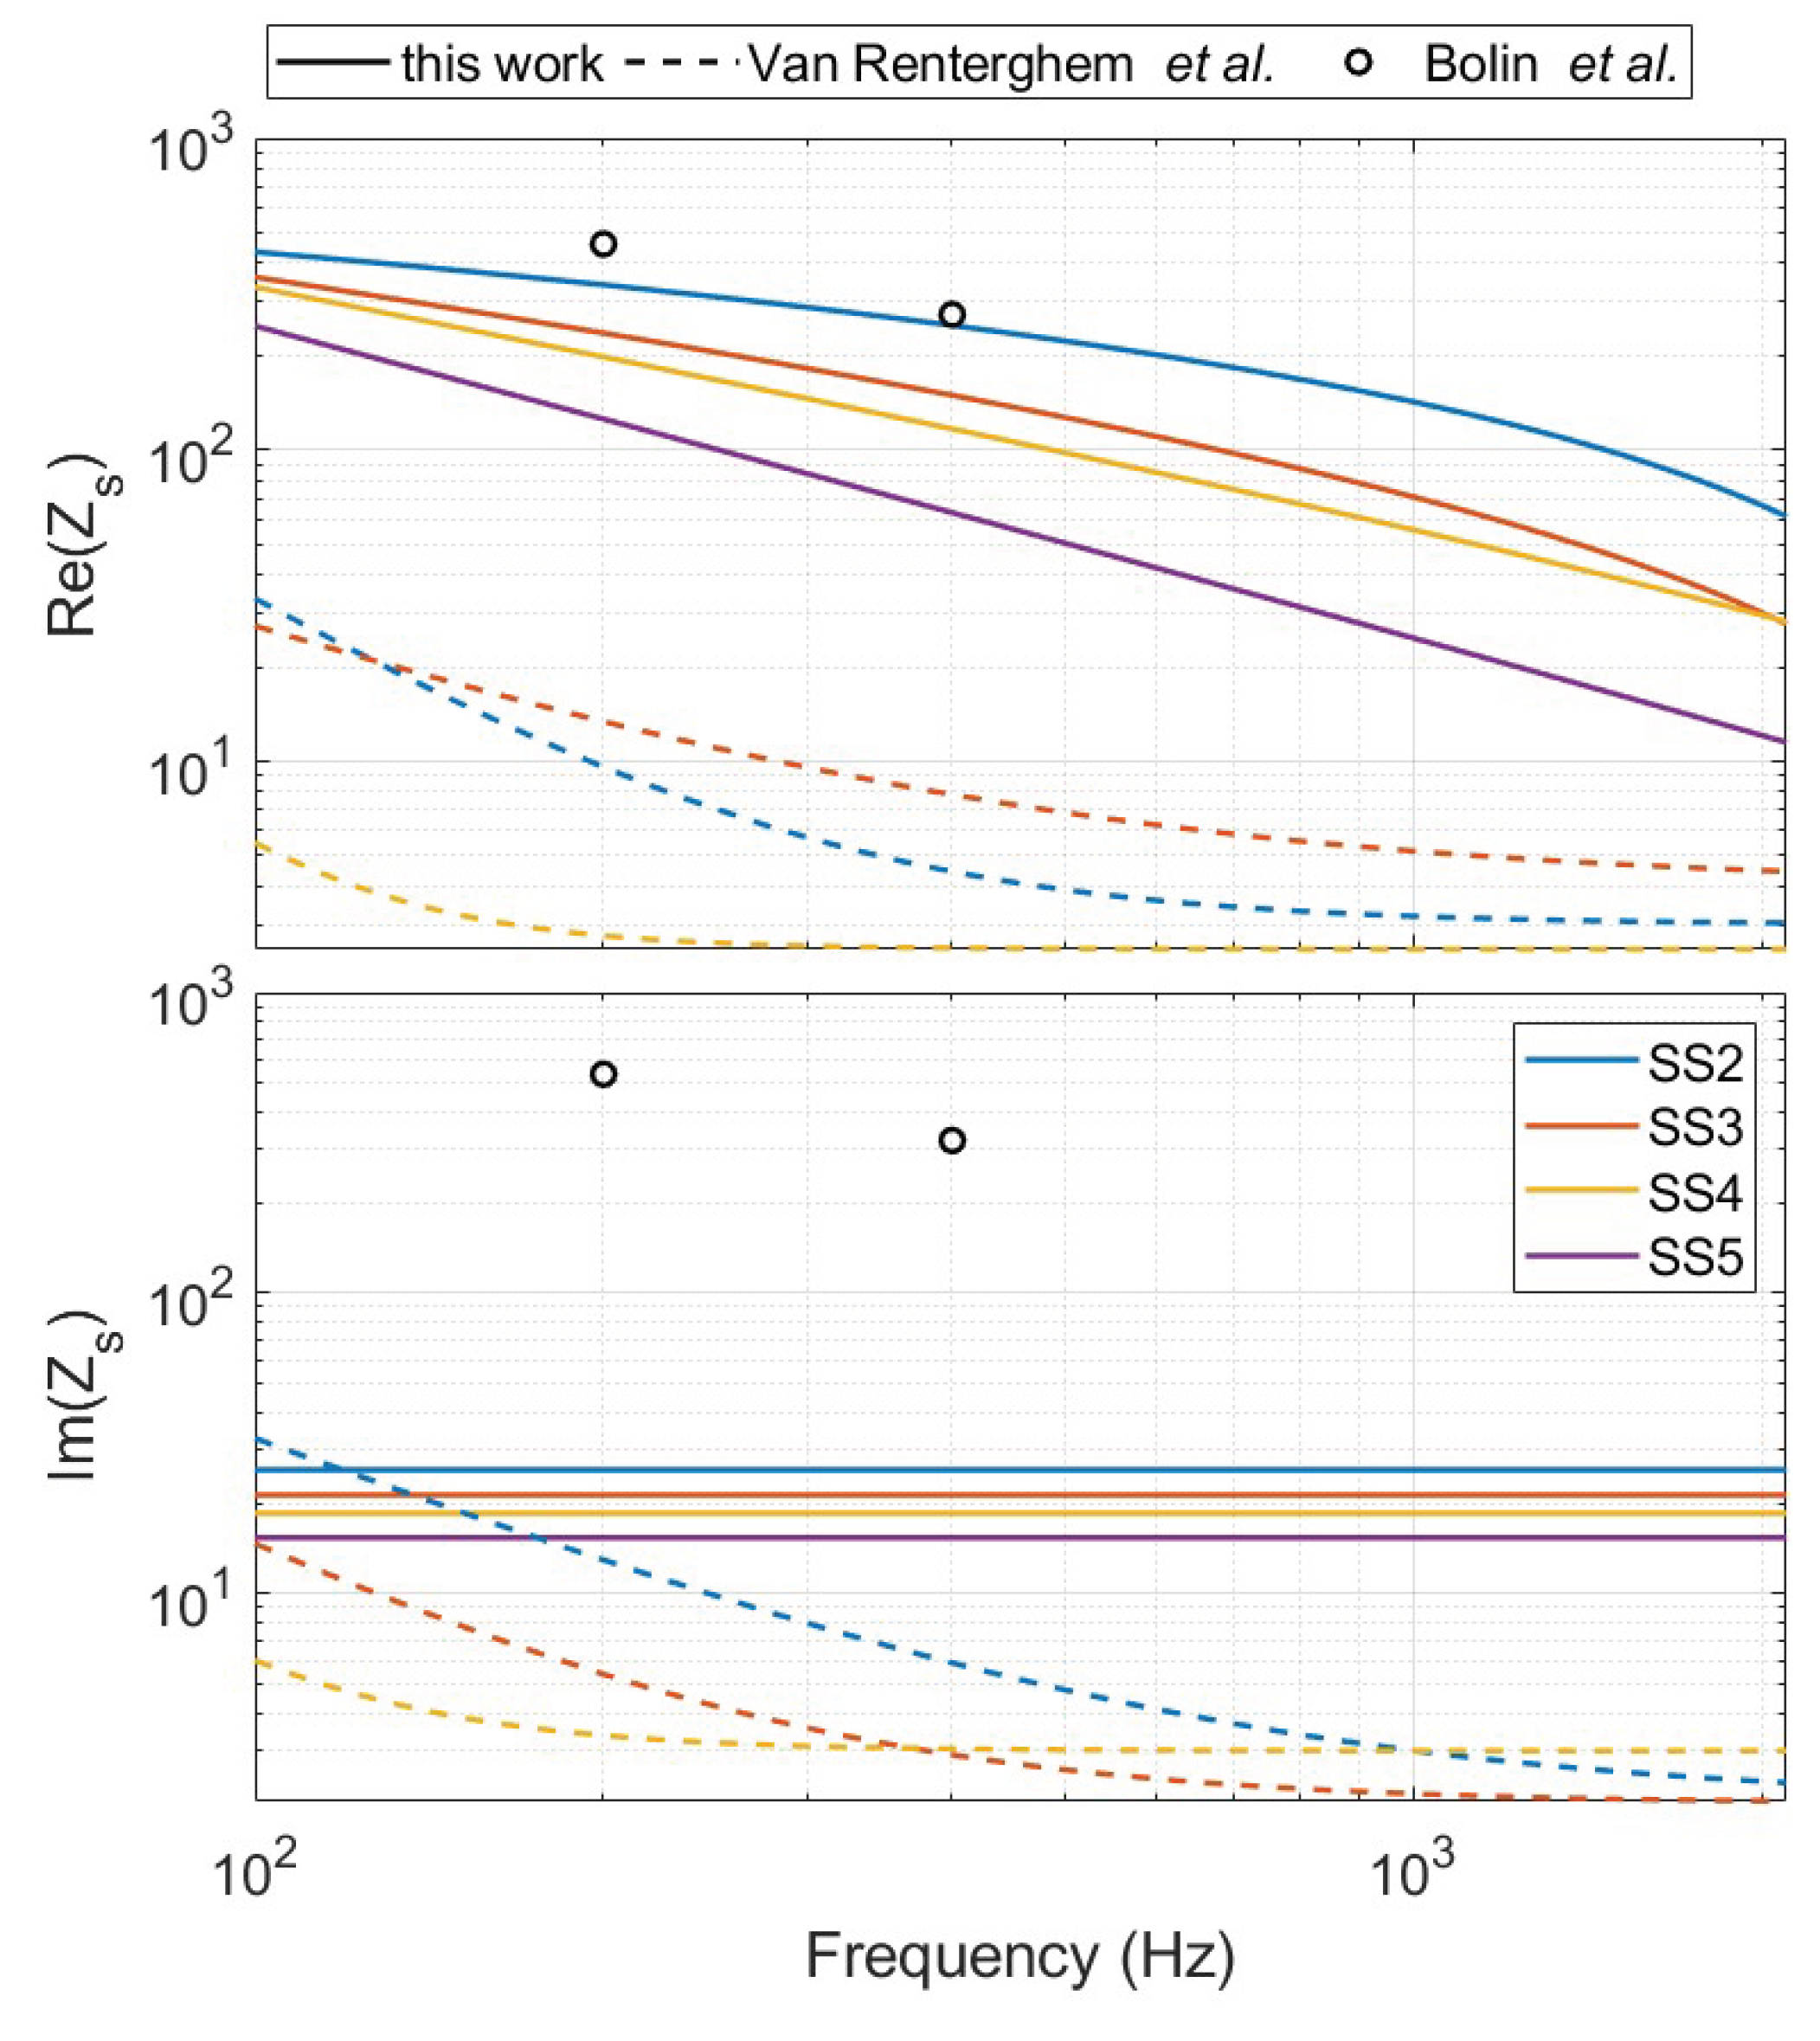
6.2. Limitations of the Effective Impedance Method for Rough Sea Surfaces
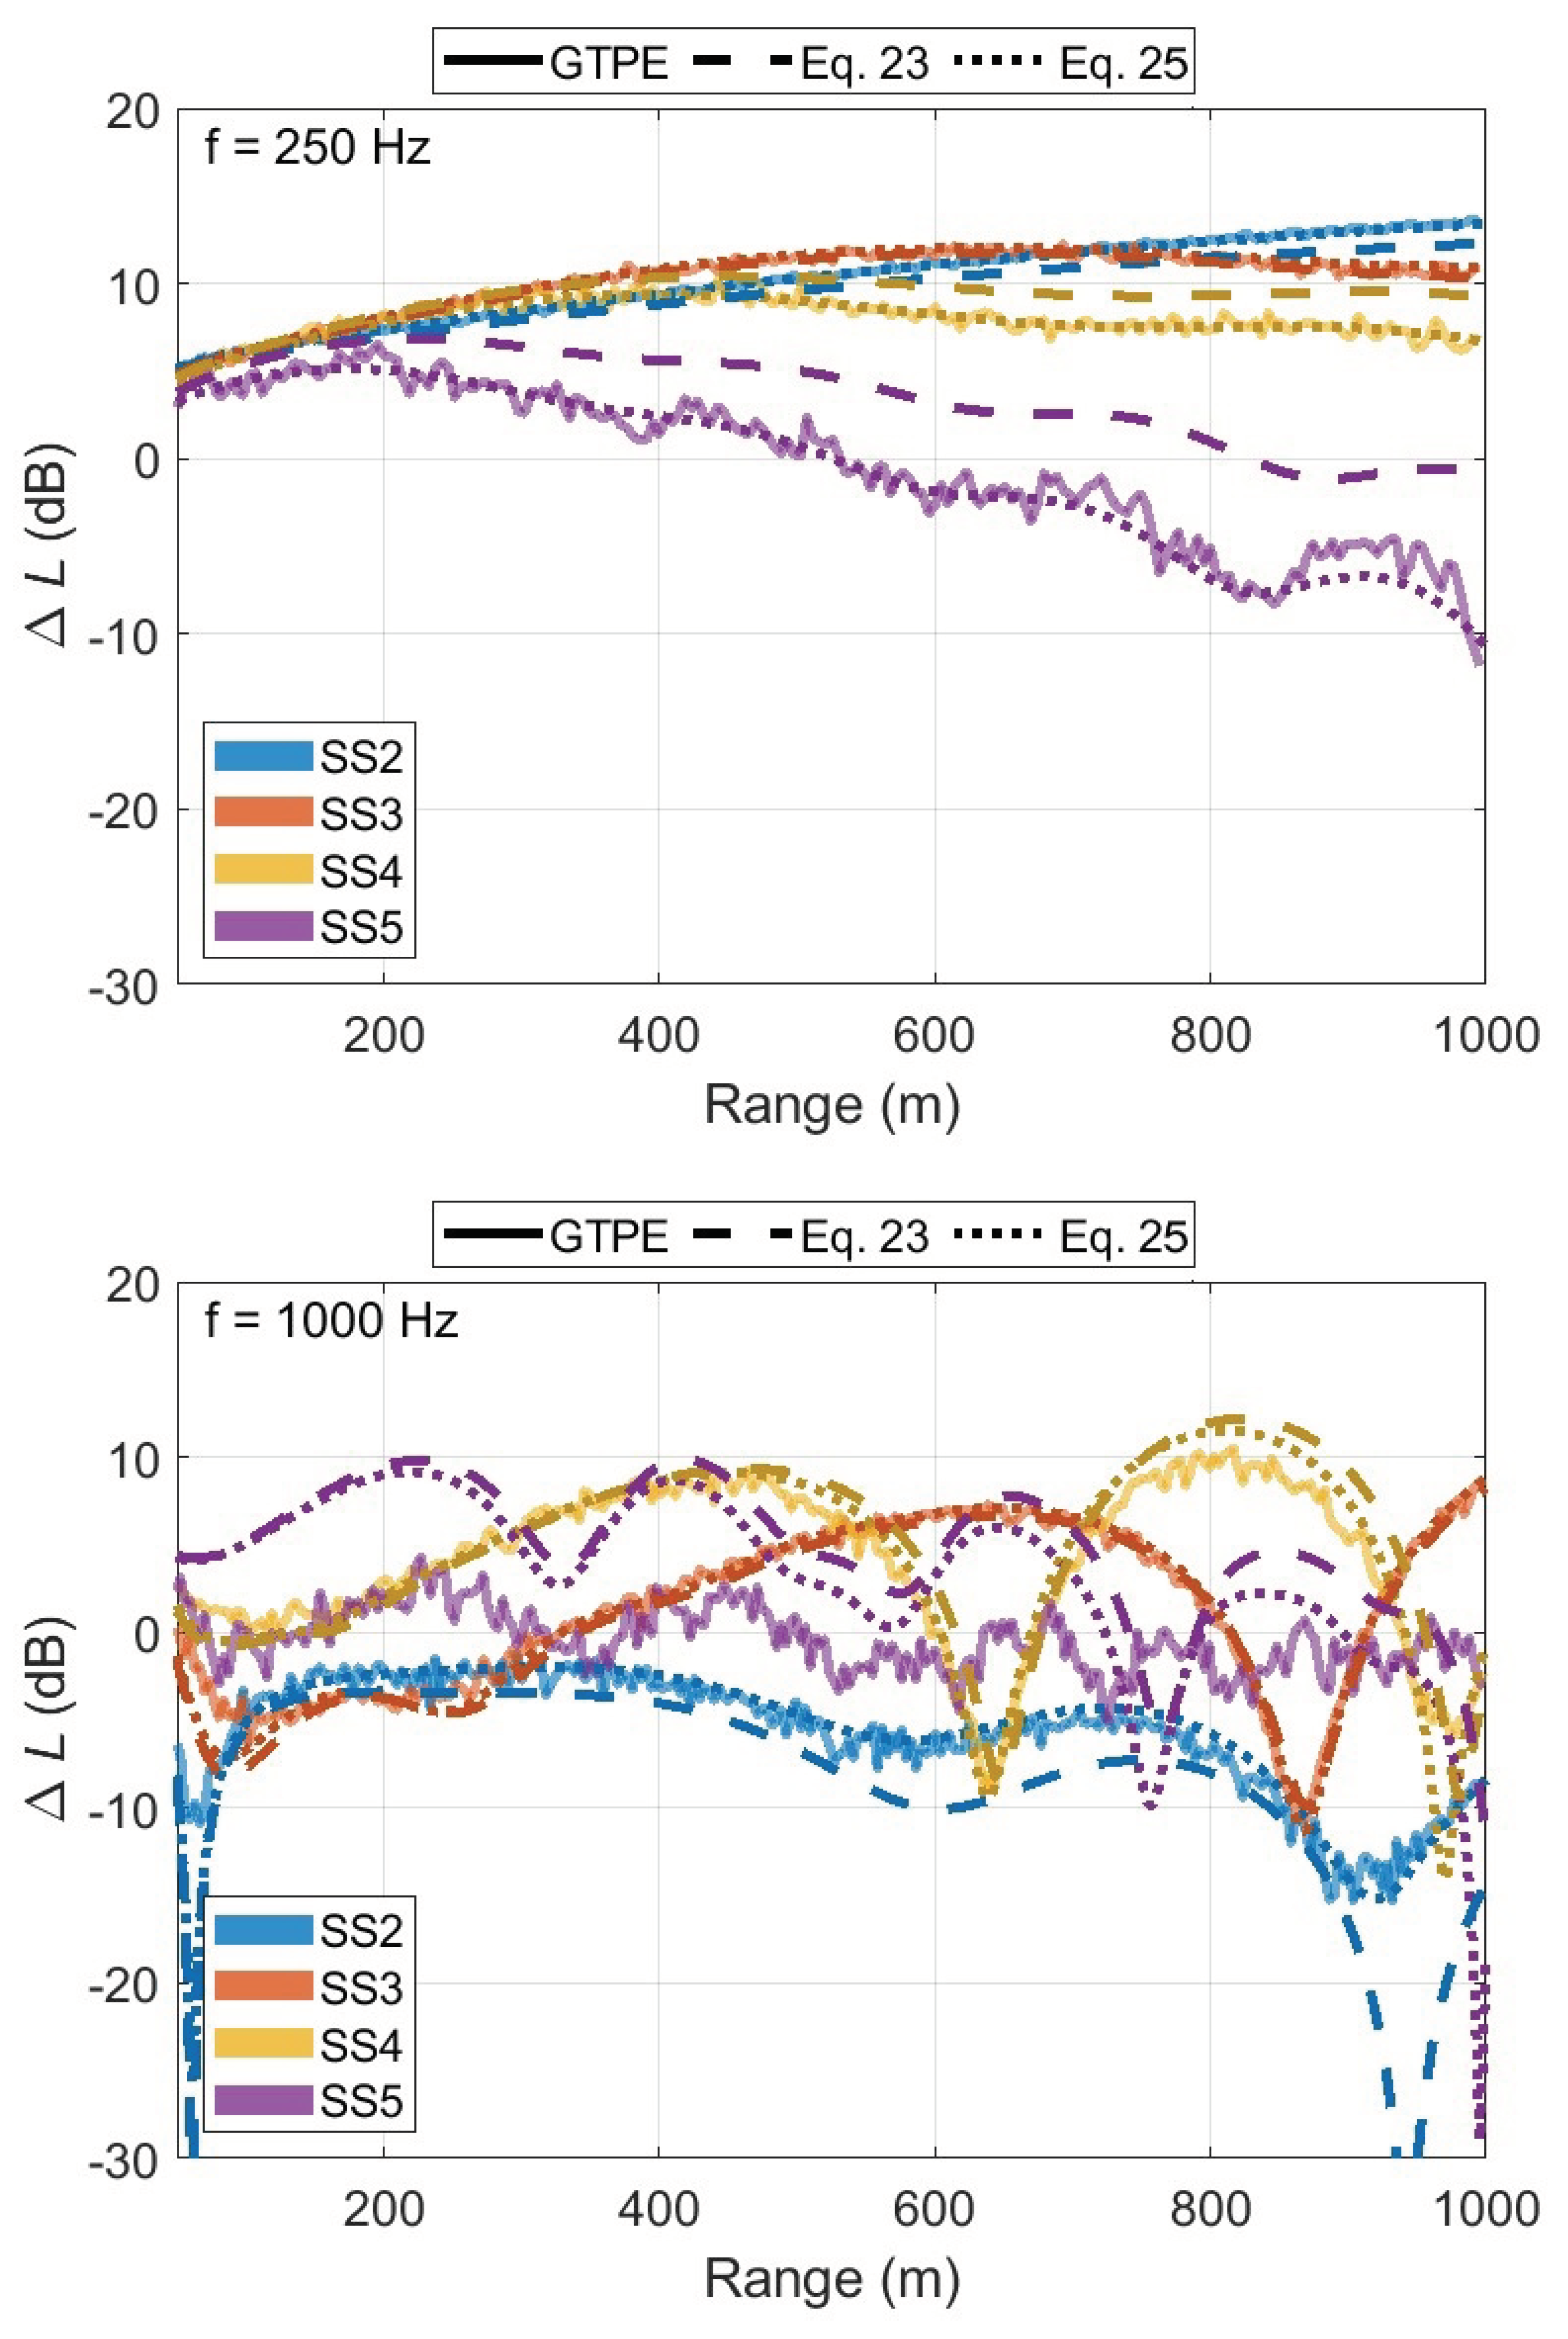
7. Conclusions
Author Contributions
Funding
Data Availability Statement
Acknowledgments
Conflicts of Interest
Abbreviations
| CNPE | Crank-Nicholson parabolic equation |
| ECKV | Elfouhaily, Chapron, Katsaros, Vandemark |
| FDTD | Finite difference time domain |
| GFPE | Green’s Function parabolic equation |
| MABL | Marine atmospheric boundary layer |
| MOST | Monin-Obukhov similarity theory |
| PE | Parabolic equation |
| PM | Pierson-Moskowitz |
References
- M. E. Swearingen, M. J. White, P. J. Guertin, D. G. Albert, and A. Tunick, “Influence of a forest edge on acoustical propagation: Experimental results,” The Journal of the Acoustical Society of America 133(5), 2566–2575. [CrossRef]
- S. Cheinet, M. Cosnefroy, F. Königstein, W. Rickert, M. Christoph, S. L. Collier, A. Dagallier, L. Ehrhardt, V. E. Ostashev, A. Stefanovic, T. Wessling, and D. K. Wilson, “An experimental study of the atmospheric-driven variability of impulse sounds,” The Journal of the Acoustical Society of America 144(2), 822–840. [CrossRef]
- V. E. Ostashev, D. K. Wilson, and M. B. Muhlestein, “Wave and extra-wide-angle parabolic equations for sound propagation in a moving atmosphere,” The Journal of the Acoustical Society of America 147(6), 3969–3984. [CrossRef]
- A. Guibard, F. Sèbe, D. Dragna, and S. Ollivier, “Influence of meteorological conditions and topography on the active space of mountain birds assessed by a wave-based sound propagation model,” The Journal of the Acoustical Society of America 151(6), 3703–3718. [CrossRef]
- A. Vecchiotti, T. J. Ryan, F. A. Cobb, J. F. Vignola, and D. Turo, “Investigation of engineering models for sound propagation in a near-shore environment,” Applied Acoustics 199, 108991. [CrossRef]
- K. Bolin, M. Boué, and I. Karasalo, “Long range sound propagation over a sea surface,” The Journal of the Acoustical Society of America 126(5), 2191–2197 (2009). [CrossRef]
- K. Bolin, M. Almgren, E. Ohlsson, and I. Karasalo, “Long term estimations of low frequency noise levels over water from an off-shore wind farm,” 135(3), 1106–1114, publisher: Acoustical Society of America. [CrossRef]
- T. Van Renterghem, D. Botteldooren, and L. Dekoninck, “Airborne sound propagation over sea during offshore wind farm piling,” The Journal of the Acoustical Society of America 135(2), 599–609 (2014). [CrossRef]
- K. Konishi and Z. Maekawa, “Interpretation of long term data measured continuously on long range sound propagation over sea surfaces,” Applied Acoustics 62(10), 1183–1210 (2001). [CrossRef]
- E. M. Salomons, Computational Atmospheric Acoustics, 1st edition ed. (Springer, 2001).
- V. Ostashev and D. Wilson, Acoustics in Moving Inhomogeneous Media (Taylor & Francis, 2015).
- K. E. Gilbert and M. J. White, “Application of the parabolic equation to sound propagation in a refracting atmosphere,” The Journal of the Acoustical Society of America 85(2), 630–637 (1989). [CrossRef]
- K. E. Gilbert and X. Di, “A fast Green’s function method for one-way sound propagation in the atmosphere,” The Journal of the Acoustical Society of America 94(4), 2343–2352 (1993). [CrossRef]
- A. Beilis and F. D. Tappert, “Coupled Mode Analysis of Multiple Rough Surface Scattering,” The Journal of the Acoustical Society of America 66(3), 811–26 (1979). [CrossRef]
- S. Parakkal, K. E. Gilbert and X. Di, “Application of the Beilis–Tappert Parabolic Equation Method to Sound Propagation over Irregular Terrain,” The Journal of the Acoustical Society of America 131(2), 1039-1046 (2012). [CrossRef]
- R. A. Sack and M. West, “A parabolic equation for sound propagation in two dimensions over any smooth terrain profile: The generalised terrain parabolic equation (GT-PE),” Applied Acoustics 45(2), 113–129. [CrossRef]
- A. D. Jones, A. Duncan, A. Maggi, D. Bartel, and A. Zinoviev, “A detailed comparison between a small-slope model of acoustical scattering from a rough sea surface and stochastic modeling of the coherent surface loss,” IEEE Journal of Oceanic Engineering (2016). [CrossRef]
- M. Delany and E. Bazley, “Acoustical properties of fibrous absorbent materials,” Applied Acoustics 3(2), 105–116 (1970). [CrossRef]
- P. Boulanger and K. Attenborough, “Effective impedance spectra for predicting rough sea effects on atmospheric impulsive sounds,” The Journal of the Acoustical Society of America 117(2), 751–762 (2005). [CrossRef]
- W. J. Pierson and L. Moskowitz, “A proposed spectral form for fully developed wind seas based on the similarity theory of S. A. Kitaigorodskii,” Journal of Geophysical Research 69(24), 5181–5190 (1964). [CrossRef]
- D. E. Hasselmann, M. Dunckel, and J. A. Ewing, “Directional wave spectra observed during JONSWAP 1973,” Journal of Physical Oceanography 10(8), 1264–1280. [CrossRef]
- T. Elfouhaily, B. Chapron, K. Katsaros, and D. Vandemark, “A Unified Directional Spectrum for Long and Short Wind-Driven Waves,” Journal of Geophysical Research 102 (1997). [CrossRef]
- E. I. Thorsos, “Acoustic scattering from a Pierson–Moskowitz sea surface,” The Journal of the Acoustical Society of America 88(1), 335–349.
- J. H. G. M. Alves, M. L. Banner, and I. R. Young, “Revisiting the Pierson–Moskowitz asymptotic limits for fully developed wind waves,” Journal of Physical Oceanography 33(7), 1301–1323. [CrossRef]
- O. M. Phillips, The Dynamics of the Upper Ocean, 2nd edition ed. (Cambridge University Press).
- J. Wu, “Wind-stress coefficients over sea surface near neutral conditions—a revisit,” Journal of Physical Oceanography 10(5), 727–740. [CrossRef]
- C. D. Mobley, E. Boss, and C. Roesler, Ocean Optics Web Book, https://www.oceanopticsbook.info/.
- S. Kay, J. Hedley, S. Lavender, and A. Nimmo-Smith, “Light transfer at the ocean surface modeled using high resolution sea surface realizations,” Optics Express 19(7), 6493–6504. [CrossRef]
- N. D. P. Barltrop and A. J. Adams, Dynamics of Fixed Marine Structures (Third Edition) (Butterworth-Heinemann), pp. 249–344.
- T. Foken, “50 years of the Monin–Obukhov similarity theory,” Boundary-Layer Meteorology 119(3), 431–447. [CrossRef]
- J. R. Garratt, The Atmospheric Boundary Layer (Cambridge University Press).
- A. L’Espérance, J. Nicolas, D. K. Wilson, D. W. Thomson, Y. Gabillet, and G. Daigle, “Sound propagation in the atmospheric surface layer: Comparison of experiment with FFP predictions,” Applied Acoustics 40(4), 325–346. [CrossRef]
- K. Attenborough, K. M. Li, and K. V. Horoshenkov, Predicting Outdoor Sound (Taylor & Francis).
- T. Rossing, Springer Handbook of Acoustics (Springer Sciences+Business, New York, 2007).
- J. B. Edson and C. W. Fairall, “Similarity relationships in the marine atmospheric surface layer for terms in the TKE and scalar variance budgets,” Journal of the Atmospheric Sciences 55(13), 2311–2328. [CrossRef]
- C. L. Archer, B. A. Colle, D. L. Veron, F. Veron, and M. J. Sienkiewicz, “On the predominance of unstable atmospheric conditions in the marine boundary layer offshore of the u.s. northeastern coast,” Journal of Geophysical Research: Atmospheres 121(15), 8869–8885. [CrossRef]
- H. Charnock, “Wind stress on a water surface,” Quarterly Journal of the Royal Meteorological Society 81(350), 639–640 (1955). [CrossRef]
- J. R. Garratt, “Review of drag coefficients over oceans and continents,” Monthly Weather Review 105(7), 915–929. [CrossRef]
- A. J. Dyer, “A review of flux-profile relationships,” Boundary-Layer Meteorology 7(3), 363–372. [CrossRef]
- C. A. Paulson, “The mathematical representation of wind speed and temperature profiles in the unstable atmospheric surface layer,” Journal of Applied Meteorology and Climatology 9(6), 857–861. [CrossRef]
- Jason Brent Roberts, C. A. Clayson, and F. R. Robertson, “SeaFlux data products,” http://dx.doi.org/10.5067/SEAFLUX/DATA101, doi: 10.5067/SEAFLUX/DATA101, type: dataset. Dataset available online from the NASA Global Hydrology Resource Center DAAC, Huntsville, Alabama, U.S.A.
- H. E. Bass, L. C. Sutherland, A. J. Zuckerwar, D. T. Blackstock, and D. M. Hester, “Atmospheric absorption of sound: Further developments,” The Journal of the Acoustical Society of America 97(1), 680–683 (1995).
- R. Kirby, “On the modification of Delany and Bazley fomulae,” Applied Acoustics 86, 47–49. [CrossRef]
- D. Dragna, K. Attenborough, and P. Blanc-Benon, “On the inadvisability of using single parameter impedance models for representing the acoustical properties of ground surfaces,” The Journal of the Acoustical Society of America 138(4), 2399–2413. [CrossRef]

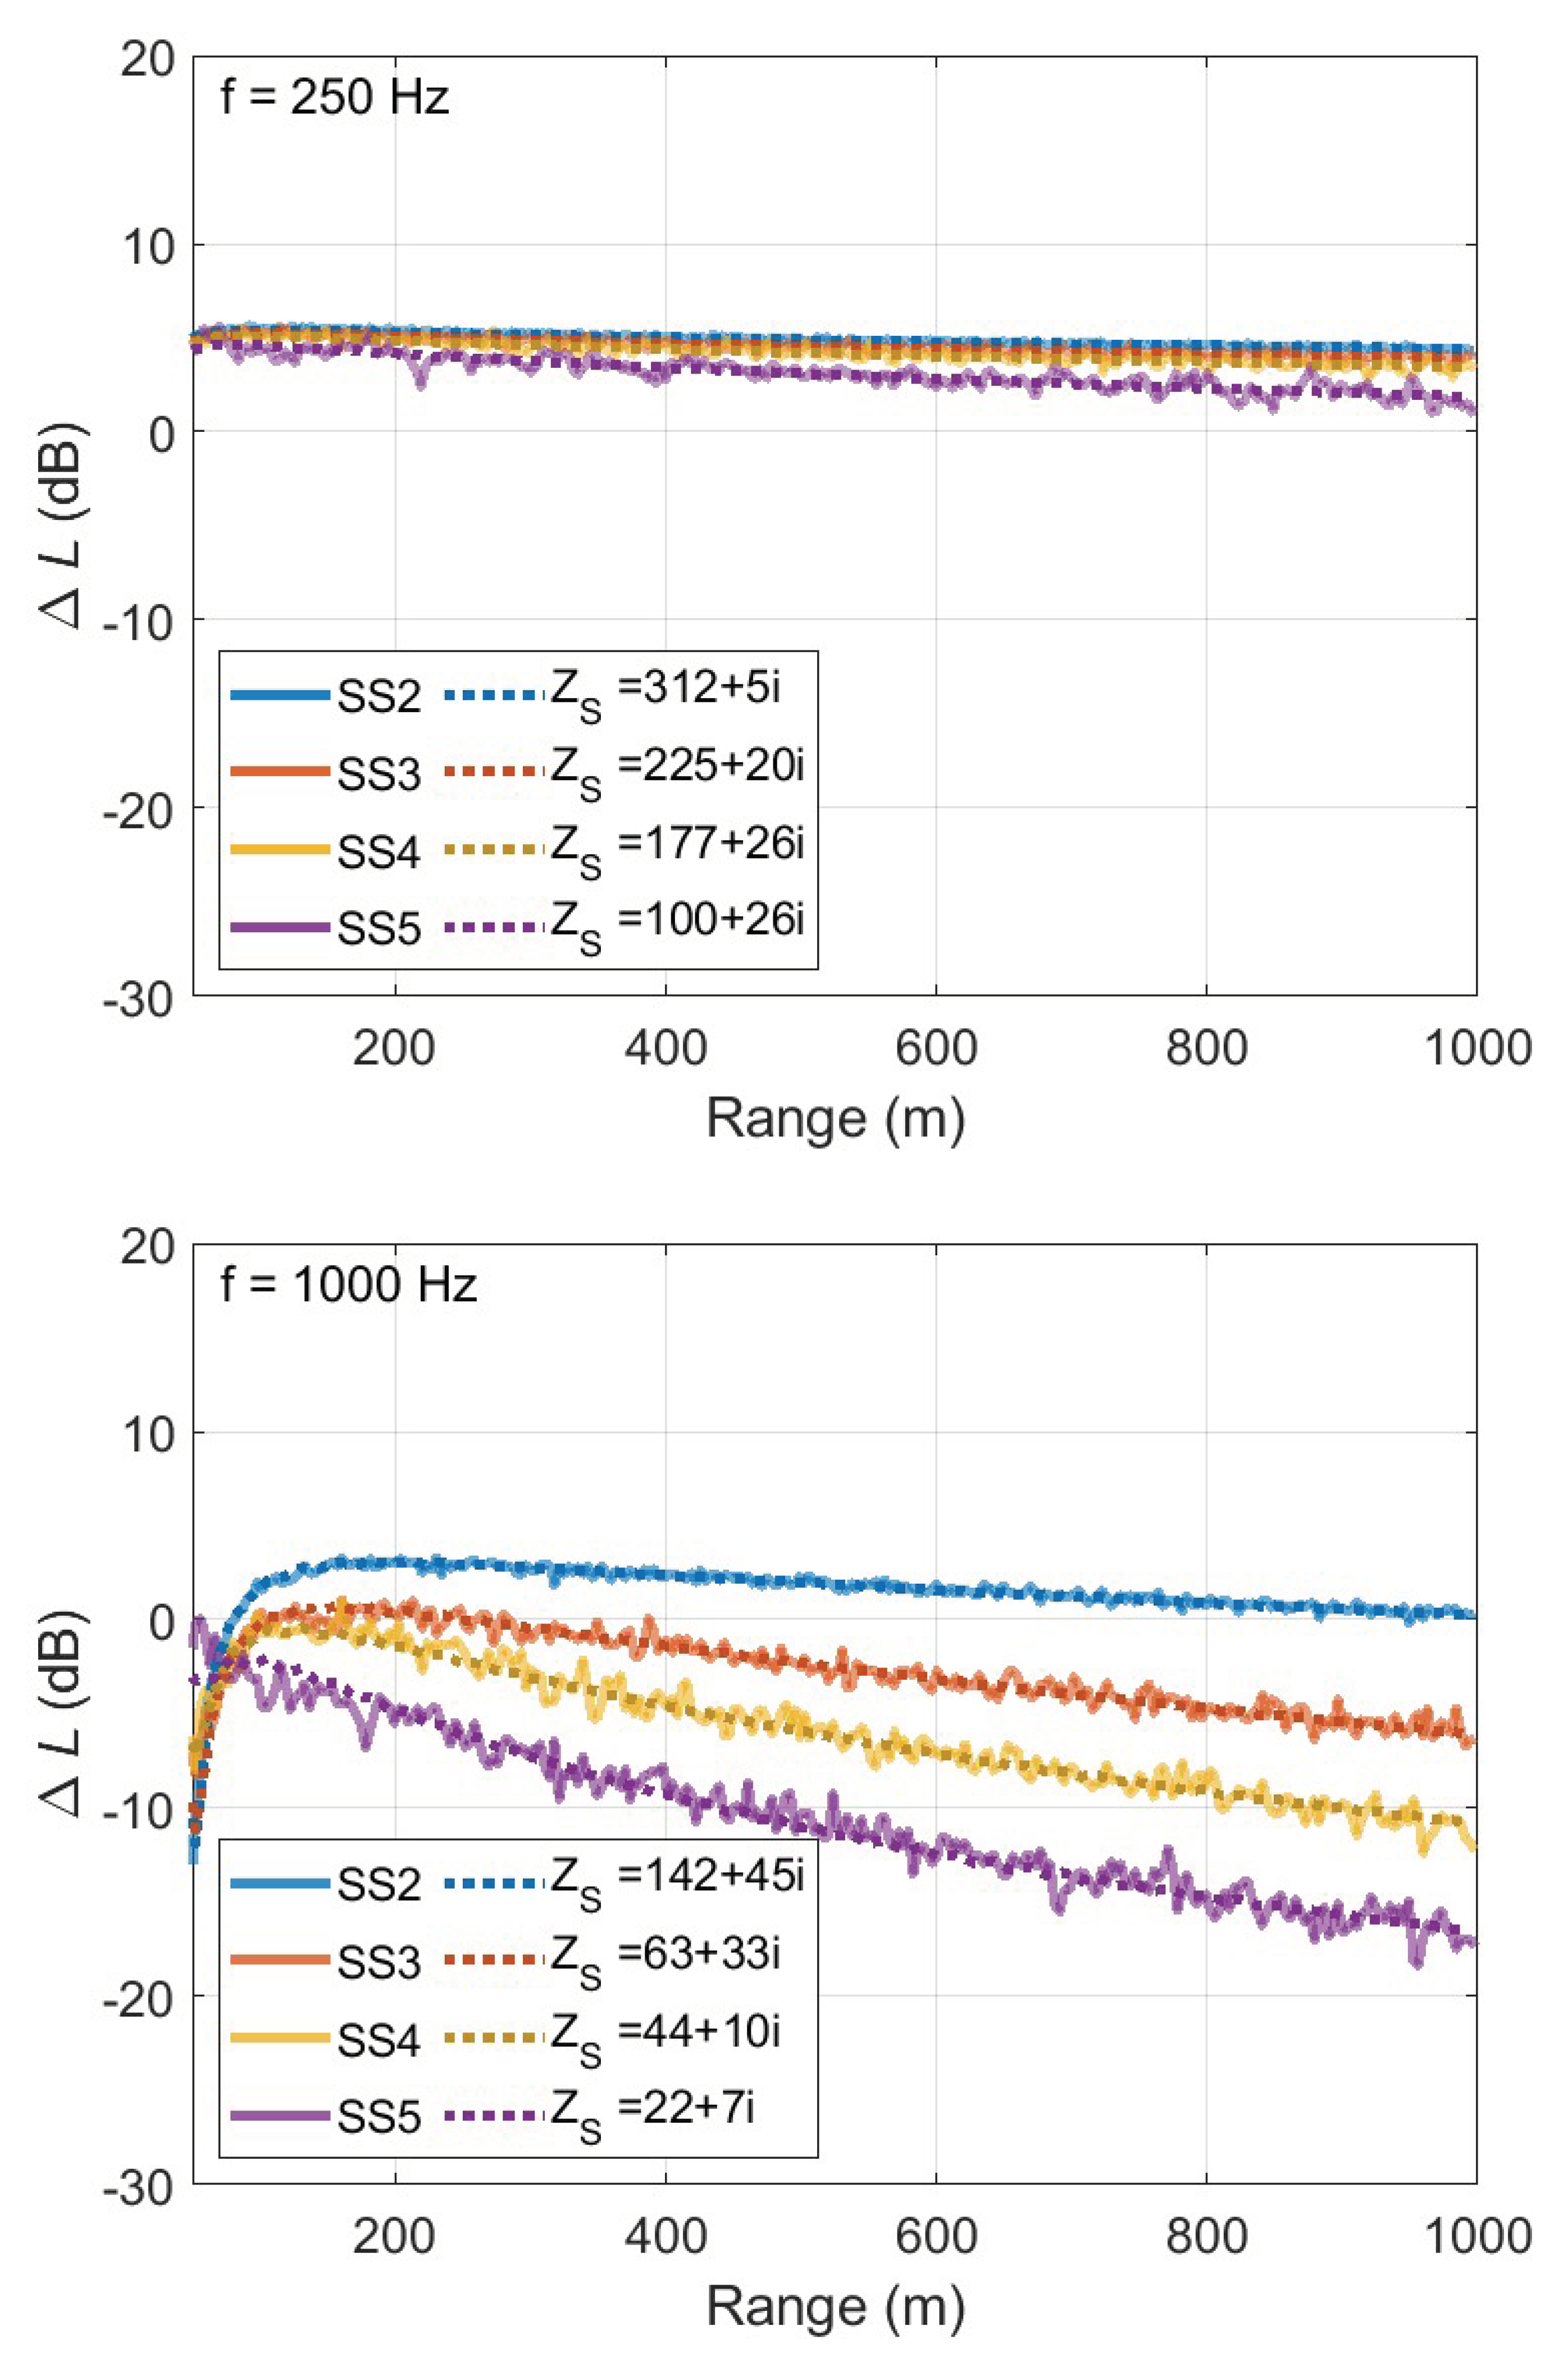
| parameter | sea state 2 | sea state 3 | sea state 4 | sea state 5 |
|---|---|---|---|---|
| 2381 | 3856 | 9244 | 23728 | |
| 1166 | 74 | 11 | 0.85 |
Disclaimer/Publisher’s Note: The statements, opinions and data contained in all publications are solely those of the individual author(s) and contributor(s) and not of MDPI and/or the editor(s). MDPI and/or the editor(s) disclaim responsibility for any injury to people or property resulting from any ideas, methods, instructions or products referred to in the content. |
© 2024 by the authors. Licensee MDPI, Basel, Switzerland. This article is an open access article distributed under the terms and conditions of the Creative Commons Attribution (CC BY) license (http://creativecommons.org/licenses/by/4.0/).


