1. Introduction
Apis mellifera, the Western honey bee, plays a pivotal role as a pollinator of several crops for which it increases yield and quality [
1,
2,
3]. Recently, a combination of factors, including nutrition, queen quality, pests, and pathogens, was believed to have caused significant yearly losses of managed honey bee colonies [
4,
5,
6].
Nosema disease, or nosemosis, is a honey bee disease caused by three species of microsporidia:
Nosema apis,
N. ceranae, and
N. neumanni [
7,
8,
9]. Microsporidia are related to fungi based on phylogenetic analysis [
10,
11,
12]. [There has been a recent proposal to reclassify
Nosema spp. to
Vairimorpha spp. [
13]. We continue the use of '
Nosema spp.' in this study until the genus name is resolved].
Nosema ceranae is a strain distributed in honey bee populations globally [
14]. The disease transmission pathways include trophallaxis, fecal-oral, oral-oral, and sexual routes [
8,
15,
16].
Nosema spp. can infect all castes of honey bees (drones, queens, and workers) and honey bee larvae [
17,
18,
19,
20].
Nosema spp. attack and reproduce in cells that compose the epithelial lining of the midgut, an area where enzymes are produced for the digestion of pollen, nectar, and other foodstuffs [
8,
16,
21,
22,
23,
24]. Ingested
Nosema spp. spores germinate in the midgut. During this process, the polar filament is activated, penetrating the epithelial cells to release the sporoplasm [
25,
26]. The sporoplasms develop into meronts that multiply (by cell division) into sporonts, sporoblasts, and mature spores by utilizing the host cell contents as a food supply. This reduces the midgut cells' efficiency in food digestion and nutrient absorption [
25]. Following this, the mature spores are released into the lumen of the host digestive tract, where they can infect neighboring epithelial cells and reproduce, contributing to their high pathogenicity [
8]. Finally,
Nosema-infected bees can develop dysentery and die, leading to declining bee populations that affect pollination services and the beekeeping industry [
8,
27,
28,
29].
Propolis is a natural resinous mixture produced by honey bees via the mixing of glandular secretions (saliva and wax) with plant resins (substances collected from parts of plants, buds, and exudates) [
30,
31]. It comprises 50-70% resins, 10% essential oils, 30-50% wax, and 5-10% pollen [
32]. Honey bees use propolis to seal openings and cracks in the nest, smooth internal walls, and reduce the nest entrance to prevent invading enemies [
33,
34]. Propolis also has potent antioxidant, anti-inflammatory, anticancer, antifungal, and antibacterial activities [
35,
36,
37,
38,
39,
40,
41]. The chemical constituents of propolis vary depending on the honey bee species creating it and the plant source from which they collected the resins [
42]. The primary chemical constituents include flavonoids, phenolics, and aromatic compounds [
43].
Recent reports showed that 50% ethanolic extracted of propolis (v/v) collected from stingless bee,
Tetrigona apicalis, nests can reduce the mortality, spore loads, and infection ratio (% infected cells per non-infected cells) and increase the protein contents of hypopharyngeal glands and trehalose levels in the hemolymph of
N. ceranae infected
A. cerana,
A. dorsata,
A. florea, and
A. mellifera workers compared to the same parameters of untreated bees [
24,
27,
28,
44,
45,
46]. Moreover, 50% ethanolic extracts of propolis (v/v) collected from
A. mellifera hives can reduce the mortality/spore loads and increase the protein contents of hypopharyngeal glands and in the hemolymph of
N. ceranae infected
A. mellifera workers compared to the exact parameters of untreated bees [
44,
45,
47]. These authors all tested 50% ethanolic extracts of propolis. It is possible, however, that a different extract level will prove to be more efficacious as a
Nosema spp. control.
This study aimed to determine the propolis concentration that optimizes the control of N. ceranae infection in honey bee workers. We determined propolis efficacy by calculating the survival rate, infection rate (number of infected bees per non-infected bees for a hundred bees), and infectivity (number of N. ceranae spores per bee) of N. ceranae treated bees.
2. Materials and Methods
2.1. Honey Bees
Frames containing sealed brood were collected from three
A. mellifera colonies maintained according to management practices standard for the region (fed and requeened when necessary, pest/pathogens controlled, etc.). The colonies were kept at the Honey Bee Research and Extension Laboratory (H.B.R.E.L.) research apiary, Entomology and Nematology Department, University of Florida, Gainesville, Florida, U.S.A. The brood frames were collected and kept in an incubator (BINDER, BD 400, Germany) at 34 ± 2°C and 50 – 55% relative humidity (RH) for 24–48 hrs to allow adult worker honey bees to emerge from the combs for use in the experiments. The source colonies were confirmed
N. ceranae free following the procedure of Fries et al. (2013)[
48]. Briefly, we dissected midguts from 50 adult worker honey bees from each colony, pooled the midguts by colony, and homogenized them. Then, we checked for the presence of
N. ceranae spores using a light microscope (Z.E.I.S.S., A.X.I.O. Lab.A1, Germany). We repeated this procedure on ten newly emerged bees to confirm the absence of
N. ceranae spores.
2.2. Preparing Ethanolic-Extracted Propolis
Propolis was collected from ten colonies of
A. mellifera in an apiary located at the UF H.B.R.E.L. It was dried in an oven (Fisher Scientific, 650D, U.S.A.) at 80 °C for 72 hrs, and then 60 g of dried propolis was extracted in 100 mL of 70% ethanol for three days [
45,
46]. The resulting solution was gravity-filtered using a Whatman no. 4 filter paper. The liquid extract (100% ethanolic-extracted propolis: the stock solution) was stored in a dark bottle at room temperature. The stock solution was diluted with distilled water to make 25%, 50%, and 75% concentrations (v/v) that were used in the following experiment as ethanolic extracted propolis treatments.
2.3. Nosema Ceranae Spore Preparation
Nosema ceranae spores were extracted from
A. mellifera workers collected from
N. ceranae infected colonies in an apiary located at the UF H.B.R.E.L. The spores were propagated in adult
A. mellifera workers following the procedure described by Naree et al. (2021) [
45]. Briefly, fifty worker bees were group fed with
N. ceranae spores in sugar water (w/v) at a dosage of 5 × 10
7 spores per cage (polystyrene cage size; h = 10 cm, r = 4 cm). The cages were maintained at 34 ± 2 °C and 50 – 55% RH for 14 d to increase the number of
N. ceranae spores available for the experimental infection. Following this, the midguts of the
N. ceranae infected bees were removed and transferred to 1.5 mL microcentrifuge tubes containing 100 µL of distilled water. Afterward, the midguts were homogenized and centrifuged at 6,000 g for 10 mins [
45,
46]. The supernatant was discarded, and the white sediment was collected into the new microcentrifuge tubes to resuspend with distilled water. Following this, the number of
N. ceranae spores was counted under a light microscope (Z.E.I.S.S., A.X.I.O. Lab.A1, Germany) using a hemocytometer (Neubauer, U.S.A.) following the procedure described by Cantwell, 1970 [
49]. Finally, the
N. ceranae spores were resuspended in 50% (w/v) sucrose solution at a concentration required to feed 10
5 spores per bee (5 × 10
4 spores per µL). The sucrose solution containing
N. ceranae spores was kept at room temperature until needed for inoculation the next day.
2.4. Ultrastructure of Nosema Ceranae Spores
The ultrastructure of
N. ceranae spores was studied following the procedure described by Suwannapong et al. (2011) [
19]. The midguts of
N. ceranae infected
A. mellifera workers (10 d post infection or d p.i.) were fixed in Karnovsky's fixative for three hours at 4°C. Then, the tissue was washed with washing buffer (pH 7.4) three times (ten minutes each) at 4°C. After that, they were post-fixed in 2% osmium tetroxide for one hour at 4°C and washed with washing buffer (pH 7.4) for ten minutes at 4°C. Next, the tissue was dehydrated in an alcohol series, 30%, 50%, 70%, 90%, and 100%, for ten minutes each percentage at 4°C. Then, it was agitated for 12 hrs in a mixture of propylene oxide and embedding media. The sample was embedded in capsules in an Epon 812-aradite mixture. Then, it was kept in an incubator (Memmert UN 55, Germany) for polymerization at 35°C for 24 hrs, 45°C for 48 hrs, and 65°C for 72 hrs, respectively. Following this, the tissue was semi-thin sectioned (1 µm) using an ultramicrotome (Leica, Leica Ultracut R, Germany) and stained with 1% toluidine blue in sodium borate solution to select target areas. Furthermore, the tissue was ultra-thin sectioned (90 nm) using an ultramicrotome (Leica, Leica Ultracut R, Germany) and floated in distilled water. Tissues were collected on 200 mesh grids, stained with uranyl acetate, and contrast-enhanced using lead citrate. The samples were examined by transmission electron microscope (Philips, Tecnai 20, U.S.A.).
2.5. Nosema Ceranae Inoculation and Bee Rearing
Newly emerged bees (
N. ceranae free) were confined to cages (polystyrene cage size; h = 10 cm, r = 4 cm) in groups of 50 and divided into fourteen treatment groups, with three replicate cages per treatment (
Table 1). The first seven treatment groups were randomly selected to be inoculated with
N. ceranae.
Nosema ceranae inoculation was accomplished by force-feeding individual bees with 2 μL of 50% sucrose solution (w/v) containing
N. ceranae spores at a dosage of 10
5 spores per bee.
Four of the
N. ceranae inoculated treatment groups were provided with either 0%, 25%, 50%, or 75% propolis extract in 50% sucrose solution (v/v). These groups were defined as NO, NP1, NP2, and NP3, respectively (
Table 1). The other three
N. ceranae inoculated treatment groups served as ethanol/
N. ceranae controls (i.e., to determine if ethanol by itself impacted
N. ceranae spore loads). These groups received either 17.5%, 35%, or 52.5% ethanol in 50% sucrose solution (v/v), defined as NE1, NE2, and NE3, respectively (
Table 1). Bees in the remaining seven treatment groups were force-fed 2 μL of 50% sucrose solution (w/v) that did not contain
N. ceranae spores. Four of these seven groups were provided with 0%, 25%, 50%, and 75% propolis extract in 50% sucrose solution (v/v), defined as C.O., CP1, CP2 and CP3, respectively (
Table 1). The remaining three treatment groups were provided with 17.5%, 35%, and 52.5% ethanol in 50% sucrose solution (v/v), defined as CE1, CE2, and CE3, respectively. Each cage was fitted with two gravity feeders, one containing distilled water and the other 50% (w/v) sucrose solution provided
ad libitum during the experiment. Each cage was also provided with a pollen patty (60 g pollen mixed with 17 mL of 50% sucrose solution (w/v))
ad libitum. All treatment cages were kept in an incubator (BINDER, BD 400, Germany) at 34 ± 2 °C, with an RH ranging from 50 to 55% [
45,
46].
2.6. Survival Analysis
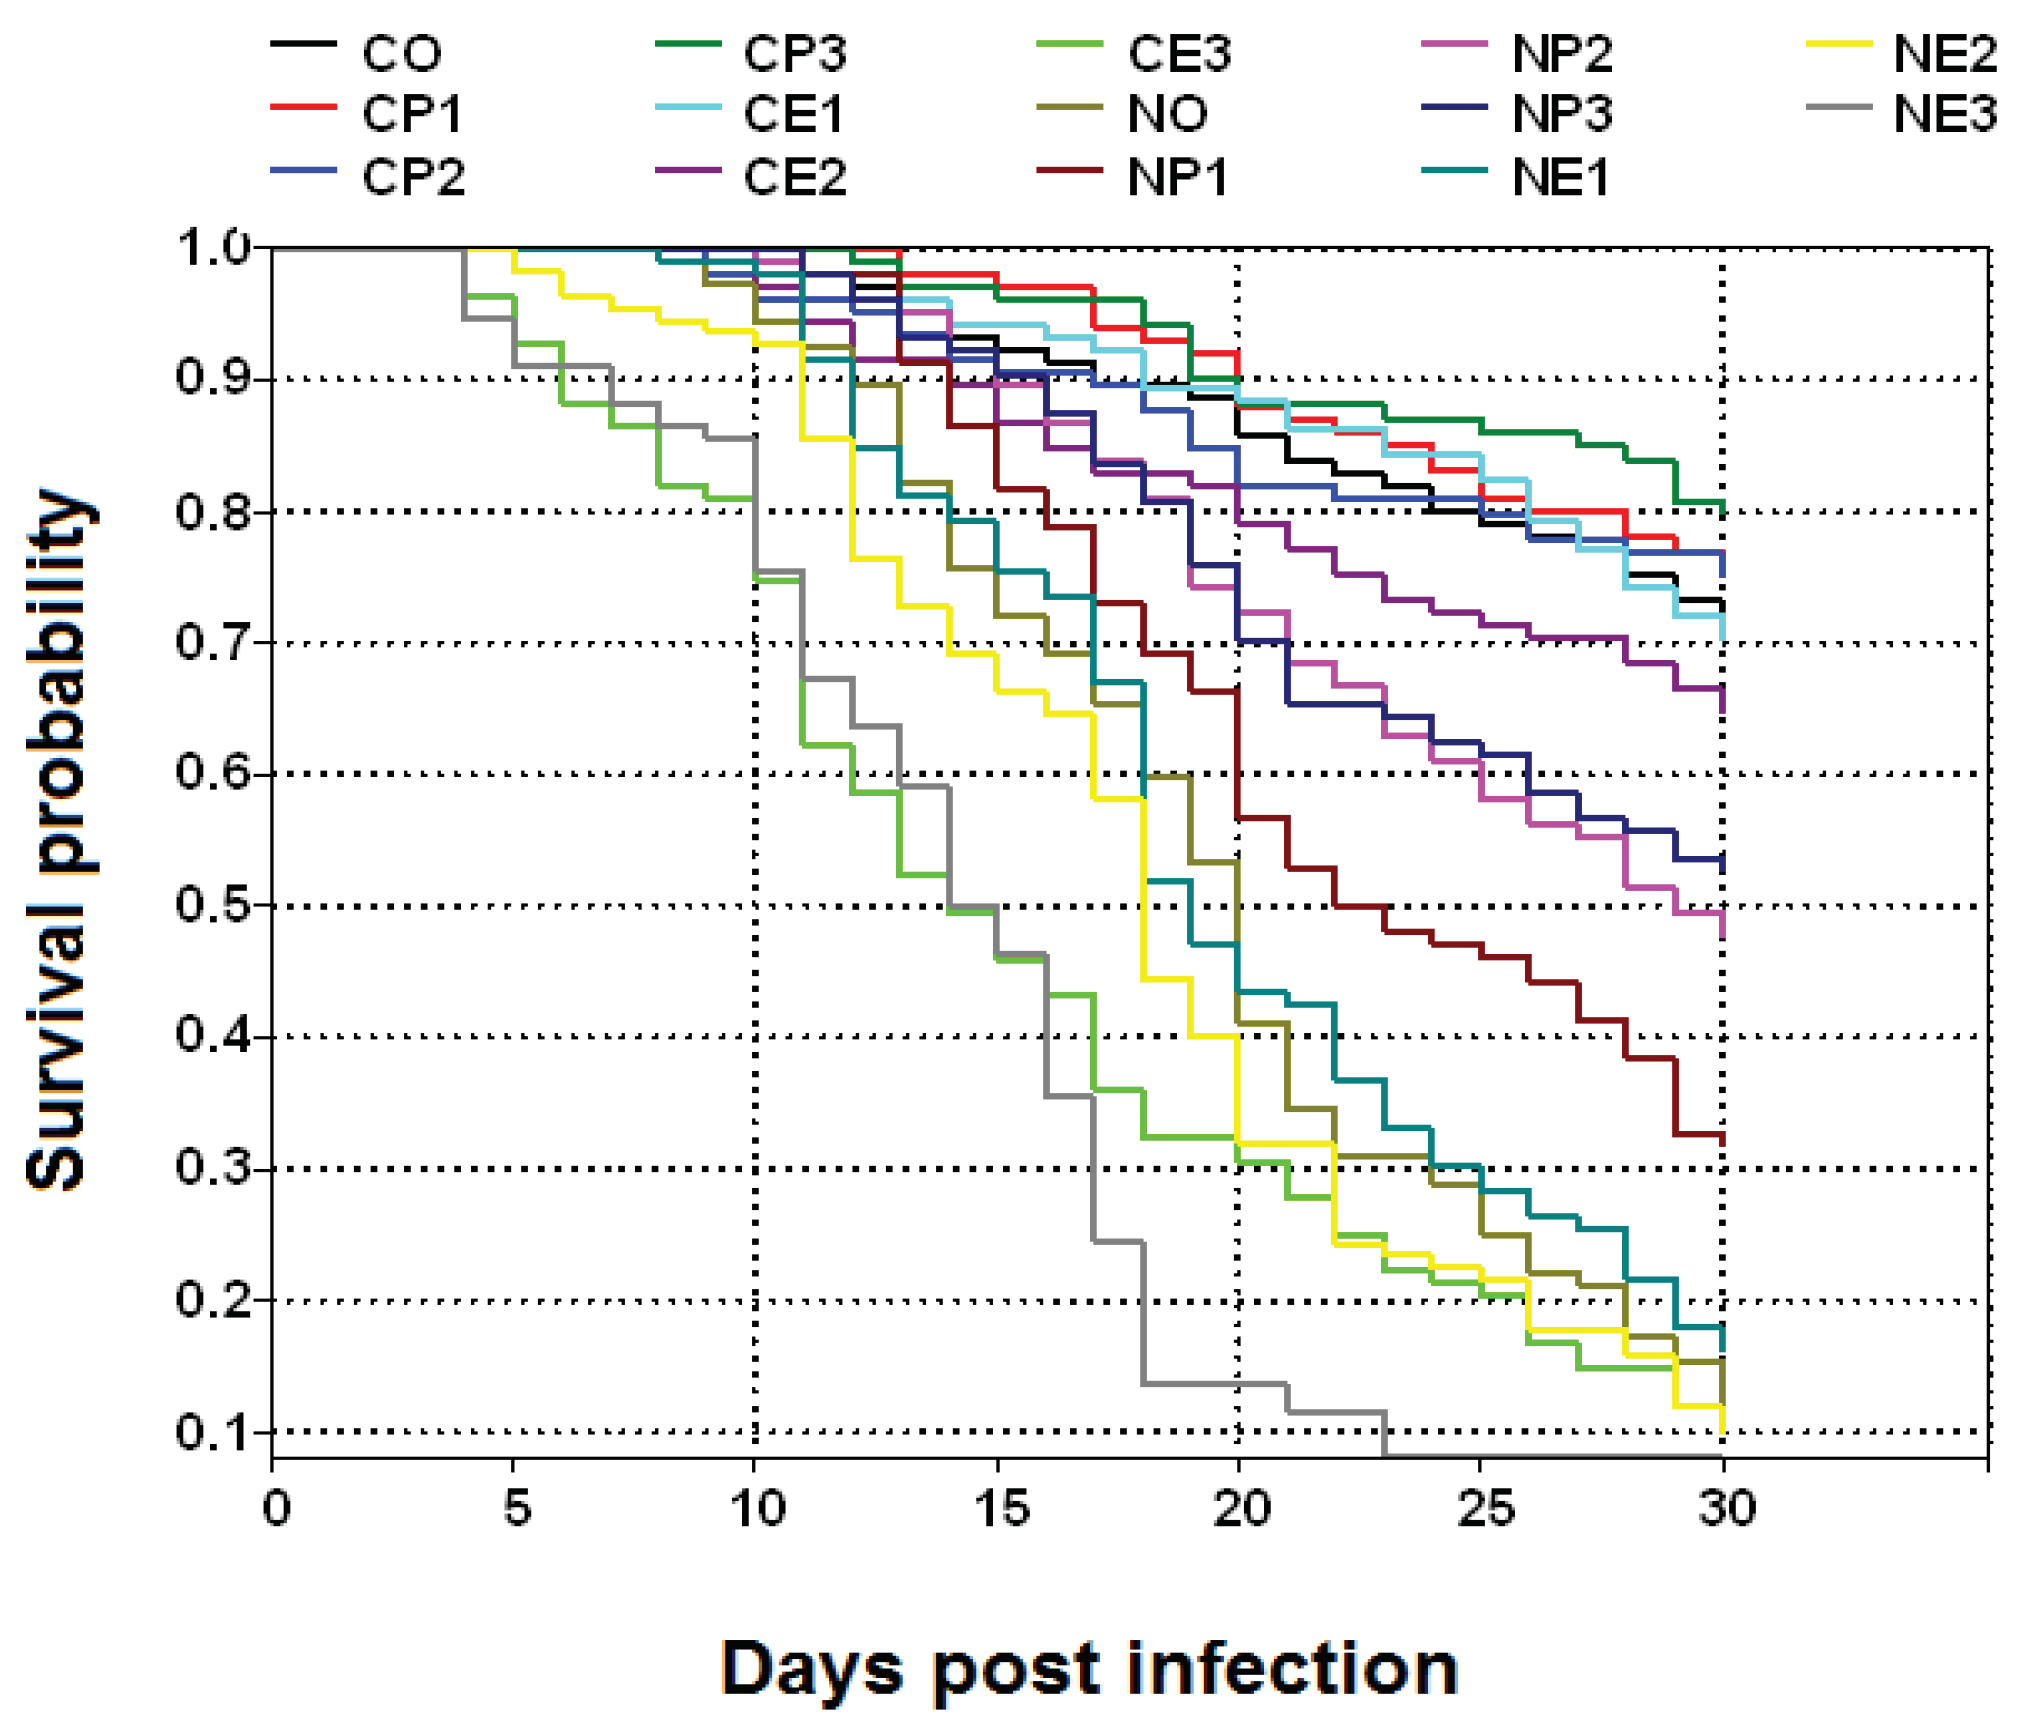
Dead bees were collected and counted daily for 30 d. Survivorship curves of
N. ceranae infected honey bees treated with different doses of propolis and those of control bees were generated using the Kaplan-Meier approach by plotting the number of surviving bees against days from initiation of the experiment [
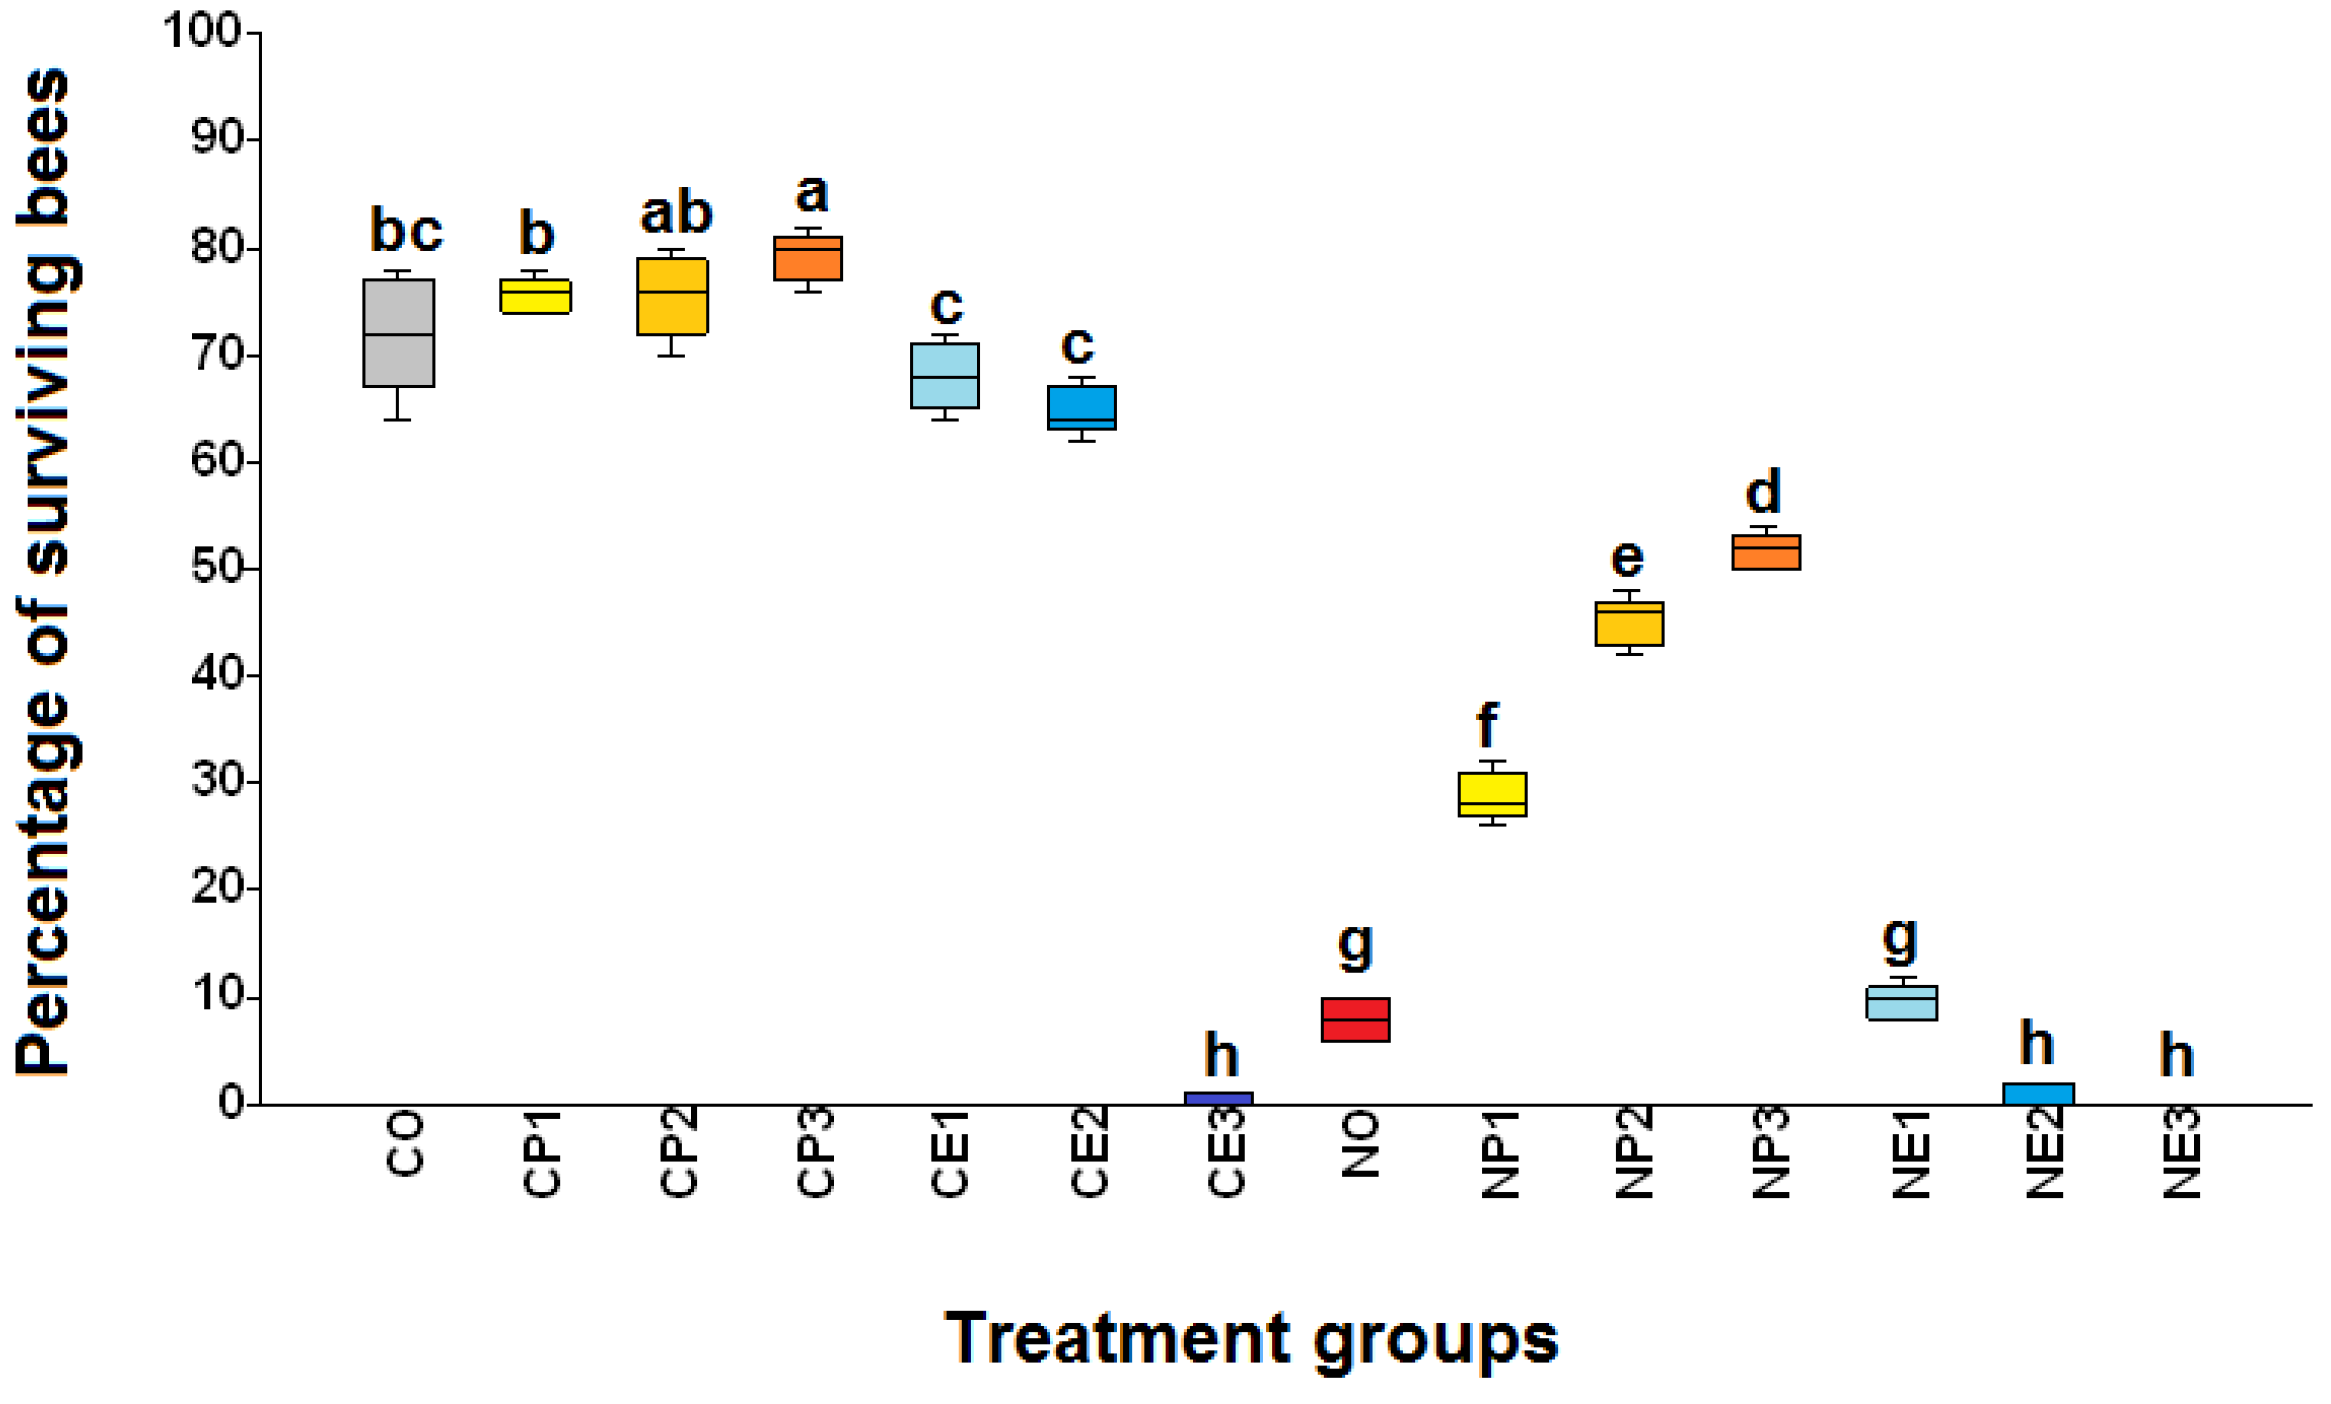
46]. The percentage of surviving bees was compared across the treatment groups using a non-parametric, univariate analysis of variance and a corresponding post hoc test (Kruskal-Wallis test and Mann-Whitney U test).
2.7. Infection Rate (Number of N. Ceranae-Infected Bees per 100 Exposed Bees)
For all cages, all dead honey bees were collected daily, and all remaining living honey bees were collected 30 d p.i. to determine the number of
N. ceranae infected bees per 100 bees (infection rate). To do this, the guts of all individual honey bees were removed and homogenized in 100 µL of distilled water [
45,
46]. Then, the presence/absence of
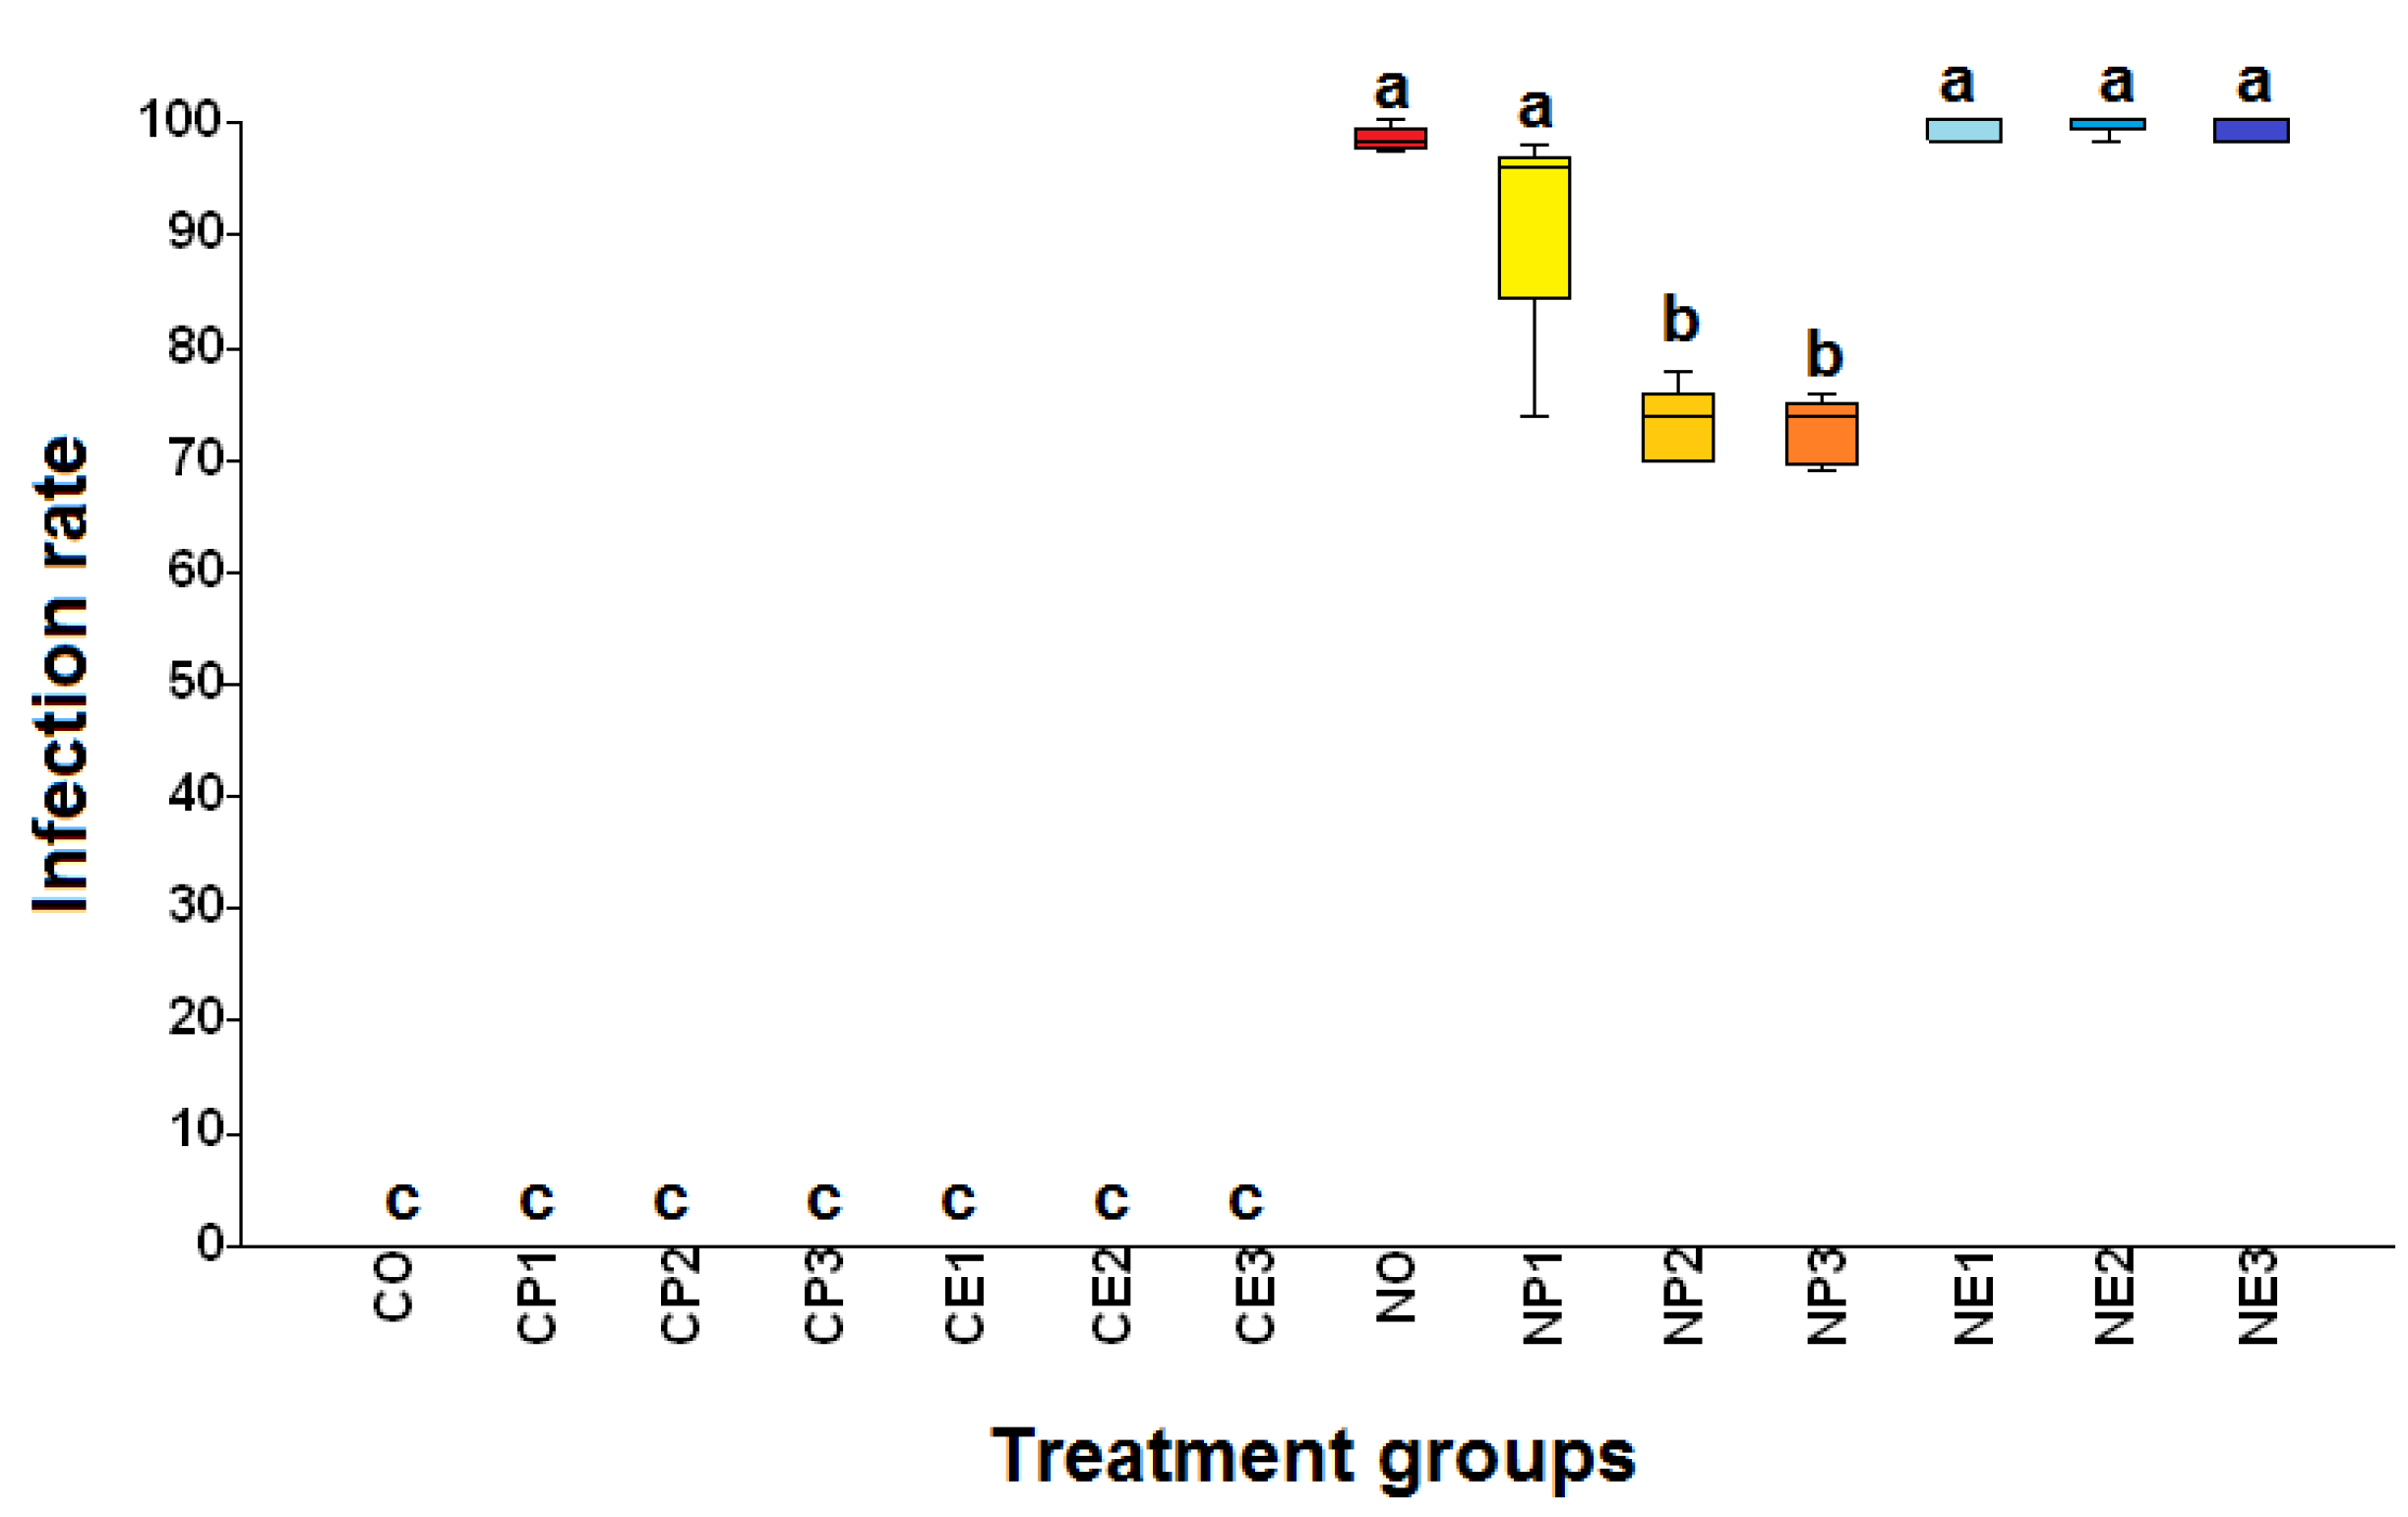
N. ceranae spores was determined using a light microscope (Z.E.I.S.S., A.X.I.O. Lab.A1, Germany) at 400× magnification. The infection rates were compared across the treatment groups using a non-parametric, univariate analysis of variance and a corresponding post hoc test (Kruskal-Wallis test and Mann-Whitney U test)
2.8. Infectivity (Number of N. ceranae Spores per Bee)
All dead bees were collected daily and all living bees were collected at 30 d p.i. from each group to determine the number of
N. ceranae spores per bee (infectivity). The guts of all honey bees were removed and homogenized in 100 µL of distilled water [
45,
46]. Then, the number of
N. ceranae spores was counted for each bee using a light microscope (Z.E.I.S.S., A.X.I.O. Lab.A1, Germany) and a hemocytometer (Neubauer, U.S.A.) at 400× magnification following the procedure described by Cantwell, 1970 [
49]. The infectivity was compared across the treatment groups using a non-parametric, univariate analysis of variance and a corresponding post hoc test (Kruskal-Wallis test and Mann-Whitney U test). The number of spores per bee was calculated with the following formula:
a= number of spores from 5 blocks, b= dilution factor (if used), c= volume of bee gut suspension (100 µL), d= volume in 25 blocks of hemocytometer (0.1 µL).
3. Results
3.1. Survival Analysis
The survival of N. ceranae infected bees treated with 25% (NP1), 50% (NP2), and 75% (NP3) propolis was significantly higher than that of infected bees not fed propolis (NO) (ꭓ
2= 66.55, df= 13, p< 0.0001;
Figure 1 and
Figure 2). However, the survival of infected bees treated with propolis was significantly lower than that of uninfected bees (C.O., CP1, CP2, CP3). Moreover, the survival of
N. ceranae infected bees treated with 75% (NP3) and 50% (NP2) propolis was significantly higher than that of infected bees treated with 25% (NP1) propolis. The highest survival (mean ±
S.E.) at the end of the experiment was found in the CP3 group with 79.2 ± 1.2% survival, followed by CP2: 75.6 ± 1.72%, CP1: 75.6 ± 0.75%, CO: 72.0 ± 2.45%, CE1: 68.0 ± 1.41%, and CE2: 64.8 ± 1.02% survival. Moreover, the survival of NP3, NP2, and NP1 was 51.6 ± 0.75%, 45.2 ± 1.02%, and 28.8 ± 0.89% survival, respectively followed by NE1: 9.6 ± 0.75%, NO: 8.0 ± 0.89%, NE2: 0.8 ± 0.49%, and CE3: 0.6 ± 0.24%. No
N. ceranae infected bees survived in the NE3 group.
3.2. Infection Rate (Number of N. ceranae-Infected Bees per 100 Exposed Bees)
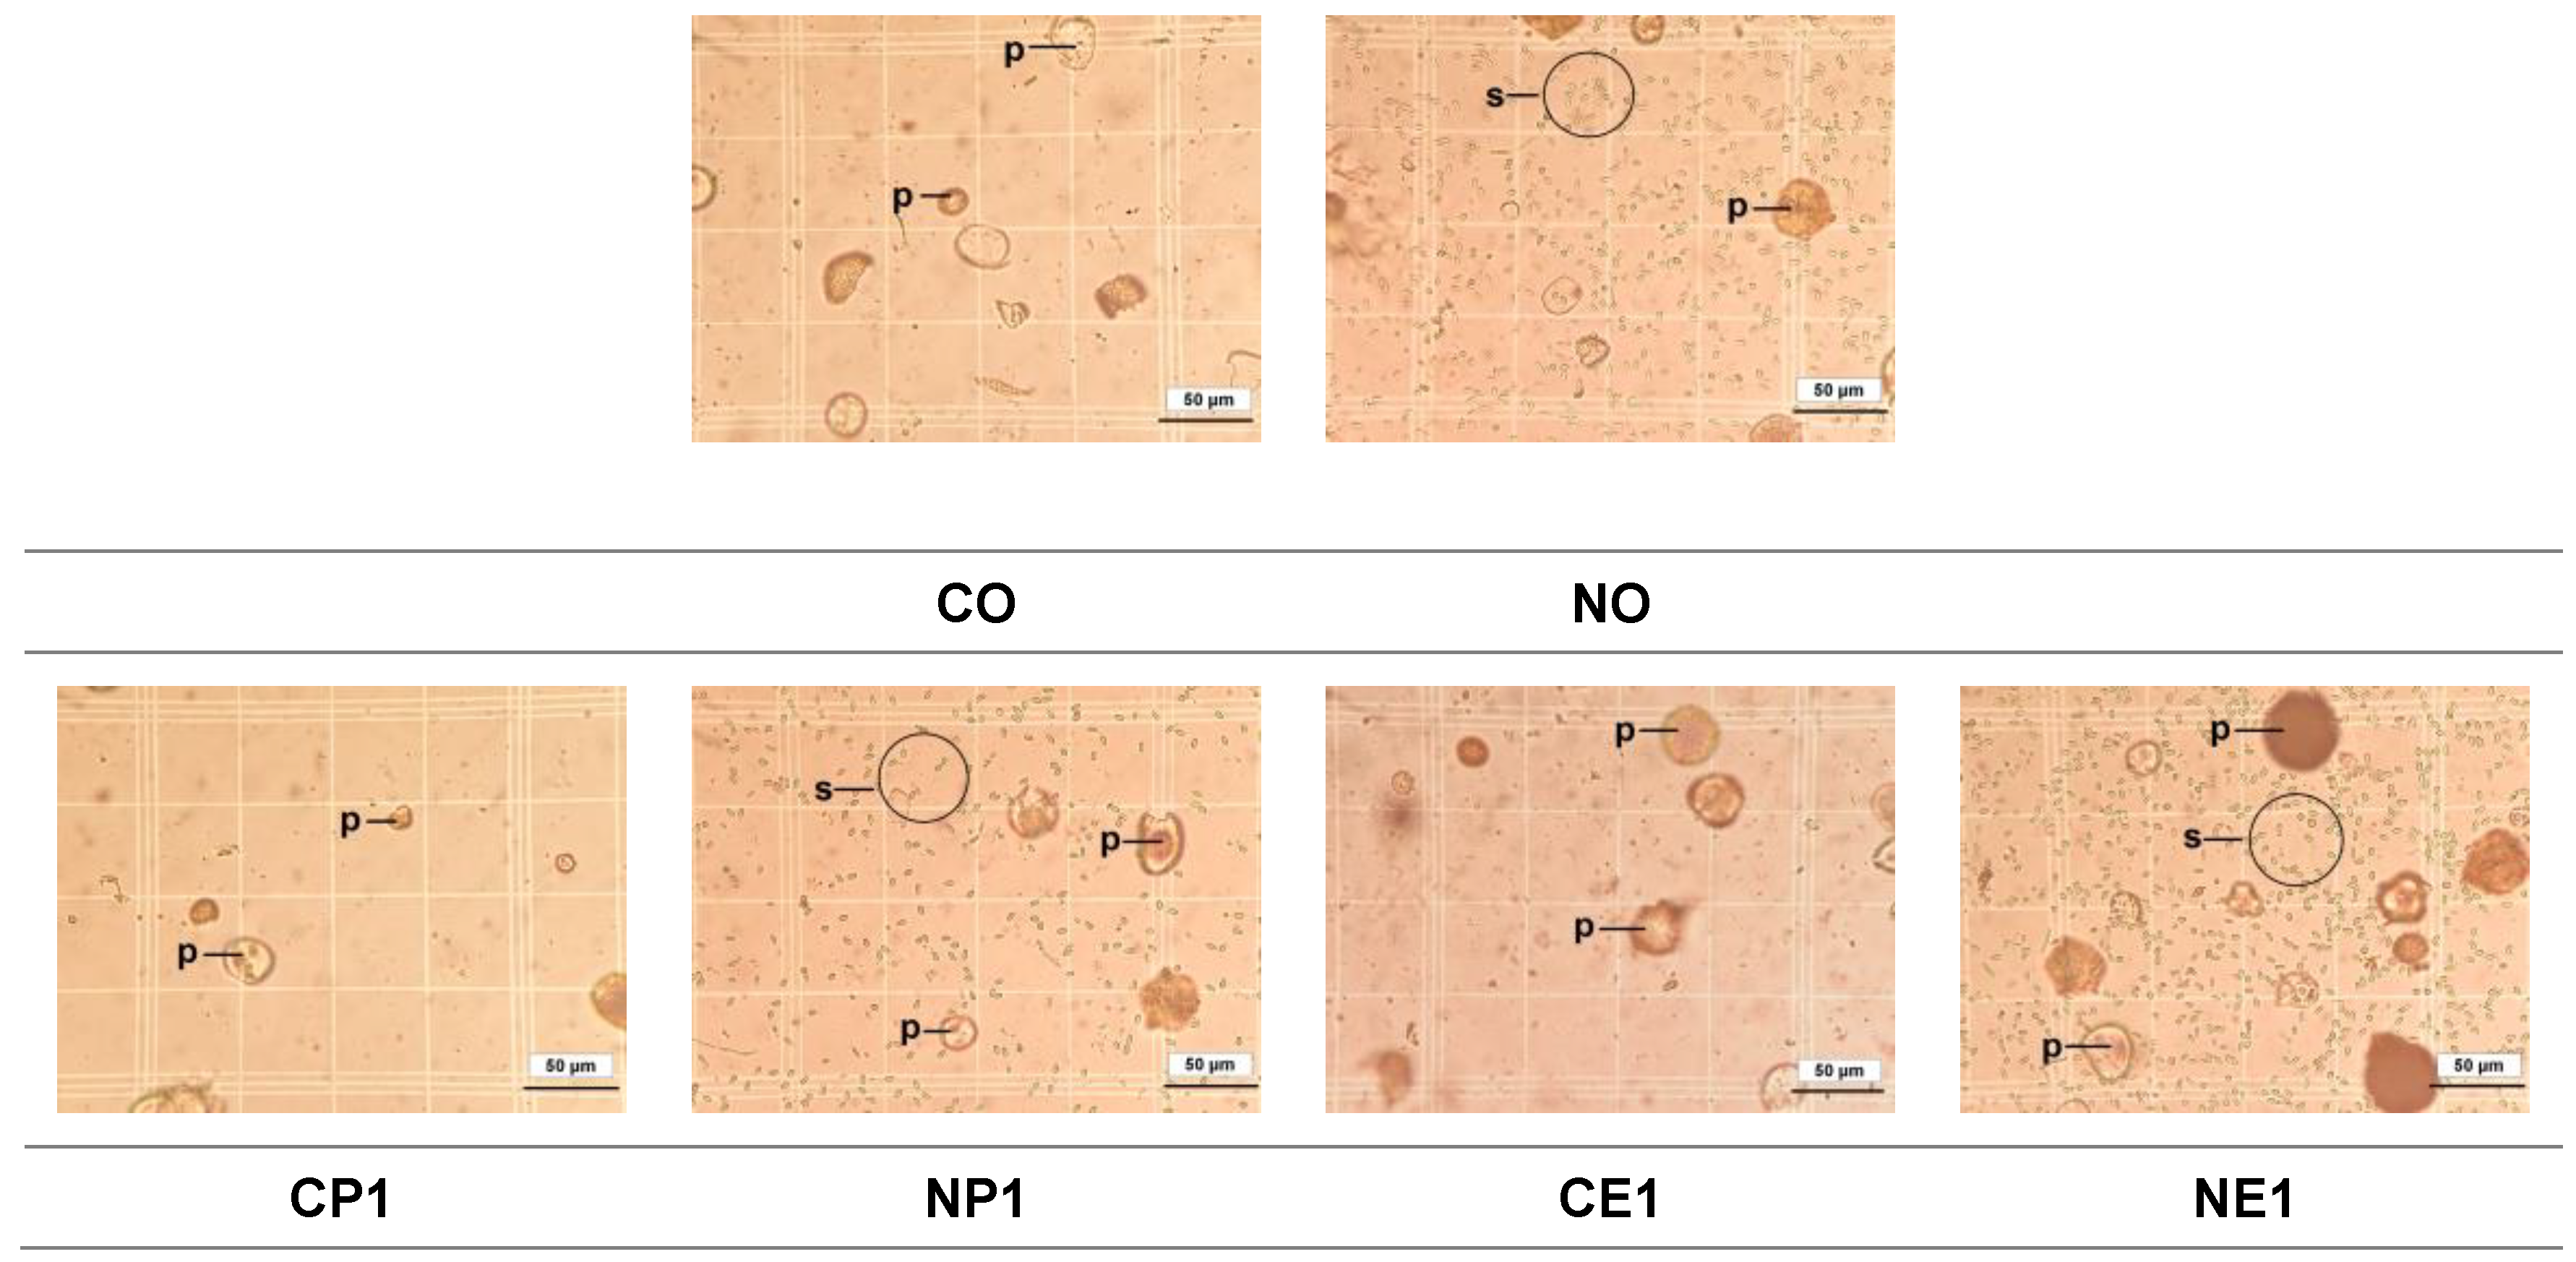
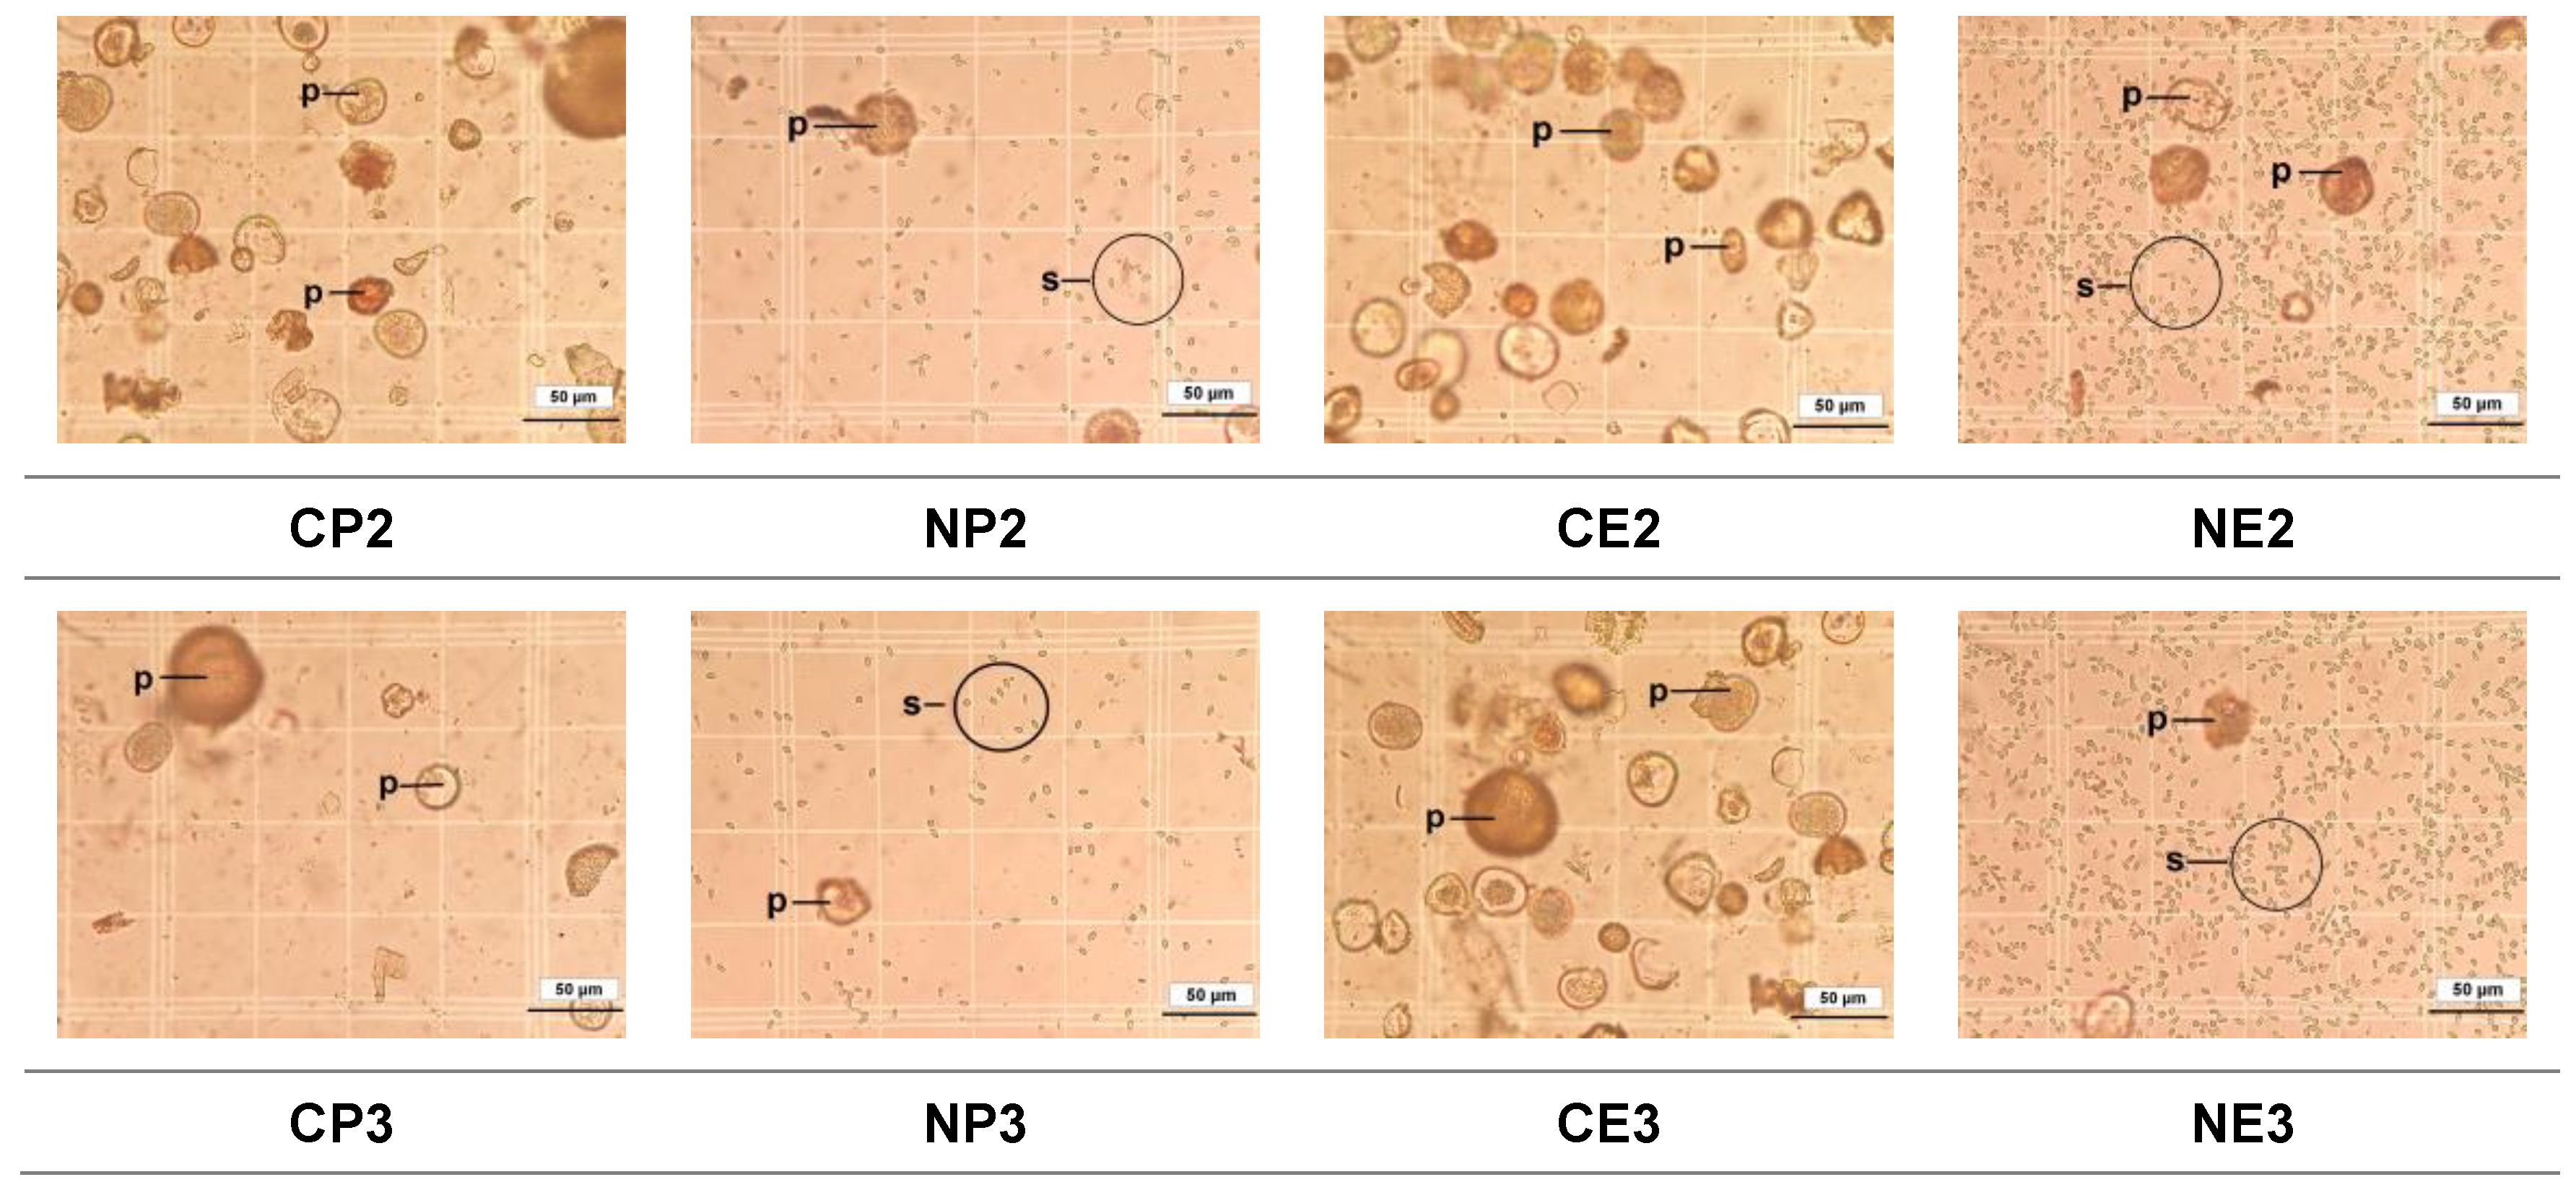
No N. ceranae spores were detected in any bees from uninfected groups (groups with "C" as the first letter of the group name) throughout the study, while bees from N. ceranae infected groups ("N" as the first letter of the group name) were positive with mature spores (
Figure 3 and
Figure 4). The N. ceranae infected bees treated with 50% (NP2) and 75% (NP3) propolis showed a significantly reduced infection rate compared to infected bees not fed propolis (NO) and that fed 25 % propolis (NP1) (ꭓ
2= 58.42, df= 13, p< 0.0001;
Figure 3). The highest infection rate (mean ± S.E.) was found in the NE2 group with 99.6 ± 0.04%, followed by NE1: 99.2 ± 0.49%, NE3: 98.8 ± 0.49%, and NO: 98.2 ± 0.49%, respectively. Moreover, the infection rates of NP3, NP2, and NP1 were 72.6 ± 1.33%, 73.2 ± 1.50%, and 91.8 ± 4.48%, respectively (
Figure 3).
3.3. Infectivity (Number of N. Ceranae Spores per Bee)
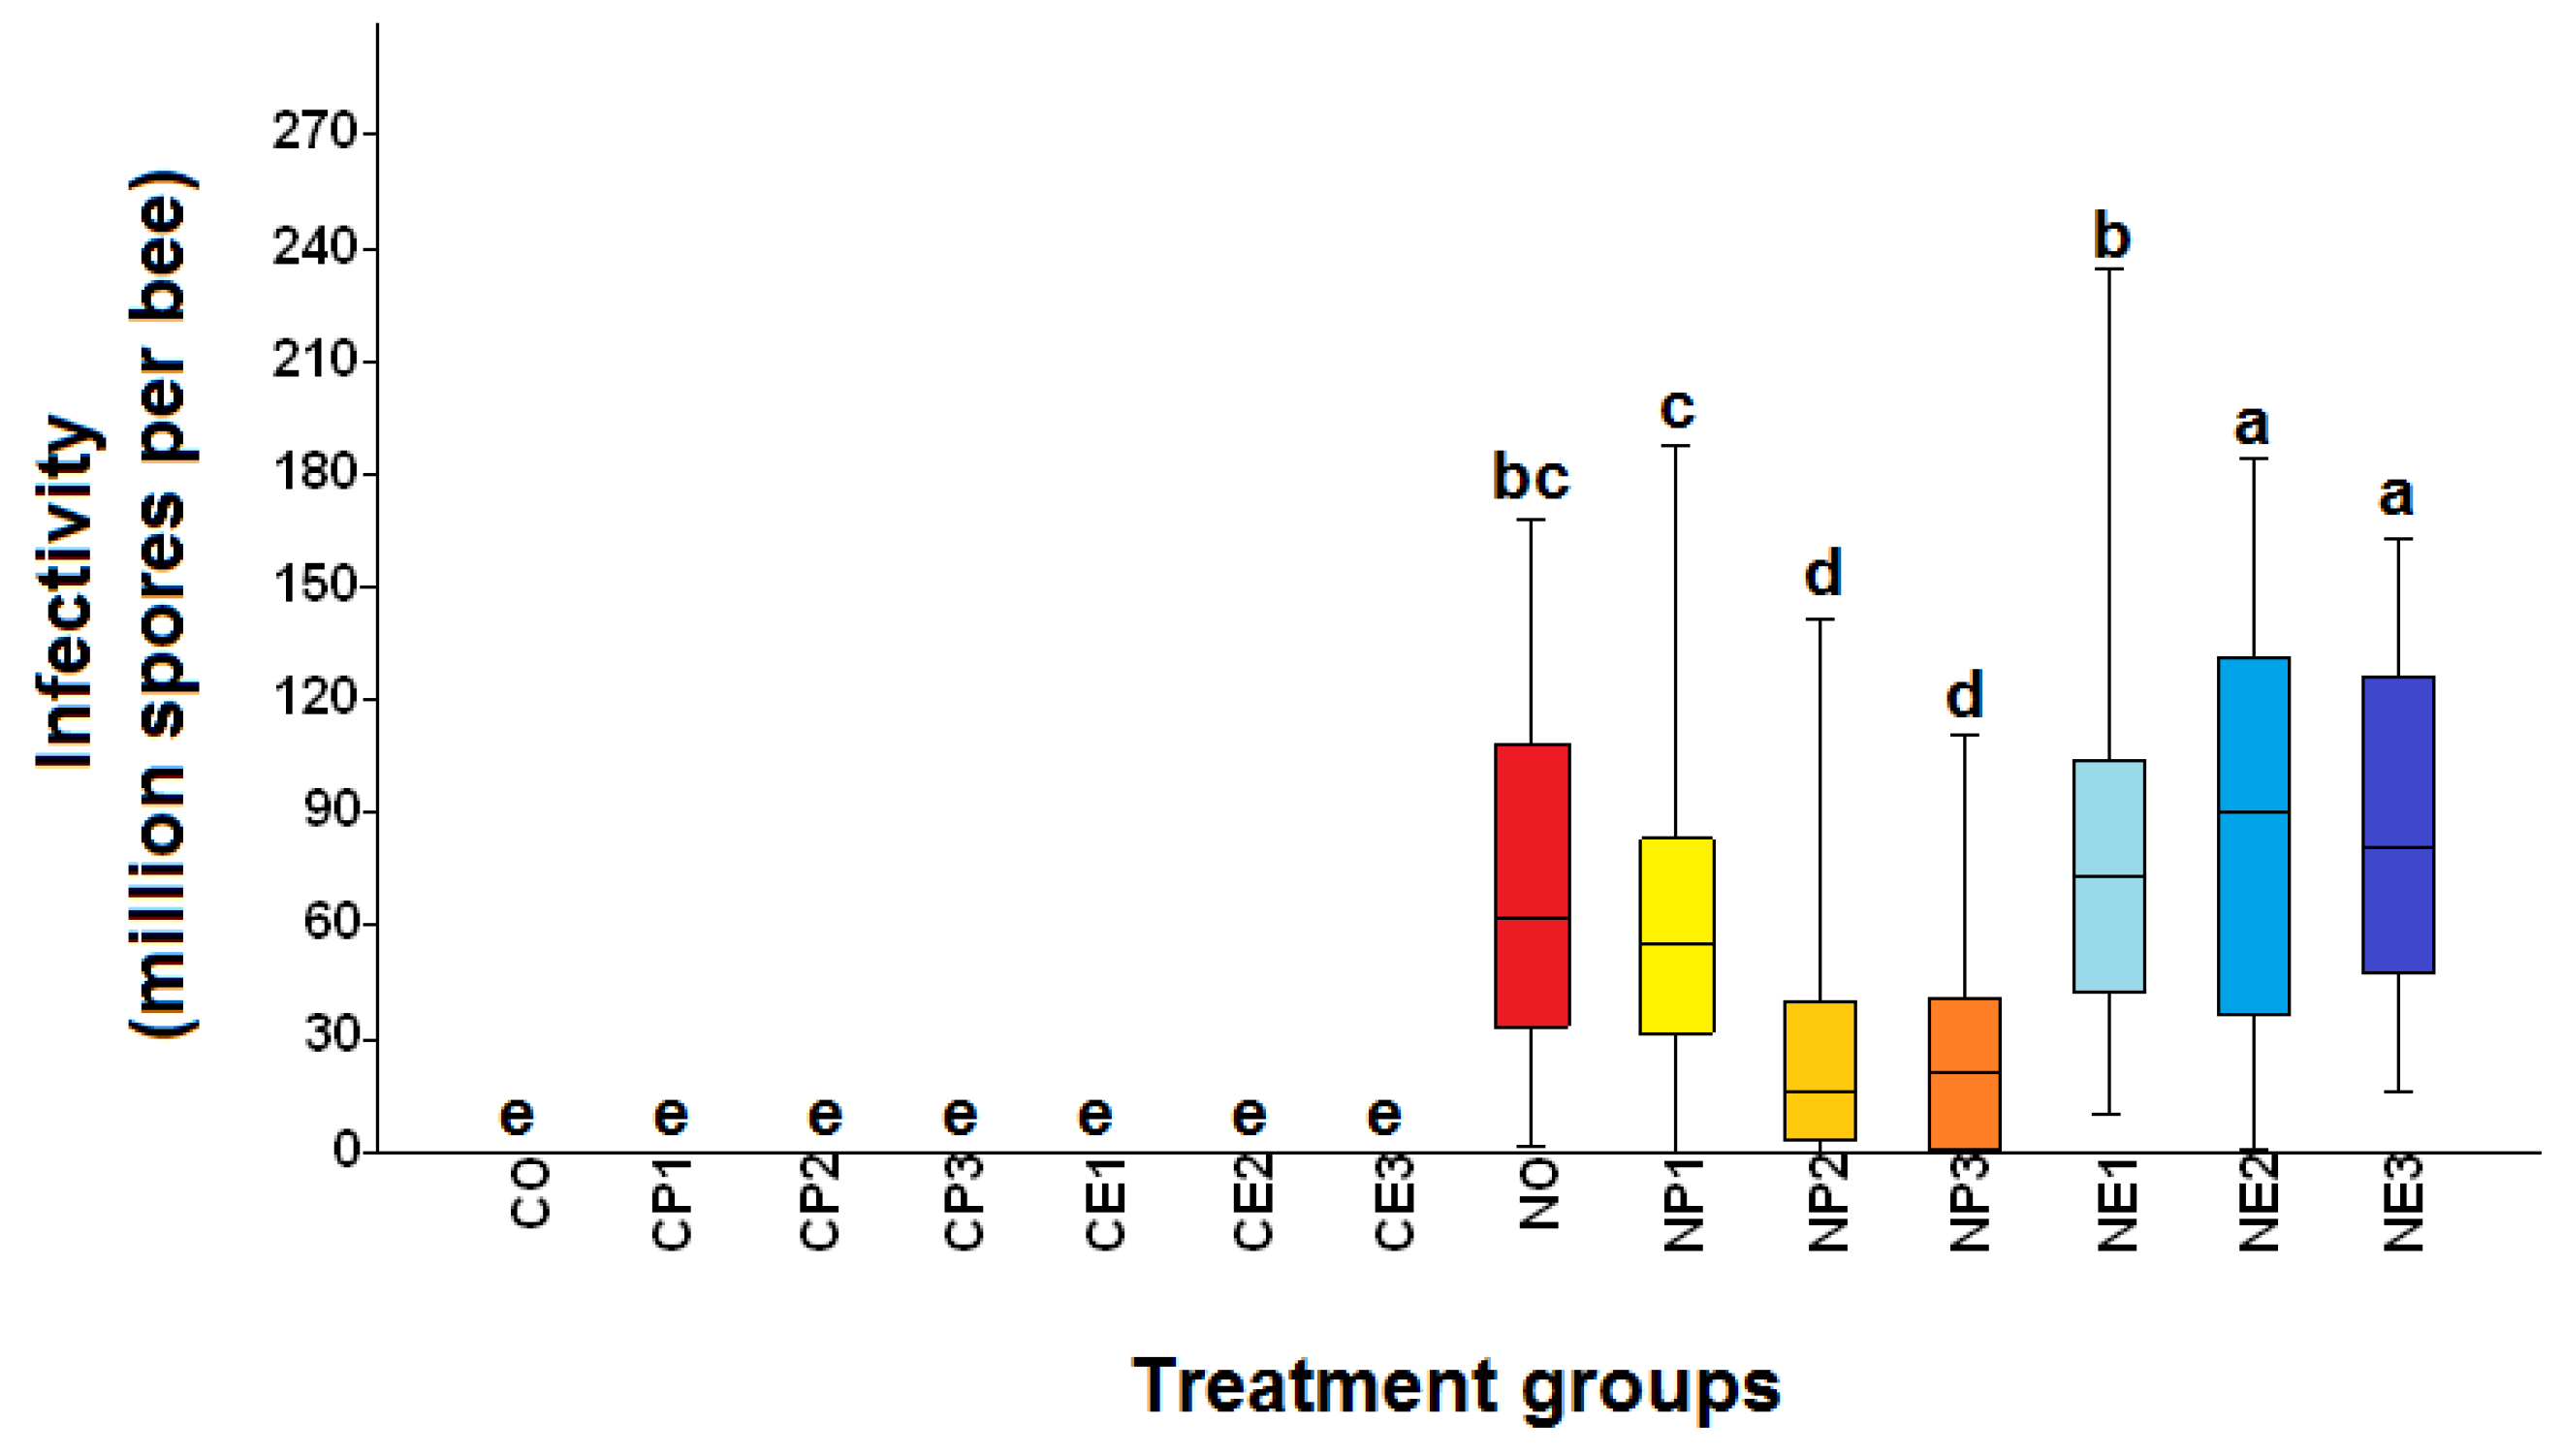
Honey bees from the uninfected groups (groups with "C" as the first letter of the group name) did not have N. ceranae spores throughout the study, while all other groups ("N" as the first letter of group name) were positive for N. ceranae infection (
Figure 5). The infectivity of N. ceranae infected bees treated with 50% (NP2) and 75% (NP3) propolis was significantly lower than those of infected bees not fed propolis (NO) or fed 25% propolis (NP1) (ꭓ
2= 994.9, df= 13, p< 0.0001;
Figure 5). The highest infectivity (mean ± SE) was found in the NE3 group with 87.33 ± 24.34 × 10
6 spores per bee, followed by NE2: 86.18 ± 5.22 × 10⁶, NE1: 78.97 ± 4.49 × 10⁶, and NO: 70.3 ± 4.36 × 10⁶ spores per bee, respectively. Moreover, the infectivity of NP1, NP2, and NP3 were 61.92 ± 3.97× 10⁶, 28.76 ± 3.21× 10⁶, and 27.75 ± 2.92 × 10⁶ spores per bee, respectively (
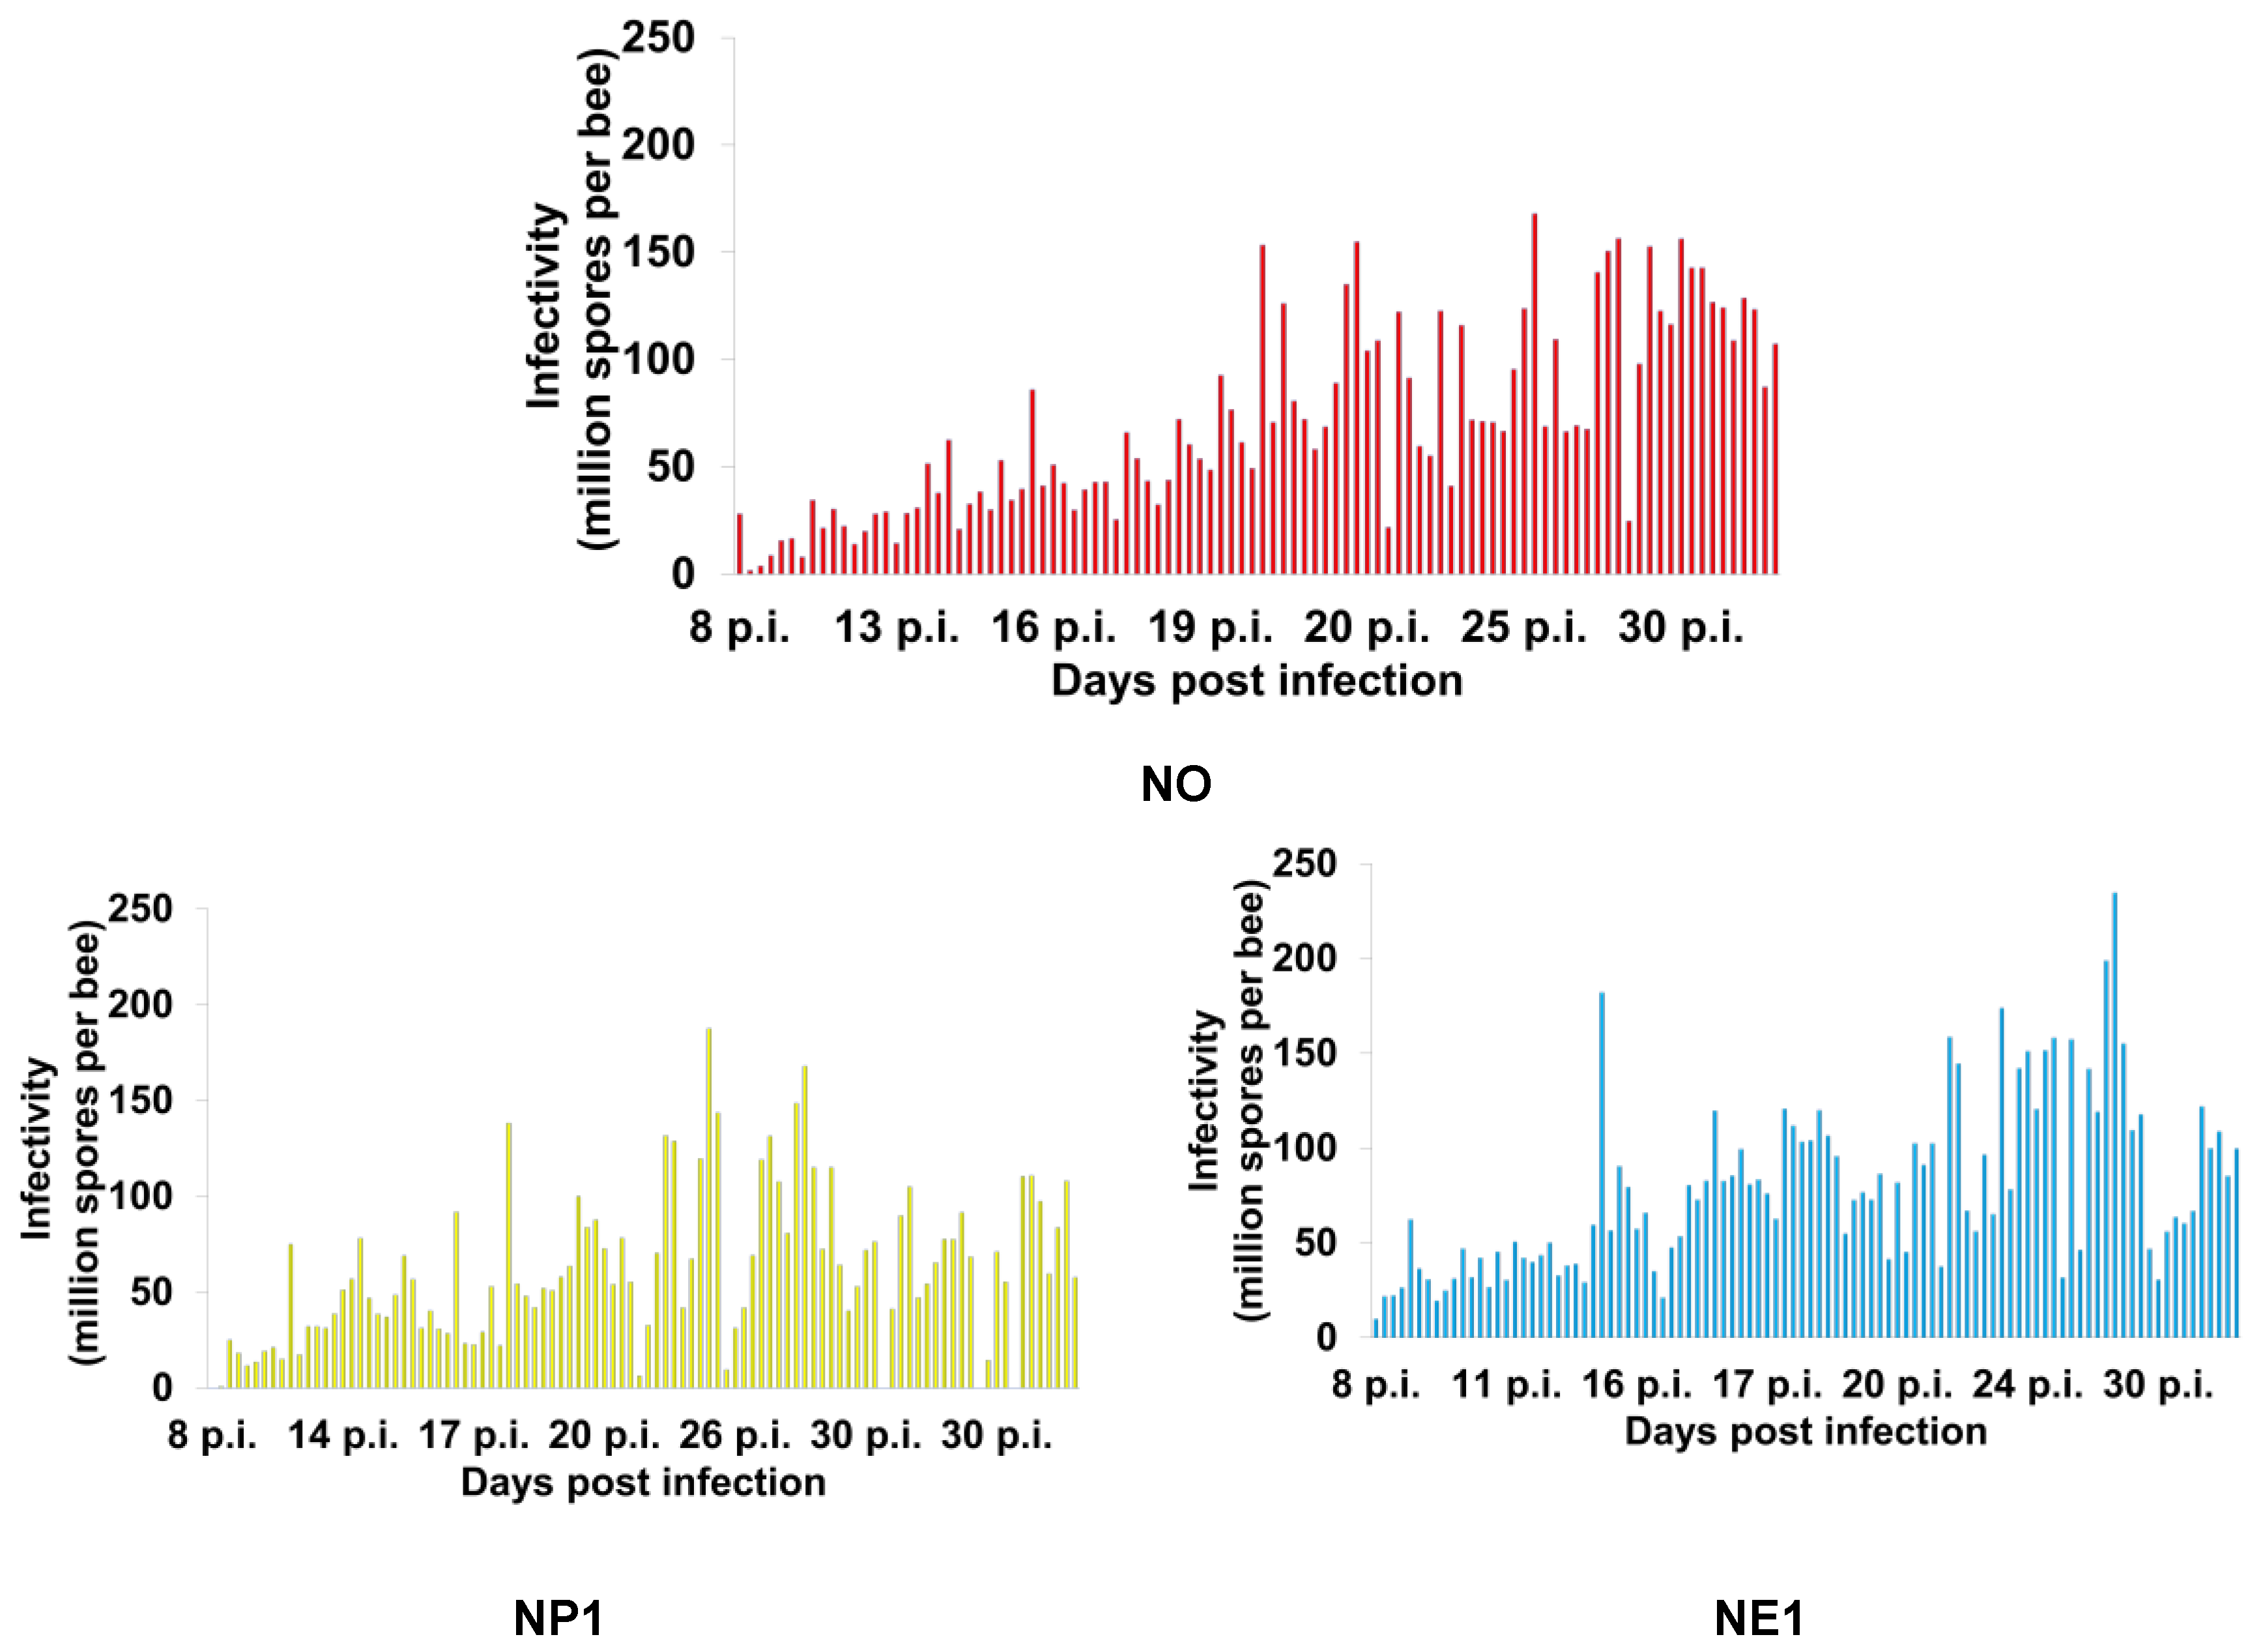
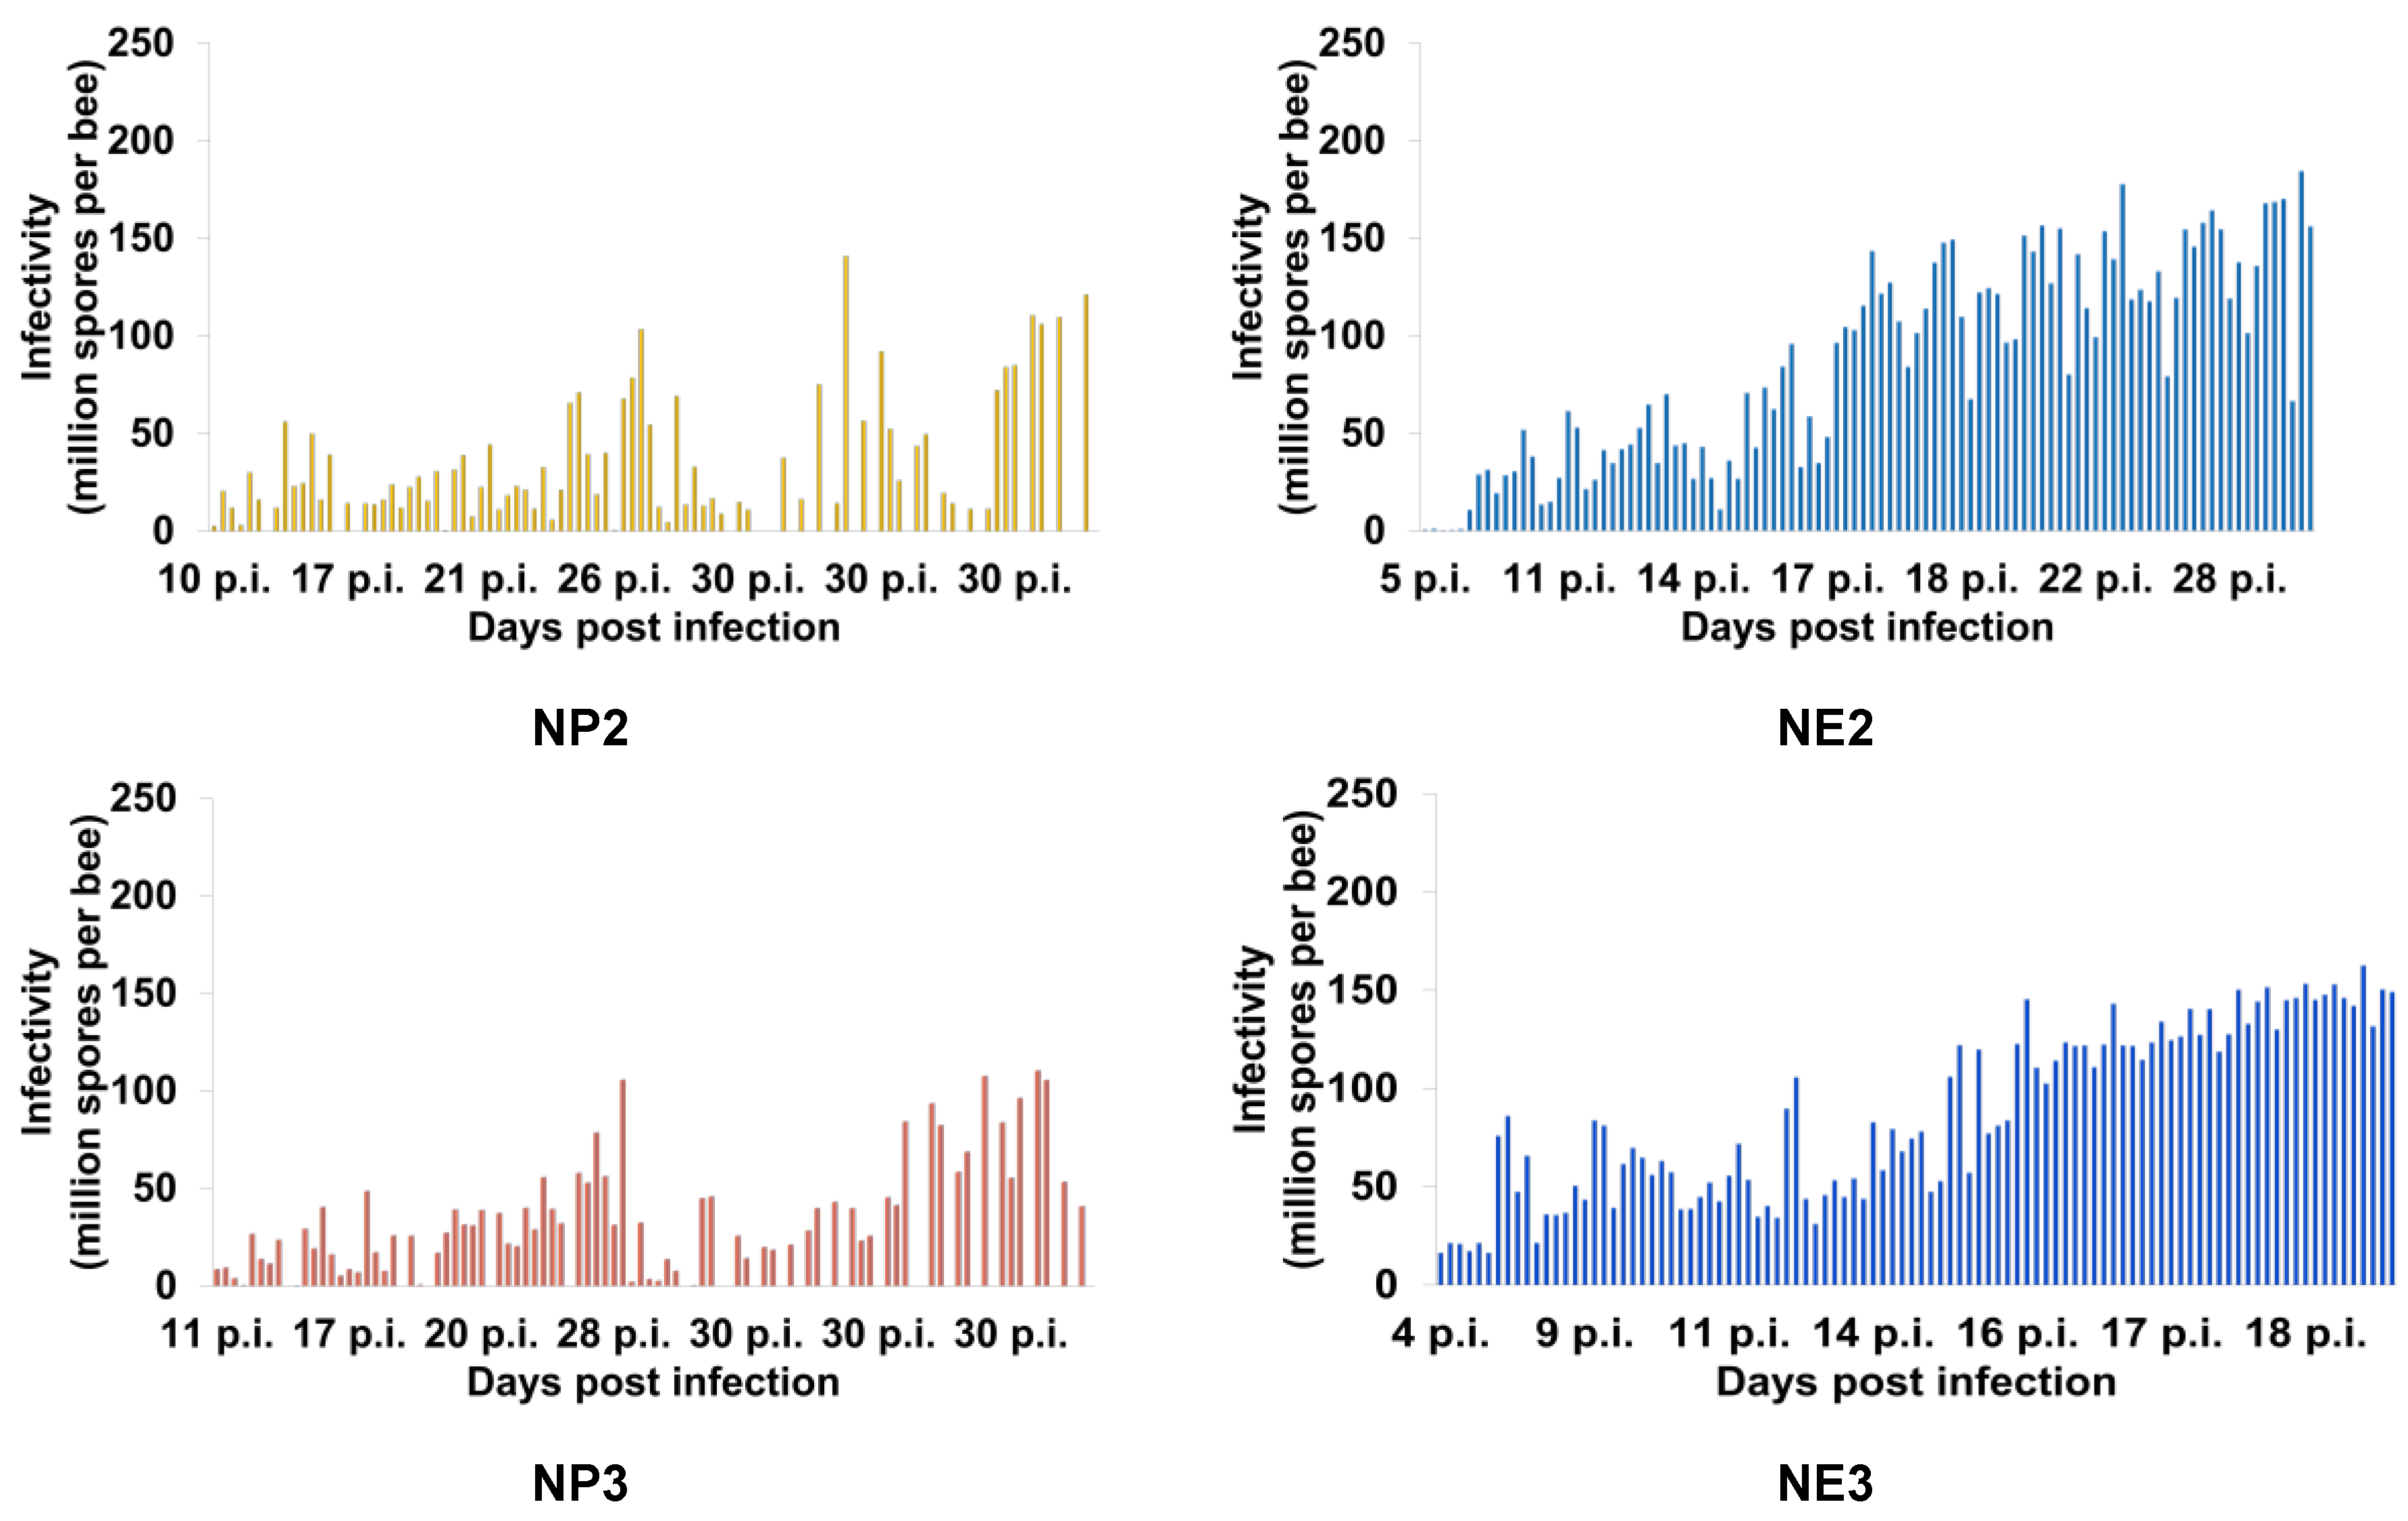
Figure 5). The individual infectivity of N. ceranae infected bees showed a trend of increasing spore loads over time after honey bees were inoculated with N. ceranae spores (
Figure 6). The first deaths of bees from the N. ceranae infected groups treated with no (NO), 25% (NP1), 50% (NP2), and 75% (NP3) propolis occurred on days 8, 8, 10, and 11 p.i., respectively. Moreover, the first deaths of bees from the NE1, NE2, and NE3 groups occurred on days 8, 4, and 5 p.i. (
Figure 6)
Transmission electron micrographs of A. mellifera worker midguts infected with 10
5 N. ceranae spores/bee at 10 d p.i. show N. ceranae spores embedded in the cytoplasm of ventricular cells. The spore in
Figure 7 was oval. It contained an endospore, exospore, double nuclei, 17 to 20 polar filament coils, and an anchoring disk at the apical part of its spore. The length and width of all measured N. ceranae spores were 4.12 ± 0.51 µm and 2.19 ± 0.16 µm, respectively. Moreover, the polar filament diameter was 63.09 ± 1.23 nm (
Figure 7).
4. Discussion
Nosema ceranae can cause severe nosemosis disease in honey bees, leading to declining bee populations that affect both pollination services and the beekeeping industry [
8]. Using an antibiotic to control this disease in honey bees can lead to antibiotic resistance and contamination of hive products [
50,
51,
52,
53,
54,
55,
56]. Our results in this study demonstrate an alternative way to control
N. ceranae in honey bees, namely by using 75% propolis (v/v) collected from
A. mellifera hives and fed to bees. The results showed that the propolis extract could reduce, though not eliminate entirely, the negative consequences of
N. ceranae infection (mortality, infection rate, and infectivity) in treated
A. mellifera workers. Our study also demonstrated that high (75% propolis (v/v)) and medium concentrations (50% propolis (v/v)) of propolis extract were more effective against
N. ceranae infection (mortality, infection rate, and infectivity) in
A. mellifera workers than was a lower concentration (25% propolis (v/v)) of propolis extract. Our results were similar to those of others using 50% ethanolic extracted propolis (v/v) from
A. mellifera and stingless bees (
Tetrigona apicalis) to treat and reduce mortality and spore loads in
N. ceranae infected bees [
44,
45,
47].
The CE1/NE1 (17.5% ethanol), CE2/NE2 (35%), and CE3/NE3 (52.5%) treatments did not contain propolis and served as solvent controls in our study, the "C" treatments representing bees not infected with
N. ceranae and the "N" treatments including bees infected with N
. ceranae. These groups allowed us to distinguish effects caused by the propolis from those, if any, caused by the solvent ethanol. The CE1/NE1 and CE2/NE2 treatments did not impact bee survival or any
N. ceranae related parameters. Others have found similar results [
57]. Interestingly, a high concentration of ethanol (52.5%) in the CE3 group negatively impacted honey bee survival to match that of the NE3 group (52.5% ethanol +
N. ceranae). This was not seen in the other treatment groups (CP3, NP3) containing 52.5% ethanol (52.5%). This implies that high concentrations of ethanol lead to reduced bee survival [
58] and that treatment with propolis may offset these impacts.
Our results showed that feeding
A. mellifera workers propolis at medium and high concentrations (50% and 75% propolis (v/v)) can decrease
N. ceranae infection. Our results suggest that 35% and 52.5% ethanol in sugar water can increase the virulence of
N. ceranae infection in infected
A. mellifera workers, complimenting the results of Naree et al. [
44]. In their research, the infectivity (#
N. ceranae spores per bee) of
N. ceranae infected bees treated with 35% ethanol (v/v) (92.2 ± 14.18 × 10
6 spores per bee) was significantly higher than that of
N. ceranae infected bees not feed ethanol (78.28 ± 13.42 × 10
6 spores per bee) [
44].
Propolis has antioxidant, anti-inflammatory, anticancer, antifungal, and antibacterial properties [
35,
36,
37,
38,
39,
40,
41]. The bioactive compounds of propolis vary depending on bee species and their plant source [
42]. Propolis includes flavonoids, phenolics, and aromatic compounds [
43]. It is unclear how propolis affects
N. ceranae infection. However, a study by Mura et al. [
47] found that ethanolic propolis extracts from
A. mellifera contain almost 50 phenol and flavonoid family compounds. These included flavones, flavonols, caffeic acid, and ferulic acid [
47]. Flavonoids inhibit fungal growth via mechanisms such as plasma membrane disruption and the inhibition of cell wall formation [
59]. Ergosterols are necessary components for cell membrane manufacturing. Flavonoids can inhibit ergosterol biosynthesis, resulting in the disruption of cell membrane integrity. This can lead to the leakage of intracellular components [
60,
61]. The cell wall of
N. ceranae is primarily composed of glucans and chitin. The antifungal mechanism of flavonoids is cell wall deformation caused by inhibiting glucans and chitin synthesis [
61,
62]. Cell wall deformations and the membrane damage caused by flavonoids can contribute to malfunctions of the membrane, leading to depolarization, K+ leakage, reduction in membrane fluidity, and ultimately cell death [
63,
64]. These reasons may partially explain how ethanolic-extracted propolis can reduce
N. ceranae infection in honey bees.
One can use the number of polar filament coils to distinguish the
Nosema species [
65].
Nosema apis contains 30 to 44 polar filament coils [
66,
67,
68], while
N. ceranae and
N. neumanni include 20 to 23 polar filament coils [
69] and 10 to 12 polar filament coils [
7], respectively. Our polar filament coil data allow us to confirm
N. ceranae identity, given that the analyzed spores had 17 to 20 polar filament coils [
69].
5. Conclusions
Using ethanolic-extracted propolis collected from
A. mellifera hives and formulated at suitable concentrations (50% and 75% propolis) to treat
N. ceranae infection can decrease the mortality, infectivity, and infection rate of
N. ceranae infection in honey bee workers. These findings suggest an alternative way to control
N. ceranae in honey bees using propolis collected from
A. mellifera hives and extracted with suitable concentrations (50 and 75%) of propolis. This is especially important given the relative inefficacy of various controls available to treat
N. ceranae infection in honey bees [
70]. Admittedly, more work is needed before this treatment recommendation can be made. Nevertheless, our data suggest that propolis use as a preventative of and treatment for
N. ceranae infection in honey bees is promising and worth pursuing through additional research.
Author Contributions
Conceptualization, S.N., J.D.E., and G.S.; methodology, S.N., J.D.E., and G.S.; software, S.N., and G.S.; validation, S.N., J.D.E., and G.S.; formal analysis, S.N., and G.S.; investigation, S.N., J.D.E., and G.S.; resources, S.N., J.D.E., and G.S.; data curation, S.N., J.D.E., and G.S.; writing—original draft preparation, S.N., J.D.E., and G.S.; writing—review and editing, S.N., J.D.E., and G.S.; visualization, S.N., J.D.E., and G.S.; supervision, S.N., J.D.E., and G.S.; project administration, S.N., J.D.E., and G.S.; funding acquisition, S.N., J.D.E., and G.S. All authors have read and agreed to the published version of the manuscript.
Funding
This research was funded by the Thailand Research Funds (Royal Golden Jubilee Ph.D. Scholarship, R.G.J.), grant no. P.H.D./0078/2559, and by a U.S.D.A. National Institute of Food and Agriculture Multistate Project (NC1173: 1019945).
Institutional Review Board Statement
The animal study protocol was approved by the Ethics Committee of Burapha University (protocol code: IACUC 021/2562 and date of approval: 28 December 2020).
Informed Consent Statement
Not applicable.
Data Availability Statement
Not applicable.
Acknowledgments
The authors wish to thank the Bee Research Unit (BeefamBUU), Department of Biology, Faculty of Science, Burapha University, Thailand, and the University of Florida Honey Bee Research and Extension Laboratory, Entomology and Nematology Department, Florida, U.S.A., for additional support.
Conflicts of Interest
The authors declare no conflict of interest.
References
- Hung, K.L.J.; Kingston, J.M.; Albrecht, M.; Holway, D.A.; Kohn, J.R. The worldwide importance of honey bees as pollinators in natural habitats. Proc. Biol. Sci. 2018, 285(1870), 20172140. [Google Scholar] [CrossRef] [PubMed]
- Klein, A.M.; Vaissière, B.E.; Cane, J.H.; Steffan-Dewenter, I.; Cunningham, S.A.; Kremen, C.; Tscharntke, T. Importance of pollinators in changing landscapes for world crops. Proc. Biol. Sci. 2007, 274, 303–313. [Google Scholar] [CrossRef] [PubMed]
- Rocha, F.H.; Peraza, D.N.; Medina, S.; Quezada-Euán, J. J.G. Pollination service provided by honey bees to buzz-pollinated crops in the Neotropics. PloS One 2023, 18. [Google Scholar] [CrossRef] [PubMed]
- Ellis, J.D.; Evans, J.D.; Pettis, J. Colony losses, managed colony population decline, and Colony Collapse Disorder in the United States. J. Apic. Res. 2010, 49, 134–136. [Google Scholar] [CrossRef]
- Paxton, R.J. (2010). Does infection by Nosema ceranae cause "Colony Collapse Disorder" in honey bees (Apis mellifera)? J. Apic. Res. 2010, 49, 80–84. [Google Scholar] [CrossRef]
- Wood, T.J.; Michez, D.; Drossart, M.; Neumann, P.; Gérard, M.; Vanderplanck, M.; Barraud, A.; Martinet, B.; Leclercq, N.; Vereecken, N.J. Managed honey bees as a radar for wild bee decline? Apidologie 2020, 51, 1100–1116. [Google Scholar] [CrossRef]
- Chemurot, M.; De Smet, L.; Brunain, M.; De Rycke, R.; de Graaf, D.C. (2017). Nosema neumanni n. Sp. (Microsporidia, Nosematidae), a new microsporidian parasite of honeybees, Apis mellifera in Uganda. Eur. J. Protistol. 2017, 61, 13–19. [Google Scholar] [CrossRef]
- Fries, I. Nosema ceranae in European honey bees (Apis mellifera). J. Invertebr. Pathol. 2010, 103, S73–S79. [Google Scholar] [CrossRef]
- Zander, E. Tierische parasiten als krankenheitserreger bei der biene. Münchener Bienenzeitung 1909, 31, 196–204. [Google Scholar]
- Capella-Gutiérrez, S.; Marcet-Houben, M.; Gabaldón, T. Phylogenomics supports microsporidia as the earliest diverging clade of sequenced fungi. B.M.C. Biol. 2012, 10, 47. [Google Scholar] [CrossRef]
- Lee, S.C.; Corradi, N.; Byrnes, E.J.; Torres-Martinez, S.; Dietrich, F.S.; Keeling, P.J.; Heitman, J. Microsporidia evolved from ancestral sexual fungi. Curr. Biol. 2008, 18, 1675–1679. [Google Scholar] [CrossRef]
- Weiss, L.M.; Edlind, T.D.; Vossbrinck, C.R.; Hashimoto, T. Microsporidian molecular phylogeny: The fungal connection. J. Eukaryot. Microbiol. 1999, 46, 17S–18S. [Google Scholar]
- Tokarev, Y.S. Huang, W.F.; Solter, L.F.; Malysh, J.M.; Becnel, J.J.; Vossbrinck, C.R. A formal redefinition of the genera Nosema and Vairimorpha (Microsporidia: Nosematidae) and reassignment of species based on molecular phylogenetics. J. Invertebr. Pathol. 2020, 169, 107279. [Google Scholar] [CrossRef]
- Klee, J.; Besana, A.M.; Genersch, E.; Gisder, S.; Nanetti, A.; Tam, D.Q.; Chinh, T.X.; Puerta, F.; Ruz, J.M.; Kryger, P.; Message, D.; Hatjina, F.; Korpela, S.; Fries, I.; Paxton, R.J. Widespread dispersal of the microsporidian Nosema ceranae, an emergent pathogen of the western honey bee, Apis mellifera. J. Invertebr. Pathol. 2007, 96, 1–10. [Google Scholar] [CrossRef]
- Roberts, K.E.; Evison, S.E.F.; Baer, B.; Hughes, W.O.H. The cost of promiscuity: Sexual transmission of Nosema microsporidian parasites in polyandrous honey bees. Sci. Rep. 2015, 5, 10982. [Google Scholar] [CrossRef]
- Smith, M.L. The honey bee parasite Nosema ceranae: Transmissible via food exchange? PloS One 2012, 7. [Google Scholar] [CrossRef]
- Alaux, C.; Folschweiller, M.; McDonnell, C.; Beslay, D.; Cousin, M.; Dussaubat, C.; Brunet, J.L.; Conte, Y.L. Pathological effects of the microsporidium Nosema ceranae on honey bee queen physiology (Apis mellifera). J. Invertebr. Pathol. 2011, 106, 380–385. [Google Scholar] [CrossRef]
- Eiri, D.M.; Suwannapong, G.; Endler, M.; Nieh, J.C. Nosema ceranae can infect honey bee larvae and reduces subsequent adult longevity. PloS One 2015, 10. [Google Scholar] [CrossRef]
- Suwannapong, G.; Yemor, T.; Boonpakdee, C.; Benbow, M.E. Nosema ceranae, a new parasite in Thai honeybees.). J. Invertebr. Pathol. 2011, 106, 236–241. [Google Scholar] [CrossRef]
- Traver, B.E.; Fell, R.D. (2011). Nosema ceranae in drone honey bees (Apis mellifera). J. Invertebr. Pathol. 2011, 107, 107–3. [Google Scholar] [CrossRef]
- García-Palencia, P.; Martín-Hernández, R.; González-Porto, A.V.; Marin, P.; Meana, A.; Higes, M. Natural infection by Nosema ceranae causes similar lesions as in experimentally infected caged-worker honey bees (Apis mellifera). J. Apic. Res. 2010, 49(3), 278–283. [Google Scholar] [CrossRef]
- Naree, S.; Ellis, J.D.; Benbow, M.E.; Suwannapong, G. Experimental Nosema ceranae infection is associated with microbiome changes in the midguts of four species of Apis (honey bees). J. Apic. Res. 2022, 61, 435–447. [Google Scholar] [CrossRef]
- Ponkit, R.; Naree, S.; Mayack, C.L.; Suwannapong, G. The pathological effects of a Nosema ceranae infection in the giant honey bee, Apis dorsata Fabricius, 1793. J. Invertebr. Pathol. 2021, 185, 107672. [Google Scholar] [CrossRef] [PubMed]
- Yemor, T.; Phiancharoen, M.; Benbow, M.E.; Suwannapong, G. Effects of stingless bee propolis on Nosema ceranae infected Asian honey bees, Apis cerana. J. Apic. Res. 2016, 54, 468–473. [Google Scholar] [CrossRef]
- Fries, I.; Granados, R.R.; Morse, R.A. Intracellular germination of spores of Nosema apis Z. Apidologie 1992, 23, 61–70. [Google Scholar] [CrossRef]
- Kurze, C.; Le Conte, Y.; Dussaubat, C.; Erler, S.; Kryger, P.; Lewkowski, O.; Müller, T.; Widder, M.; Moritz, R.F.A. Nosema tolerant honeybees (Apis mellifera) escape parasitic manipulation of apoptosis. PloS One 2015, 10. [Google Scholar] [CrossRef] [PubMed]
- Naree, S.; Ponkit, R.; Chotiaroonrat, E.; Mayack, C.L.; Suwannapong, G. Propolis extract and chitosan improve health of Nosema ceranae infected giant honey bees, Apis dorsata Fabricius, 1793. Pathogens 2021, 10. [Google Scholar] [CrossRef]
- Ponkit, R.; Naree, S.; Pichayangkura, R.; Beaurepaire, A.; Paxton, R.J.; Mayack, C.L.; Suwannapong, G. Chito-oligosaccharide and propolis extract of stingless bees reduce the infection load of Nosema ceranae in Apis dorsata (Hymenoptera: Apidae). J. Fungi. 2023, 9. [Google Scholar] [CrossRef]
- Suwannapong, G.; Maksong, S.; Seanbualuang, P.; Benbow, M.E. Experimental infection of red dwarf honeybee, Apis florea, with Nosema ceranae. J. Asia-Pac. Entomol. 2010, 13, 361–364. [Google Scholar] [CrossRef]
- da Silva Araújo, K.S.; dos Santos Júnior, J.F.; Sato, M.O.; Finco, F.D.B.A.; Soares, I.M.; dos Santos Barbosa, R.; da Costa Alvim, T.; Ascêncio, S.D.; Mariano, S.M.B. Physicochemical properties and antioxidant capacity of propolis of stingless bees (Meliponinae) and Apis from two regions of Tocantins, Brazil. Acta Amaz. 2016, 46, 61–68. [Google Scholar] [CrossRef]
- Wagh, V.D. (2013). Propolis: A wonder bees product and its pharmacological potentials. Adv. Pharmacol. Sci. 2013, 2013, 308249. [Google Scholar] [CrossRef] [PubMed]
- Suwannapong, G. Honeybees of Thailand, Nova Science Publishers: New York, U.S.A., 2019; pp. 1–376.
- Bankova, V.S.; de Castro, S.L.; Marcucci, M.C. Propolis: Recent advances in chemistry and plant origin. Apidologie 2000, 31, 3–15. [Google Scholar] [CrossRef]
- Burdock, G.A. Review of the biological properties and toxicity of bee propolis (propolis). Food Chem. Toxicol. 1998, 36, 347–363. [Google Scholar] [CrossRef] [PubMed]
- Andrade, J.K.S.; Denadai, M.; de Oliveira, C.S.; Nunes, M.L.; Narain, N. Evaluation of bioactive compounds potential and antioxidant activity of brown, green and red propolis from Brazilian northeast region. Food Res. Int. 2017, 101, 129–138. [Google Scholar] [CrossRef] [PubMed]
- Bartolomeu, A.R.; Frión-Herrera, Y.; da Silva, L.M.; Romagnoli, G.G.; de Oliveira, D.E.; Sforcin, J.M. Combinatorial effects of geopropolis produced by Melipona fasciculata Smith with anticancer drugs against human laryngeal epidermoid carcinoma (HEp-2) cells. Biomed. Pharmacother. 2016, 81, 48–55. [Google Scholar] [CrossRef] [PubMed]
- Bittencourt, M.L.F.; Ribeiro, P.R.; Franco, R.L.P.; Hilhorst, H.W.M.; de Castro, R.D.; Fernandez, L.G. Metabolite profiling, antioxidant and antibacterial activities of Brazilian propolis: Use of correlation and multivariate analyses to identify potential bioactive compounds. Food Res. Int. 2015, 76, 449–457. [Google Scholar] [CrossRef] [PubMed]
- Cao, X.P.; Chen, Y.F.; Zhang, J.L.; You, M.M.; Wang, K.; Hu, F.L. (2017). Mechanisms underlying the wound healing potential of propolis based on its in vitro antioxidant activity. Phytomedicine 2017, 34, 76–84. [Google Scholar] [CrossRef]
- dos Santos, H.F.; Campos, J.F.; dos Santos, C.M.; Balestieri, J.B.P.; Silva, D.B.; Carollo, C.A.; de Picoli Souza, K.; Estevinho, L.M.; dos Santos, E.L. Chemical profile and antioxidant, anti-inflammatory, antimutagenic and antimicrobial activities of geopropolis from the stingless bee Melipona orbignyi. Int. J. Mol. Sci. 2017, 18. [Google Scholar] [CrossRef]
- Guzmán-Gutiérrez, S.L.; Nieto-Camacho, A.; Castillo-Arellano, J.I.; Huerta-Salazar, E.; Hernández-Pasteur, G.; Silva-Miranda, M.; Argüello-Nájera, O.; Sepúlveda-Robles, O.; Espitia, C.I.; Reyes-Chilpa, R. Mexican propolis: a source of antioxidants and anti-inflammatory compounds, and isolation of a novel chalcone and ε-caprolactone derivative. Molecules 2018, 23. [Google Scholar] [CrossRef]
- Molnár, S.; Mikuska, K.; Patonay, K.; Sisa, K.; Daood, H.G.; Némedi, E.; Kiss, A. Comparative studies on polyphenolic profile and antimicrobial activity of propolis samples selected from distinctive geographical areas of Hungary. Food Sci. Technol. Int. 2017, 23, 349–357. [Google Scholar] [CrossRef]
- Bankova, V. Chemical diversity of propolis and the problem of standardization. J. Ethnopharmacol. 2005, 100, 114–117. [Google Scholar] [CrossRef] [PubMed]
- Schmidt, J.O.; Buchmann, S.L. Other products of the hive. In The Hive and the Honey Bee, Graham, J.M., Ed.; Dadant & Sons: Illinois, U.S.A, 1992; pp. 927–988. [Google Scholar]
- Naree, S.; Benbow, M.E.; Suwannapong, G.; Ellis, J.D. Mitigating Nosema ceranae infection in western honey bee (Apis mellifera) workers using propolis collected from honey bee and stingless bee (Tetrigona apicalis) hives. J. Invertebr. Pathol. 2021, 185, 107666. [Google Scholar] [CrossRef]
- Naree, S.; Ellis, J.D.; Benbow, M.E.; Suwannapong, G. The use of propolis for preventing and treating Nosema ceranae infection in western honey bee (Apis mellifera Linnaeus, 1787) workers. J. Apic. Res. 2021, 60, 686–696. [Google Scholar] [CrossRef]
- Suwannapong, G.; Maksong, S.; Phainchajoen, M.; Benbow, M.E.; Mayack, C. Survival and health improvement of Nosema infected Apis florea (Hymenoptera: Apidae) bees after treatment with propolis extract. J. Asia-Pac. Entomol. 2018, 21, 437–444. [Google Scholar] [CrossRef]
- Mura, A.; Pusceddu, M.; Theodorou, P.; Angioni, A.; Floris, I.; Paxton, R.J.; Satta, A. Propolis consumption reduces Nosema ceranae infection of European honey bees (Apis mellifera). Insects 2020, 11. [Google Scholar] [CrossRef] [PubMed]
- Fries, I.; Chauzat, M.P.; Chen, Y.P.; Doublet, V.; Genersch, E.; Gisder, S.; Higes, M.; McMahon, D.P.; Martín-Hernández, R.; Natsopoulou, M.; Paxton, R.J.; Tanner, G.; Webster, T.C.; Williams, G.R. Standard methods for Nosema research. J. Apic. Res. 2013, 52, 1–28. [Google Scholar] [CrossRef]
- Cantwell, G.E. Standard method for counting Nosema spores. Am. Bee J. 1970, 110, 222–223. [Google Scholar]
- Katznelson, H.; Jamieson, C.A. Control of nosema disease of honeybees with fumagillin. Science 1952, 115, 70–71. [Google Scholar] [CrossRef]
- Liu, T.P. Effects of Fumidil B on the spore of Nosema apis and on lipids of the host cell as revealed by freeze-etching. J. Invertebr. Pathol. 1973, 22, 364–368. [Google Scholar] [CrossRef]
- Mendoza, Y.; Diaz-Cetti, S.; Ramallo, G.; Santos, E.; Porrini, M.; Invernizzi, C. Nosema ceranae winter control: Study of the effectiveness of different fumagillin treatments and consequences on the strength of honey bee (Hymenoptera: Apidae) colonies. J. Econ. Entomol. 2017, 110, 1–5. [Google Scholar] [CrossRef]
- Moretti, S.; Saluti, G.; Galarini, R. Residue determination in honey. In Honey Analysis, De Toledo, V.D.A.A., Ed.; IntechOpen: London, UK, 2017; pp. 325–365. [Google Scholar] [CrossRef]
- Simone-Finstrom, M.; Borba, R.S.; Wilson, M.; Spivak, M. Propolis counteracts some threats to honey bee health. Insects 2017, 8. [Google Scholar] [CrossRef] [PubMed]
- van den Heever, J.P.; Thompson, T.S.; Otto, S.J.G.; Curtis, J.M.; Ibrahim, A.; Pernal, S.F. The effect of dicyclohexylamine and fumagillin on Nosema ceranae-infected honey bee (Apis mellifera) mortality in cage trial assays. Apidologie 2016, 47, 663–670. [Google Scholar] [CrossRef]
- Williams, G.R.; Sampson, M.A.; Shutler, D.; Rogers, R.E.L. (2008). Does fumagillin control the recently detected invasive parasite Nosema ceranae in western honey bees (Apis mellifera)? J. Invertebr. Pathol. 2008, 99, 342–344. [Google Scholar] [CrossRef] [PubMed]
- Ptaszynska, A.A.; Borsuk, G.; Mulenko, W.; Olszewski, K. (2013). Impact of ethanol on Nosema spp. infected bees. Med. Weter. 2013, 69, 736–740. [Google Scholar]
- Mustard, J.A.; Oquita, R.; Garza, P.; Stoker, A. Honey bees (Apis mellifera) show a preference for the consumption of ethanol. Alcohol. Clin. Exp. Res. 2019, 43, 26–35. [Google Scholar] [CrossRef] [PubMed]
- Aboody, M.S.A.; Mickymaray, S. Antifungal efficacy and mechanisms of flavonoids. Antibiotics 2020, 9. [Google Scholar] [CrossRef] [PubMed]
- Ghannoum, M.A.; Rice, L.B. Antifungal agents: Mode of action, mechanisms of resistance, and correlation of these mechanisms with bacterial resistance. Clin. Microbiol. Rev. 1999, 12, 501–517. [Google Scholar] [CrossRef]
- Walker, G.M.; White, N.A. Introduction to fungal physiology. In Fungi, Kavanagh, K., Ed.; John Wiley & Sons, Ltd.: Chichester, UK, 2005; pp. 1–34. [Google Scholar] [CrossRef]
- Lagrouh, F.; Dakka, N.; Bakri, Y. The antifungal activity of Moroccan plants and the mechanism of action of secondary metabolites from plants. J. Mycol. Med. 2017, 27, 303–311. [Google Scholar] [CrossRef]
- Cushnie, T.P.T.; Lamb, A.J. Antimicrobial activity of flavonoids. Int. J. Antimicrob. Agents 2005, 26, 343–356. [Google Scholar] [CrossRef]
- Yun, D.G.; Lee, D.G. Silymarin exerts antifungal effects via membrane-targeted mode of action by increasing permeability and inducing oxidative stress. Biochim. Biophys. Acta, Biomembr. 2017, 1859, 467–474. [Google Scholar] [CrossRef]
- Burges, H.D.; Canning, E.U.; Hulls, I.K. Ultrastructure of Nosema oryzaephili and the taxonomic value of the polar filament. J. Invertebr. Pathol. 1974, 23, 135–139. [Google Scholar] [CrossRef] [PubMed]
- Fries, I. Observations on the development and transmission of Nosema apis Z. in the ventriculus of the honeybee. J. Apic. Res. 1989, 28, 107–117. [Google Scholar] [CrossRef]
- Liu, T.P. The fine structure of the frozen-etched spore of Nosema apis zander. Tissue Cell 1973, 5, 315–322. [Google Scholar] [CrossRef] [PubMed]
- Liu, T.P.; Liu, H.J. Evaluation of some morphological characteristics of spores of two species of microsporida by scanning electron microscope and freeze-etching techniques. J. Morphol. 1974, 143, 337–347. [Google Scholar] [CrossRef] [PubMed]
- Fries, I.; Feng, F.; da Silva, A.; Slemenda, S.B.; Pieniazek, N.J. Nosema ceranae n. Sp. (Microspora, Nosematidae), morphological and molecular characterization of a microsporidian parasite of the Asian honey bee Apis cerana (Hymenoptera, Apidae). Eur. J. Protistol. 1996, 32, 356–365. [Google Scholar] [CrossRef]
- Prouty, C.; Jack, C.; Sagili, R.; Ellis, J.D. Evaluating the efficacy of common treatments for Vairimorpha (Nosema) spp. control. Appl. Sci. 2023, 13. [Google Scholar] [CrossRef]
|
Disclaimer/Publisher’s Note: The statements, opinions and data contained in all publications are solely those of the individual author(s) and contributor(s) and not of MDPI and/or the editor(s). MDPI and/or the editor(s) disclaim responsibility for any injury to people or property resulting from any ideas, methods, instructions or products referred to in the content. |
© 2024 by the authors. Licensee MDPI, Basel, Switzerland. This article is an open access article distributed under the terms and conditions of the Creative Commons Attribution (CC BY) license (https://creativecommons.org/licenses/by/4.0/).
