1. Introduction
Because of their ubiquity in the global environment, persistence, and toxicity, PFAS are a family of water-soluble anthropogenic pollutants of growing worldwide concern with at least one perfluoroalkyl moiety (CnF2n+1–) (Adu et al., 2023; George and Dixit, 2021). Since the mid-twentieth century, PFAS have been widely utilized in a variety of goods, including textile coatings, surfactants, insecticides, food contact materials, and fire-fighting foams (George and Dixit, 2021; Wang et al., 2021). PFAS, in contrast to other common environmental toxins, has high-energy C-F bonds that have stable physicochemical features (such as low surface tension) and are difficult to hydrolyze, photolyze, and biodegrade (Cao et al., 2023).
Because of the widespread use and disposal of PFASs, as well as the bio-accumulative, persistent, mobile, and poisonous properties of many members of this family of compounds, contamination from PFASs is a pressing environmental hazard (Charbonnet et al., 2021). Continuous PFAS emission causes amounts in the environment to accumulate, increasing the likelihood of detrimental impacts (Sosnowska et al., 2023). PFAS may harm thyroid function, sex hormone levels (e.g., low testosterone), high estradiol levels, pregnancy-induced hypertension, and birth weight concerns (Ordonez et al., 2022).
ML has been utilized in the water distribution and quality areas in a variety of methods for improvement, pattern discovery, demand forecast, and leak detection (Ayati et al., 2022; García et al., 2023; Panigrahi et al., 2023; Xu et al., 2022; Almousa et al., 2023). Large volumes of data from databases such as the United States Geologic Survey (USGS) and National Water Information System (NWIS); experimental data, and other reputable sources have been analyzed for this purpose (Hu et al., 2022). Jiang et al., (2021) used an artificial neural network (ANN) to predict the performance of different metal oxide photocatalysts on a wide range of water contaminants. Banerjee et al., (2022) used Linear Regression (LR), Support Vector Machine (SVM), Decision trees regression, and Lasso regression models to predict water contamination based on the coordinates of the area. Ragi et al., (2019) used the Levenberg-Marquardt algorithm, a mix of gradient descent and Gauss-Newton algorithm to predict water quality parameters using data from the Pollution Control board.
Several attempts have been made to model PFAS transport in water. Zeng et al., (2021) used the one-dimensional (1D) Richards equation to investigate the primary factors that control the long-term retention of PFAS in the vadose zone. Brusseau et al., (2021) used both a one-dimensional model that considers transient, variably saturated flow and advective and dispersive transport; and non-linear rate-limited solid-phase sorption, and non-linear rate-limited air-water interfacial adsorption to investigate the influence of surfactant-induced flow on PFAS transport. (Guo et al., 2022) developed a simplified model to quantify PFAS leaching in the vadose zone and mass discharge to groundwater. The influence of the hydrophilic head group and other molecular components on PFAS interfacial partitioning was predicted by Le et al., (2021).
A critical review on the modeling of PFAS in the soil-water environment was published by Sima, et al, (2021). While this was a very detailed and substantial amount of work, some important areas of modeling were not covered. For example, the application of machine learning to understand PFAS distribution in both surface water and groundwater was not covered. Also, the focus of the review is the use of mathematical models to understand PFAS. Our review was motivated by the need to provide a complete overview of the use of machine learning to better understand PFAS, both from a source and methodological standpoint. This section also contains overview figures and tables for all data sources, which readers can use to rapidly analyze the field.
This review includes over 100 recent studies on a wide range of machine learning applications for understanding PFAS in water. To find relevant contributions, Google Scholar searched for works containing the terms (ʺPFASʺ ʺWaterʺ and ʺMachine learningʺ).
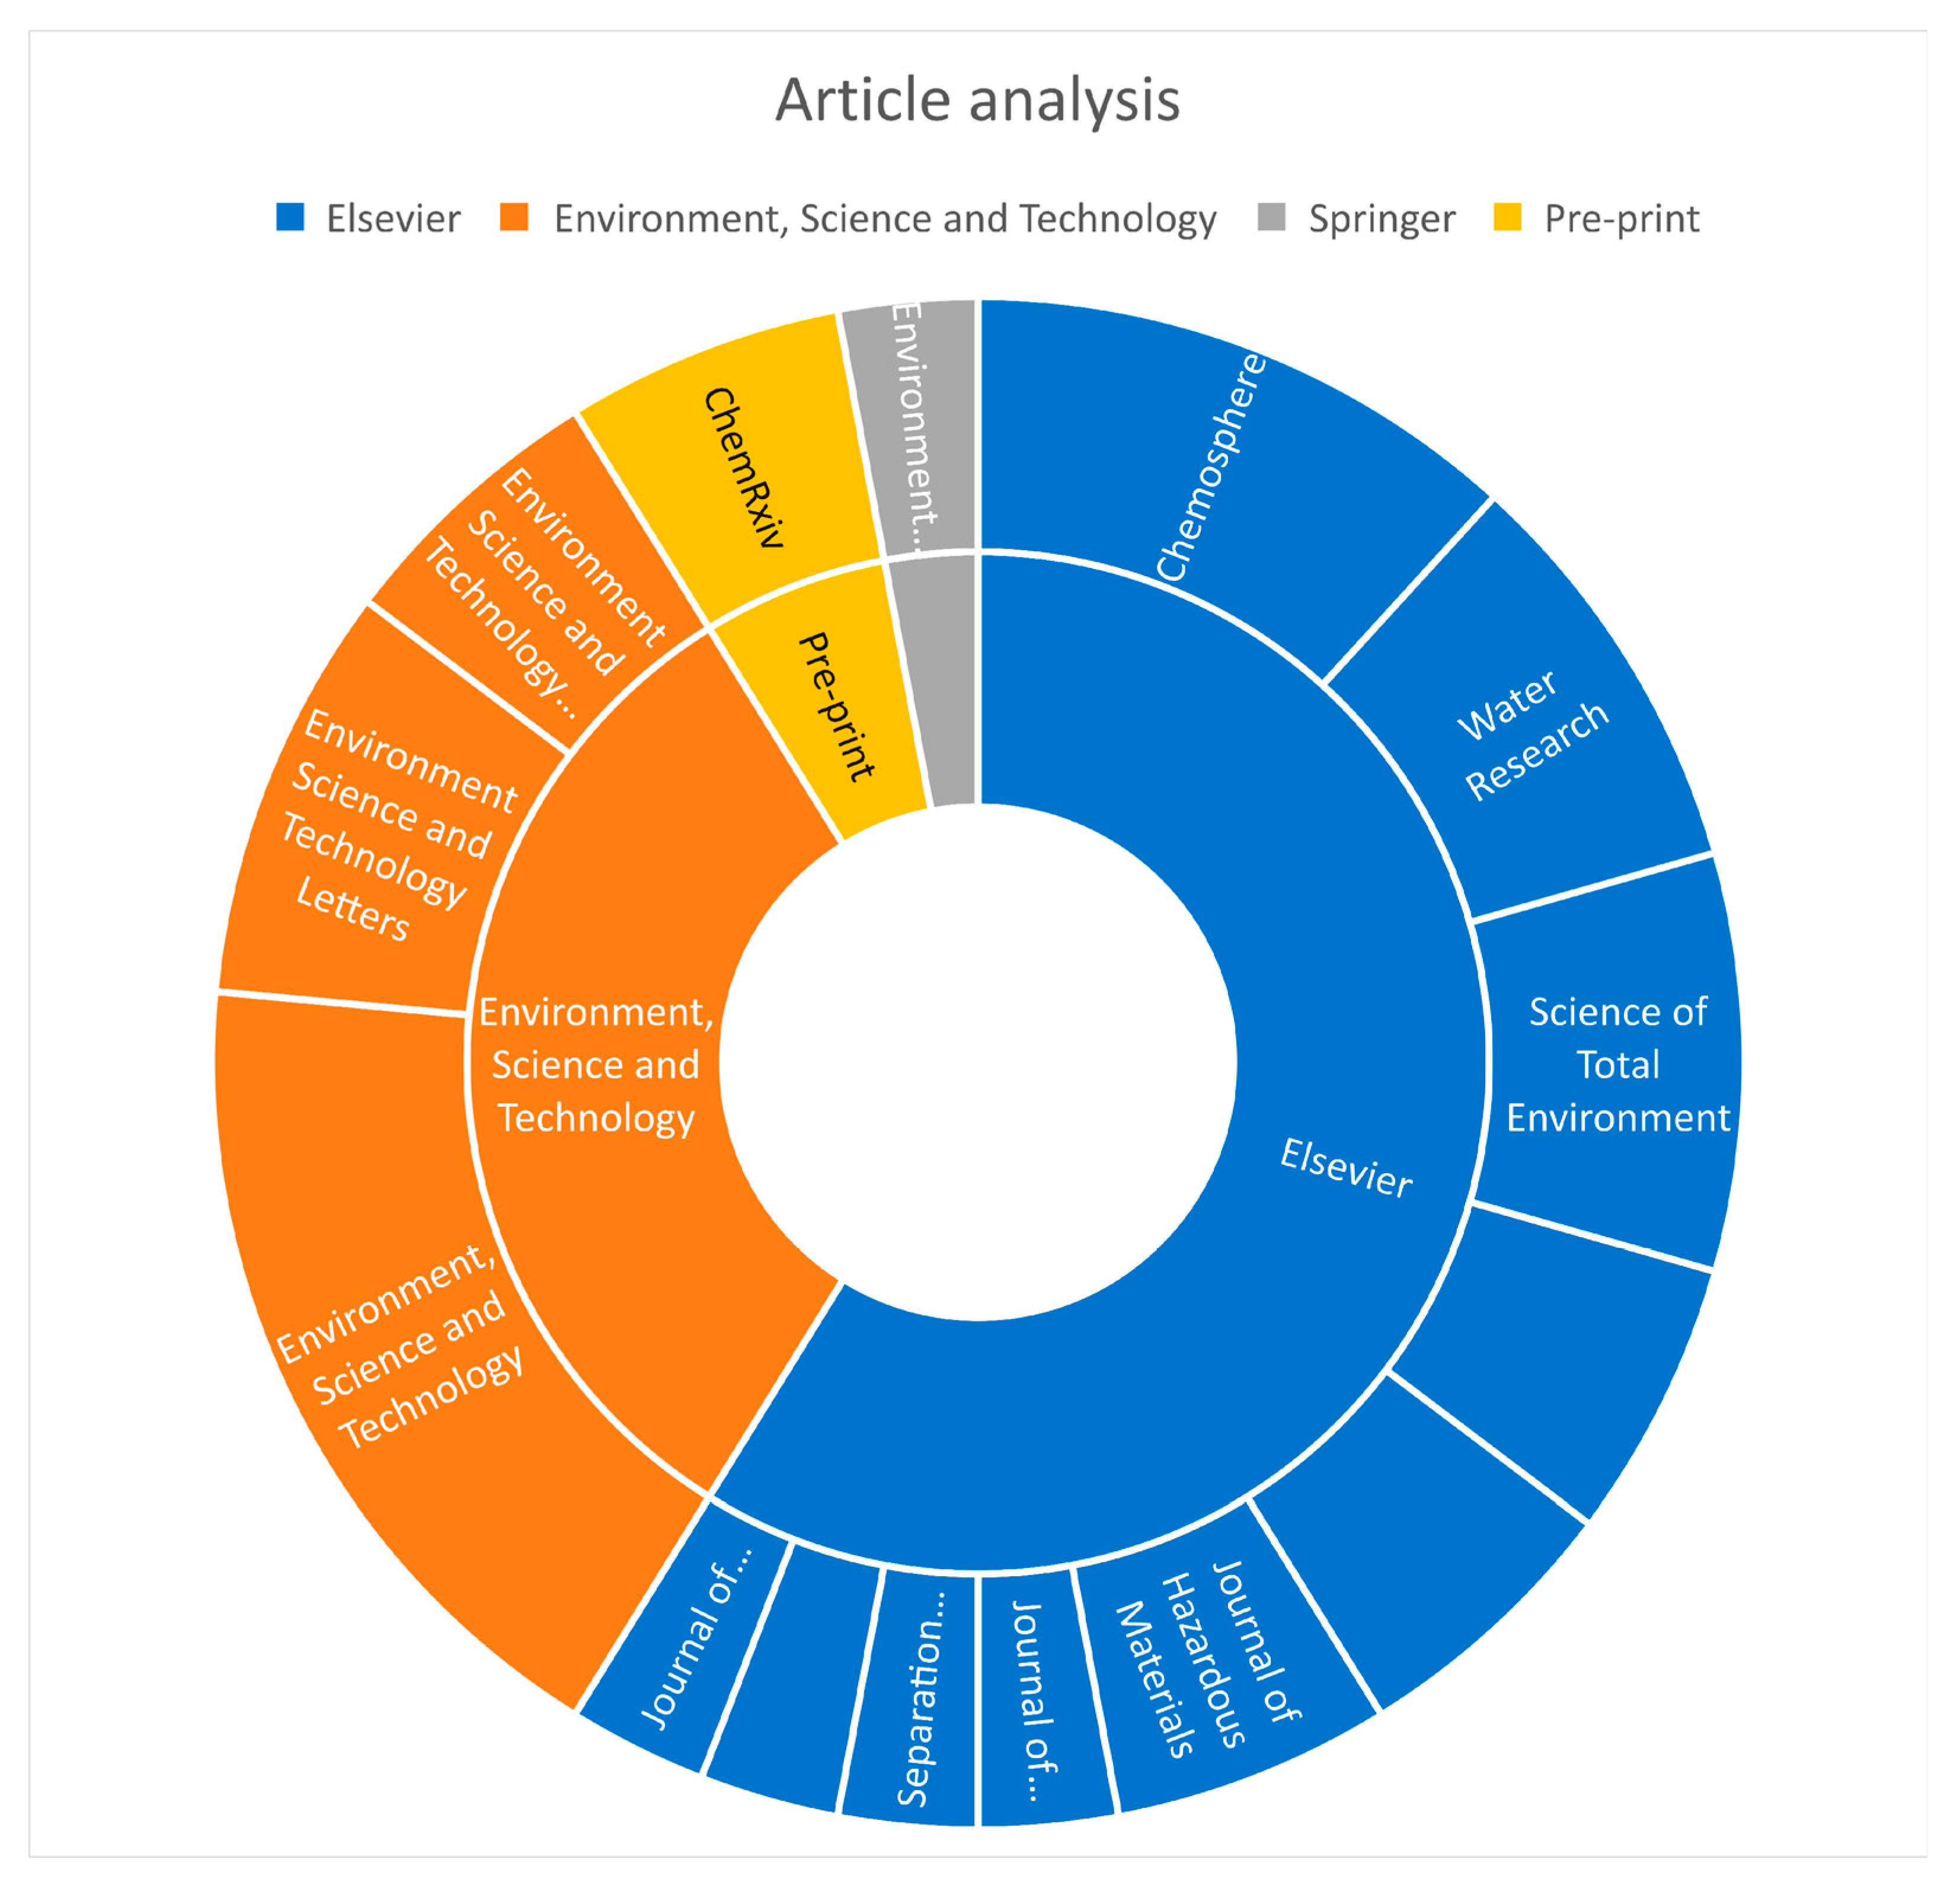
Figure 2 is a chart that shows the sources of journals used in this review. Elsevier and Environmental Science and Technology journals are the most common journals that have published articles on PFAS studies using machine learning. There is an article from Springer and two pre-prints are also found to contain useful information on this subject. We reviewed the references in all of the publications we chose and spoke with experts in the field of data science and environmental contaminants.
Overview of Machine Learning Models
The purpose of this section is to provide a formal introduction and definition of the machine learning ideas, methodologies, and architectures that we discovered in the studies on Poly- and Perfluoroalkyl compounds in water that we reviewed for this work.
Figure 3 below shows the machine learning process flowchart. This was designed to let users know which algorithm to use for PFAS studies.
Machine Learning Algorithms
Supervised learning is a machine learning method distinguished by the use of labeled datasets. These datasets are intended to train or ʺsuperviseʺ algorithms to accurately classify data or forecast outcomes using labeled inputs and outputs. They are divided further into classification and regression. An algorithm is used in classification problems to assign test data to specific categories accurately. Classification methods include linear classifiers, support vector machines, decision trees, and random forests. Regression employs an algorithm to determine the relationship between dependent and independent variables. Regression models are useful for predicting numerical values from various data sources. Linear regression, logistic regression, and polynomial regression are some popular regression algorithms.
Where n is the size of the dataset, Rd is the d-dimensional feature space, Xi is the feature vector of the ith example, yi is the label or output of the ith example, and ∁ is the space of all possible labels.
Unsupervised learning analyzes and clusters unlabeled data sets using machine learning methods. These algorithms find hidden patterns in data without the need for human interaction. They are mostly used for clustering, association, and dimensionality reduction. Unlabeled data is clustered based on similarities and differences. For example, K-means clustering algorithms divide related data points into groups, where the K value defines the size and granularity of the grouping. Association employs several rules to discover links between variables in a given dataset. When the number of features in a given dataset is too large, dimensionality reduction is utilized. It decreases the quantity of data inputs to a tolerable number while maintaining data integrity. This approach is frequently utilized in the data pre-processing step.
Linear Regression (LR)
Linear regression is a type of supervised machine learning algorithm that computes the linear relationship between a dependent variable and one or more independent features and it is typically leveraged to make predictions about future outcomes. Consider a dataset of real-values vectors:
Each input vector is associated with a real value yi:
A linear regression model assumes that it’s possible to approximate the output values through a regression process based on the rule:
Naïve Bayes
The Bayes Theoremʹs premise of class conditional independence is used in the Naive Bayes classification technique. This means that the existence of one feature has no effect on the presence of another in the probability of a particular event, and each predictor has the same effect on that outcome. Multinomial Nave Bayes, Bernoulli Nave Bayes, and Gaussian Nave Bayes are the three types of Nave Bayes classifiers. This method is most commonly employed in text classification, spam detection, and recommendation systems.
Where P(x|c) is the probability of likelihood of an event happening, P(c|x) is the posterior probability, P(c) is the class prior probability, P(x) is the predictor prior probability.
Logistic Regression (LogReg)
This is a supervised machine learning algorithm used for binary classification problems. It is used when the dependent variable is binary. It is used to explain the relationship between one dependent binary variable and one or more independent variables. Logistic regression uses a logistic function to model a binary output variable.
K-Nearest Neighbor (KNN)
The KNN algorithm, commonly known as the KNN classification algorithm, is a non-parametric algorithm that classifies data points based on their closeness and association to other accessible data. This technique believes that data points with similar characteristics can be found nearby. As a result, it attempts to determine the distance between data points, typically using Euclidean distance, and then assigns a category based on the most frequently occurring category or average.
Given a dataset containing labeled training measurements (x,y), we want to find a function h:X → Y that can positively predict the identical output y in the presence of an unknown observation x.
The input x is assigned the class with the largest probability.
Support Vector Machine (SVM)
This is an example of supervised learning that is used for both data classification and regression. It is often used for classification problems, producing a hyperplane with the greatest distance between two classes of data points. This hyperplane is known as the decision boundary, and it separates the data point classes (for example, oranges vs. apples) on either side of the plane. Consider the function of a line y = ax + b. We rename x with x1 and y with x2
This equation is derived from two-dimensional vectors. But in fact, it also works for any number of dimensions. This is the equation of the hyperplane.
The hypothesis function is then defined as
Decision Trees (DT) and Random Forest (RF)
A decision tree is an efficient approach for describing how to traverse a dataset while also establishing a tree-like path to the predicted outcomes. A root node, which is the most essential dividing property, can establish the structure of a decision tree. Internal nodes are attribute testing. For example, if an internal node has a control statement (PFAS level 25ppt), then the data points satisfying this condition are on one side and the remainder on the other. The leaf nodes indicate the datasetʹs accessible classes.
Random Forest is used for both classification and regression. The term ʺforestʺ refers to a group of uncorrelated decision trees that are subsequently combined to reduce variance and produce more accurate data predictions. For a random tree forest Tb
Classification: Let C^b(x) be the class prediction of the bth random
Graph Convolutional Networks (GCN)
This model learns a function of features on a graph G=(V, E) with xi as input for every node I; summarized in a N×D feature matrix X(N: number of nodes, D: number of input features) and a representative description of the graph structure A and produces a node-level output Z( an N×F feature matrix, where F is the number of output features per node). Every neural network layer can then be written as a non-linear function
With H(0)=X and H(L)=Z and L being the number of layers.
Gradient Boosting (GB)
Gradient Boosting is a powerful boosting approach that combines numerous weak learners into strong learners by using gradient descent to train each new model to minimize the loss function of the preceding model, such as mean squared error or cross-entropy. In each iteration, the approach computes the gradient of the loss function concerning the predictions of the current ensemble and then trains a new weak model to minimize this gradient. The new modelʹs predictions are then added to the ensemble, and the procedure is repeated until a stopping threshold is fulfilled.
Nonnegative Matrix Factorization + k-Means Clustering (NMFk)
NMFk is a revolutionary unsupervised machine learning methodology for automatically identifying the optimal number of features (signals/signatures) in data. It is an estimate. It calculates the number of features k using k-means clustering and regularization constraints.
Clustering
Clustering is a data mining technique that organizes unlabeled data based on similarities or differences. Clustering techniques are used to sort raw, unclassified data objects into groups represented by structures or patterns in the data. Categories of clustering algorithms are as follows: Exclusive, Overlapping, Hierarchical, and Probabilistic clustering.
Exclusive clustering is a type of grouping in which a data point can only reside in one cluster. K-means clustering is a common example of an exclusive clustering approach in which data points are assigned to one of the K groups depending on their distance from the centroid of each group. The data points closest to a specific centroid will be grouped. A higher K value indicates smaller groupings with more granularity, whereas a lower K value indicates bigger groupings with less granularity.
Overlapping clusters are distinct from exclusive clustering in that they allow data points to belong to many clusters with different degrees of membership. An example is ʺsoftʺ or fuzzy k-means clustering.
Hierarchical clustering, also known as hierarchical cluster analysis (HCA), is an unsupervised clustering algorithm in which data points are initially isolated as separate groupings and then merged iteratively based on similarity until one cluster is achieved (agglomerative), or a single data cluster is divided based on data point differences (divisive).
A probabilistic model is an unsupervised strategy that aids in the resolution of density estimation or ʺsoftʺ clustering problems. Data points are clustered in probabilistic clustering based on their likelihood of belonging to a specific distribution. One of the most often used probabilistic clustering algorithms is the Gaussian Mixture Model (GMM).
Principal Component Analysis (PCA)
Principal component analysis (PCA) is a dimensionality reduction algorithm that uses feature extraction to eliminate redundancies and compress datasets. A linear transformation is used in this method to generate a new data representation, generating a set of ʺprincipal components.ʺ The first principal component is the direction that maximizes the datasetʹs variance. While the second main component finds the most variance in the data, it is fully uncorrelated to the first, producing a direction that is perpendicular, or orthogonal, to the first. This process is repeated for each dimension, with the next principal component being the direction orthogonal to the prior components with the largest variance.
Semi-Supervised Learning
Semi-supervised learning provides a comfortable middle ground between supervised and unsupervised learning. It employs a smaller labeled data set to aid classification and feature extraction from a larger, unlabeled data set during training. Semi-supervised learning can address the issue of insufficient labeled data for a supervised learning algorithm. It also helps if labeling enough data is expensive.
Neural Networks
This is also known as artificial neural networks (ANN). They are comprised of node layers, containing an input layer, one or more hidden layers, and an output layer. Each node, or artificial neuron, connects to another and has an associated weight and threshold. If the output of any individual node is above the specified threshold value, that node is activated, sending data to the next layer of the network. Otherwise, no data is passed along to the next layer of the network. Neural networks rely on training data to learn and improve their accuracy over time. It is the foundation on which deep learning is built.
Deep Neural Networks (DNN)
It is identical to stacked neural networks, which are networks made up of several layers, usually two or more, with input, output, and at least one hidden layer in between. A DNN is made up of layers with mathematical relationships, such as nodes and edges. Backpropagation is used during data training to update these associations. The revised relationships are then employed as equations to predict the output variables depending on the input variables after training.
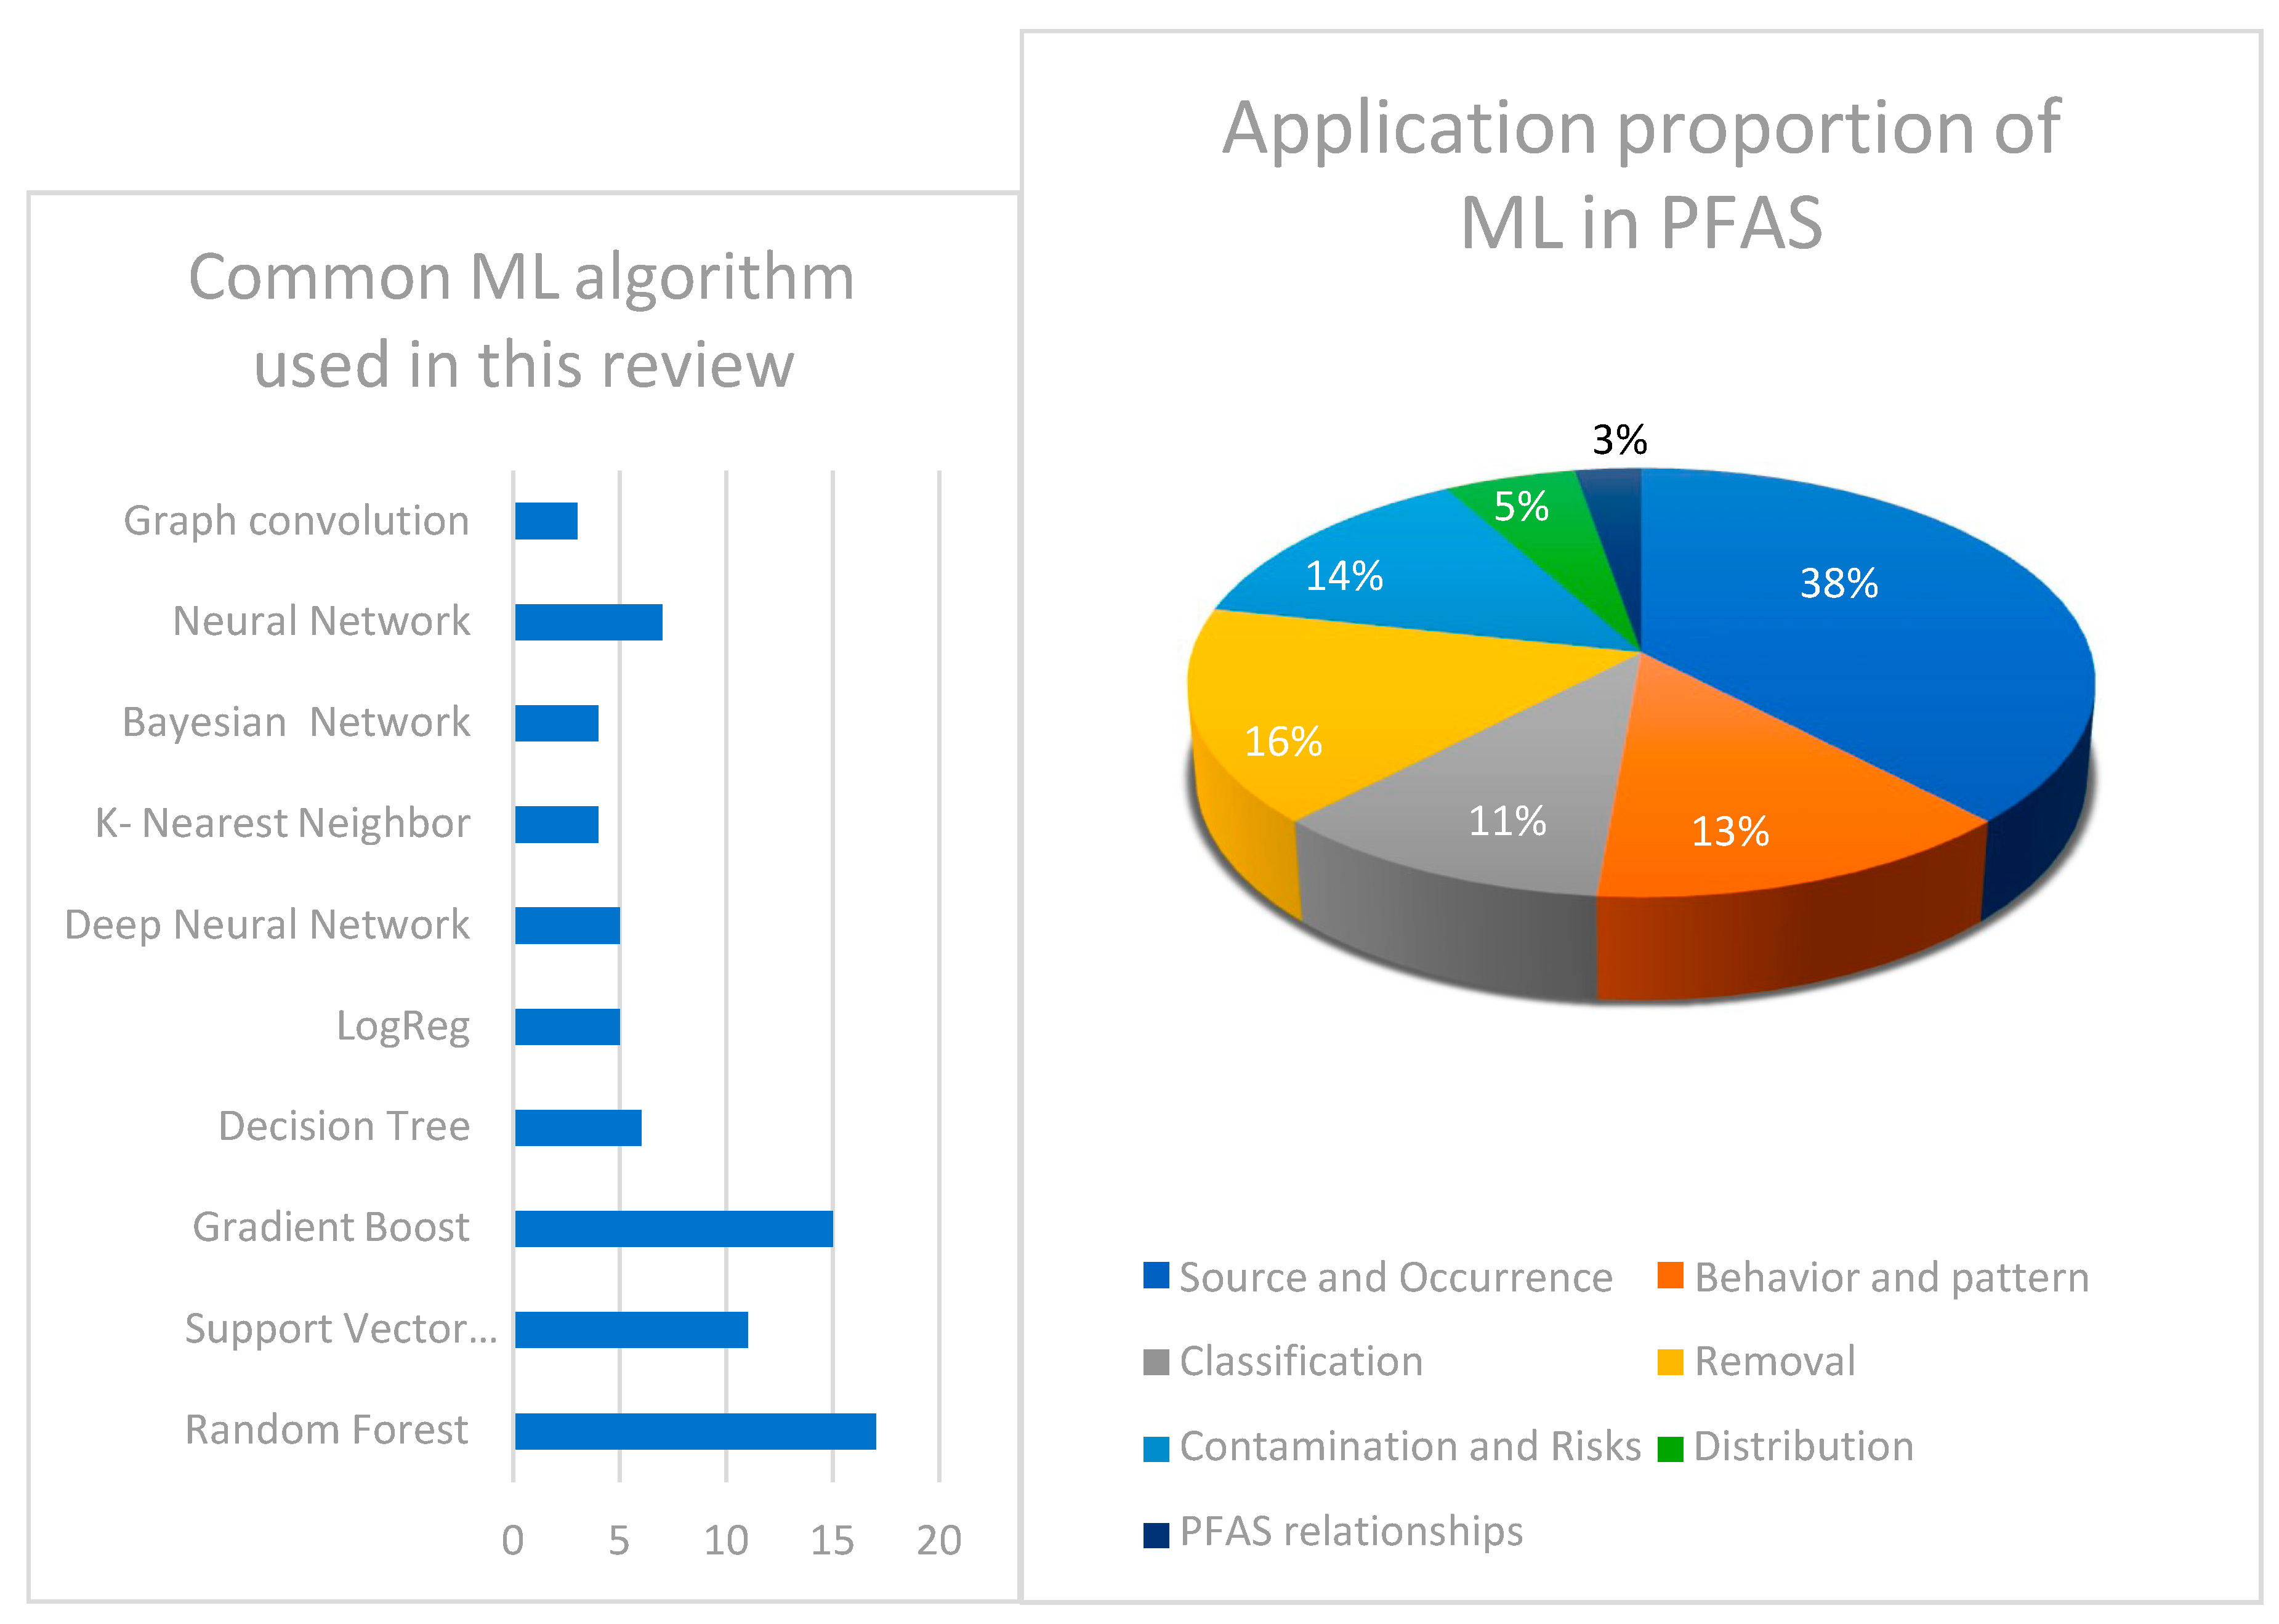
Figure 4.
The proportion of (a) machine learning algorithms used and (b) their application areas in PFAS-related research.
Figure 4.
The proportion of (a) machine learning algorithms used and (b) their application areas in PFAS-related research.
Machine Learning Uses in PFAS
Data Source
The various works being considered for this review have several sources of data. It is essential to have access to data from reliable sources before engaging in ML. The origin of the data, as well as the integrity of the data, are factors that determine the acceptability of ML-related experiments. It is important to clean data for consistency and appropriate decisions have to be made on the necessary cleaning tools to employ.
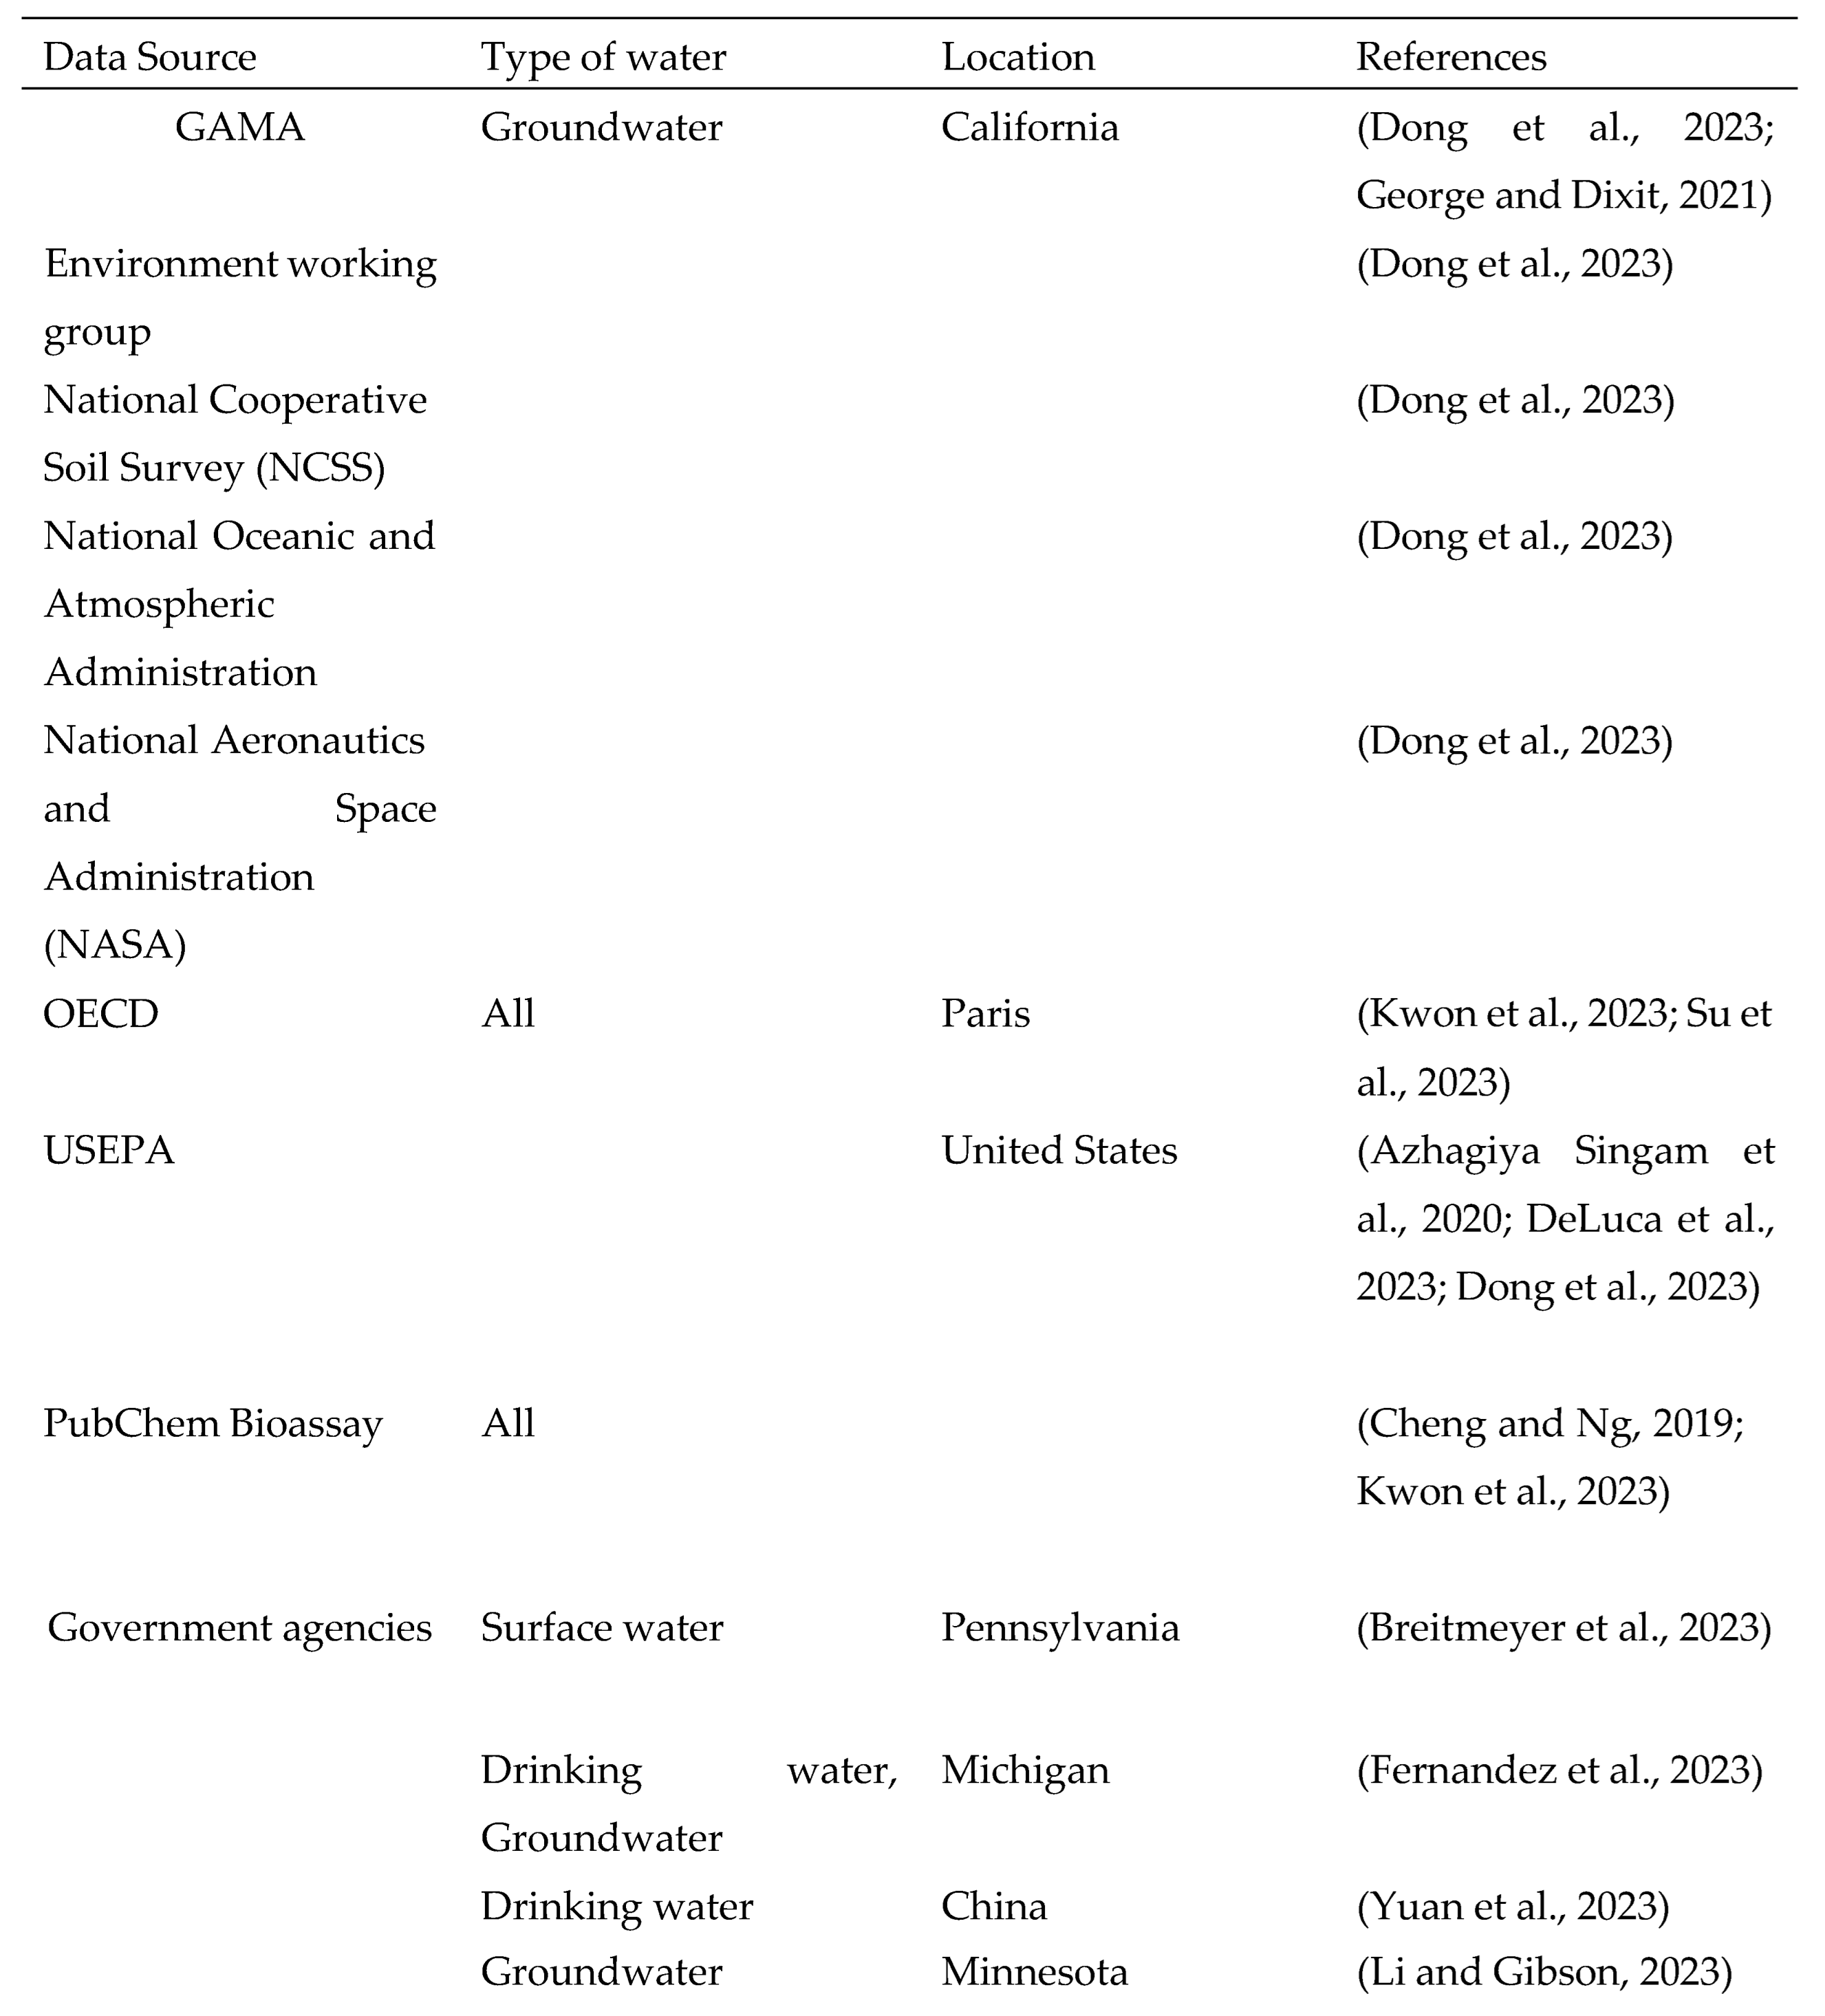
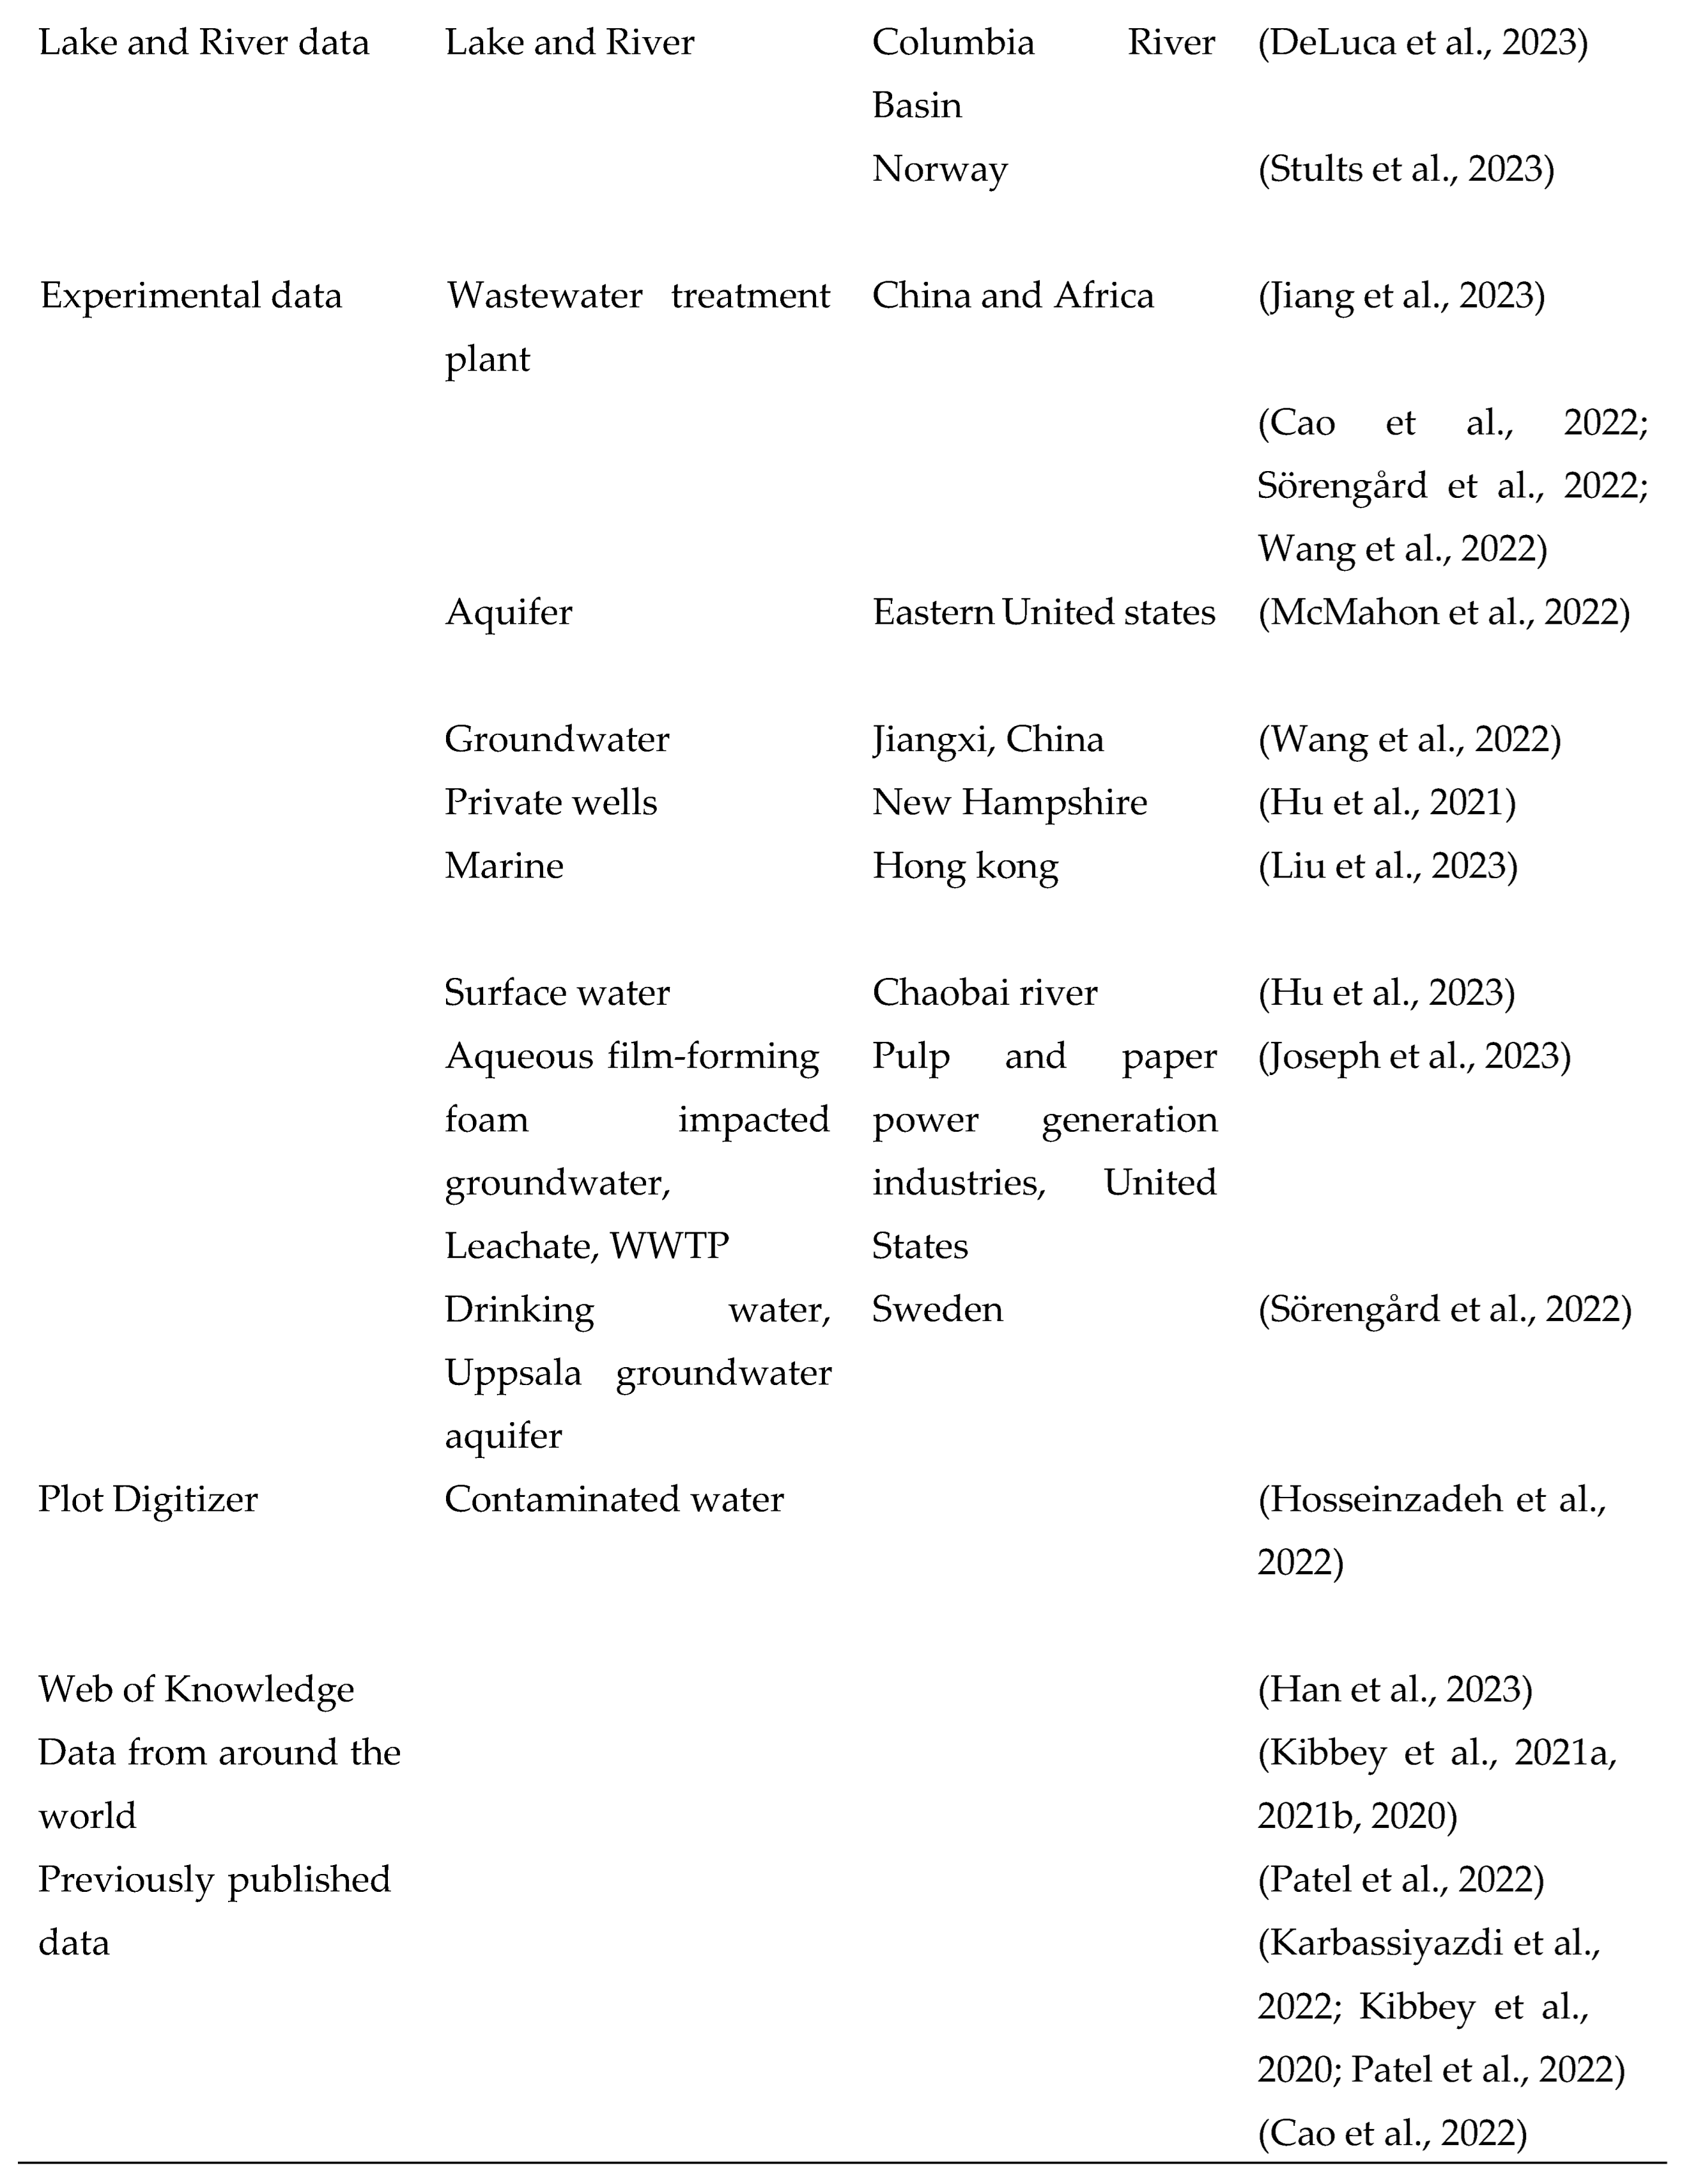
Several data sources have been identified in this review. They include the Groundwater Ambient Monitoring Assessment Program (GAMA) database. The GAMA database is California’s comprehensive groundwater quality monitoring program created by the state Water Resources Control Board in 2000. George and Dixit, (2021) used GAMA data to perform a predictive model on prioritizing groundwater testing for all wells in California. Dong et al., (2023) used 12 groundwater data to predict 35 target PFAS in California.
The Organization for Economic Co-operation and Development (OECD) database is another source of data that has been used by researchers to better understand PFAS. Cheng, W., (2021) used OECD data to develop In-Silico tools to predict PFAS substances in biological systems. Su et al., (2023) performed PFAS screening by clustering and classification using OECD data. Kwon et al., (2023) predicted bioactivities of PFAS. Other data sources include the United states environmental protection agency’s water quality portal (USEPA) (Azhagiya Singam et al., 2020; DeLuca et al., 2023; Dong et al., 2023), PubChem Bioassay Database (Kwon et al., 2023), Pennsylvania Water quality network (Breitmeyer et al., 2023), from previously published studies on PFAS (Karbassiyazdi et al., 2022; Kibbey et al., 2020; Patel et al., 2022), lake and river data (Antell et al., 2023; Stults et al., 2023), Minnesota department of health (MDH) Government agency data (Breitmeyer et al., 2023; Fernandez et al., 2023; Li and Gibson, 2023) and experimental data (Cao et al., 2022; Sörengård et al., 2022; Wang et al., 2022). Some authors combined several public data for their machine learning predictions. Dong et al., (2023, p. 35) used data from several public data (GAMA, USEPA, Environmental Working Group (EWG), National Co-operative Soil Survey (NCSS), National Oceanic and Atmospheric Administration (NOAA), Sustainable Groundwater Management Act (SGMA) and National Aeronautics and Space Administration (NASA)). Feinstein et al., (2021) combined data from USEPA, NIH, and National Toxicology program datasets.
Table 1.
Data sources of works of literature used in this review.
Table 1.
Data sources of works of literature used in this review.
Implementation Details of the Methods
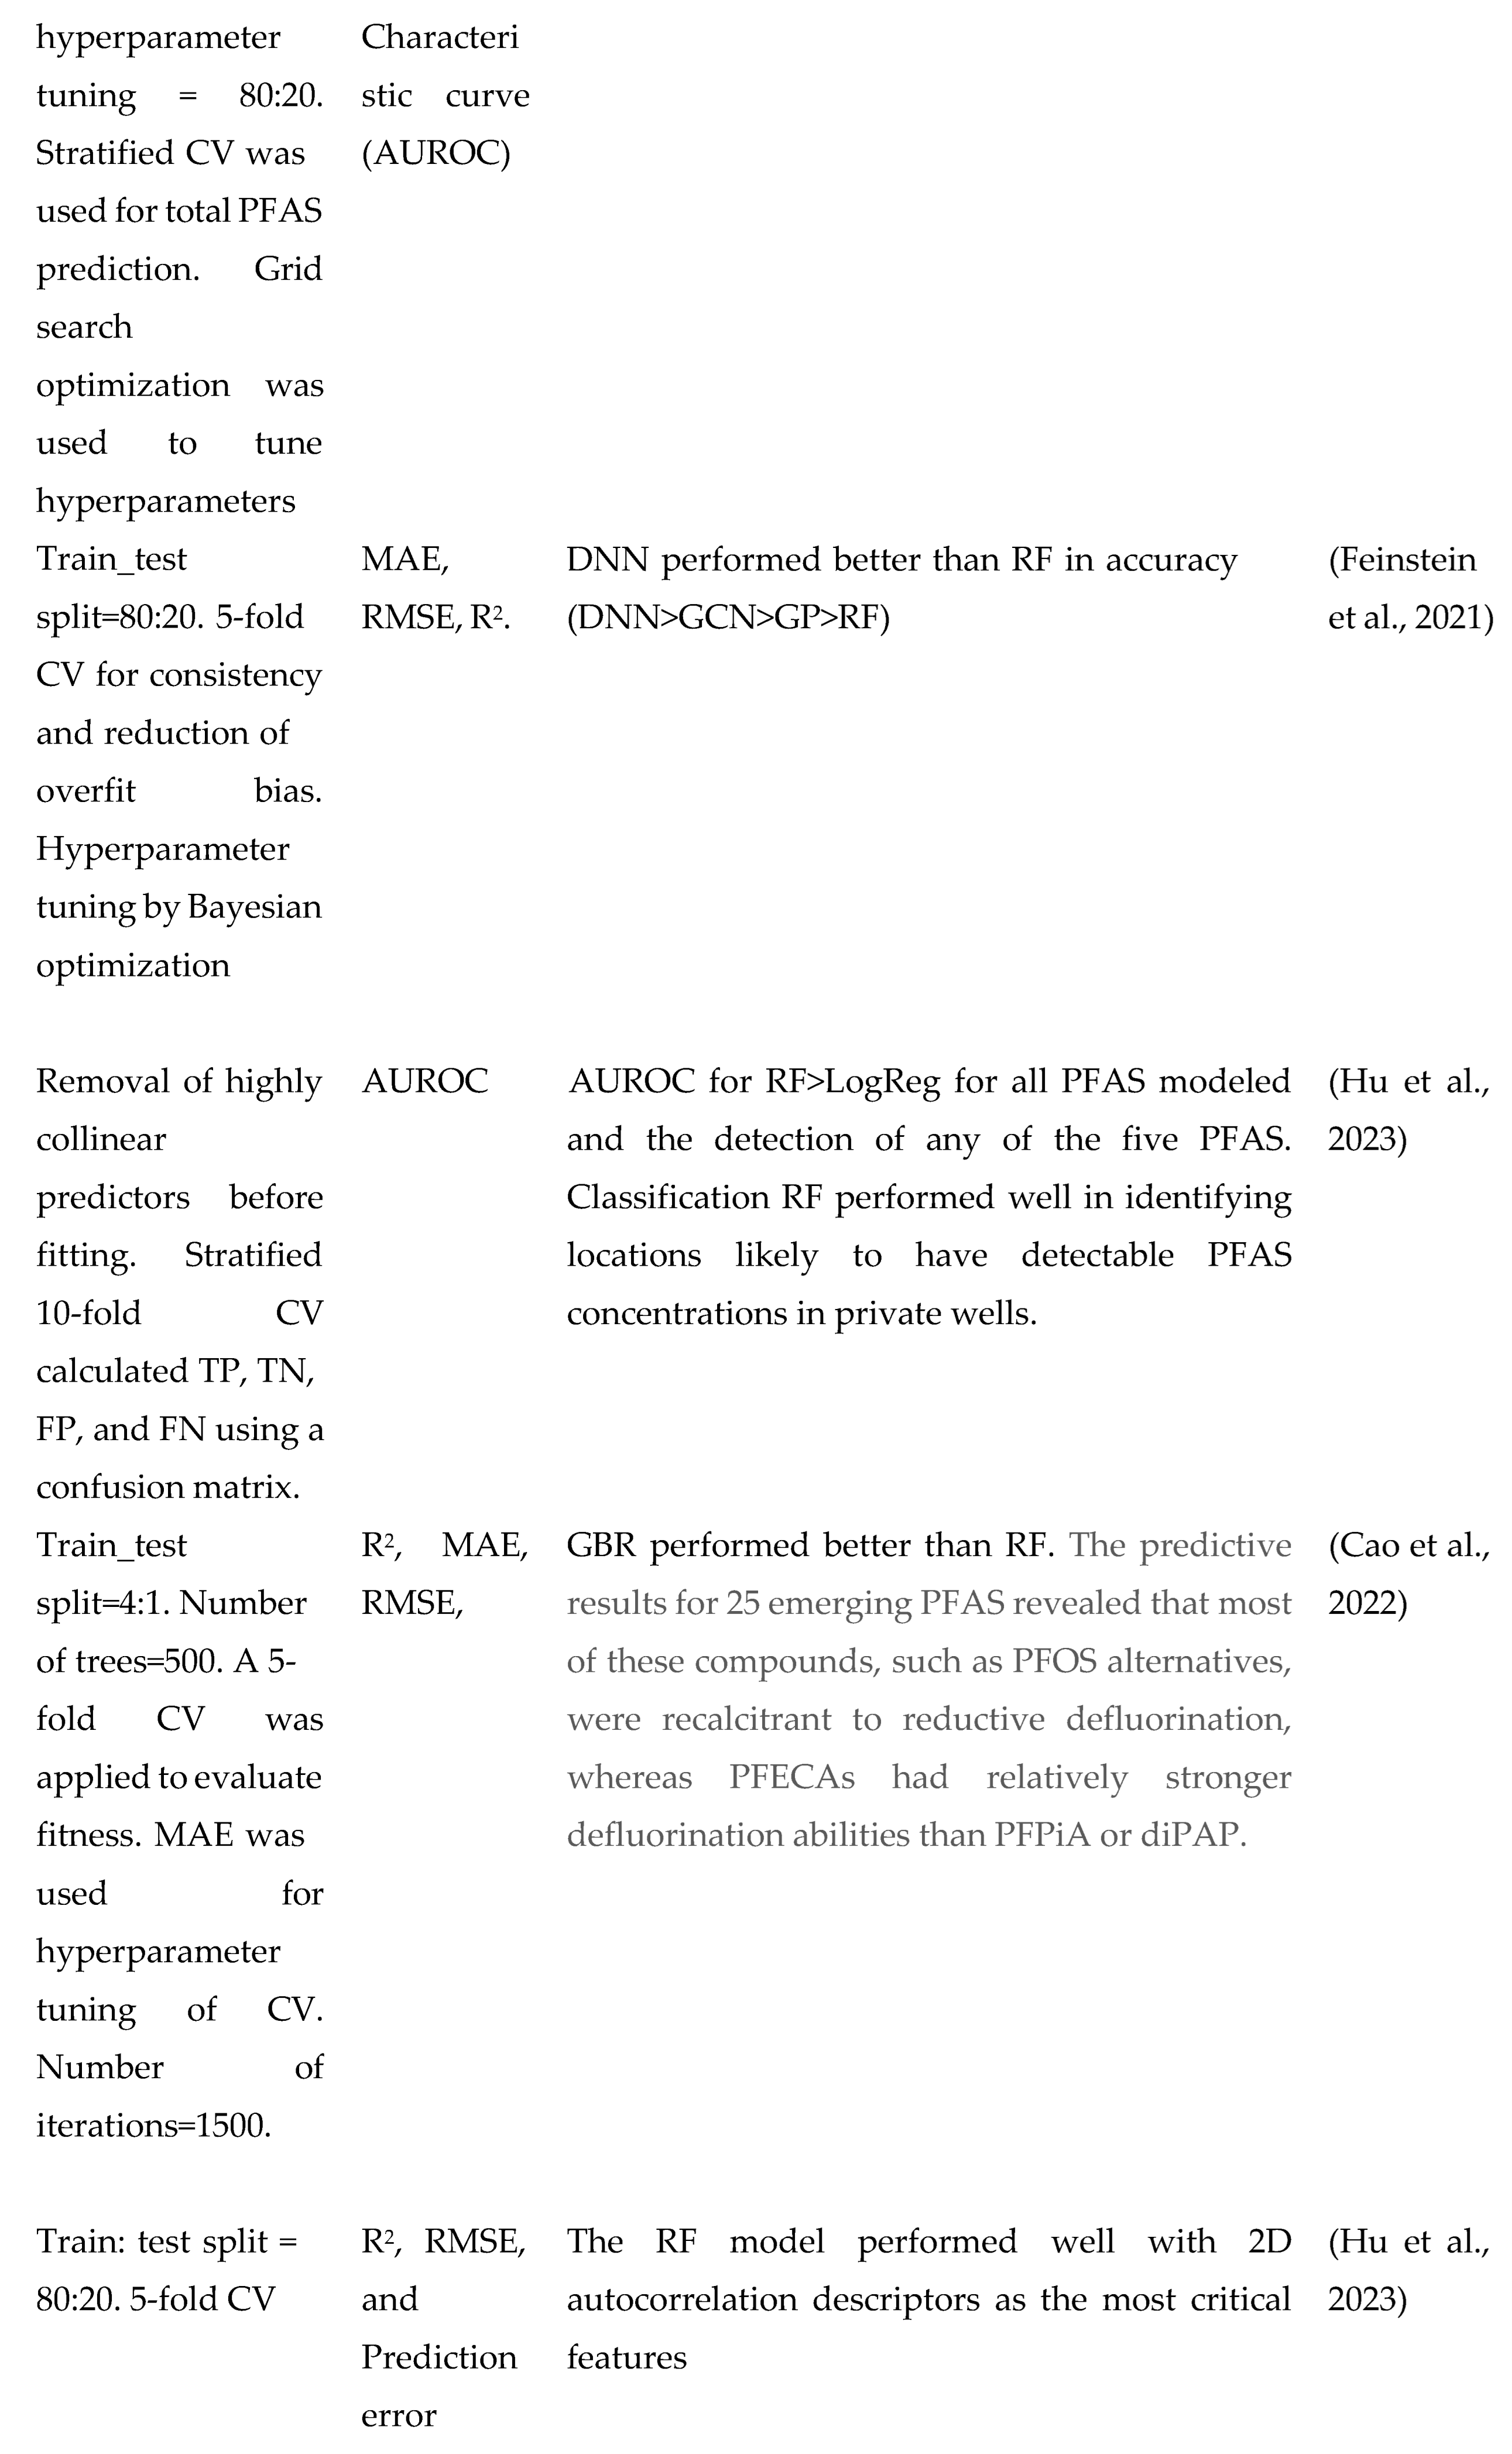
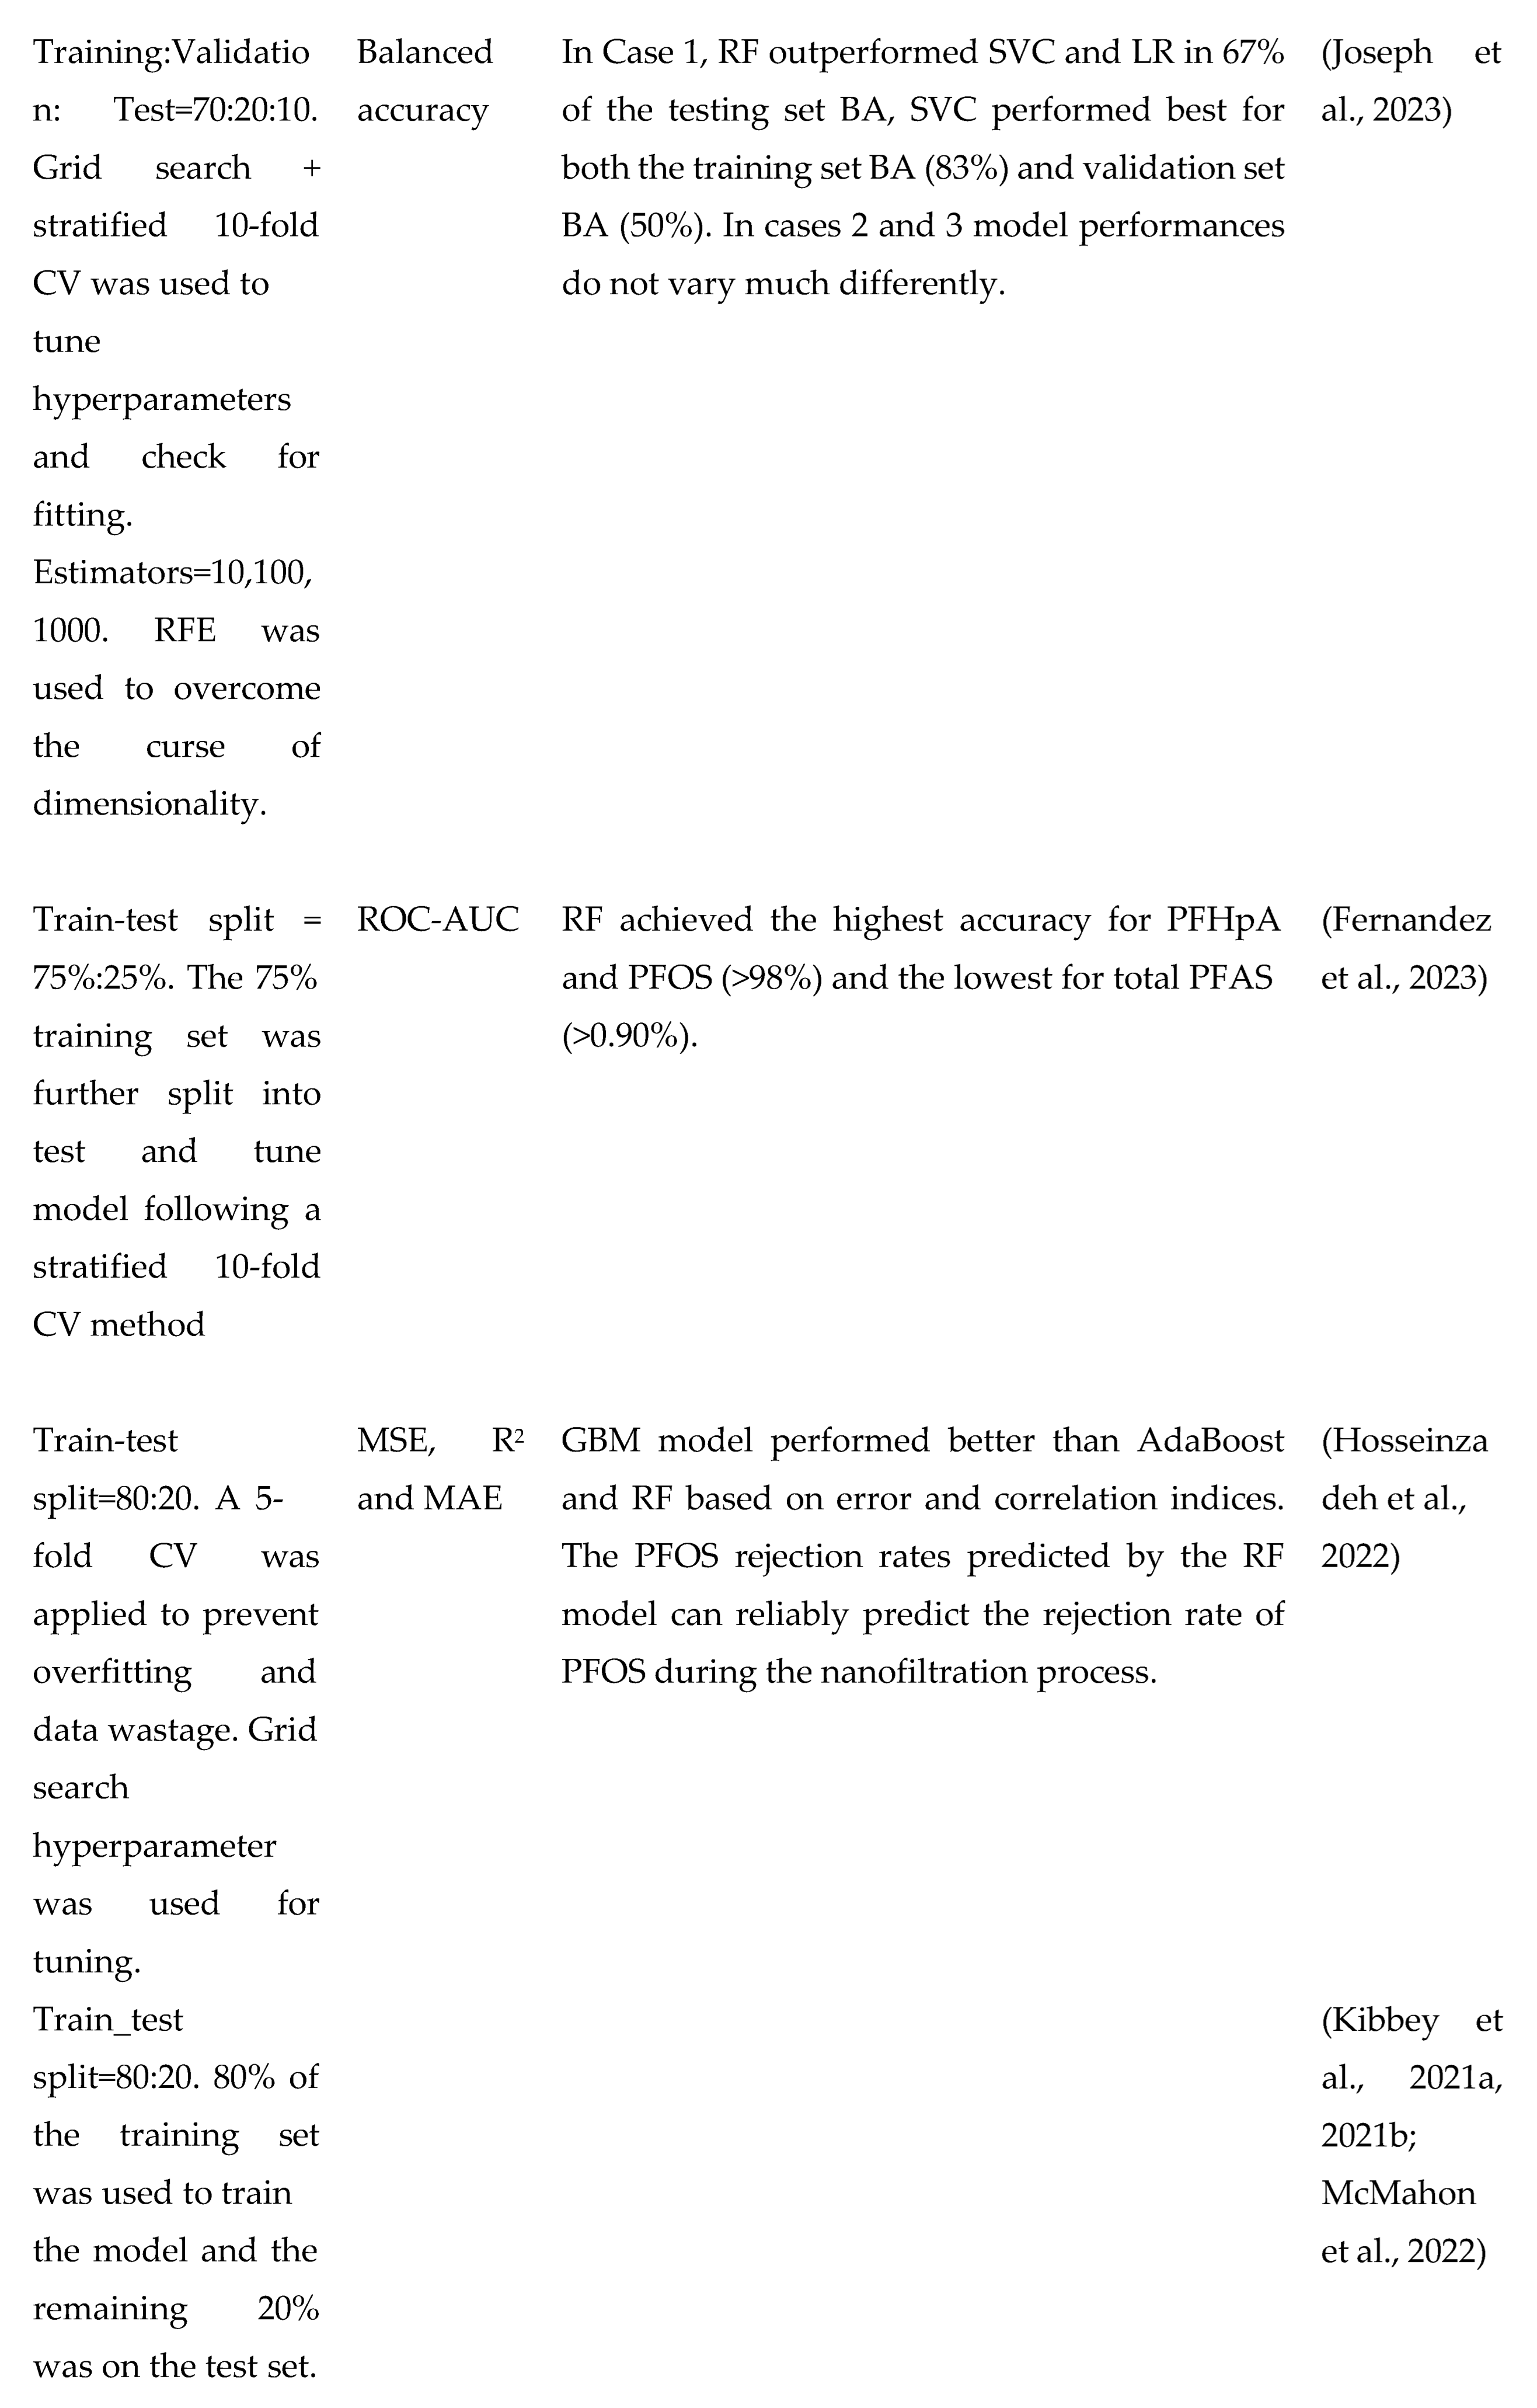
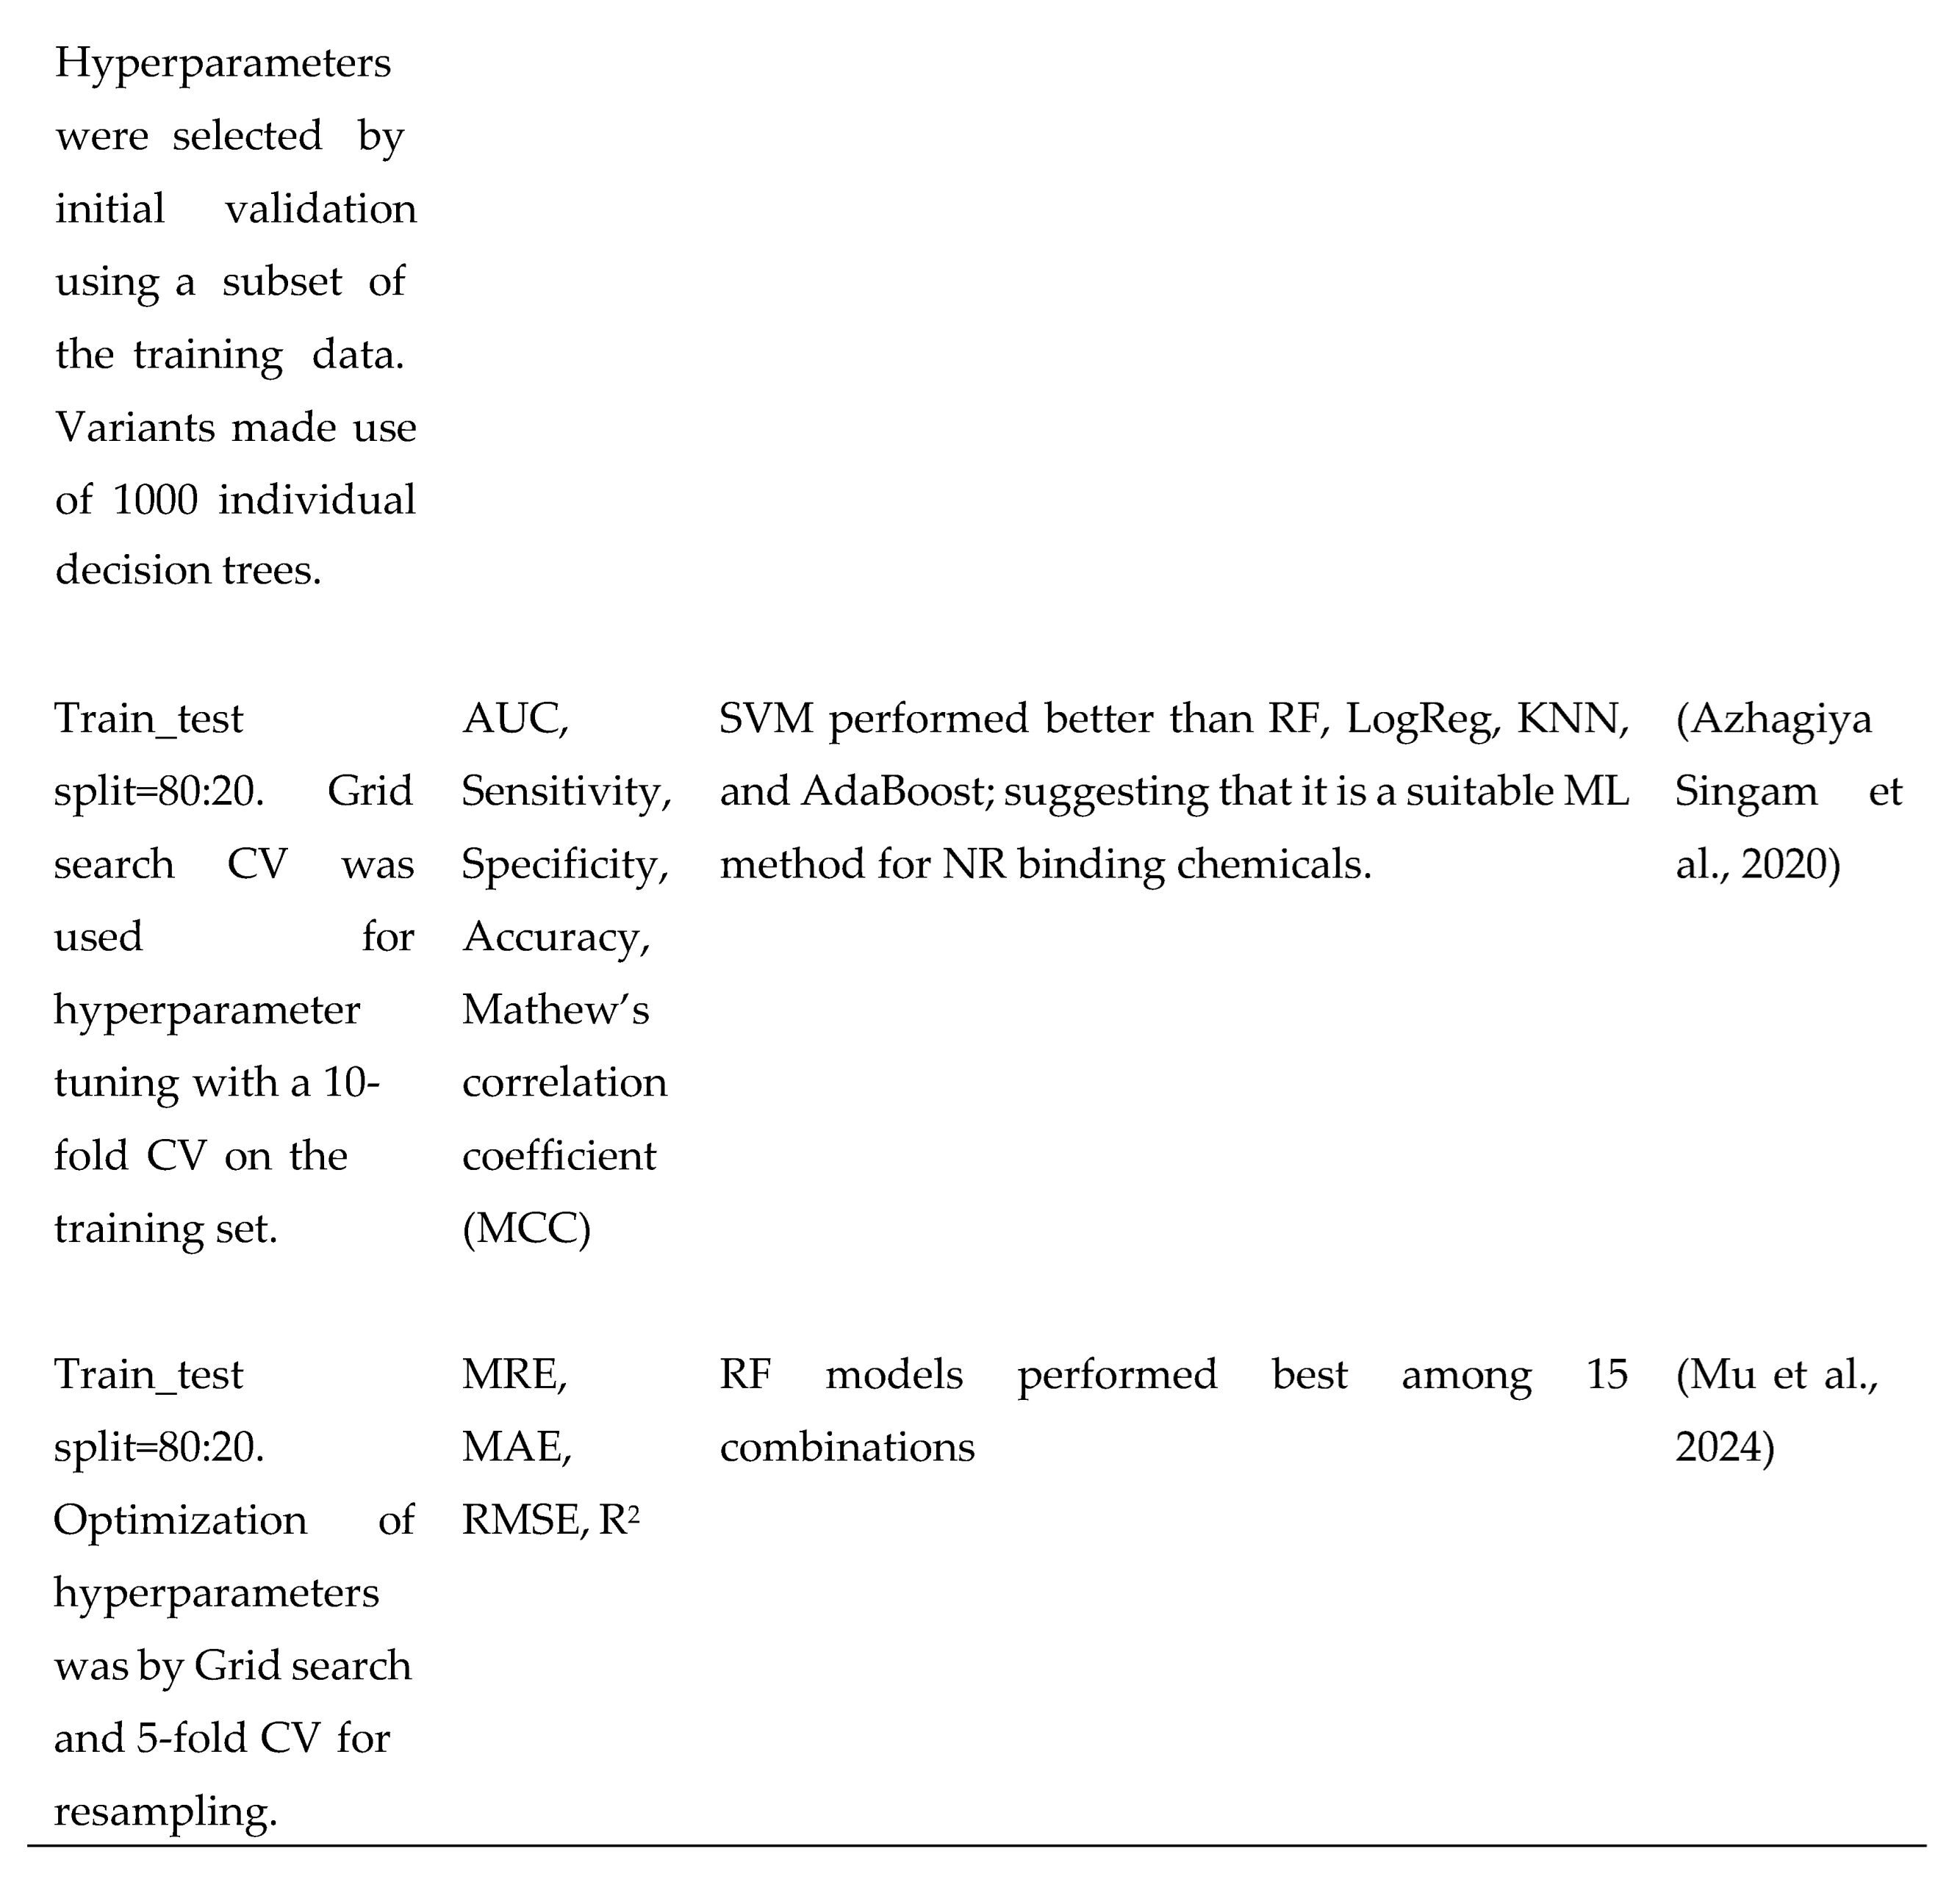
Data splitting is done in three main ways: training, validation, and test sets. The choice of which sets to use depends on the model, the size of the data, and in some cases, the choice of the user. This concept shuffles the dataset and then splits it. While the model is learned on the training set, validation, and test sets determine the performance of the model. The scikit-learn package from Python programming was widely used by various literatures considered in this review. The train- test split ratio is the percentage of the data that would be used to train the model to that which would be used to test it. Split such as 80:20 was used by several authors (Azhagiya Singam et al., 2020; Dong et al., 2023; Hosseinzadeh et al., 2022; McMahon et al., 2022). Hu et al., (2021) divided the domestic well PFAS data in the ratio 80:20; this is consistent with the ratio adopted by DeLuca et al., (2023) who used a 100-iteration Monte Carlo holdout scheme to split PFAS data from Columbia River Basin fish tissue. Other split ratios used by authors include 70:30 (Cheng and Ng, 2019) and 75:25 (Fernandez et al., 2023).
Quantitative Structure-Activity Relationship (QSAR) models were developed by Yuan et al., (2023) to correlate chemical molecules of the air-water interface of PFAS using 12 constitutional descriptors and 11 quantum chemical descriptors. The model was developed by correlation analysis- linear correlations between the water-air interface energy values and every descriptor (n=23) were investigated by correlation analysis, genetic function approximation (GFA), multiple linear regression (MLR), neural network (NN), and model validation. Cao et al., (2022) used the training set to develop QSAR models, while the test set was used to evaluate the generalization prediction ability of the model. The application domain of the best ML model was evaluated using the Williams plot and Euclidean distance.
Cross-validation (CV) is an ML evaluating technique that trains several models on the subset or multiple folds of the data and evaluates the performance of the remaining data. This process is repeated several times (iteration number), changing the subset each time. Yuan et al., (2023) used a 5-fold CV, and George and Dixit, (2021) used 10 subsets (10-fold CV) to group groundwater wells to prioritize PFAS testing; the same number was used by Dong et al., (2023) for total PFAS prediction. In addition to this, Cao et al., (2023) performed 500 iterations on the training set for hyperparameter tuning. Hyperparameter tuning is the process of determining values to adjust models for optimal results (Mu et al., 2024). Processes include Grid search (Dong et al., 2023; Hosseinzadeh et al., 2022; Joseph et al., 2023), a subset of the training set (Kibbey et al., 2021b, 2020) and bayesian optimization (Karbassiyazdi et al., 2022).
Model Evaluation Metrics
Evaluation metrics assess the effectiveness and performance of a model. This is an important feedback mechanism for an algorithm or in comparing different models. It is essential to evaluate a modelʹs predictive power, adaptability, and overall quality. Evaluation metrics provide objective standards for assessing these qualities. The evaluation metrics used depend on the problem domain, data type, and desired outcome. The following evaluation metrics are used in this review:
Area under the receiver operating characteristics curve (AUC-ROC). This is an aggregate measure of performance across all classification criteria. This could be interpreted as the likelihood that the model will evaluate a random positive case higher than its random negative. The Receiver Operating Characteristic (ROC) curve is obtained by plotting the true positive rate (sensitivity) against the false-positive rate. George and Dixit, (2021) used AUROC to evaluate Linear regression and Random forest models for PFAS groundwater testing. Other models that have been evaluated using AUC include the Weave model, Graph convolutional model, Pyramidal multitask network, 1- hidden layer multitask (Cheng and Ng, 2019), logistic regression (Hu et al., 2023), Spatial regression and Boosted regression tree (Fernandez et al., 2023).
The F1 score is the harmonic mean of precision and recall, with 1 being the best value and 0 being the worst. It is determined by dividing the total number of values by the sum of their reciprocals. It increases the effect of the lesser number on the entire calculation, resulting in a balanced measurement. The F1 score considers both precision-recall while avoiding the overestimation that the arithmetic mean may generate. Dong et al., (2023) used the F1 score to evaluate the performance of several classification and regression models for target PFAS prediction in California groundwater.
The Root mean square error (RMSE) is a popular evaluation metric for regression events. It is the square root of the average squared distance (the difference between actual and predicted values). It assumes that errors are impartial and follow a normal distribution. It is utilized when there is a risk of big errors. This metric was applied to the RF model which was used to predict PFAS contamination in fish tissue (DeLuca et al., 2023). Several authors used this metric for the performance evaluation of several models (Cao et al., 2022; Feinstein et al., 2021; Hu et al., 2023).
MAE measures the average errors in a set of predictions, regardless of their direction. The MAE score is calculated by taking the average of the absolute error numbers, hence it is always positive. Hosseinzadeh et al., (2022) used MAE to evaluate the performances of several ML models to model and analyze PFOS removal from contaminated water by nanofiltration. Mu et al., (2024) screened PFAS data using several ML techniques.
R-squared is a statistical measure that indicates how much of a dependent variableʹs variation is explained by an independent variable or variables in a regression model. The R2 value determines how accurate our model is in terms of distance or residuals. Cao et al., (2023) investigated the binding fraction of PFAS in human plasma using several ML models; these were evaluated by the R2.
Several other evaluation metrics have been used by authors to better understand the performances of ML algorithms in PFAS studies. Some of these include precision, recall, accuracy, mean, sensitivity, and specificity.
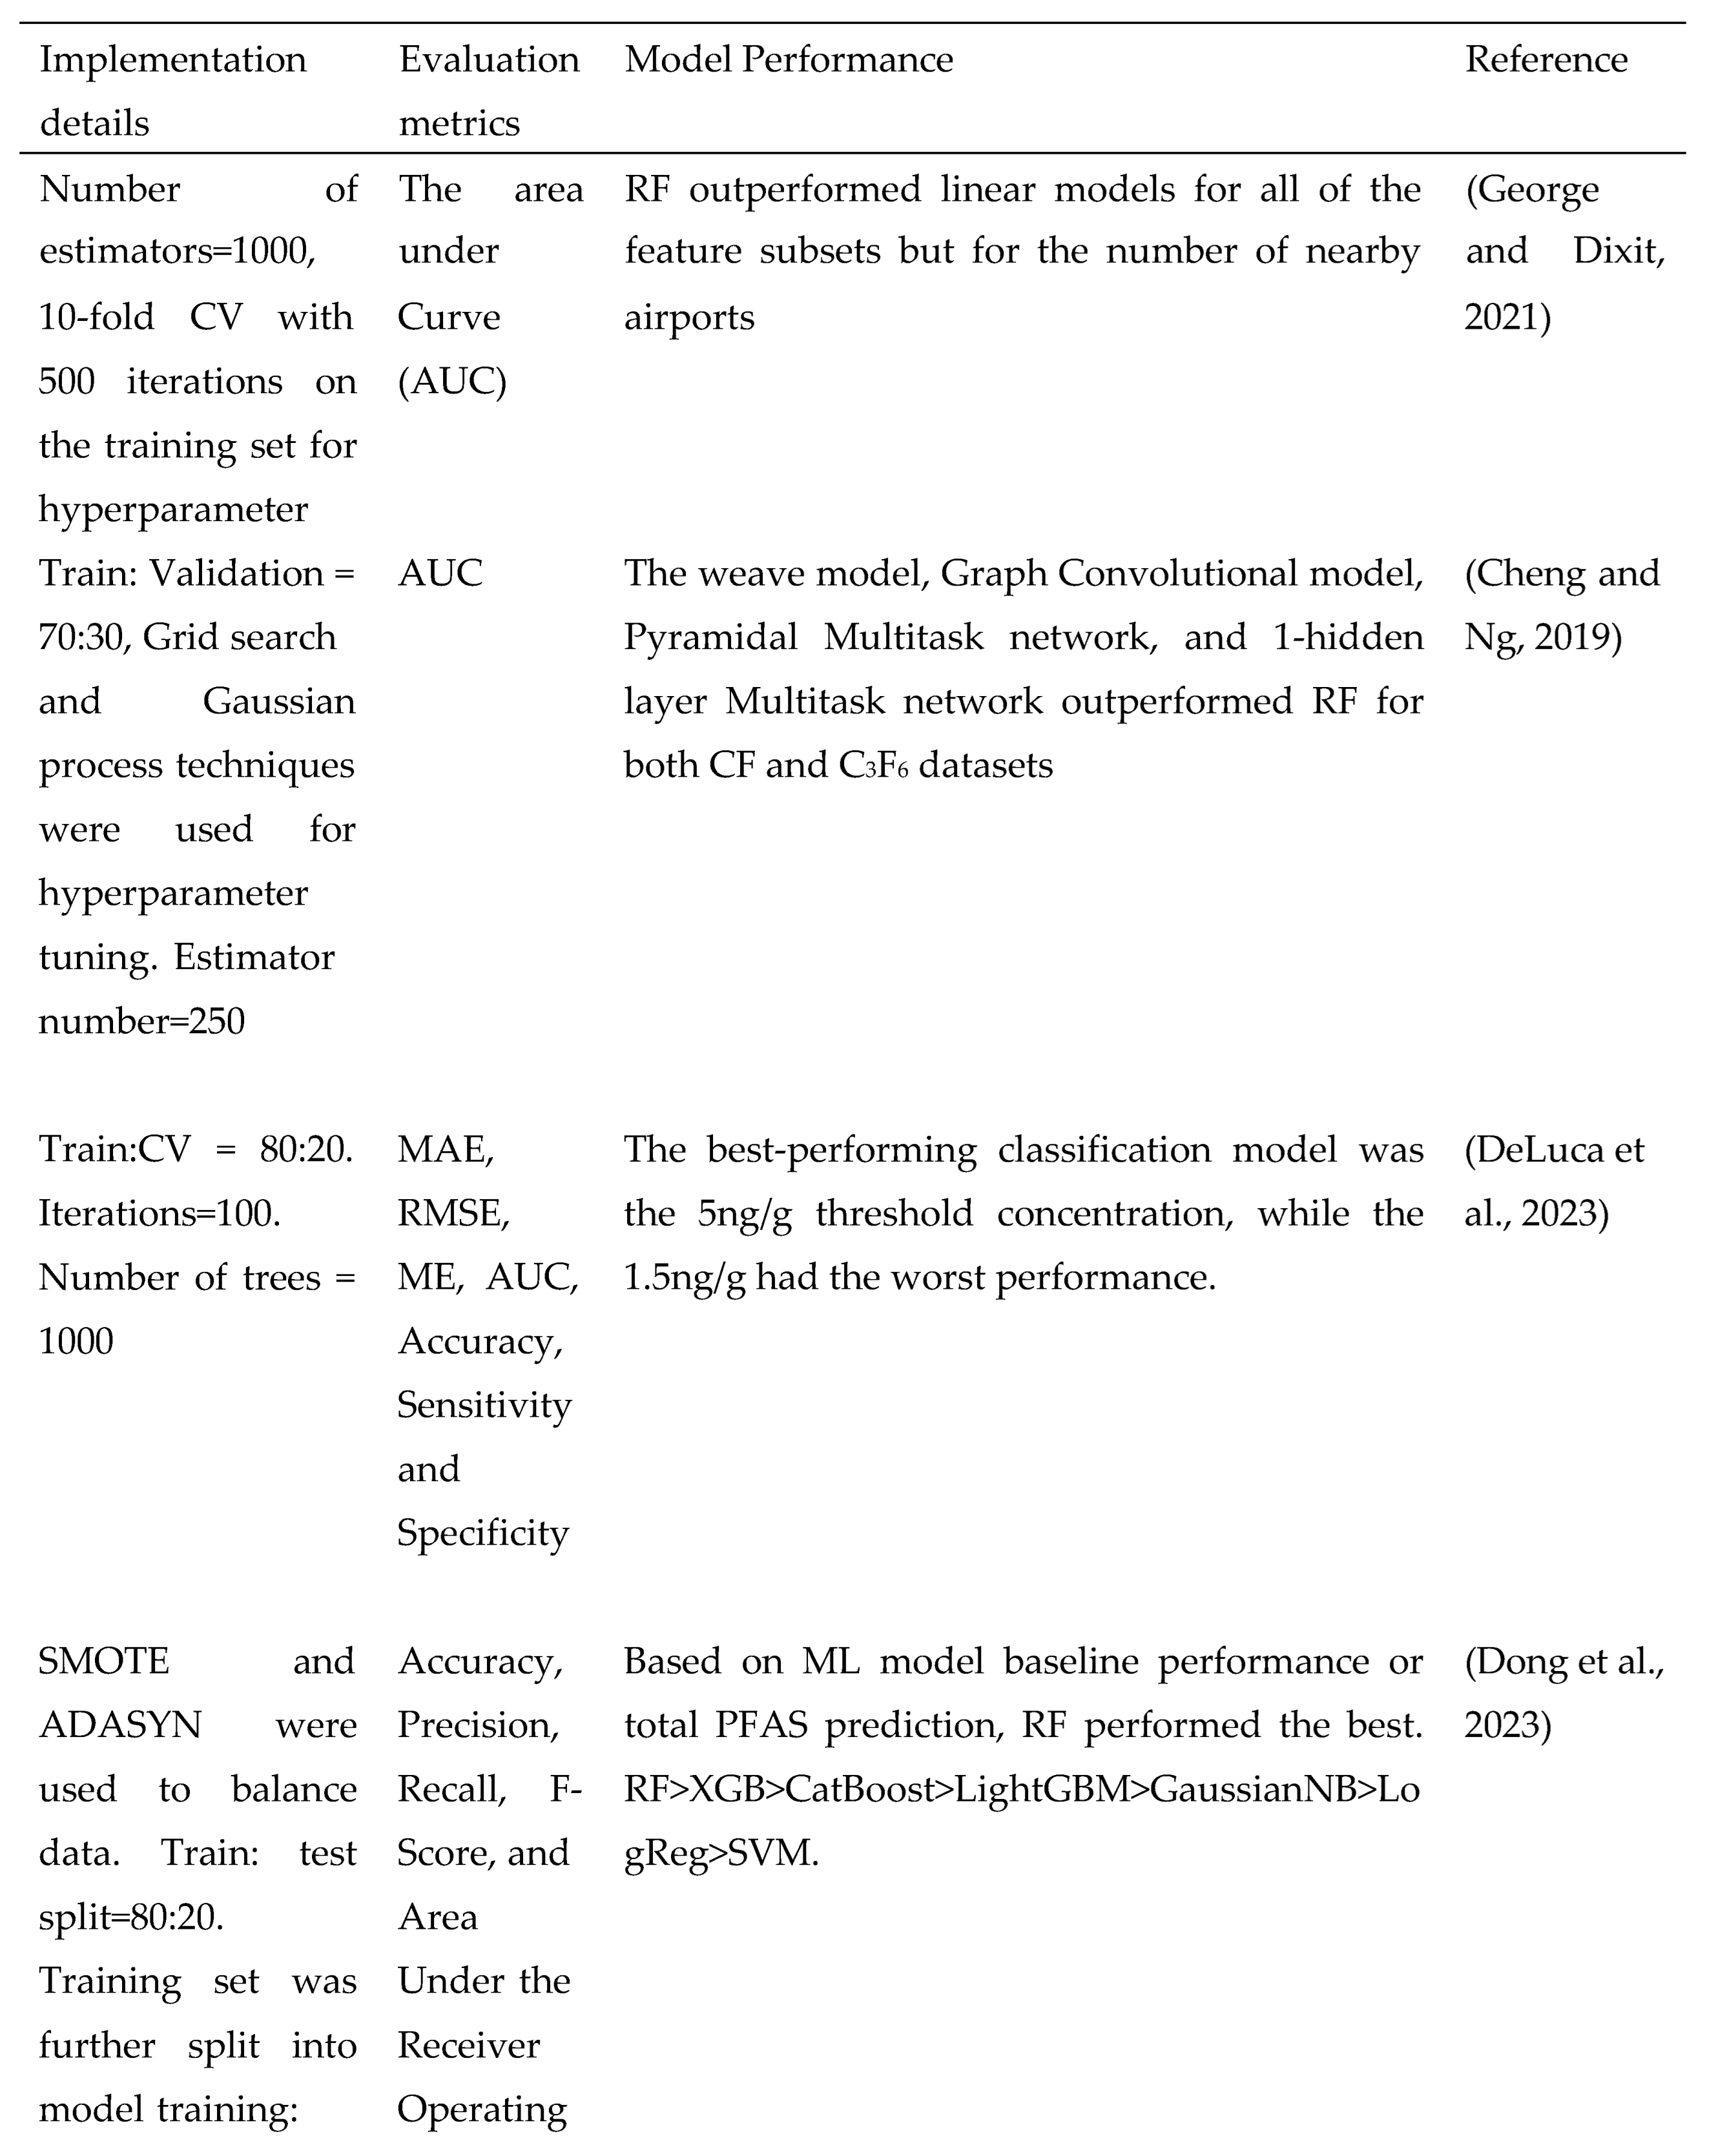
Table 2.
Implementation details and performances of ML models used in this literature.
Table 2.
Implementation details and performances of ML models used in this literature.
Use Cases of ML In PFAS
Source and Occurrence
Machine learning has been used to predict PFAS source in different media. Enabling the algorithm to understand the given data would enable prediction to a high degree, the source of PFAS. PCA identified the fire training site as the primary contamination source of PFAS in some wells (Sörengård et al., 2022). Source apportionment of PFAS in groundwater was performed by Antell et al., (2023) using ML by considering the geochemical signatures in the observations; thereby identifying the source of contamination. Kibbey et al., (2020) used data from sampling reports, journal publications, organizational datasets, and well data to train a ML model to predict PFAS source. Several authors (Breitmeyer et al., 2023; Hu et al., 2023; Stults et al., 2023) trained data from a source to predict the PFAS occurrence in a similar media. Han et al., (2023) and Mu et al., (2024) used ML algorithms to improve targeted and non-targeted screening of PFAS.
Behavior and Pattern
It has been proven that ML algorithms can be used to predict behavior and identify distinct patterns of individual PFAS types. Biologically active PFAS have been found to correlate positively with chain length; this has added to the knowledge base for predicting PFAS behavior. Human plasma PFAS behavior was investigated by observing the behavior of PFAS in blood protein (Cao et al., 2023). Predicting bioactivities in PFAS was done using semi-supervised learning by identifying patterns and clusters thereby predicting the functional group that is crucial to bioactivity (Kwon et al., 2023).
Classification and Grouping
Cheng and Ng, (2019) classified bioactivity of PFAS using several ML algorithms. It was reported that a lot of biologically active PFAS have chain lengths shorter than 12 carbon atoms. Body length and species of marine mammals were found to be the most important features in determining the coexistence mechanisms of trace elements and PFAS (Liu et al., 2023).
Removal Efficiency
ML algorithms have been found to also play important roles in removing of PFAS from the environment. Jiang et al., (2023) observed that molecular weight is the most important feature for the removal of PFAS. This is agreeable as there is a tendency of partition for relatively heavy molecules than their lighter counterparts. PFOS removal by nanofiltration was modeled using ML parameters. It was determined that pH, valent cations, amongst others, are important features for a successful nanofiltration procedure (Hosseinzadeh et al., 2022).
Contamination
Contamination levels and risk assessments of PFAS in various organisms and media have been modeled using ML. DeLuca et al., (2023) used geographical data to forecast the contamination level of fish tissue. It was reported that nearness to industries, land development, and distance from fire training facility were some of the important features to determine the contamination level in the media. Models were able to distinguish groundwater wells based on their level of exposure to PFOA (Li and Gibson, 2023).
Model Performance
RF outperformed other models when employed independently, and can distinguish wells with concerningly high quantities of PFAS (AUC of 0.90). The combined model performed better than individual feature subsets (George and Dixit, 2021).
LGB exhibited the highest performance on the test data with 89.45%. LGB+MLP achieved the highest accuracy when blended together. When LGB, XGB, CB, MLP, and SVM were stacked , there was a high accuracy (Cao et al., 2023).
Mean values of the ROC-AUC show that the 1-hidden layer multitask network performed best with the validation set of the CF dataset, while the Pyramidal multitask network performed best with the validation data of the C3F6 dataset. AUC scores for training sets on all models showed larger scores, meaning there is an overfitting problem (Cheng and Ng, 2019).
NNA outperformed other models; GFA performed worst but MLR did not fit in with the criteria (Yuan et al., 2023).
The best-performing classification model was the 5 ng/g and 1.5ng/g threshold PFAS concentration had the best and worst performance based on their mean AUC, accuracy, sensitivity, and specificity over 100 Monte Carlo iterations (DeLuca et al., 2023).
Tuning hyperparameters increased accuracy and AUROC for all models with RF model accuracy increasing by 4.58%. RF performed best in Class 3 (>100 observations) and XGboost is the overall best model for the classifier chain(Dong et al., 2023, p. 35).
Feinstein et al., (2021) showed that the deep ensemble had a better accuracy of 0.68, while RF regression performed worst with 0.574. There is a 1 in 6 overconfident level when model is validated on data from point estimates of PFAS-like compounds
All BN models had accuracy >97% when trained with the full datasets. The order of accuracy is as follows: PFHxA>PFBA>PFBS>PFHxS. High accuracies were maintained in multiple iterations of CV when model accuracy was tested. All 95% CI had narrow validation, meaning that trained BNs could provide a good prediction performance with low variation (Li and MacDonald Gibson, 2022). The AUROC for RF was higher than the LogReg for all modeled PFAS and their individual detection. This ranged from 0.74 for PFOS to 0.86 for PFHpA. AUROC for LogReg ranged from 0.1
for PFOS to 0.15 for PFOA. Hyperparameter tuning had less impact on the models (Hu et al., 2021).
The RF model performed well with appreciable R2 and RMSE values (Hu et al., 2023).
Values of R2 show that the best performance was obtained for PFOS since the model captured 74% of the concentration variance. High accuracy and ROC-AUC were obtained for PFHpA, PFOS, other remaining species and total PFAS values (Fernandez et al., 2023).
Data preprocessing performed well during model training, with AUC not less than 0.85. All models performed well in 5 fold CV and AUC up to 0.89 (Li and Gibson, 2023).
Low Sorption strength of PFAS, and high hydraulic conductivity explains the postulation that PFAS plume migrated over 10km. It was reported that a Fire training site is the most likely PFAS contamination source in the aquifer (Sörengård et al., 2022).
The GBM model demonstrated better performance than both AdaBoost and RF, based on. By using error and correlation indexes, GBM outperformed other models. The PFOS rejection rates during NF process by RF was close to the actual values, with no overfitting issues. (Hosseinzadeh et al., 2022).
The boosted regression tree had a good performance for the training and holdout data in determining the likely PFAS sources. Evaluation matrices such as accuracy, sensitivity, specificity, and ROC (McMahon et al., 2022).
R2 varies between 0.45 and 0.51 for PFAS yield with no development with outlier and PFAS yield with development respectively; while their corresponding Normalized RMSE ranges between 0.110 and 0.104 respectively(Breitmeyer et al., 2023).
There is an improved performance of the RF model based on accuracy (up to 100% in some cases), except for Wolverine soil where the performance was 5.4% due to the non-detectability of the PFAS samples (Kibbey et al., 2021a).
GPR and fine tree regression models performed better with Carbon and mineral-based adsorbents respectively. Carbon-based adsorbents had average RMSE, MSE, MAE, and R2 values of 0.11, 0.015, 0.06, and 0.98 respectively. The average RMSE, MSE, MAE, and R2 for mineral based adsorbent using the fine tree model are 0.16, 0.03, 0.12, and 0.94 respectively. When tested with previous studies data, GPR achieved 99% with Carbon-based adsorbent and the fine tree model achieved 94% prediction accuracy (Patel et al., 2022).
The FNN approach yields the best predictions with an R2 of 0.93 when tested with various training/test sets (Raza et al., 2019).
RF had the best performance with an accuracy of 96.4% while classification by ratio had the least performance with 79.6% accuracy. The order of accuracy includes RF>DNN ensemble>KNN>GP classifier>Support Vector (RBF)>Classification by ratio (Kibbey et al., 2021b).
SVM outperformed other models, and is a suitable ML method for binding chemicals due to its consistency. AUC, specificity, sensitivity, and accuracy value for this model is not less than 89% (Azhagiya Singam et al., 2020).
Accuracy values for KNN, SVM, and decision tree classifiers were 88.2%, 87.4%, and 91.4%, respectively. With only four features, the overall model accuracy was 95%, indicating that the increase in accuracy is most likely due to model overfitting (Stults et al., 2023).
Accuracy and F1 quotients for NN ensemble and ratio classification are 96.3% and 97%; and 91.7% and 92.9%. For the Portland-Clarendon subset, ratio classification (38.3% accuracy) did not perform well, whereas the neural network ensemble (83.3% accuracy) and Extra Trees (75.0% accuracy) had a better performance (Kibbey et al., 2020).
The range of MRE, MAE, RMSE and R3 for all algorithms ranged from 1.78 to 2.61, 4.48 to 6.34, 6.56 to 9.38, and 0.92 to 0.96 respectively. The RF algorithm had the best performance in all the models. The testing setʹs MRE, MAE, RMSE, and R2 values were 1.75, 4.56, 6.30, and 0.97, respectively, after updating the model with the optimal features (Mu et al., 2024).
Conclusions
Machine learning and Artificial intelligence have been used to better understand the behavior and transportation of water contaminants (Banerjee et al., 2022; Hu et al., 2022; Jiang et al., 2021; Ragi et al., 2019). They have been very helpful in assessing water quality based on the predictions and performances of the models. This review summarizes the use of machine learning algorithms to understand PFAS. Due to the complex nature of PFAS and the difficulty in heterogeneity of their structures, it is important to have a proper understanding of the various possibilities that exist in the understanding of this concept. Part of the limitations in the proper understanding of PFAS using ML is the lack of sufficient data. Data sources that have been used for modeling PFAS with ML range from government agencies to a combination of several research data. Supervised, semi-supervised, and unsupervised learning have been employed to model PFAS; while some authors used singular algorithms, others have used ensemble models and a combination of ML algorithms to determine the model with the best performance. Various metrics have been used to evaluate the performance of the ML algorithms. It is observed from this literature that ML can make accurate predictions on the occurrence, behavior, partitioning, and removal techniques of PFAS in all types of water.
It is recommended that the impact of water quality parameters on PFAS should be studied using various ML algorithms to give a clearer understanding of the relationship between chemical elements in water and PFAS and to have a better understanding of the adsorption potential of the PFAS. More databases should be made available to improve the understanding of PFAS using machine learning. From Figure (2) above, ML algorithms have not been extensively used for anomaly detection in data. Also, there is need to use ML algorithms to understand better the behavior of PFAS in soils, sediments, humans, aquatic organisms, terrestrial organisms, plants uptake and even in the atmosphere. The major focus has been on water, there is need to consider these medium as well.
References
- Adu, O. , Ma, X., Sharma, V.K., 2023. Bioavailability, phytotoxicity and plant uptake of per-and polyfluoroalkyl substances (PFAS): A review. Journal of Hazardous Materials 447, 130805. [CrossRef]
- Antell, E.H. , Yi, S., Olivares, C.I., Ruyle, B.J., Kim, J.T., Tsou, K., Dixit, F., Alvarez-Cohen, L., Sedlak, D.L., 2023. The Total Oxidizable Precursor (TOP) Assay as a Forensic Tool for Per- and Polyfluoroalkyl Substances (PFAS) Source Apportionment. ACS EST Water acsestwater.3c00106. [CrossRef]
- Almousa, M. , Olusegun, T.S., Lim, Y.H., Khraisat, I. and Ajao, A., 2023, October. Groundwater Management Strategies for Handling Produced Water Generated Prior Injection Operations in the Bakken Oilfield. In ARMA/DGS/SEG International Geomechanics Symposium (pp. ARMA-IGS). ARMA.
- Almousa, M. , 2023. Characterization and treatment of Bakken oilfield produced water. https://commons.und.edu/grad‐posters/5/.
- Almousa, M. , Tomomewo, O.S. and Lim, Y.H., 2023. Salts Removal as an Effective and Economical Method of Bakken Formation Treatment.
- Ayati, A.H. , Haghighi, A., Ghafouri, H.R., 2022. Machine Learning–Assisted Model for Leak Detection in Water Distribution Networks Using Hydraulic Transient Flows. J. Water Resour. Plann. Manage. 148, 04021104. [CrossRef]
- Azhagiya Singam, E.R. , Tachachartvanich, P., Fourches, D., Soshilov, A., Hsieh, J.C.Y., La Merrill, M.A., Smith, M.T., Durkin, K.A., 2020. Structure-based virtual screening of perfluoroalkyl and poly-fluoroalkyl substances (PFASs) as endocrine disruptors of androgen receptor activity using molecular docking and machine learning. Environmental Research 190, 109920. [CrossRef]
- Banerjee, K. , Bali, V., Nawaz, N., Bali, S., Mathur, S., Mishra, R.K., Rani, S., 2022. A Machine-Learning Approach for Prediction of Water Contamination Using Latitude, Longitude, and Elevation. Water 14, 728. [CrossRef]
- Breitmeyer, S.E. , Williams, A.M., Duris, J.W., Eicholtz, L.W., Shull, D.R., Wertz, T.A., Woodward, E.E., 2023. Per- and polyfluorinated alkyl substances (PFAS) in Pennsylvania surface waters: A statewide assessment, associated sources, and land-use relations. Science of The Total Environment 888, 164161. [CrossRef]
- Brusseau, M.L. , Guo, B., Huang, D., Yan, N., Lyu, Y., 2021. Ideal versus Nonideal Transport of PFAS in Unsaturated Porous Media. Water Research 202, 117405. [CrossRef]
- Cao, H. , Peng, J., Zhou, Z., Sun, Y., Wang, Y., Liang, Y., 2022. Insight into the defluorination ability of per- and poly-fluoroalkyl substances based on machine learning and quantum chemical computations. Science of The Total Environment 807, 151018. [CrossRef]
- Cao, H. , Peng, J., Zhou, Z., Yang, Z., Wang, L., Sun, Y., Wang, Y., Liang, Y., 2023. Investigation of the Binding Fraction of PFAS in Human Plasma and Underlying Mechanisms Based on Machine Learning and Molecular Dynamics Simulation. Environ. Sci. Technol. 57, 17762–17773. [CrossRef]
- Charbonnet, J.A. , Rodowa, A.E., Joseph, N.T., Guelfo, J.L., Field, J.A., Jones, G.D., Higgins, C.P., Helbling, D.E., Houtz, E.F., 2021. Environmental Source Tracking of Per- and Polyfluoroalkyl Substances within a Forensic Context: Current and Future Techniques. Environ. Sci. Technol. 55, 7237–7245. [CrossRef]
- Cheng, W. , Ng, C.A., 2019. Using Machine Learning to Classify Bioactivity for 3486 Per- and Polyfluoroalkyl Substances (PFASs) from the OECD List. Environ. Sci. Technol. 53, 13970–13980. [CrossRef]
- DeLuca, N.M. , Mullikin, A., Brumm, P., Rappold, A.G., Cohen Hubal, E., 2023. Using Geospatial Data and Random Forest To Predict PFAS Contamination in Fish Tissue in the Columbia River Basin, United States. Environ. Sci. Technol. 57, 14024–14035. [CrossRef]
- Díaz-Galiano, F.J. , Murcia-Morales, M., Monteau, F., Le Bizec, B., Dervilly, G., 2023. Collision cross-section as a universal molecular descriptor in the analysis of PFAS and use of ion mobility spectrum filtering for improved analytical sensitivities. Analytica Chimica Acta 1251, 341026. [CrossRef]
- Dong, J. , Tsai, G., Olivares, C.I., 2023. Prediction of 35 Target Per- and Polyfluoroalkyl Substances (PFASs) in California Groundwater Using Multilabel Semisupervised Machine Learning. ACS EST Water acsestwater.3c00134. [CrossRef]
- Feinstein, J. , Sivaraman, G., Picel, K., Peters, B., Vázquez-Mayagoitia, Á., Ramanathan, A., MacDonell, M., Foster, I., Yan, E., 2021. Uncertainty-Informed Deep Transfer Learning of Perfluoroalkyl and Polyfluoroalkyl Substance Toxicity. J. Chem. Inf. Model. 61, 5793–5803. [CrossRef]
- Fernandez, N. , Nejadhashemi, A.P., Loveall, C., 2023. Large-scale assessment of PFAS compounds in drinking water sources using machine learning. Water Research 243, 120307. [CrossRef]
- García, J. , Leiva-Araos, A., Diaz-Saavedra, E., Moraga, P., Pinto, H., Yepes, V., 2023. Relevance of Machine Learning Techniques in Water Infrastructure Integrity and Quality: A Review Powered by Natural Language Processing. Applied Sciences 13, 12497. [CrossRef]
- George, S. , Dixit, A., 2021. A machine learning approach for prioritizing groundwater testing for per- and polyfluoroalkyl substances (PFAS). Journal of Environmental Management 295, 113359. [CrossRef]
- Guo, B. , Zeng, J., Brusseau, M.L., Zhang, Y., 2022. A screening model for quantifying PFAS leaching in the vadose zone and mass discharge to groundwater. Advances in Water Resources 160, 104102. [CrossRef]
- Han, B.-C. , Liu, J.-S., Bizimana, A., Zhang, B.-X., Kateryna, S., Zhao, Z., Yu, L.-P., Shen, Z.-Z., Meng, X.-Z., 2023. Identifying priority PBT-like compounds from emerging PFAS by nontargeted analysis and machine learning models. Environmental Pollution 338, 122663. [CrossRef]
- Hosseinzadeh, A. , Zhou, J.L., Zyaie, J., AlZainati, N., Ibrar, I., Altaee, A., 2022. Machine learning-based modeling and analysis of PFOS removal from contaminated water by nanofiltration process. Separation and Purification Technology 289, 120775. [CrossRef]
- Hu, J. , Lyu, Y., Chen, H., Cai, L., Li, J., Cao, X., Sun, W., 2023. Integration of target, suspect, and nontarget screening with risk modeling for per- and poly-fluoroalkyl substances prioritization in surface waters. Water Research 233, 119735. [CrossRef]
- Hu, X.C. , Dai, M., Sun, J.M., Sunderland, E.M., 2022. The Utility of Machine Learning Models for Predicting Chemical Contaminants in Drinking Water: Promise, Challenges, and Opportunities. Curr Envir Health Rpt 10, 45–60. [CrossRef]
- Hu, X.C. , Ge, B., Ruyle, B.J., Sun, J., Sunderland, E.M., 2021. A Statistical Approach for Identifying Private Wells Susceptible to Perfluoroalkyl Substances (PFAS) Contamination. Environ. Sci. Technol. Lett. 8, 596–602. [CrossRef]
- Jiang, L. , Yao, J., Ren, G., Sheng, N., Guo, Y., Dai, J., Pan, Y., 2023. Comprehensive profiles of per- and poly- fluoroalkyl substances in Chinese and African municipal wastewater treatment plants: New implications for removal efficiency. Science of The Total Environment 857, 159638. [CrossRef]
- Jiang, Z. , Hu, J., Tong, M., Samia, A.C., Zhang, H. (Judy), Yu, X. (Bill), 2021. A Novel Machine Learning Model to Predict the Photo-Degradation Performance of Different Photocatalysts on a Variety of Water Contaminants. Catalysts 11, 1107. [CrossRef]
- Joseph, N.T. , Schwichtenberg, T., Cao, D., Jones, G.D., Rodowa, A.E., Barlaz, M.A., Charbonnet, J.A., Higgins, C.P., Field, J.A., Helbling, D.E., 2023. Target and Suspect Screening Integrated with Machine Learning to Discover Per- and Polyfluoroalkyl Substance Source Fingerprints. Environ. Sci. Technol. 57, 14351–14362. [CrossRef]
- Karbassiyazdi, E. , Fattahi, F., Yousefi, N., Tahmassebi, A., Taromi, A.A., Manzari, J.Z., Gandomi, A.H., Altaee, A., Razmjou, A., 2022. XGBoost model as an efficient machine learning approach for PFAS removal: Effects of material characteristics and operation conditions. Environmental Research 215, 114286. [CrossRef]
- Kibbey, T.C.G. , Jabrzemski, R., O’Carroll, D.M., 2021a. Predicting the relationship between PFAS component signatures in water and non-water phases through mathematical transformation: Application to machine learning classification. Chemosphere 282, 131097. [CrossRef]
- Kibbey, T.C.G. , Jabrzemski, R., O’Carroll, D.M., 2021b. Source allocation of per- and poly-fluoroalkyl substances (PFAS) with supervised machine learning: Classification performance and the role of feature selection in an expanded dataset. Chemosphere 275, 130124. [CrossRef]
- Kibbey, T.C.G. , Jabrzemski, R., O’Carroll, D.M., 2020. Supervised machine learning for source allocation of per- and polyfluoroalkyl substances (PFAS) in environmental samples. Chemosphere 252, 126593. [CrossRef]
- Kwon, H. , Ali, Z.A., Wong, B.M., 2023. Harnessing Semi-Supervised Machine Learning to Automatically Predict Bioactivities of Per- and Polyfluoroalkyl Substances (PFASs). Environ. Sci. Technol. Lett. 10, 1017–1022. [CrossRef]
- Le, S.-T. , Kibbey, T.C.G., Weber, K.P., Glamore, W.C., O’Carroll, D.M., 2021. A group-contribution model for predicting the physicochemical behavior of PFAS components for understanding environmental fate. Science of The Total Environment 764, 142882. [CrossRef]
- Li, R. , Gibson, J.M., 2023. Predicting Groundwater PFOA Exposure Risks with Bayesian Networks: Empirical Impact of Data Preprocessing on Model Performance. Environ. Sci. Technol. 57, 18329–18338. [CrossRef]
- Li, R. , MacDonald Gibson, J., 2022. Predicting the occurrence of short-chain PFAS in groundwater using machine-learned Bayesian networks. Front. Environ. Sci. 10, 958784. [CrossRef]
- Liu, Y. , Wang, Q., Ma, L., Jin, L., Zhang, K., Tao, D., Wang, W.-X., Lam, P.K.S., Ruan, Y., 2023. Identification of key features relating to the coexistence mechanisms of trace elements and per- and polyfluoroalkyl substances (PFASs) in marine mammals. Environment International 178, 108099. [CrossRef]
- McMahon, P.B. , Tokranov, A.K., Bexfield, L.M., Lindsey, B.D., Johnson, T.D., Lombard, M.A., Watson, E., 2022. Perfluoroalkyl and Polyfluoroalkyl Substances in Groundwater Used as a Source of Drinking Water in the Eastern United States. Environ. Sci. Technol. 56, 2279–2288. [CrossRef]
- Mu, H. , Yang, Z., Chen, L., Gu, C., Ren, H., Wu, B., 2024. Suspect and nontarget screening of per- and polyfluoroalkyl substances based on ion mobility mass spectrometry and machine learning techniques. Journal of Hazardous Materials 461, 132669. [CrossRef]
- Ordonez, D. , Podder, A., Valencia, A., Sadmani, A.H.M.A., Reinhart, D., Chang, N.-B., 2022. Continuous fixed- bed column adsorption of perfluorooctane sulfonic acid (PFOS) and perfluorooctanoic acid (PFOA) from canal water using zero-valent Iron-based filtration media. Separation and Purification Technology 299, 121800. [CrossRef]
- Panigrahi, N. , Patro, S.G.K., Kumar, R., Omar, M., Ngan, T.T., Giang, N.L., Thu, B.T., Thang, N.T., 2023. Groundwater Quality Analysis and Drinkability Prediction using Artificial Intelligence. Earth Sci Inform 16, 1701–1725. [CrossRef]
- Patel, H., Park, H., Zhao, R., 2022. Predicting the Partitioning Behavior of Per- and Poly-Alkyl Substances (PFAS) on Liquid-Solid Interface for Carbon and Mineral Based Surfaces using Multivariate Linear Regression Models with K-Fold Cross Validation. (preprint). Chemistry. https://doi.org/10.26434/chemrxiv-2022-4r4ml Ragi, N.M., Holla, R., Manju, G., 2019. Predicting Water Quality Parameters Using Machine Learning, in 2019 4th International Conference on Recent Trends on Electronics, Information, Communication & Technology (RTEICT). Presented at the 2019 4th International Conference on Recent Trends on Electronics, Information, Communication & Technology (RTEICT), IEEE, Bangalore, India, pp. 1109–1112. [CrossRef]
- Raza, A., Bardhan, S., Xu, L., Yamijala, S.S.R.K.C., Lian, C., Kwon, H., Wong, B.M., 2019. A Machine Learning Approach for Predicting Defluorination of Per- and Polyfluoroalkyl Substances (PFAS) for Their Efficient Treatment and Removal. Environ. Sci. Technol. Lett. 6, 624–629. https://doi.org/10.1021/acs.estlett.9b00476 Sörengård, M., Bergström, S., McCleaf, P., Wiberg, K., Ahrens, L., 2022. Long-distance transport of per- and poly- fluoroalkyl substances (PFAS) in a Swedish drinking water aquifer. Environmental Pollution 311, 119981. [CrossRef]
- Sosnowska, A. , Bulawska, N., Kowalska, D., Puzyn, T., 2023. Towards higher scientific validity and regulatory acceptance of predictive models for PFAS. Green Chem. 25, 1261–1275. [CrossRef]
- Stults, J.F. , Higgins, C.P., Helbling, D.E., 2023. Integration of Per- and Polyfluoroalkyl Substance (PFAS) Fingerprints in Fish with Machine Learning for PFAS Source Tracking in Surface Water. Environ. Sci. Technol. Lett. 10, 1052–1058. [CrossRef]
- Su, A. , Cheng, Y., Zhang, C., Yang, Y.-F., She, Y.-B., Rajan, K., 2023. An Artificial Intelligence Platform for Automated PFAS Subgroup Classification: A Discovery Tool for PFAS Screening (preprint). Chemistry. [CrossRef]
- Wang, Q. , Song, X., Wei, C., Ding, D., Tang, Z., Tu, X., Chen, X., Wang, S., 2022. Distribution, source identification, and health risk assessment of PFASs in groundwater from Jiangxi Province, China. Chemosphere 291, 132946. [CrossRef]
- Wang, Y. , Darling, S.B., Chen, J., 2021. Selectivity of Per- and Polyfluoroalkyl Substance Sensors and Sorbents in Water. ACS Appl. Mater. Interfaces 13, 60789–60814. [CrossRef]
- Xu, Z. , Lv, Z., Li, J., Shi, A., 2022. A Novel Approach for Predicting Water Demand with Complex Patterns Based on Ensemble Learning. Water Resour Manage 36, 4293–4312. [CrossRef]
- Yuan, Shideng, Wang, X., Jiang, Z., Zhang, H., Yuan, Shiling, 2023. Contribution of air-water interface in removing PFAS from drinking water: Adsorption, stability, interaction, and machine learning studies. Water Research 236, 119947. [CrossRef]
- Zeng, J. , Brusseau, M.L., Guo, B., 2021. Model validation and analyses of parameter sensitivity and uncertainty for modeling long-term retention and leaching of PFAS in the vadose zone. Journal of Hydrology 603, 127172. [CrossRef]
|
Disclaimer/Publisher’s Note: The statements, opinions and data contained in all publications are solely those of the individual author(s) and contributor(s) and not of MDPI and/or the editor(s). MDPI and/or the editor(s) disclaim responsibility for any injury to people or property resulting from any ideas, methods, instructions or products referred to in the content. |
© 2024 by the authors. Licensee MDPI, Basel, Switzerland. This article is an open access article distributed under the terms and conditions of the Creative Commons Attribution (CC BY) license (http://creativecommons.org/licenses/by/4.0/).


