Introduction
People with vision impairments, such as reduced visual acuity or visual field loss, can legally drive in many states in the USA provided they meet the minimum vision requirements for a restricted license (Peli & Peli, 2002). However, their vision loss may cause difficulties in responding to road hazards (Alberti et al., 2014; Bowers et al., 2009; Bronstad et al., 2015; Bronstad et al., 2013; Papageorgiou et al., 2012). Advanced Driver Assistance Systems (ADAS) that provide warnings of road hazards are available in current cars and may increase driving safety by reducing crashes and injuries (Cicchino, 2017; Seaman et al., 2022). A few common ADAS technologies (blind-spot detection, lane keep assist, forward collision prevention, pedestrian automatic braking technologies) could potentially prevent 62% of total traffic deaths per year (Wang, 2019). While drivers with impaired vision have reported in questionnaire studies that ADAS improve their perceived driving safety and help to reduce their self-imposed driving restrictions (Cucuras et al., 2017; Deffler et al., 2022; Stevens et al., 2022; Xu et al., 2022; Xu et al., 2023), very little is known about the extent to which such systems might mitigate their crash risk (Holzl et al., 2021). Here we report a proof-of-concept driving simulator study to evaluate the impact of directional vibro-tactile warnings on hazard responses of drivers with two distinct types of vision loss: central vision loss (CVL) and homonymous field loss (HFL).
CVL is characterized by reduced visual acuity, reduced contrast sensitivity, and in some cases, blind areas (scotomas) in the central visual field. It is commonly a result of macular disease (e.g., age-related macular degeneration), though there are many other causes. In contrast, HFL is a loss of part or all the visual field on the same side in both eyes caused by lesions to the post-chiasmal visual pathways following stroke or traumatic brain injury. Homonymous hemianopia is the most common type of HFL with a complete loss of vision in one hemifield (the blind side) but typically normal acuity and contrast sensitivity in the other hemifield (the seeing side). In driving simulator studies, drivers with CVL showed delayed responses to pedestrian hazards (Bronstad et al., 2015; Bronstad et al., 2013), while drivers with HFL had failures to detect as well as delayed responses when pedestrian hazards approached from their blind side (Alberti et al., 2014; Bowers et al., 2009; Papageorgiou et al., 2012). In a survey study, people with CVL reported that dealing with unexpected pedestrian hazards (e.g., suddenly crossing the road) is one of the most difficult situations they encounter when driving and a pedestrian warning system is one of the top ADAS they would like to own and use (Xu et al., 2023).
Tactile (vibrational) hazard warnings have recently been implemented in the driver’s seat in some vehicles (e.g., Cadillac, Chevrolet, GMC, Buick) and could be especially helpful for drivers with visual impairment, who might have difficulty seeing a visual warning or difficulty interpreting an auditory warning amongst the many other auditory alerts already implemented in commonly used ADAS. Tactile hazard warnings improve safety of drivers with normal vision (NV) (Gaffary & Lécuyer, 2018; Noubissie Tientcheu et al., 2022; Petermeijer et al., 2015). Tactile seat warnings that provided information about the direction of a potential hazard increased correct hazard localization accuracy and decreased response times of NV drivers, suggesting that the directional information was helpful in guiding attention to the hazard location (Fitch et al., 2007; Ho et al., 2005; Meng & Spence, 2015).
The current study built on an early evaluation of a directional tactile hazard warning system for drivers with HFL in which a warning was provided for every pedestrian that crossed the road, irrespective of the collision risk (Holzl et al., 2021). The warning was always given when the car was a fixed distance of 80 m from the pedestrian crossing location. In this simple scenario, the warnings significantly reduced blind side crash rates, but were unrealistically early, providing about 7 s to see and respond to the pedestrian when travelling at 25 mph (40 km/h). In the current study we implemented a more ecologically valid warning trigger based on collision risk and extended our investigation to include people with CVL as well as people with HFL. We expected that the warnings would improve hazard responses and reduce collision risk for both CVL and HFL drivers. However, since the two types of vision loss are very different, we hypothesized that the responses to the warnings and benefits of the warnings might differ between the two vision-impaired groups.
Methods
Participants
Participants, recruited from a database at Schepens Eye Research Institute and from referrals by local practitioners, included 11 with CVL, 12 with HFL and 11 with NV. Participants with HFL (Goldman Perimeter, V4e target) had binocular visual acuity of at least 0.00 logMAR (20/20) and no visual neglect (Schenkenberg line bisection test (Schenkenberg et al., 1980) and Bells test (Vanier et al., 1990)). Participants with CVL had binocular visual acuity within the range 0.10 to 1.0 logMAR (20/25 to 20/200), either with or without central field loss (custom kinetic perimetry). Participants with normal vision (NV) had binocular visual acuity of at least 0.00 logMAR (20/20) and current driving experience.
The HFL group included 9 participants with homonymous hemianopia (5 left and 4 right HFL), 2 participants with incomplete homonymous hemianopia (both left HFL) and 1 participant with an upper left homonymous scotoma who was a current driver. The other 10 HFL participants were not current drivers because they did not meet the minimum (120°) field extent requirement for driving licensure in Massachusetts; however, they all had prior driving experience and would have been eligible to drive in other states such as New Hampshire. Four CVL participants were current drivers; the remainder were not current drivers but had prior driving experience and would have been eligible for either an unrestricted or a restricted license in at least one state.
HFL participants scored within the normal range on the Montreal Cognitive Assessment (Nasreddine et al., 2005) (score ≥ 25) and CVL participants scored within the normal range on the Short Portable Mental Status Questionnaire (≤ 2 errors) (Pfeiffer, 1975). The study followed the tenets of the Declaration of Helsinki and was approved by the institutional review board of Massachusetts Eye and Ear. All participants provided written informed consent.
Materials
Apparatus
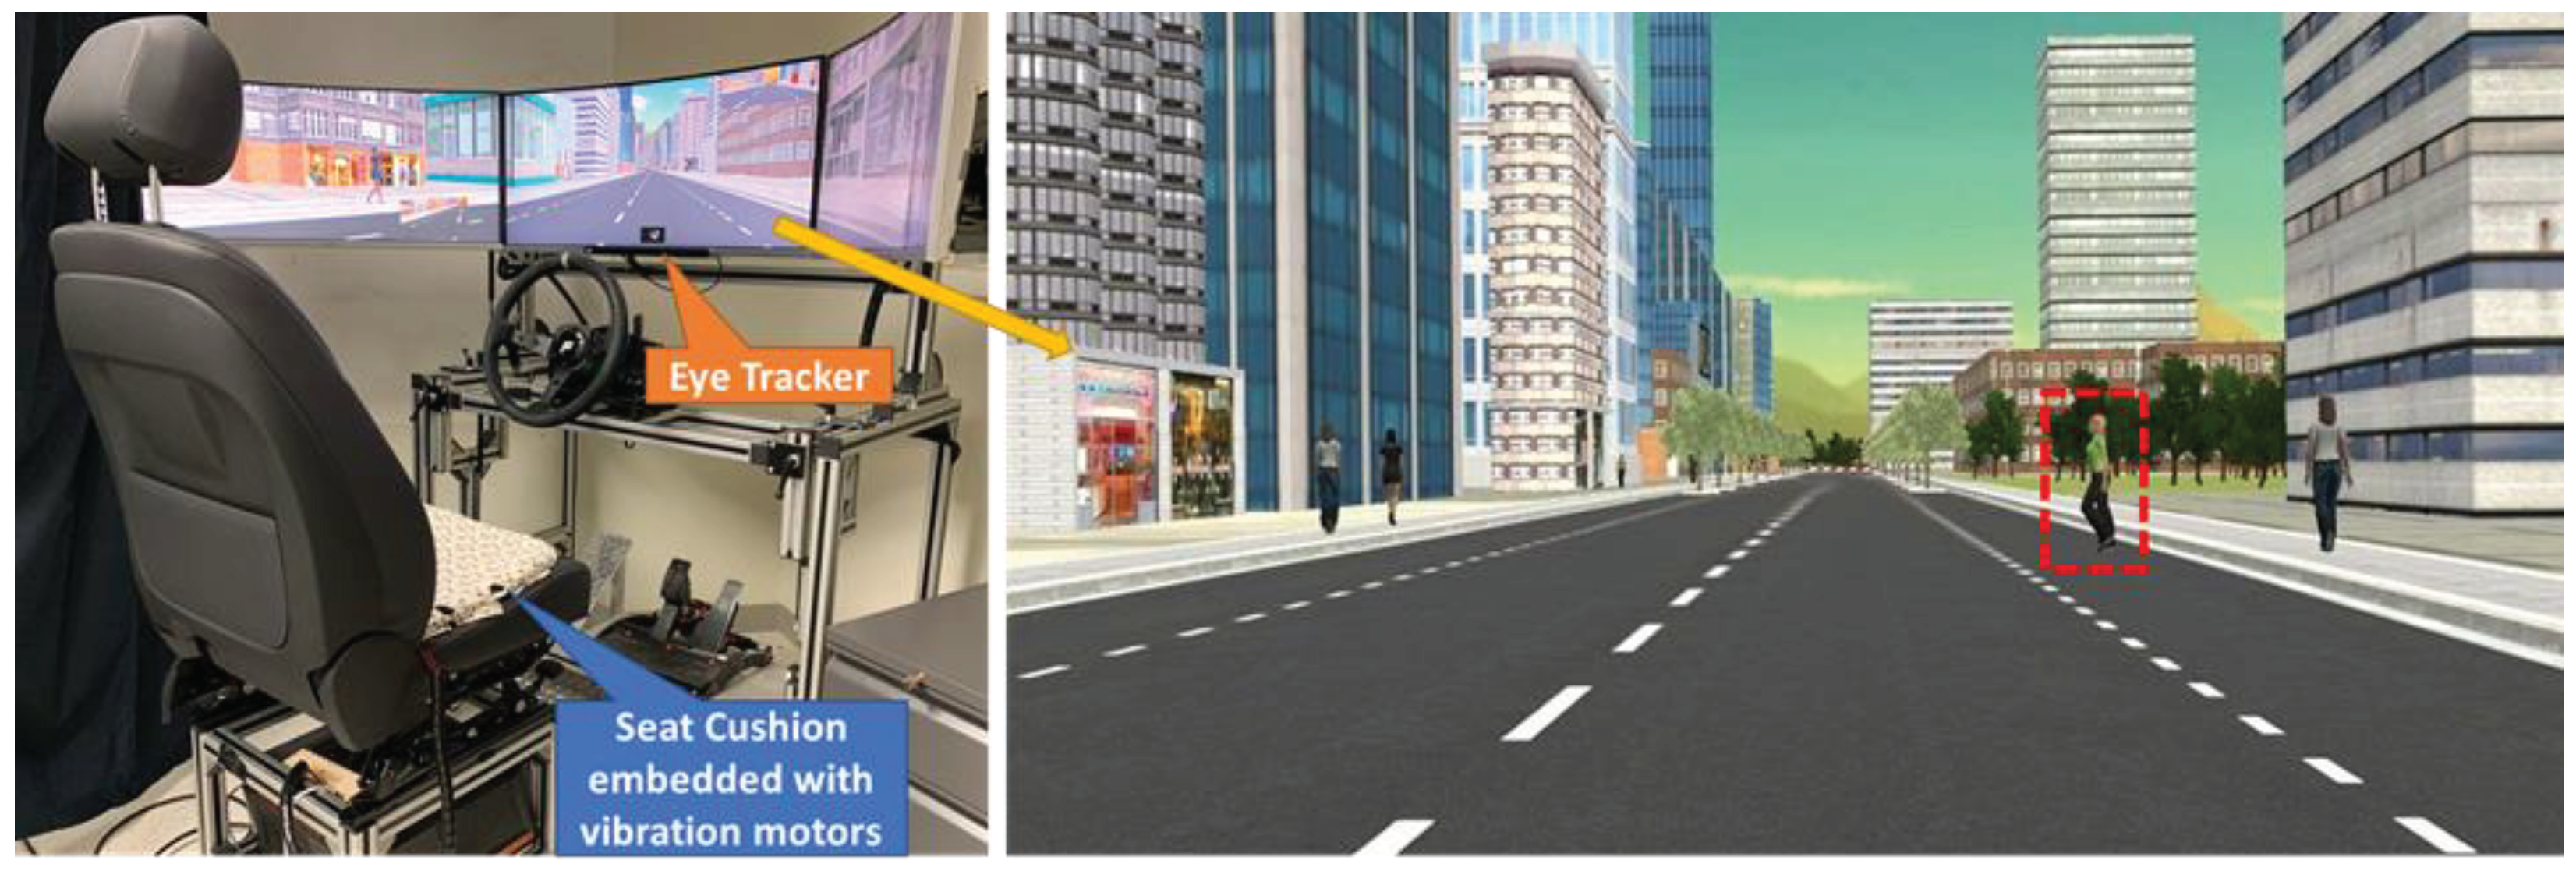
A custom driving simulator was used with three 34" curved monitors (Samsung C34F79, 3440 x 1440 pixels, 21:9 aspect ratio, 4 ms response time), providing a 165.5° horizontal by 26.5° vertical field of view (
Figure 1). The simulated vehicle had control inputs provided by a steering wheel with force feedback and a pedal setup of a car with automatic transmission (Fanatec ClubSport Wheel Base V2 and Pedals V3, Landshut, Germany). A Tobii 4C eye tracker (Tobii, Danderyd, Sweden) was mounted on the bottom of the center screen to capture gaze position on that screen (approximately 55° horizontal field of view) at 90 Hz.
Prototype Vibro-Tactile Warning System
Vibrational warnings were delivered through a custom tactile warning device which included a seat cushion with embedded vibration motors (Pico Vibe vibration motors type 307-103 (Precision Microdrives, London, UK)), three motors on the left side and three on the right side. The device was connected to the driving simulator and was controlled by simulator software. When collision risk exceeded a pre-determined threshold (see “Defining the warning threshold” below), participants received a 500ms (Summers et al., 1997) vibration from the motors in either the left or right side of the seat cushion, indicating a pedestrian hazard was approaching from either the left or right side, respectively. The intensity and duration of vibrations were based on those used in a previous study (Holzl et al., 2021) and could be easily sensed by all participants when driving.
Driving Simulator Scenarios and Pedestrian Crossing Events
The driving simulator software and virtual city scenarios were developed in-house using Unity 3D (Unity, San Francisco, USA). We created a customized, populated city environment, using high fidelity 3D models and animations to simulate pedestrians, crowds, cross traffic, and other vehicles on the road. The posted speed limit was 25 mph (40.2 km/h). Participants drove along pre-determined routes guided by simple auditory GPS navigation instructions (e.g., “turn right at next intersection”). Each route took about 10 to 12 minutes to complete and included other oncoming and cross traffic as well as pedestrian hazards. Data about the driver’s vehicle, status of pedestrian hazards and driver inputs (brake, gas pedal) were recorded at 50 Hz along with the gaze position data (down sampled from 90 to 50 Hz).
Ten pedestrians were programmed at mid-block locations along each route (see
Figure 1 and
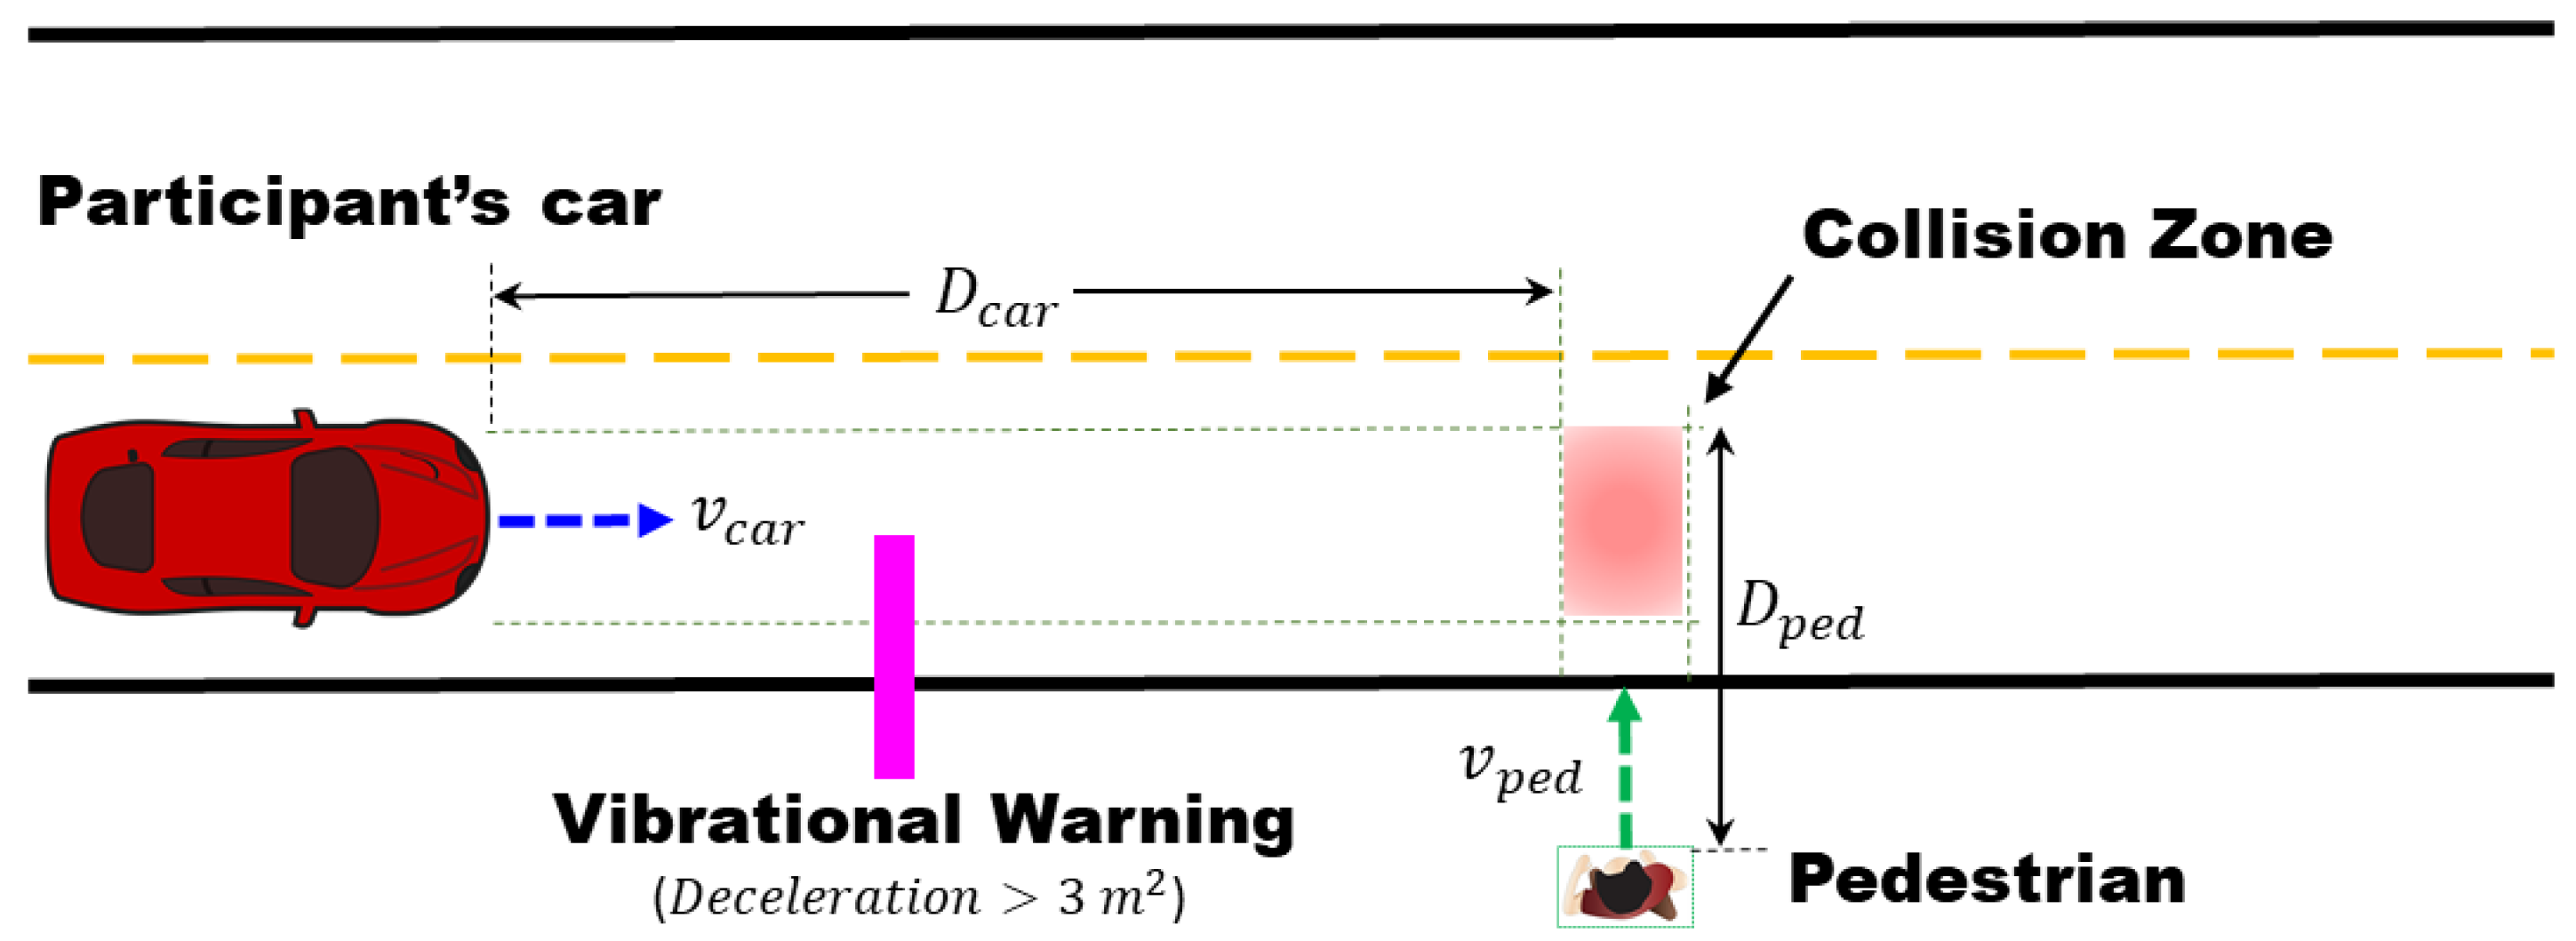
Figure 2) to represent a realistic hazard on an orthogonal collision course with the participant’s vehicle. Once the predicted times to the collision zone were identical for both the participant’s car and the pedestrian, the pedestrian appeared from behind a building (at an eccentricity of about 13°) and began to quickly walk across the sidewalk and then across the street at a constant speed of 2.5 m/s (5.6 mph) without stopping. Thus the pedestrian and car would arrive at the collision zone at the same time, requiring an active braking intervention by the driver to avoid a collision. When collisions occurred, pedestrians were programmed to disappear to reduce the likelihood of participant distress.
In addition to the crossing pedestrian hazards at mid-block locations, two distractor pedestrian events were programmed in each route with the same movement trigger, but the distractor pedestrians stopped before entering the car lane and did not cross the road. Other standing or walking pedestrians, alone and in crowds, were programmed on sidewalks to decrease the anticipation of crossing pedestrian hazard events.
Defining the Warning Threshold
Our warning threshold was designed for drivers with vision impairment, taking account of the fact that they may need more time to detect and respond to a hazard than drivers with NV. The risk of collision between the participant’s vehicle and the next pedestrian hazard was continuously computed while participants drove through the virtual world. Risk level was based on the minimum deceleration needed to safely avoid a collision. For each pedestrian crossing event, if any part of the participant’s vehicle and any part of the pedestrian were simultaneously within the pre-defined collision zone (
Figure 2), a collision was considered to have occurred. Risk level was quantified by the deceleration-to-safety metric (DST (Hupfer, 1997)), used as a safety indicator to describe the level of risk for pedestrian-vehicle conflicts in prior studies (Holzl et al., 2021; Lehsing et al., 2019). In the current study, the DST was the deceleration rate (in m/s
2) required for the participant to prevent the car from entering the collision zone before the pedestrian left the collision zone. Different levels of deceleration thresholds have been used to describe the severity of pedestrian-vehicle encounters (Hupfer, 1997); the higher the DST, the more critical the event. A rate of 1 m/s
2 is considered a threshold for very safe encounters while 6 m/s
2 is considered a threshold for an imminent crash situation; a DST between 2 m/s² and 4 m/s² is categorized as a situation that requires a clear reaction from the driver to avoid a collision. In this study, we classified deceleration rates greater than 3 m/s
2 as risky situations and therefore used 3 m/s
2 as the threshold to trigger a vibrational warning. The warning threshold (deceleration) was calculated using the following equation:
is the distance between the participant’s car and the point where it will enter the collision zone.
is the velocity of the participant’s car.
is the time taken for the pedestrian hazard to exit the collision zone (
Figure 2). 1.885s is the reaction time, based on the prior study of tactile warnings for HFL drivers (Holzl et al., 2021) to give participants with vision impairments enough time to respond to the vibrational cue and detect the pedestrian.
Procedures
Participants were instructed to follow normal traffic rules. After acclimation and practice drives, they completed 2 drives with and 2 without the warning device, in counterbalanced order. The order of the 4 drive routes was also counterbalanced.
Statistical Analyses
The statistical analyses were performed using R (Version 1.1.463). A significance level of p= 0.05 was applied for all statistical tests. We applied a linear mixed-effects analysis for continuous measures (time to first fixation and time to first brake) (Bates et al., 2015). All models included condition (with/without warnings) and vision groups (CVL/HFL/NV or HFL_Blind/HFL_Seeing) as main factors. Pedestrian event number and participant identifier were included as random factors.
Results
Characteristics of the three participant groups are summarized in
Table 1. CVL participants had worse binocular visual acuity (median 20/87) and contrast sensitivity (median 1.24 log units) than the NV (20/13 and 1.94) and HFL groups (20/14 and 1.89).
First Responses in Events with Warnings
CVL and HFL participants received more warnings than NV participants (86% vs 86% vs 70% of all events in drives with warnings, respectively). The number of warnings received did not differ between blind and seeing side for HFL participants (88% vs 84%).
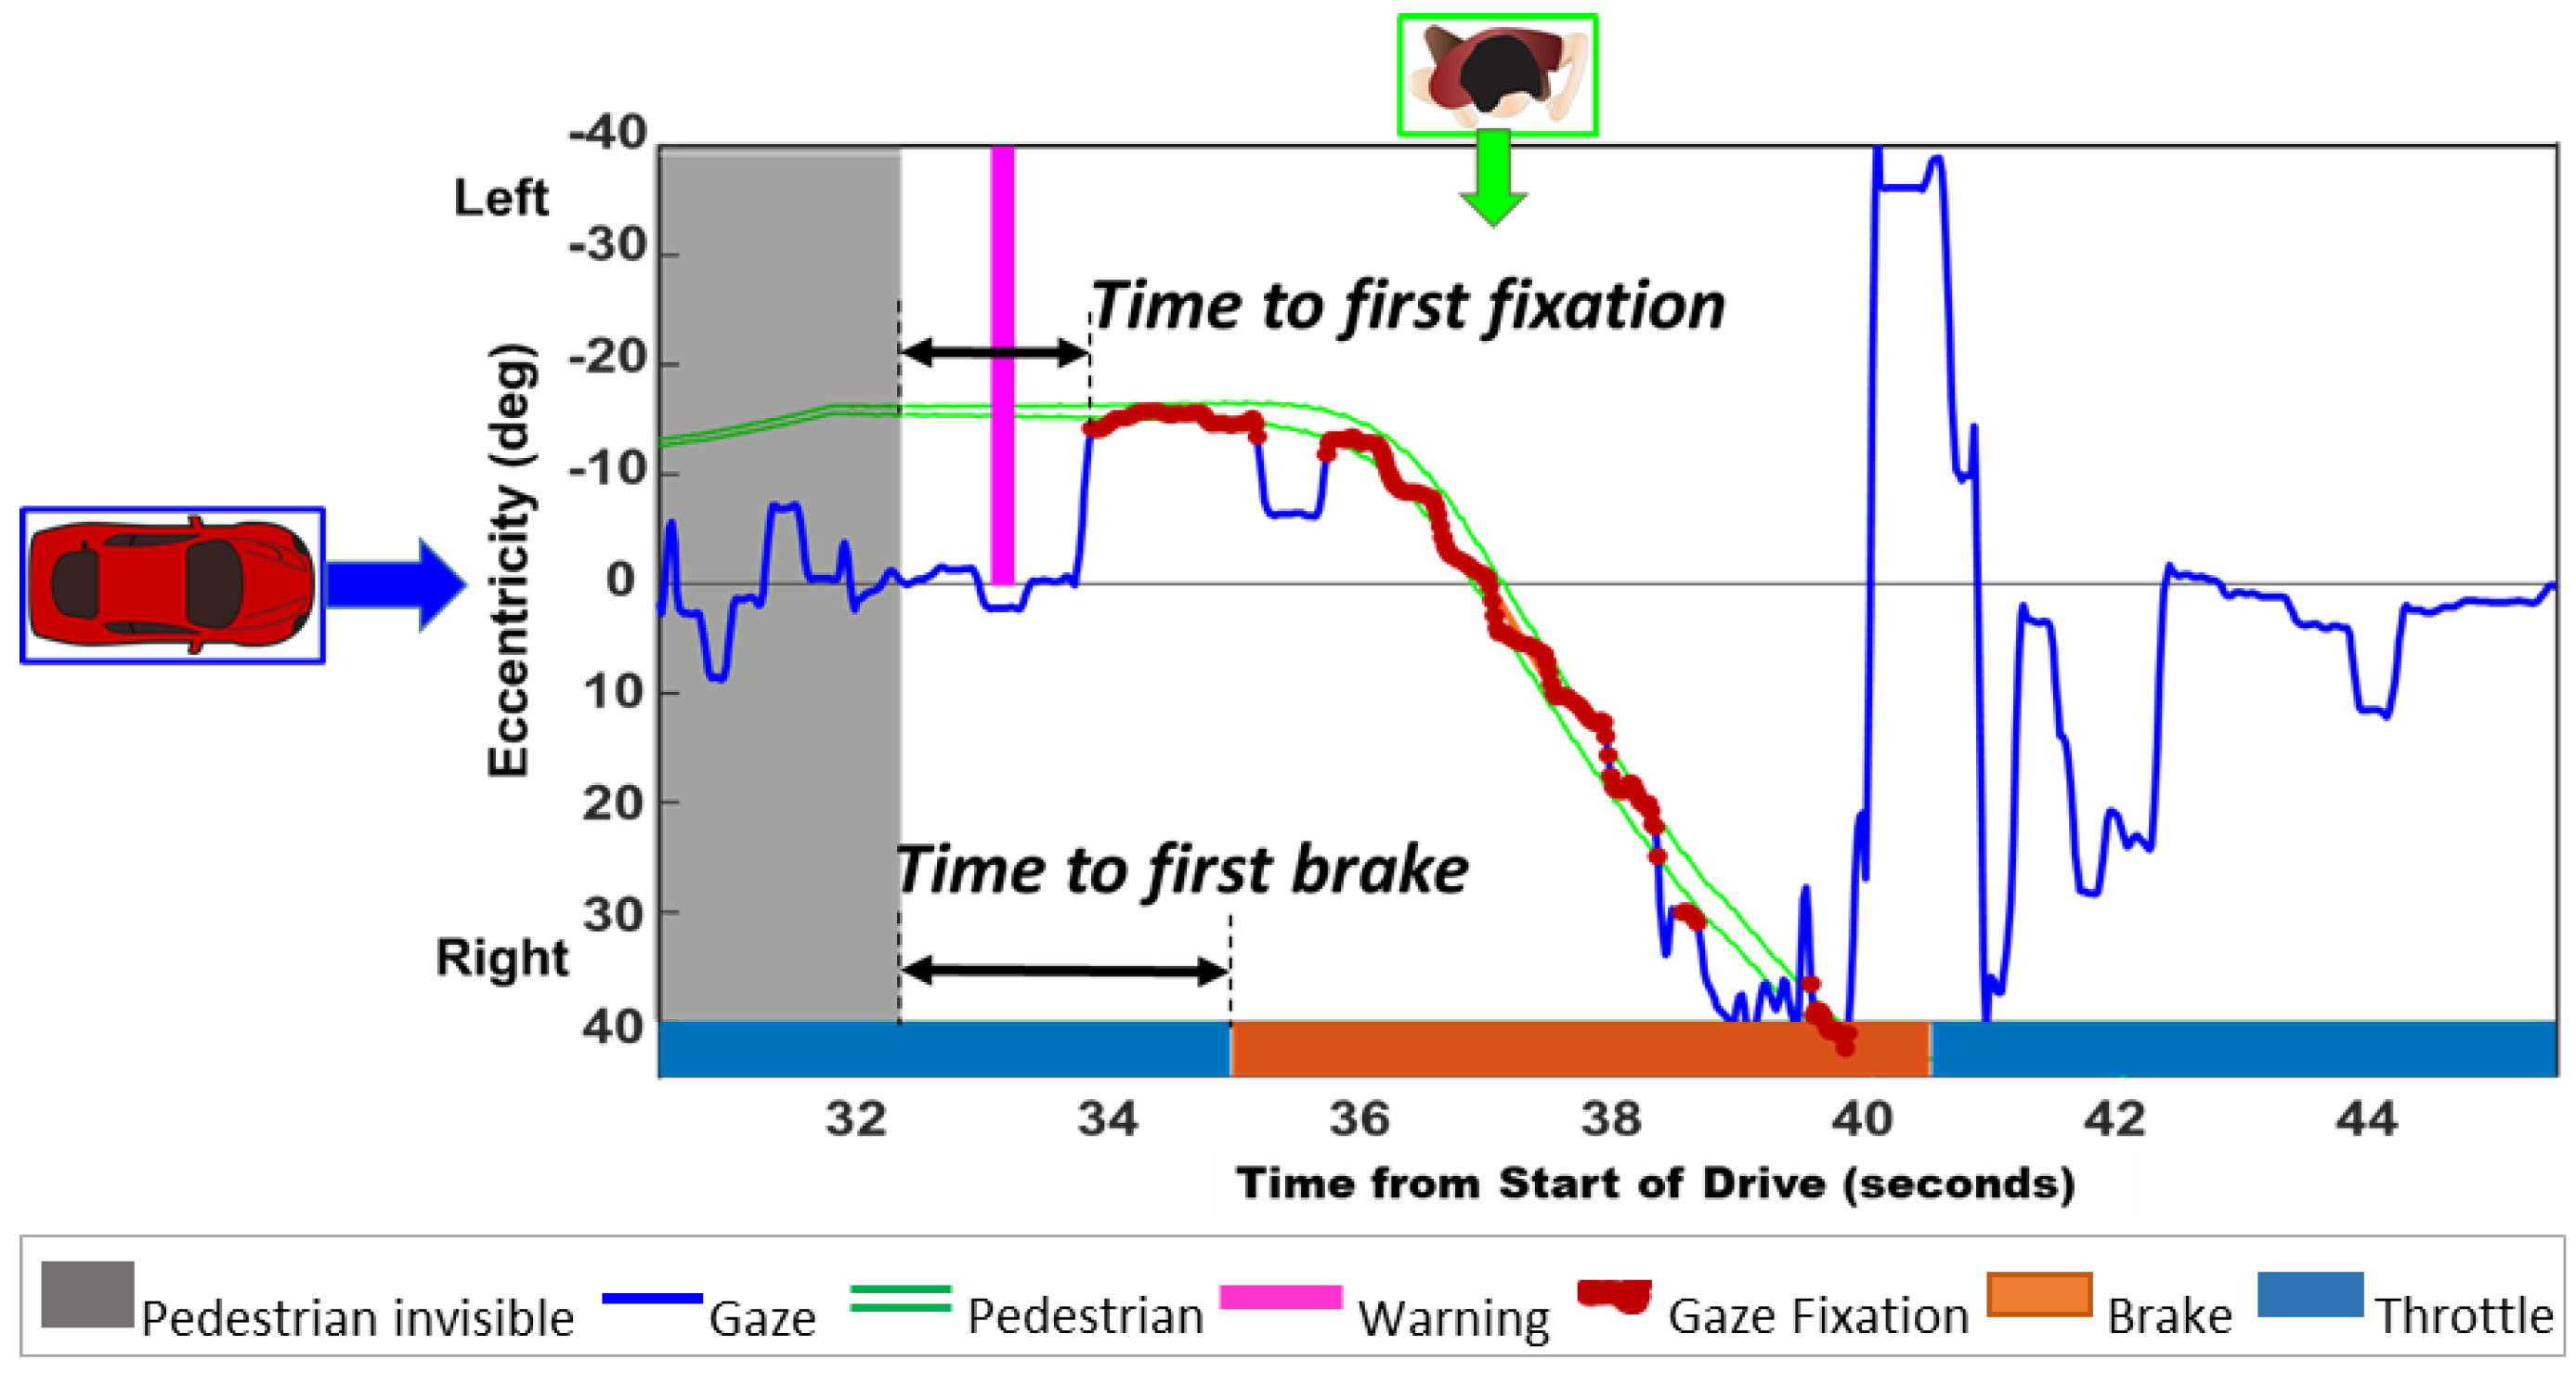
CVL participants made their first fixation on the hazard before the warning in only 28% of events (vs HFL 41% and NV 81%). Most commonly, CVL participants’ first response was to brake after the warning (41% of events vs HFL 14% and NV 0.6%) (
Figure 4). For data combined across the blind and seeing sides, HFL participants’ first response was to fixate on the hazard before the warning in 41% of events (vs CVL 28% and NV 81%) and after the warning in 41% of events (vs CVL 27% and NV 12%). However, behaviors differed for the blind and seeing sides. HFL participants made their first fixation on blind-side hazard before the warning in only 32% of events (vs 50% seeing-side hazards) and in 21% of blind-side events; they braked first after the warning and then fixated the hazard (vs 7% seeing-side hazards).
Events when Collision Risk Exceeded the Threshold
First Fixation Times
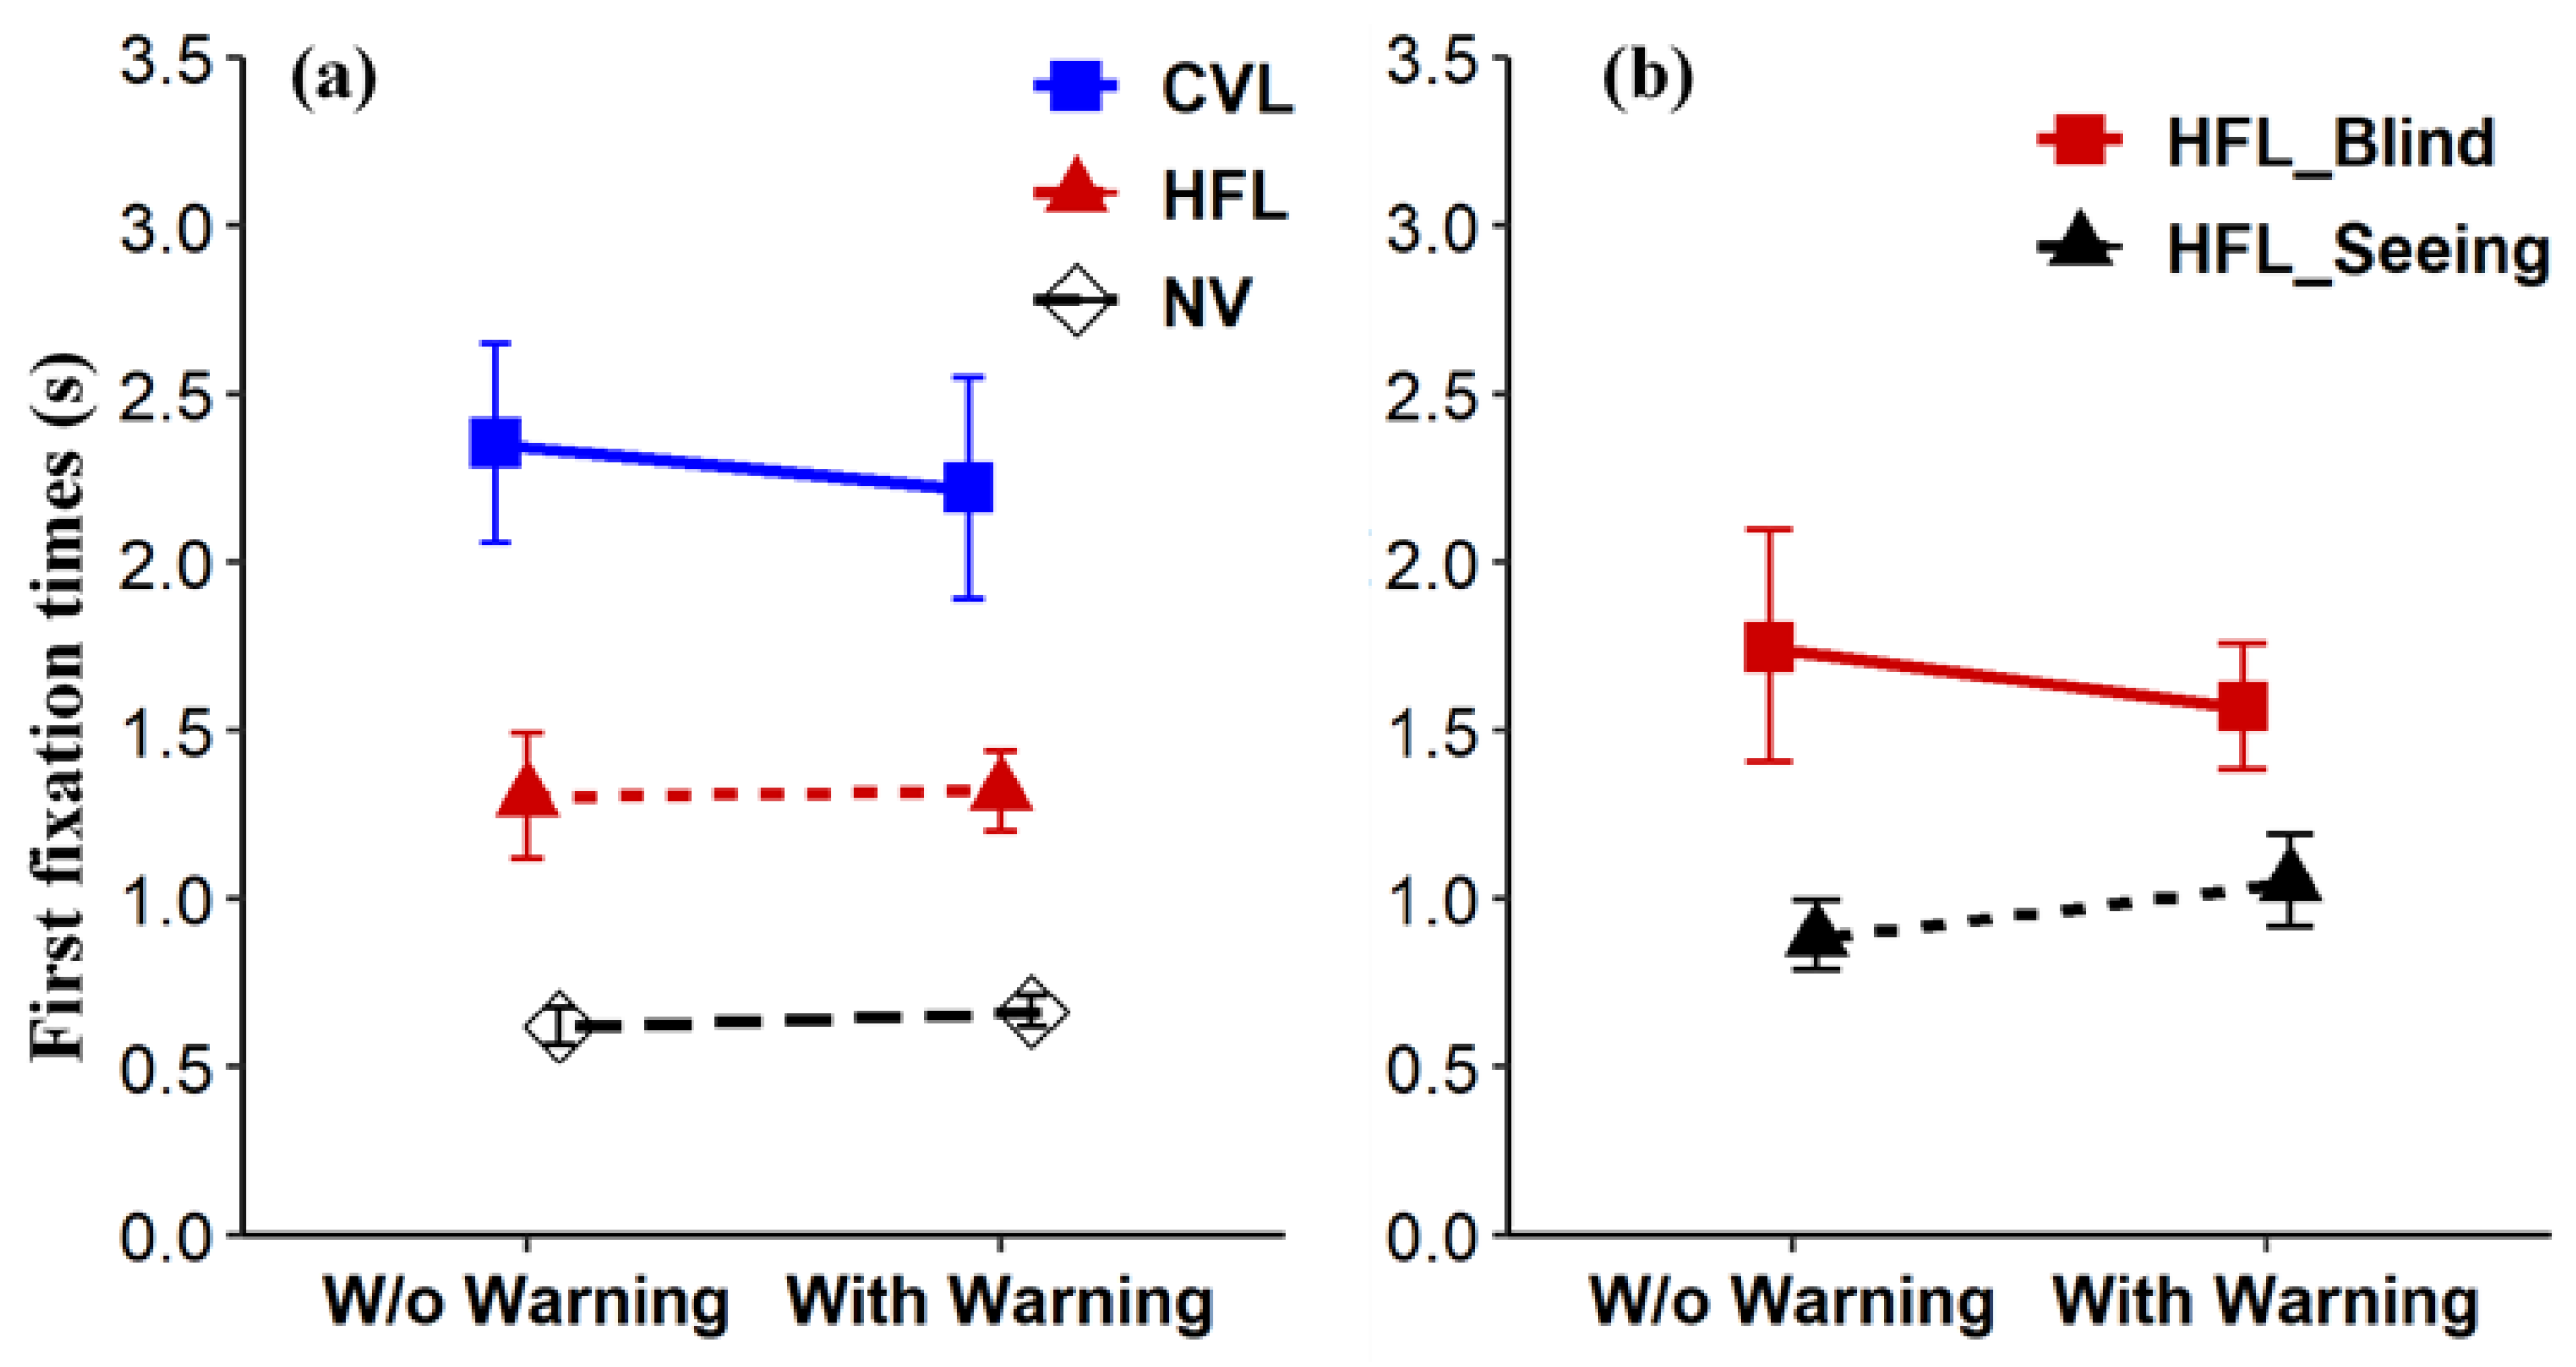
Without warnings, both CVL and HFL participants had longer first fixation times than NV participants (
Figure 5-a and
Table 2), and HFL participants took longer to first fixate on blind-side hazards than seeing-side hazards (
Figure 5-b and
Table 2). Warnings had little effect on first fixation times in general. They slightly reduced first fixation times only for CVL drivers, but had no effect on fixation times for HFL and NV drivers (
Figure 5 and
Table 2).
Brake Response Times
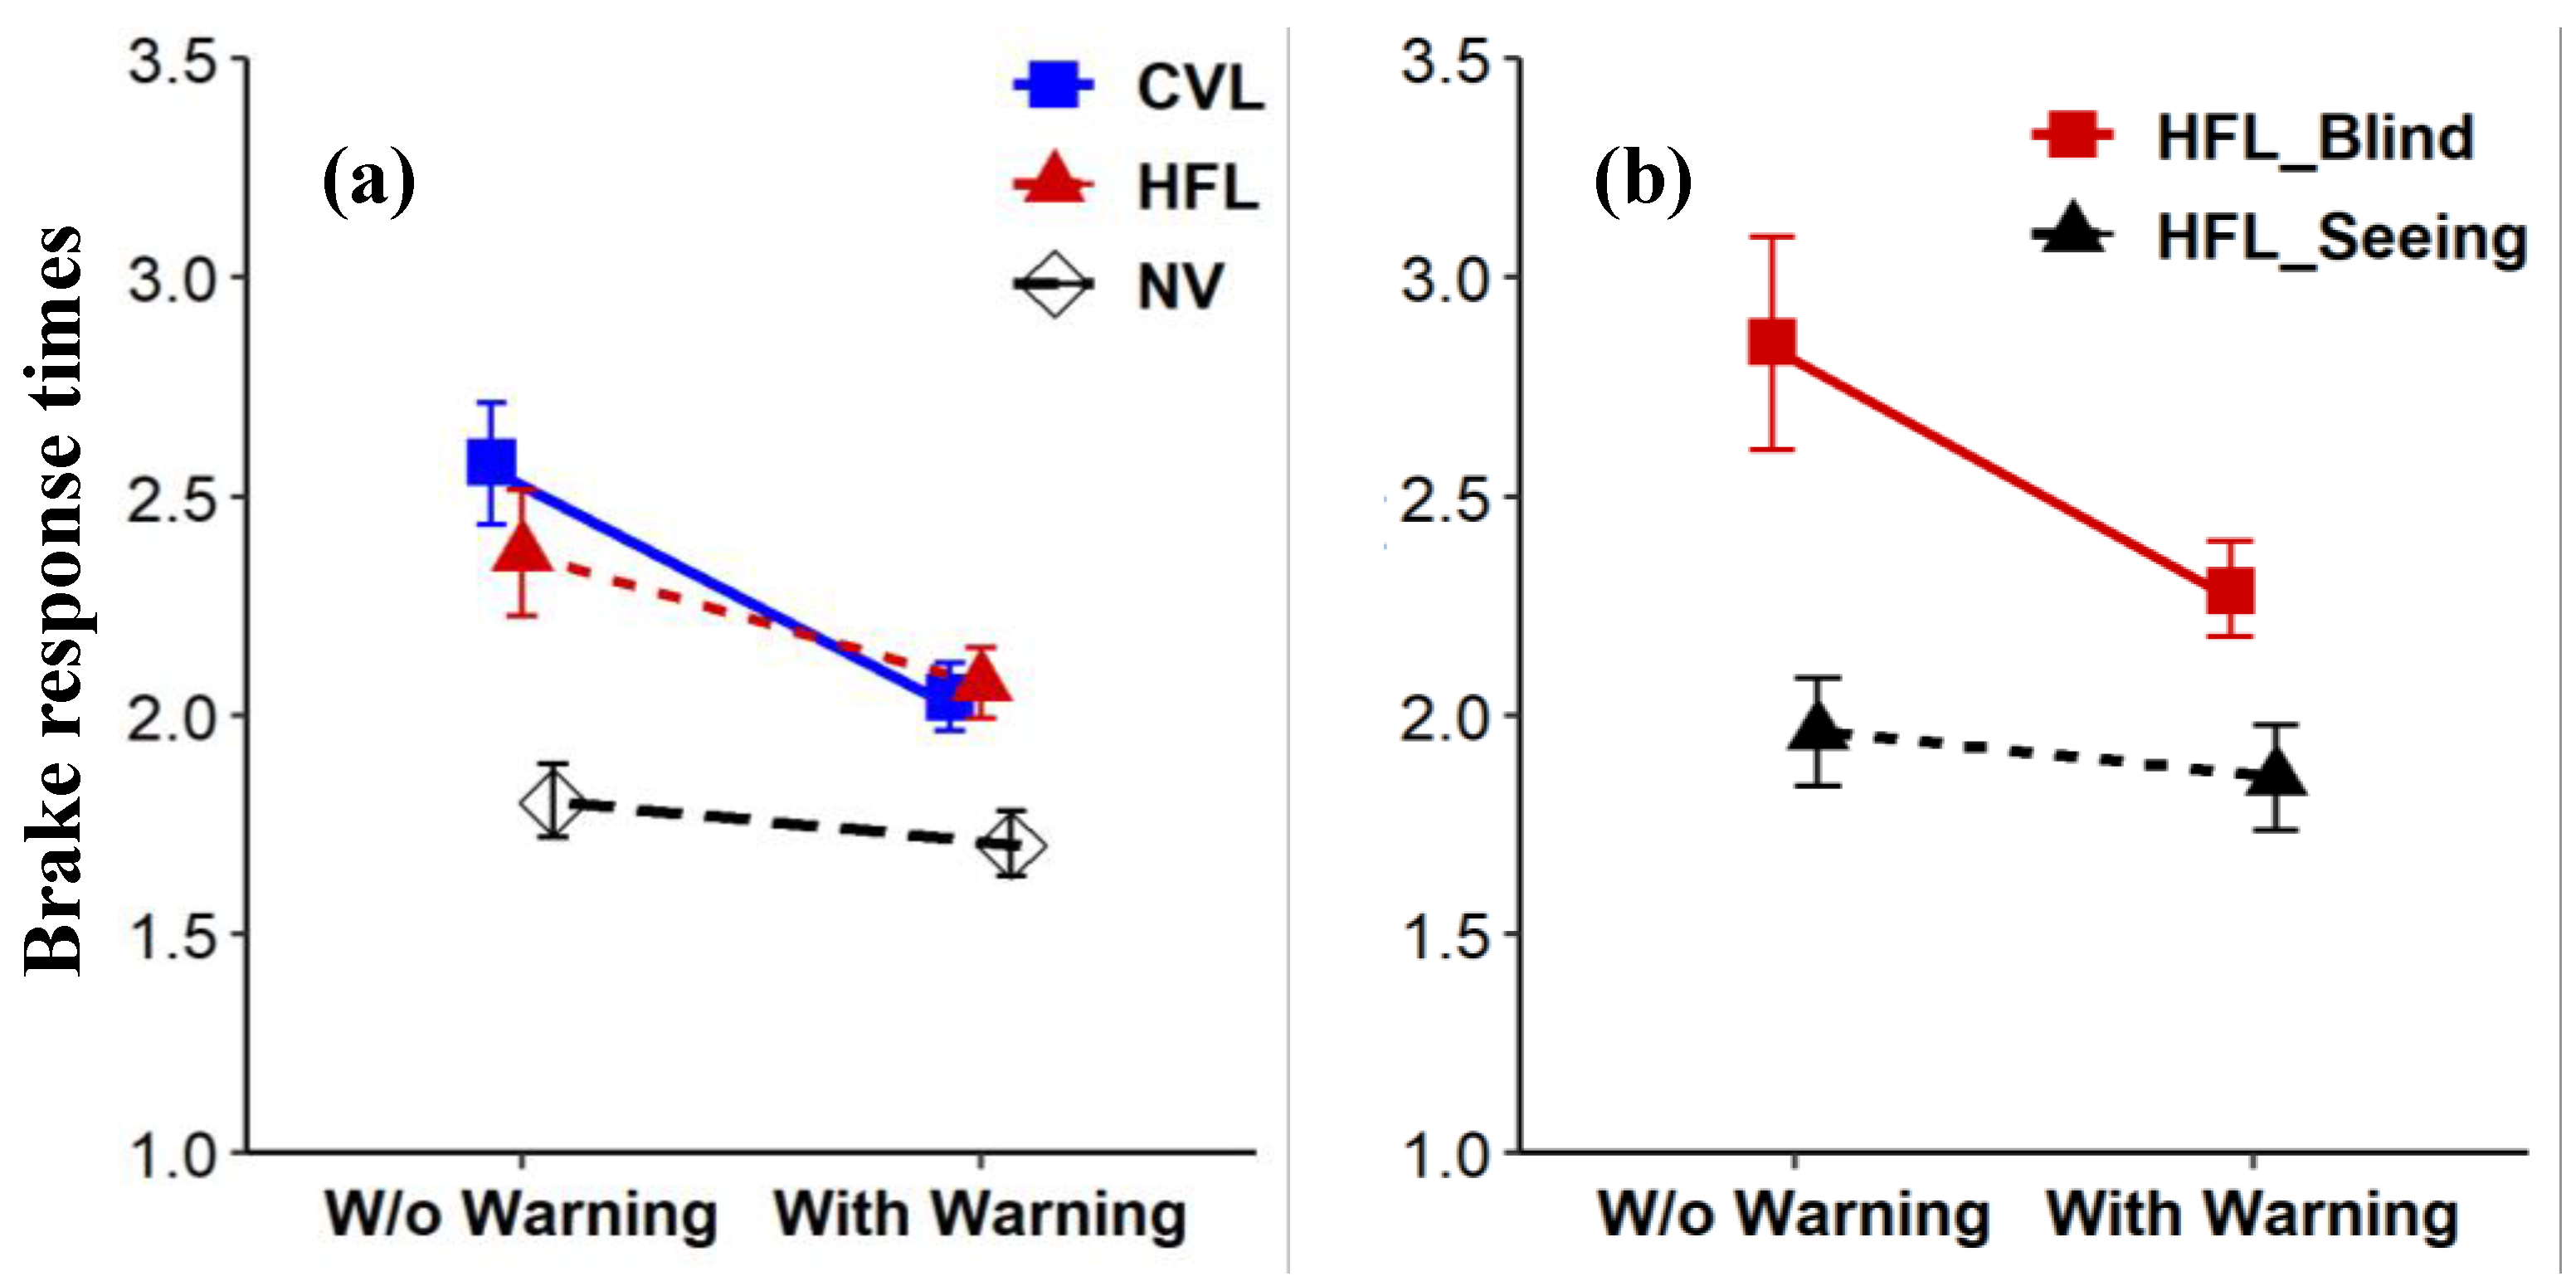
Without warnings, both CVL and HFL participants had longer brake response times than NV participants (
Figure 6-a and
Table 2), and HFL participants took longer to brake for blind-side than seeing-side hazards (
Figure 6-b). When driving with warnings, warnings reduced brake times for both CVL and HFL drivers with a significantly greater reduction for CVL than HFL and NV drivers (interactions p = 0.04 and p < 0.001, respectively;
Figure 6-a). The reduction for HFL drivers did not differ from that for NV drivers (p = 0.12). For HFL participants, the reduction in brake times was primarily for blind-side hazards with no significant effect of the warnings on brake times for seeing side hazards (interaction p = 0.02;
Figure 6-b and
Table 2).
Collision Rates
Without warnings, both CVL and HFL participants had higher collision rates than NV participants (11% vs 16% vs 0.4%). Among all collisions for HFL participants, 95% happened on the blind side (vs. 5% on seeing side). When driving with the warning device, collision rates were reduced to 0% for CVL participants and to 0.8% for HFL participants (blind and seeing sides combined). For HFL participants, warnings significantly reduced collision rates for blind side hazards (30% vs 1.7%; p < 0.001) but not seeing-side hazards (1.7% vs 0.0%).
Discussion
Consistent with prior studies (Alberti et al., 2014; Bowers et al., 2009; Bronstad et al., 2015; Bronstad et al., 2013; Papageorgiou et al., 2012), both vision loss groups showed delayed hazard responses and higher collision rates than NV drivers. When driving without the pedestrian warning system, CVL participants were overall slower to see and respond to pedestrian hazards than NV and HFL participants. HFL participants had slow responses and relatively high collision rates for hazards from the blind (30%), but not the seeing side (1.7%).
Both vision loss groups benefited from using the vibro-tactile hazard warning system. The warnings reduced CVL brake response times by 0.54s and collision rates from 11% to 0%, and HFL blind-side brake times by 0.57s and collision rates from 30% to 1.7%. In contrast, warnings had no effect on HFL seeing-side or NV hazard responses. In fact, NV drivers had usually fixated the hazard before a warning was given and did not need the warning. This makes sense as the warning threshold was specifically designed for vision impaired rather than NV drivers. Our findings suggest the warning threshold was appropriate for our CVL participants for hazards from both sides and for our HFL participants when hazards approached from the blind side. However, a threshold representing a more imminent collision risk would have been more appropriate for HFL seeing-side hazards and NV drivers.
As demonstrated in the hazard fixation behaviors, CVL made it difficult to perceive hazards in general, while HFL made it difficult to notice hazards on the blind side. There was only a low proportion of events where the hazard was fixated before a warning by CVL participants (28%) and by HFL participants (32% blind side vs. 50% seeing side), compared to the high proportion of events by NV participants (81%). After receiving a warning, CVL participants most commonly braked first whereas HFL participants most commonly fixated first and then braked. These results suggest that, for blind-side hazards, the directional warning guided HFL participants to look to the blind side such that they were able to see the hazard with their good vision (normal acuity and contrast sensitivity) in their seeing hemifield and then brake. In contrast, even after receiving a directional warning, the CVL participants still seemed to have difficulty perceiving the hazard, likely because of their impaired central vision (reduced contrast sensitivity, acuity, and in some cases central field loss). Therefore, they were more likely to brake first. Many prior studies demonstrated that the directional tactile warning can effectively communicate spatial information and direct driver attention to impending crashes or potential risky areas (Fitch et al., 2007; Ho et al., 2005; Meng & Spence, 2015); our study shows that this benefit may depend on the visual ability of the driver.
Since this was a small, proof-of-concept study, some limitations need to be considered. First, the vision loss groups were relatively small and heterogeneous, including both current and former drivers. Despite substantial prior driving experience, it is possible that lack of current driving experience may have affected hazard response behaviors of former drivers. Second, we only tested one timing threshold (deceleration > 3 m/s2), but the effects of hazard warnings can depend on the warning timing threshold design (Lee et al., 2002). Third, the pedestrian hazard always exhibited exactly the same behavior after it started to move so we could not evaluate the efficacy of the warning threshold for different pedestrian crossing behaviors. We, did, however, create a city environment with many different types of pedestrians, alone and in crowds, as well as distractor pedestrians that approached the road but did not cross.
In summary, the vibro-tactile warnings reduced brake response times and hence collision risk in both vision loss groups. Consistent with the lateralized field loss, HFL participants benefitted from directional warnings for hazards on the blind but not the seeing side whereas CVL drivers benefitted from warnings for all hazards. These findings suggest that the benefits provided by specific hazard warning system designs may vary, depending on the type of vision impairment and the warning timing design. Future studies are warranted and should compare the relative benefits of different warning modality and timing designs for larger samples of current drivers with different types of vision impairments and more varied pedestrian hazard behaviors.
Funding
This work was supported by the [National Institutes of Health] under Grant [number R01-EY025677]; [Grimshaw-Gadewicz Charitable Foundation]; and [Bosma Enterprises Low Vision Research Award].
Acknowledgments
The authors thank Patrick Baker for help with subject recruitment and data collection.
Conflicts of Interest
The authors report there are no competing interests to declare. The study was supported by National Institutes of Health grant R01-EY025677 (ARB), an award from the Grimshaw-Gadewicz Charitable Foundation (ARB), and a Bosma Enterprises Low Vision Research Award (JX). The funding agencies had no direct involvement in the design and conduct of the study; collection, management, analysis, and interpretation of the data; preparation, review, or approval of the manuscript; and decision to submit the manuscript for publication.
References
- Alberti, C. F. , Peli, E., & Bowers, A. R. (2014). Driving with hemianopia: III. Detection of stationary and approaching pedestrians in a simulator. Invest Ophthalmol Vis Sci. [CrossRef]
- Bach, M. (2007). The Freiburg Visual Acuity Test-variability unchanged by post-hoc re-analysis. Graefes Arch Clin Exp Ophthalmol. [CrossRef]
- Bates, D. , Mächler, M., Bolker, B., & Walker, S. (2015). Fitting linear mixed-effects models using lme4. Journal of Statistical Software. [CrossRef]
- Bowers, A. R. , Mandel, A. J., Goldstein, R. B., & Peli, E. (2009). Driving with hemianopia, I: Detection performance in a driving simulator. Invest Ophthalmol Vis Sci, 5147. [Google Scholar] [CrossRef]
- Bronstad, P. M. , Albu, A., Bowers, A. R., Goldstein, R., & Peli, E. (2015). Driving with central visual field loss II: how scotomas above or below the preferred retinal locus (PRL) affect hazard detection in a driving simulator. PLoS One. [CrossRef]
- Bronstad, P. M. , Bowers, A. R., Albu, A., Goldstein, R., & Peli, E. (2013). Driving with central field loss I: effect of central scotomas on responses to hazards. JAMA Ophthalmol. [CrossRef]
- Cicchino, J. B. (2017). Effectiveness of forward collision warning and autonomous emergency braking systems in reducing front-to-rear crash rates. Accid Anal Prev. [CrossRef]
- Cucuras, M. , Chun, R., Lee, P., Jay, W. M., & Pusateri, G. (2017). GPS Usage in a Population of Low-Vision Drivers. Semin Ophthalmol. [CrossRef]
- Deffler, R. A. , Xu, J., Bittner, A. K., Bowers, A. R., Hassan, S. E., Ross, N., Cooley, S. L., Doubt, A., Davidorf, F. H., Dougherty, B. E., & Group, R. S. (2022). Use and Perceptions of Advanced Driver Assistance Systems by Older Drivers With and Without Age-Related Macular Degeneration. Transl Vis Sci Technol. [CrossRef]
- Fitch, G. M. , Kiefer, R. J., Hankey, J. M., & Kleiner, B. M. (2007). Toward developing an approach for alerting drivers to the direction of a crash threat. M. ( 49(4), 710–720. [CrossRef]
- Gaffary, Y. , & Lécuyer, A. (2018). The use of haptic and tactile information in the car to improve driving safety: A review of current technologies. Frontiers in ICT. [CrossRef]
- Ho, C. , Tan, H. Z., & Spence, C. (2005). Using spatial vibrotactile cues to direct visual attention in driving scenes. Transportation research part F: traffic psychology and behaviour. [CrossRef]
- Holzl, R. , Steckhan, L., Lehsing, C., Savage, S. W., & Bowers, A. R. (2021). Driving with hemianopia VIII: Effects of a vibro-tactile assistance system on safety and gaze behavior in pedestrian crossing situations. Safety (Basel). [CrossRef]
- Hupfer, C. (1997). Deceleration to safety time (DST)-a useful figure to evaluate traffic safety. 1997 ICTCT Conference, Lund, Sweden.
- Lee, J. D. , McGehee, D. V., Brown, T. L., & Reyes, M. L. (2002). Collision warning timing, driver distraction, and driver response to imminent rear-end collisions in a high-fidelity driving simulator. Hum Factors. [CrossRef]
- Lehsing, C. , Ruch, F., Kolsch, F. M., Dyszak, G. N., Haag, C., Feldstein, I. T., Savage, S. W., & Bowers, A. R. (2019). Effects of simulated mild vision loss on gaze, driving and interaction behaviors in pedestrian crossing situations. R. ( 125, 138–151. [CrossRef]
- Meng, F. , & Spence, C. (2015). Tactile warning signals for in-vehicle systems. Accid Anal Prev. [CrossRef]
- Nasreddine, Z. S. , Phillips, N. A., Bedirian, V., Charbonneau, S., Whitehead, V., Collin, I., Cummings, J. L., & Chertkow, H. (2005). The Montreal Cognitive Assessment, MoCA: a brief screening tool for mild cognitive impairment. J Am Geriatr Soc. [CrossRef]
- Noubissie Tientcheu, S. I. , Du, S., & Djouani, K. (2022). Review on Haptic Assistive Driving Systems Based on Drivers’ Steering-Wheel Operating Behaviour. Electronics. [CrossRef]
- Papageorgiou, E. , Hardiess, G., Mallot, H. A., & Schiefer, U. (2012). Gaze patterns predicting successful collision avoidance in patients with homonymous visual field defects. ( 65, 25–37. [CrossRef] [PubMed]
- Peli, D. , & Peli, E. (2002). Driving with Confidence: A Practical Guide to Driving with Low Vision. World Scientific Publishing Company.
- Petermeijer, S. M. , Abbink, D. A., Mulder, M., & de Winter, J. C. (2015). The Effect of Haptic Support Systems on Driver Performance: A Literature Survey. IEEE Trans Haptics. [CrossRef]
- Pfeiffer, E. (1975). A short portable mental status questionnaire for the assessment of organic brain deficit in elderly patients. J Am Geriatr Soc. [CrossRef]
- Salvucci, D. D. , & Goldberg, J. H. (2000). Identifying fixations and saccades in eye-tracking protocols. 2000 symposium on Eye tracking research & applications (ETRA), Florida, USA.
- Schenkenberg, T. , Bradford, D. C., & Ajax, E. T. (1980). Line bisection and unilateral visual neglect in patients with neurologic impairment. T. ( 30(5), 509–517. [CrossRef]
- Seaman, S. , Gershon, P., Angell, L., Mehler, B., & Reimer, B. (2022). Evaluating the associations between forward collision warning severity and driving context. ( 8(1), 1–5. [CrossRef]
- Stevens, C. , Xu, J., & Bowers, A. R. (2022). Use of Advanced Driver Assistance Systems by Bioptic and Normal Vision Drivers. Invest Ophthalmol Vis Sci, 2466. [Google Scholar]
- Summers, I. R. , Cooper, P. G., Wright, P., Gratton, D. A., Milnes, P., & Brown, B. H. (1997). Information from time-varying vibrotactile stimuli. J Acoust Soc Am, 3696. [Google Scholar] [CrossRef]
- Vanier, M. , Gauthier, L., Lambert, J., Pepin, E. P., Robillard, A., Dubouloz, C. J., Gagnon, R., & Joannette, Y. (1990). Evaluation of left visuospatial neglect: norms and discrimination power of two tests. Neuropsychology. [CrossRef]
- Wang, J. S. (2019). Target Crash Population For Crash Avoidance Technologies in Passenger Vehicles (Report No. DOT HS 812 653). Washington, DC: National Highway Traffic Safety Administration.
- 31. Xu J, Hutton A, Dougherty BE, Bowers AR. Driving difficulties and preferences of advanced driver assistance systems by older drivers with central vision loss. Transl Vis Sci Technol.
- Xu, J. , Kendrick, K., & Bowers, A. R. (2022). Clinical Report: Experiences of a Driver with Vision Impairment when Using a Tesla Car. Optom Vis Sci. [CrossRef]
|
Disclaimer/Publisher’s Note: The statements, opinions and data contained in all publications are solely those of the individual author(s) and contributor(s) and not of MDPI and/or the editor(s). MDPI and/or the editor(s) disclaim responsibility for any injury to people or property resulting from any ideas, methods, instructions or products referred to in the content. |
© 2024 by the authors. Licensee MDPI, Basel, Switzerland. This article is an open access article distributed under the terms and conditions of the Creative Commons Attribution (CC BY) license (https://creativecommons.org/licenses/by/4.0/).
