1. Introduction
Rainfall patterns are important for a country's socioeconomic growth and general well-being, especially in areas where agriculture is a major economic activity. Ethiopia, a country whose economy is based primarily on agriculture, is highly dependent on rainfall for crop cultivation and food production. For this reason, precise rainfall pattern prediction and analysis are crucial to the nation's ability to manage its water resources, plan its agriculture, and be ready for emergencies.
Many studies have been carried out over time to comprehend and predict patterns of rainfall in different parts of the world. In order to represent the intricate dynamics of precipitation, these research have investigated a wide range of methodologies, such as statistical models, machine learning techniques, and physical models[
1]. Because of its ease of use, interpretability, and capacity to capture linear correlations between rainfall and pertinent predictor variables, linear regression modeling has become one of the most often used techniques for rainfall prediction and analysis among these approaches.
Prior studies conducted in Ethiopia have examined rainfall patterns and their effects on hydrological systems, agricultural productivity, and climate change adaptation. investigated long-term rainfall trends in various Ethiopian regions using time series analysis. Similar to this, Smith and associates used machine learning algorithms to forecast differences in monthly rainfall in particular regions of the nation[
2]. These investigations have shed important light on how complex Ethiopia's rainfall patterns are.
But even with these important additions, more work is still required to precisely anticipate and examine Ethiopian rainfall patterns using linear regression modeling. Using this method, we can find linear correlations between rainfall and pertinent variables including climate indices, atmospheric conditions, and geographic features. These discoveries can improve our comprehension of the fundamental processes causing Ethiopia's rainfall variability and make more precise forecasts possible for more effective planning and decision-making[
3].
Thus, the purpose of this study is to close this gap by predicting and analyzing Ethiopia's rainfall patterns using a linear regression modeling approach. We are working to create a reliable and understandable model that can offer important insights into the causes controlling rainfall variability in the area by utilizing historical rainfall data and related predictor variables[
4]. In addition, we want to examine the model's performance and suitability for real-world uses such water resource management, agricultural planning, and climate change adaption tactic[
5]. The methods used, the analysis we conducted, and the possible ramifications and uses of our findings will all be covered in the parts that follow in this study[
6]. Our goal in using linear regression modeling to the analysis of Ethiopian rainfall patterns is to add to the body of information already in existence and offer significant insights for sustainable development in the area. We have formulated the following Research Questions:
Compared to other often used statistical and machine learning techniques, how successful is linear regression modeling in predicting rainfall patterns in Ethiopia?
Given the existing corpus of research and empirical study, which key predictor factors exhibit statistically significant linear connections with rainfall patterns in Ethiopia?
How does Ethiopia's rainfall forecast using the linear regression model fare better than similar studies conducted elsewhere in the world using the same modeling technique? Does the model's prediction accuracy depend on any Ethiopian-specific factors?
2. Methodology
2.1. Data Collection
Compile Ethiopia's historical rainfall data from dependable sources, such as international climate databases, government databases, and weather stations. Make sure there are long-term and seasonal fluctuations in the data by ensuring it spans a meaningful amount of time.
Determine and gather pertinent predictor variables that could affect Ethiopia's rainfall patterns, such as the country's physical characteristics (height, slope, and land cover), the atmosphere's characteristics (temperature, humidity, and wind speed), and climate indicators (El Niño Southern Oscillation, Indian Ocean Dipole).
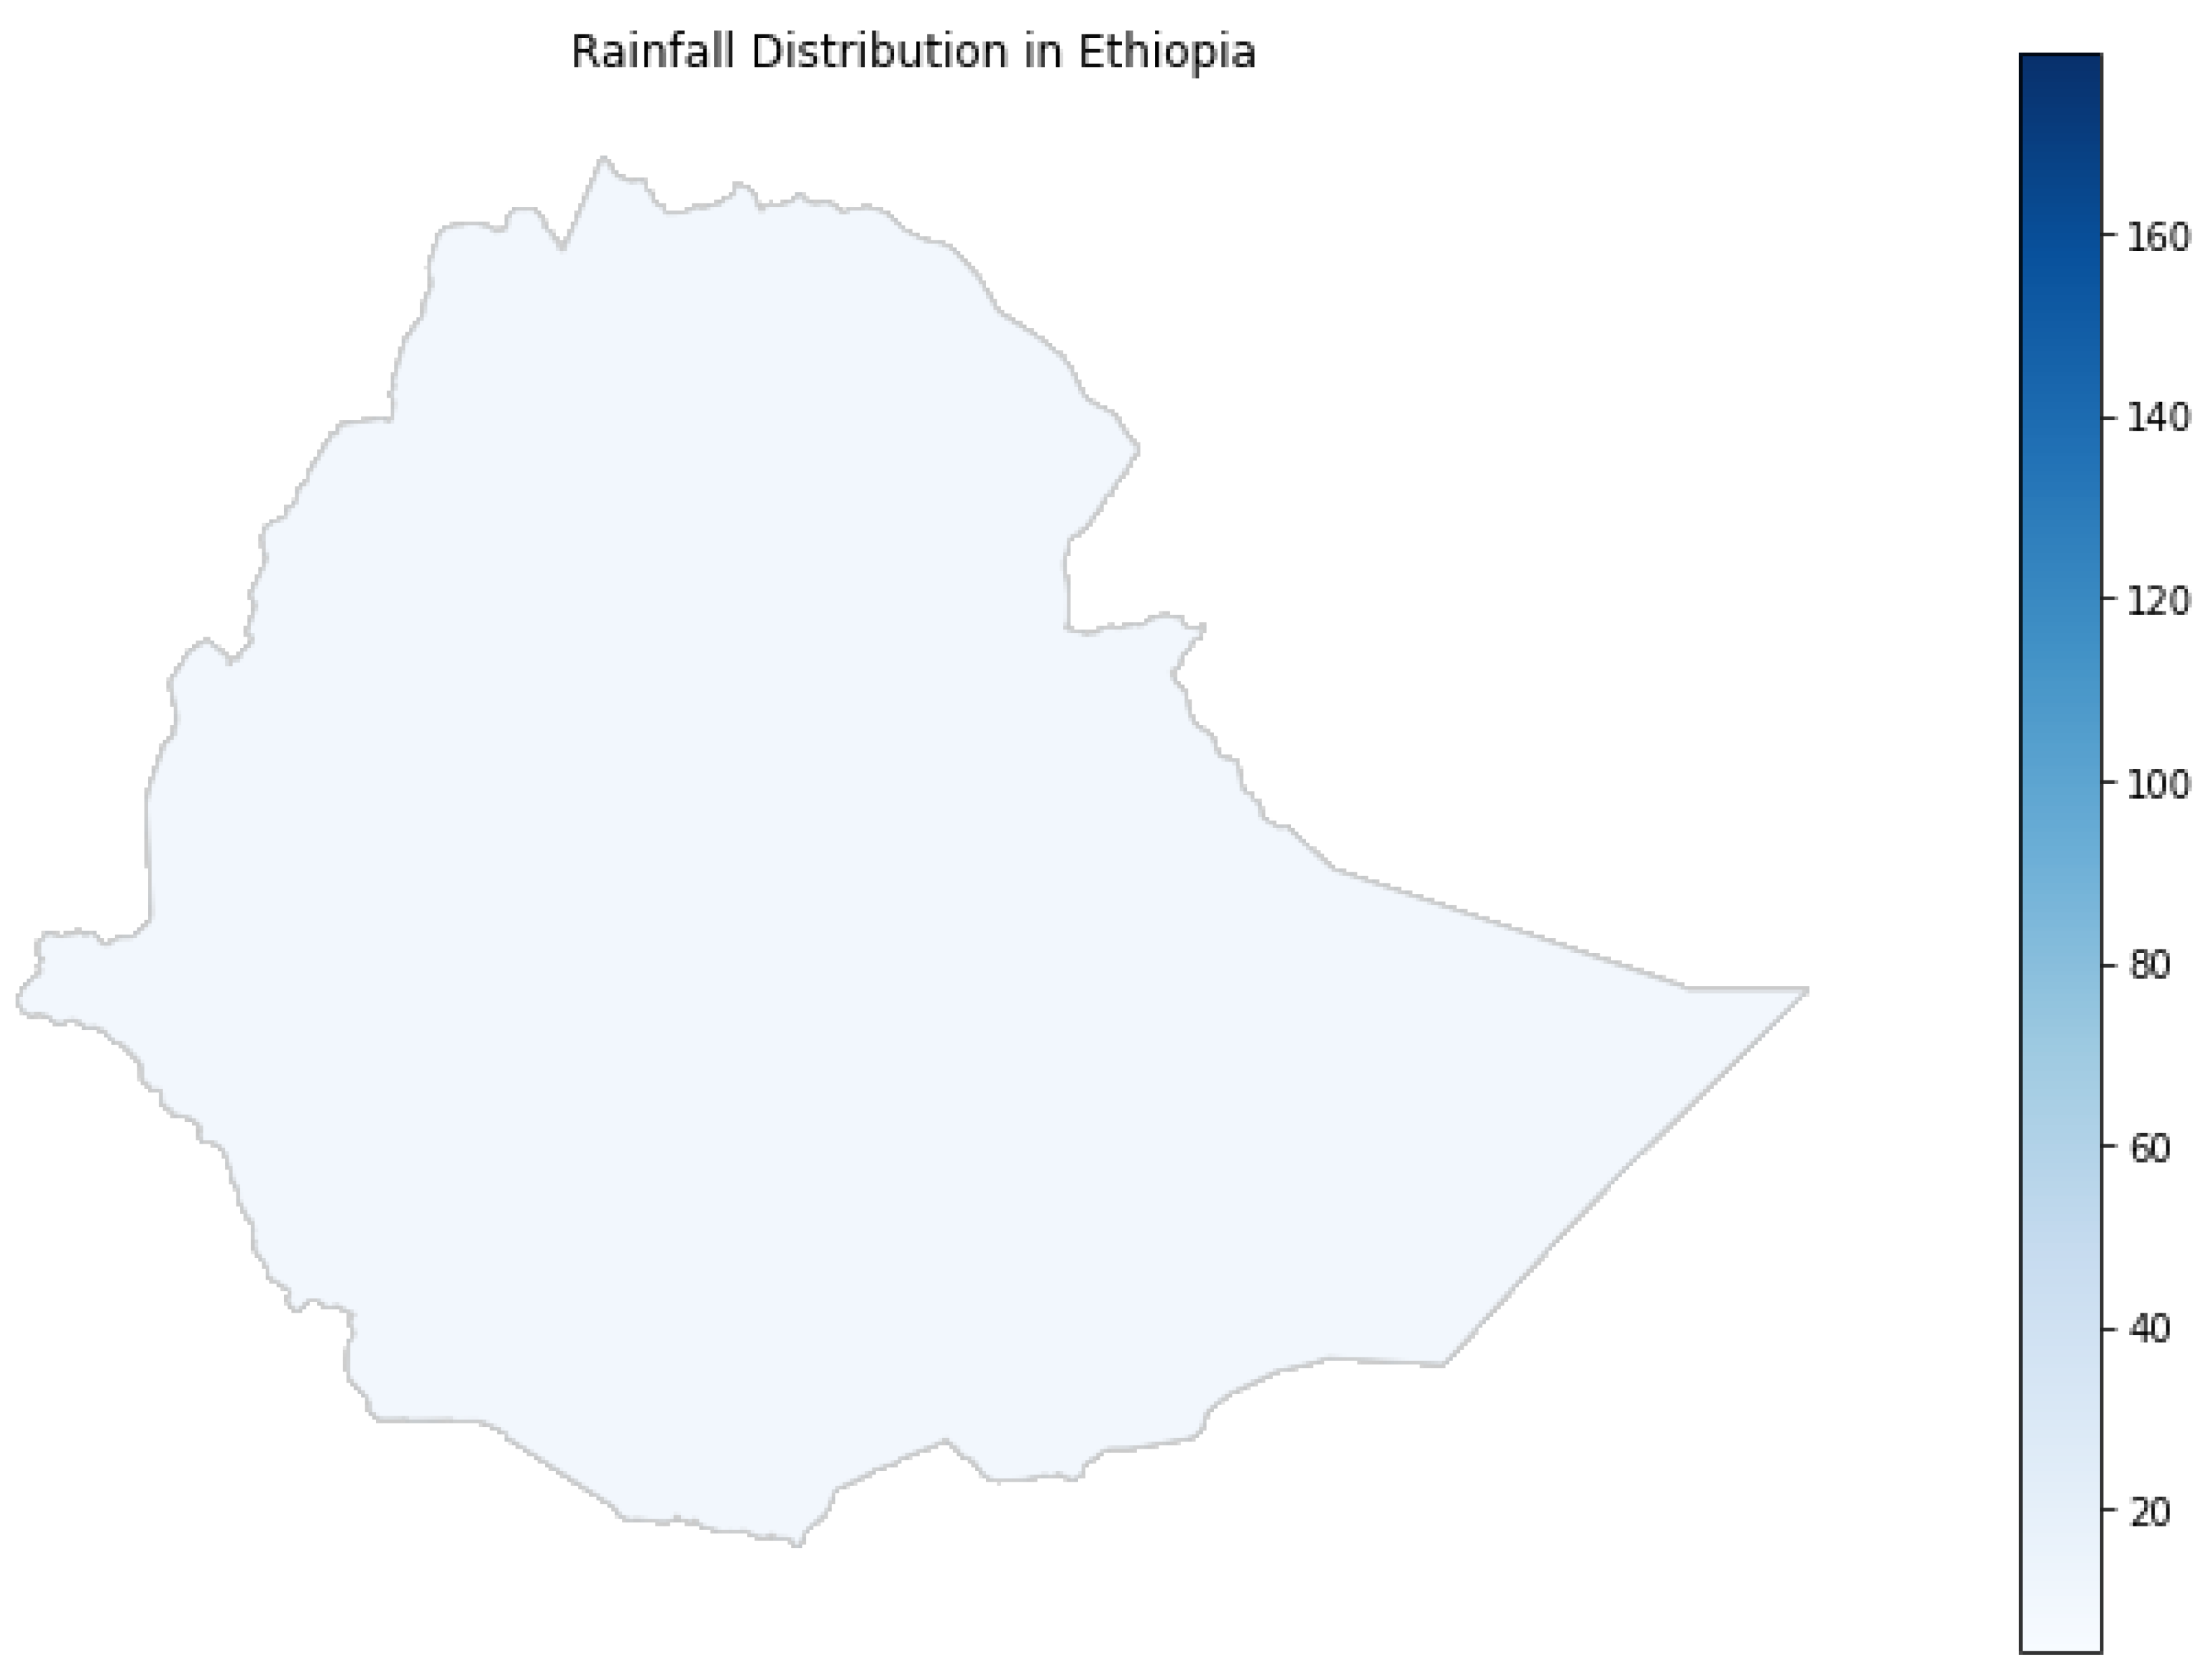
Figure 1.
Rainfall distribution in Ethiopia.
Figure 1.
Rainfall distribution in Ethiopia.
2.2. Data Preprocessing
Examine the rainfall and predictor variable datasets for missing values, outliers, or discrepancies. Take appropriate action. To comprehend the distribution, range, and correlations between variables, use exploratory data analysis, or EDA. To obtain some first insights, visualize the data using graphs, histograms, and correlation matrices.
Table 1.
Sample dataset rainfall time series data for Ethiopia.
Table 1.
Sample dataset rainfall time series data for Ethiopia.
| index |
month |
year |
Country name |
mean |
| 0 |
1.0 |
1990.0 |
Ethiopia |
10.803062 |
| 1 |
2.0 |
1990.0 |
Ethiopia |
50.337936 |
| 2 |
3.0 |
1990.0 |
Ethiopia |
58.049030 |
| 3 |
4.0 |
1990.0 |
Ethiopia |
105.901694 |
| 4 |
5.0 |
1990.0 |
Ethiopia |
60.446742 |
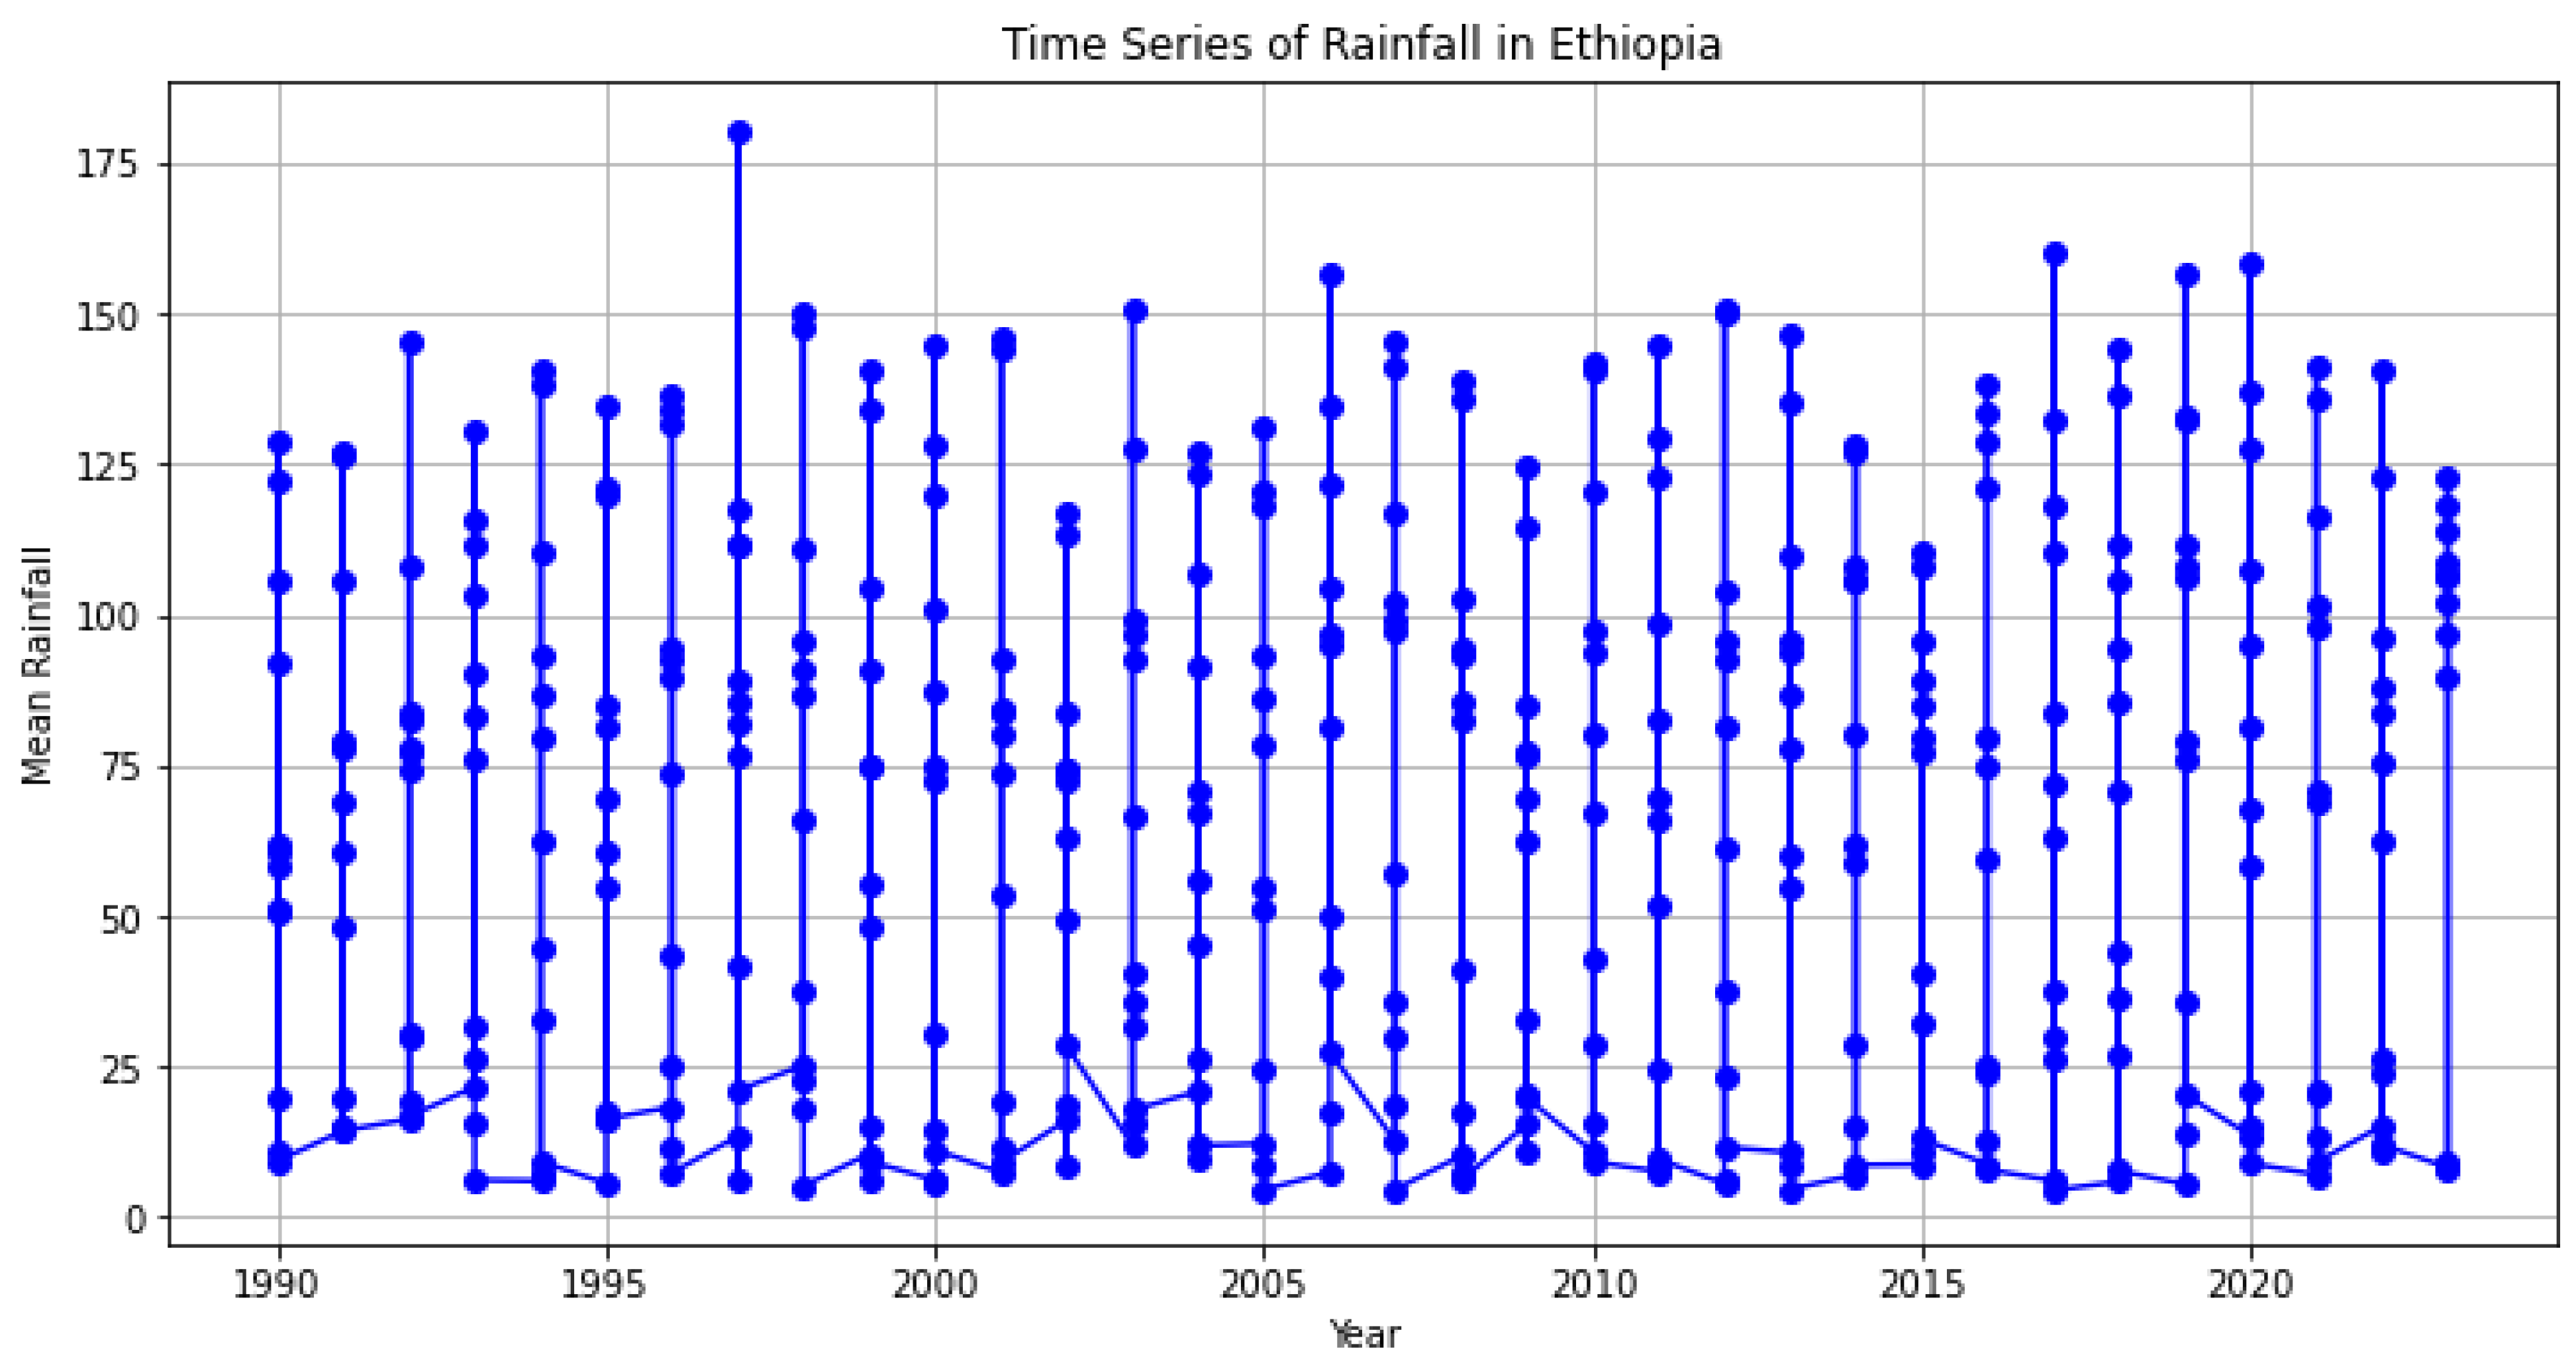
Here is the time series plot showing the mean rainfall in Ethiopia over the years.
Figure 2.
Time series of rainfall in Ethiopia over the year.
Figure 2.
Time series of rainfall in Ethiopia over the year.
2.3. Feature Engineering
If more features are required, extract them by computing seasonal or monthly averages, tracking variables, or combining predictor variables at several spatial scales (e.g., region-wise averages).
3. Model Selection
Given its interpretability and capacity to capture linear connections between rainfall and predictor variables, select linear regression as the modeling technique. Depending on the complexity of the dataset and any potential multicollinearity difficulties, you can also investigate other linear regression modifications, such as multiple linear regression, stepwise regression, or ridge regression. Using a chronological split to ensure temporal integrity, divide the dataset into training and testing subsets. Using the training set of data, fit the linear regression model and estimate the coefficients for each predictor variable[
5]. Examine the residuals, or the difference between the amount of rainfall that was forecast and what actually fell, for any trends or systematic errors. If necessary, adjust the factors already in place or add new predictor variables to address any problems. Verify that the model assumptions are met by carrying out model diagnostics, such as examining the residuals' normality, homoscedasticity, and lack of multicollinearity [
7].
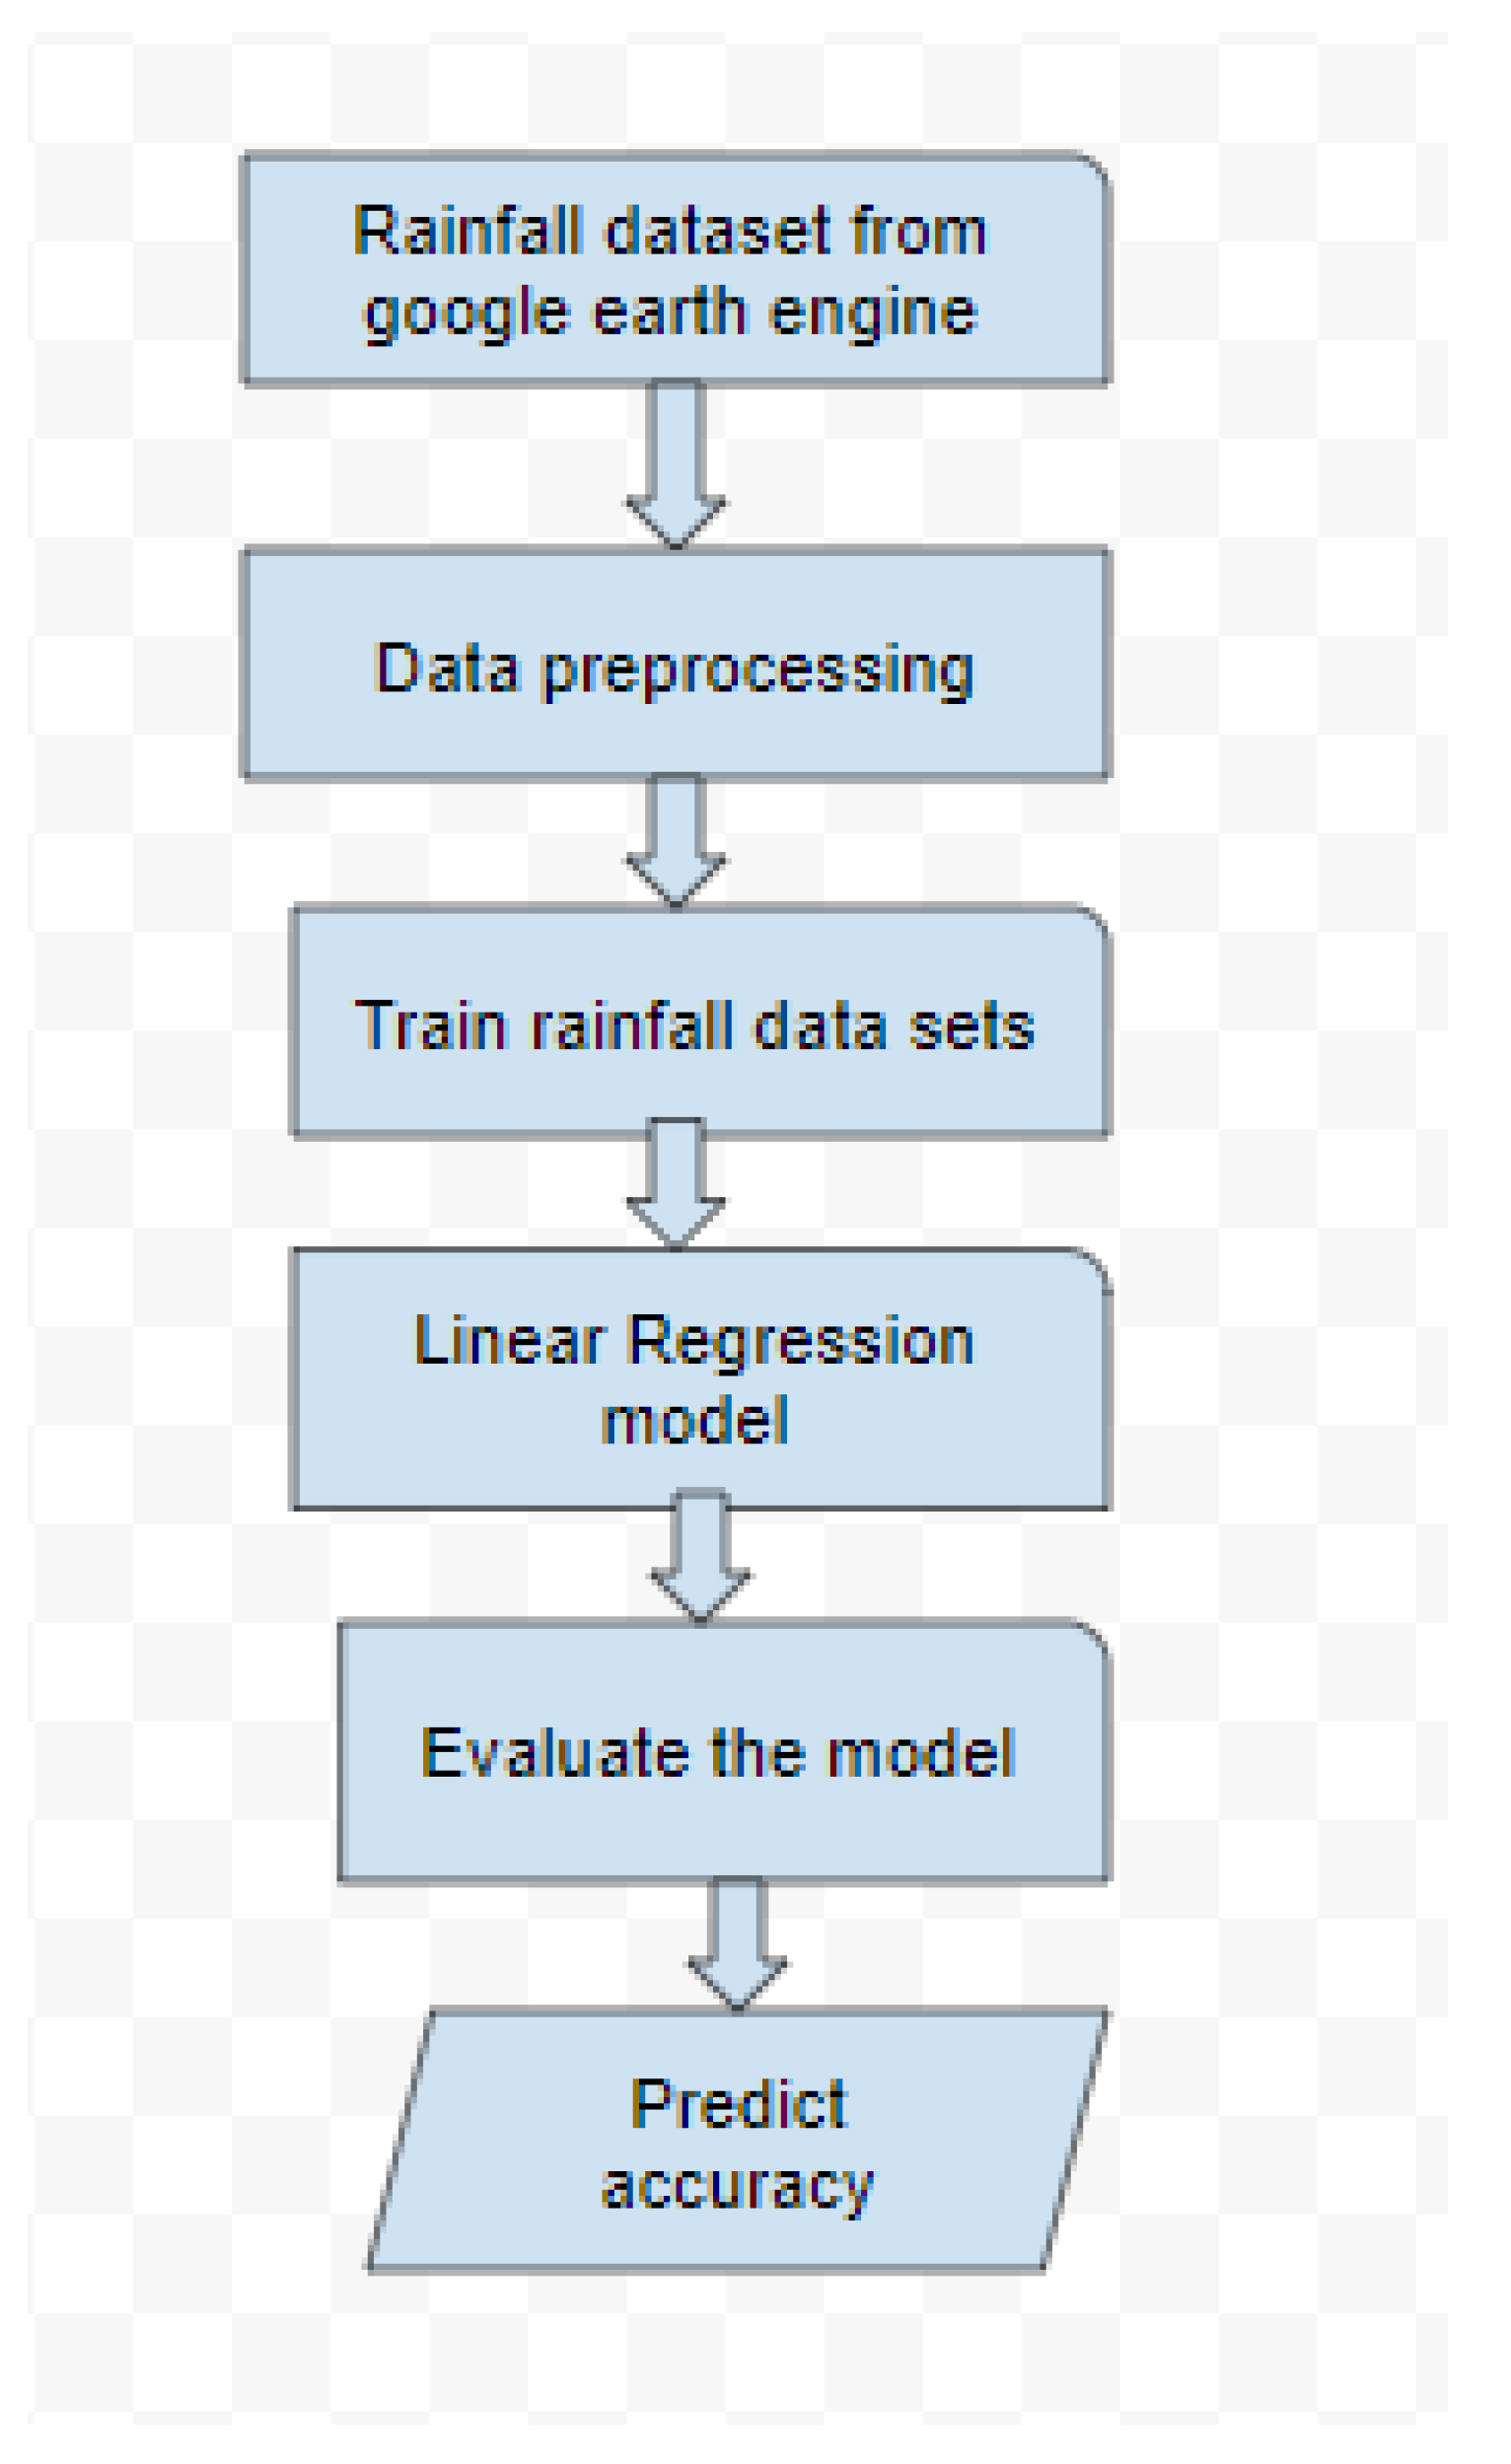
Figure 3.
Linear Regression System architecture of the proposed model.
Figure 3.
Linear Regression System architecture of the proposed model.
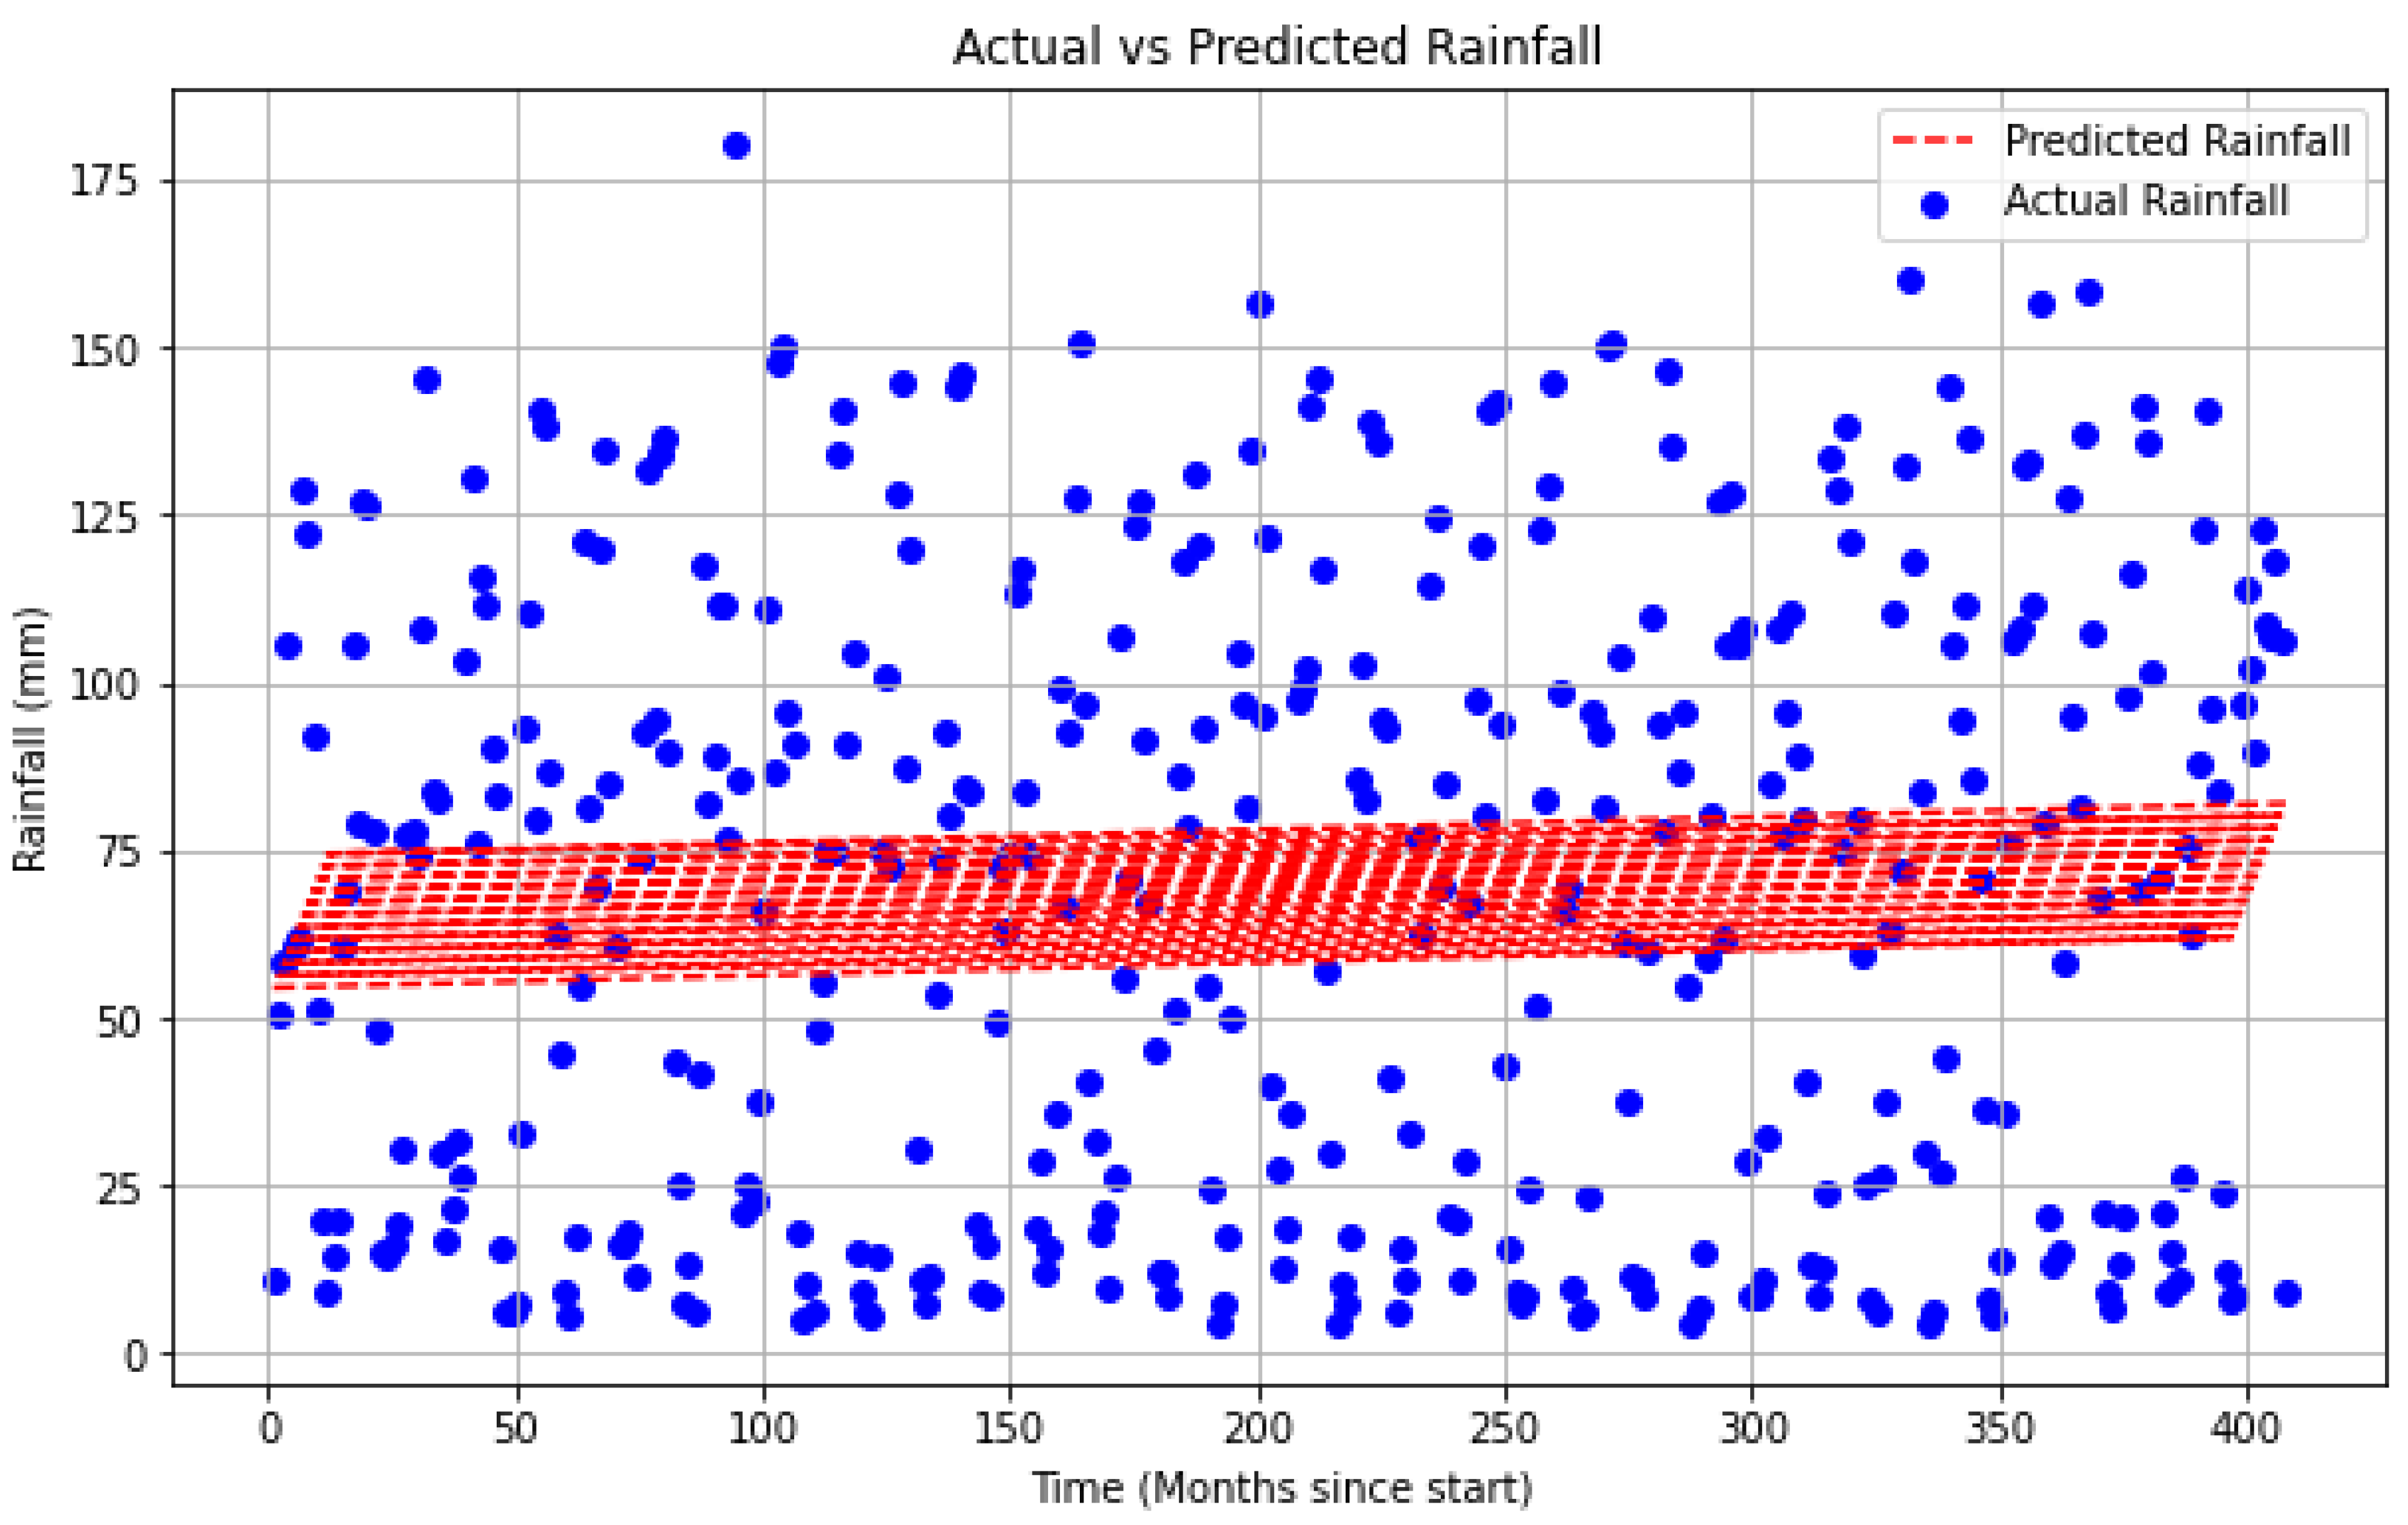
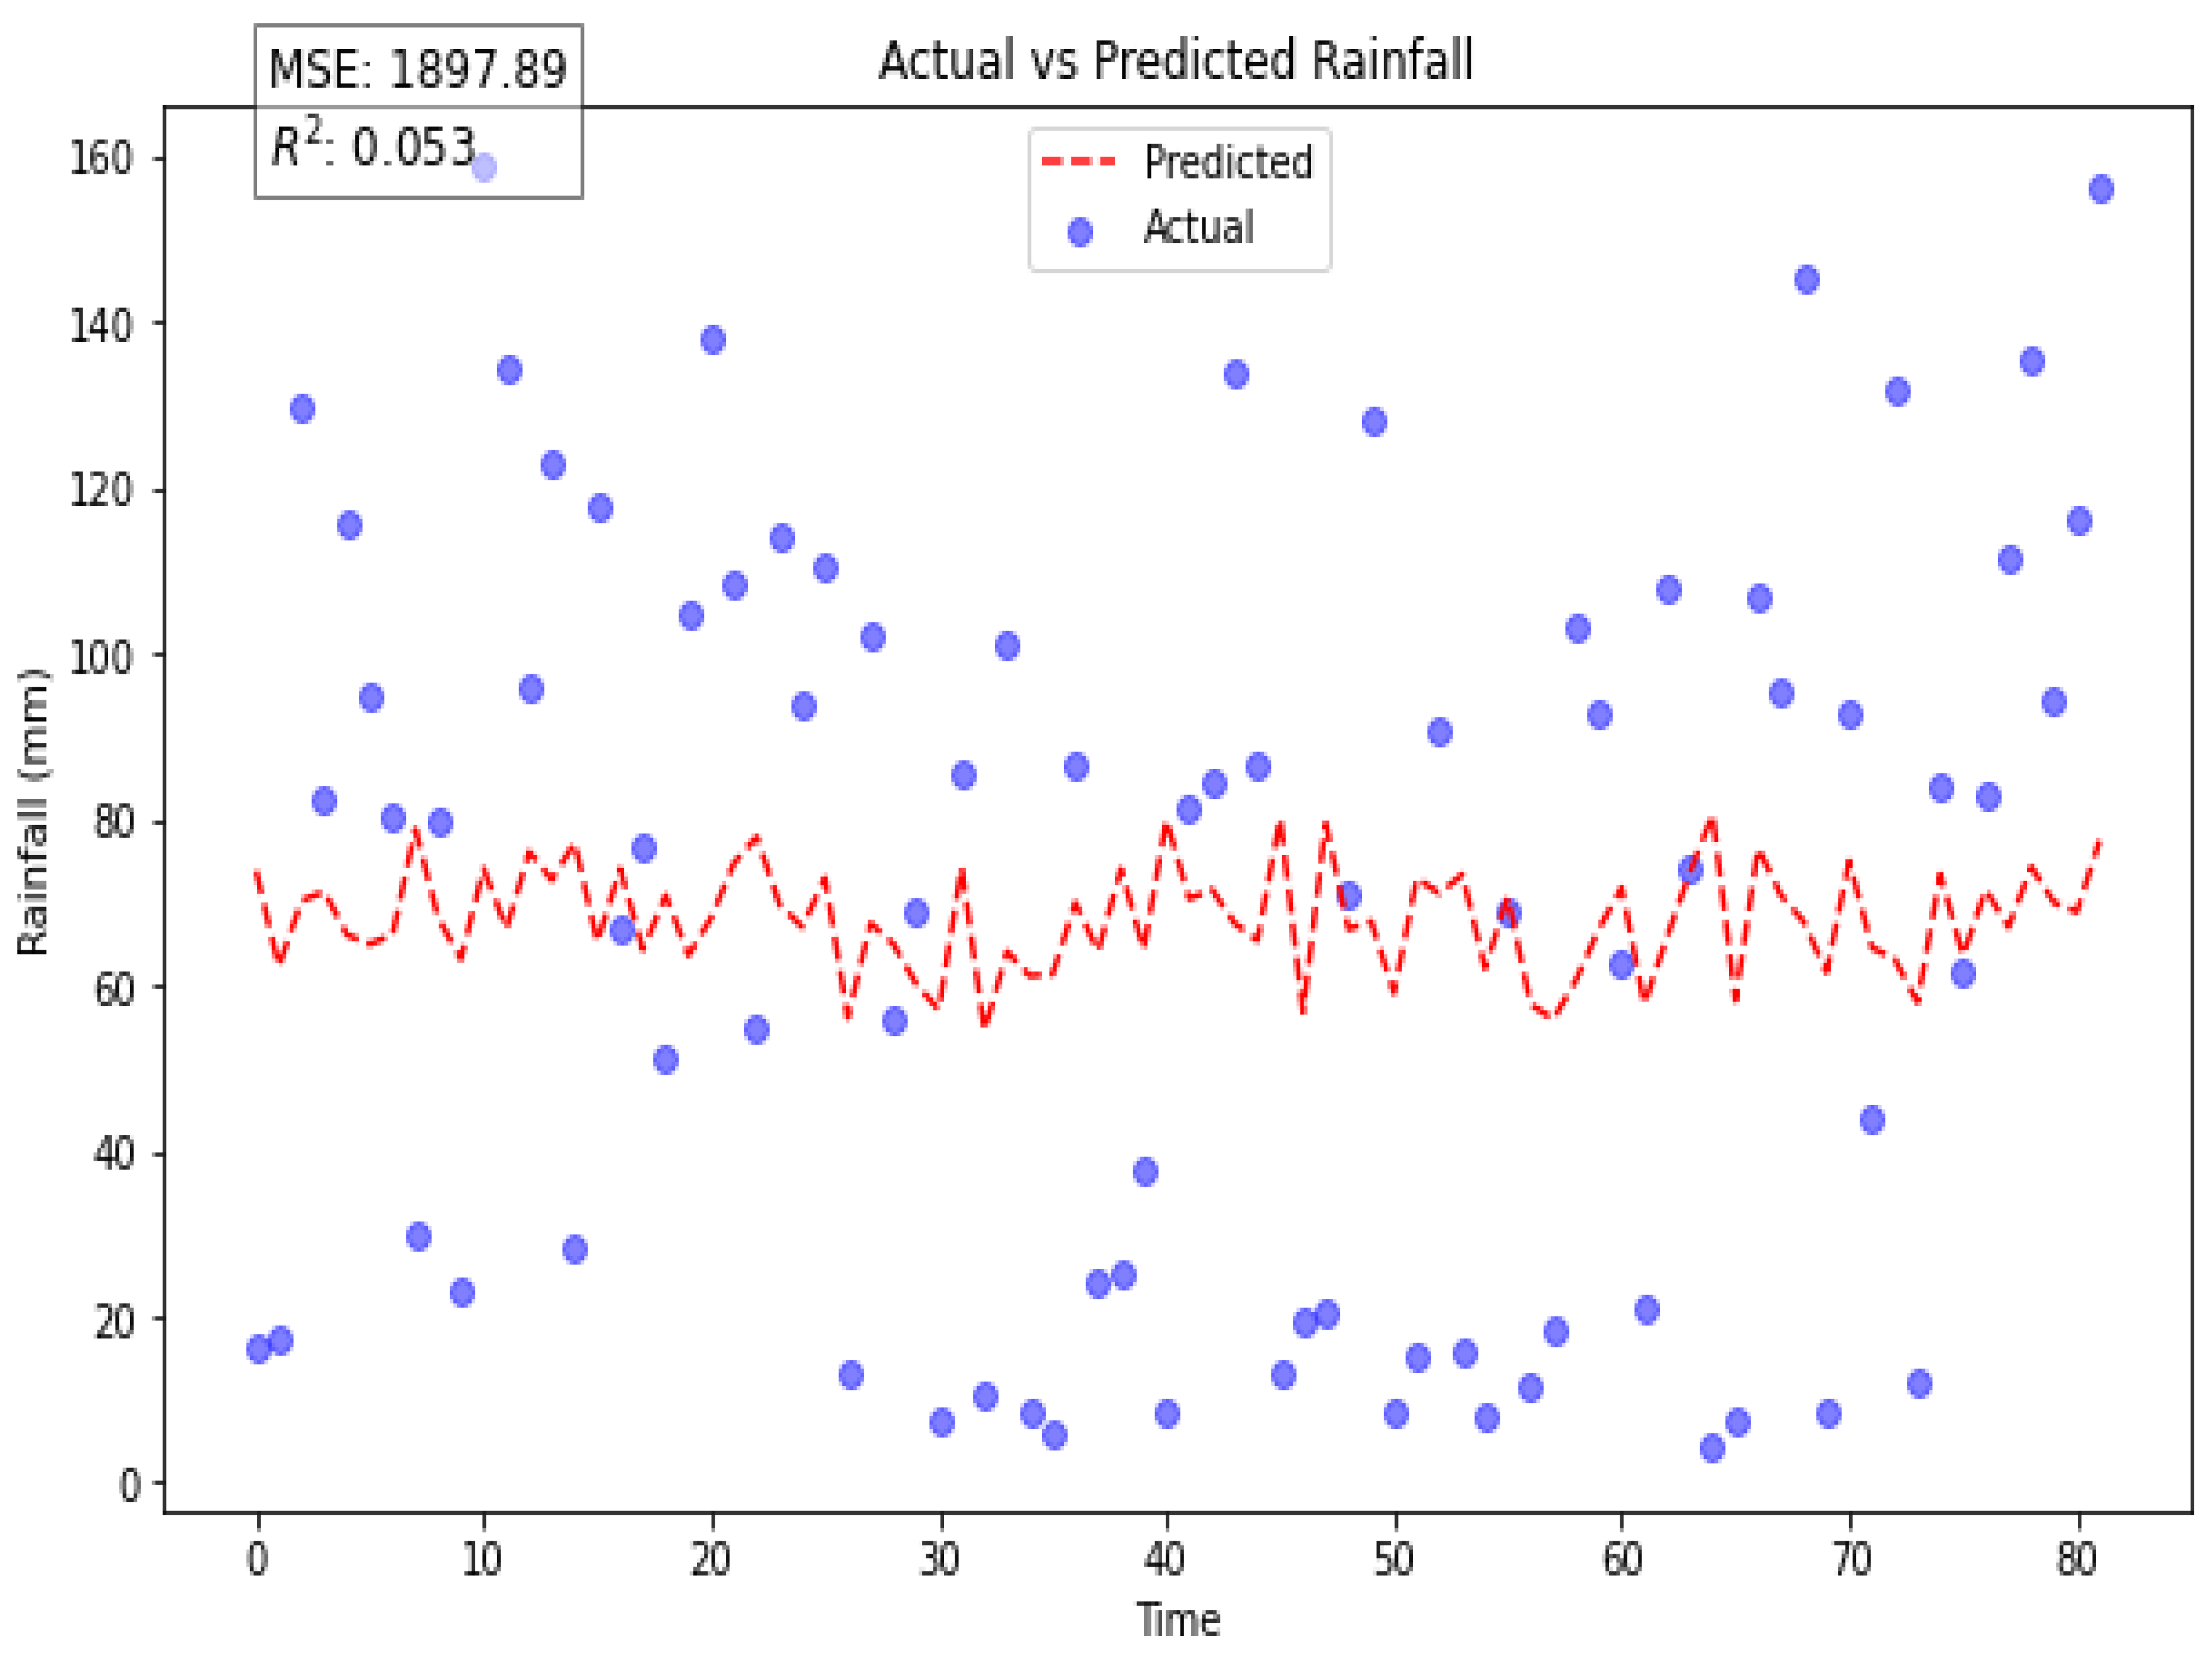
This graph illustrates how Ethiopian rainfall patterns are predicted using linear regression modeling. The linear regression model is used in the graphic to compare the actual and anticipated rainfall values.
Figure 4.
Linear Regression Actual vs predicted rainfall.
Figure 4.
Linear Regression Actual vs predicted rainfall.
4. Model Evaluation
Using suitable assessment measures, such as mean squared error (MSE), root mean square error (RMSE), or coefficient of determination (R-squared), validate the model's performance on the testing data [
8]. Use confidence intervals or hypothesis tests to evaluate the regression coefficients' statistical significance. Determine the strength and direction of the correlations between rainfall and predictor variables by interpreting the regression coefficients. Determine which factors have the greatest influence on Ethiopia's rainfall patterns. Compare the results with those of similar research carried out in other areas or nations, and discuss the findings in light of the body of current literature[
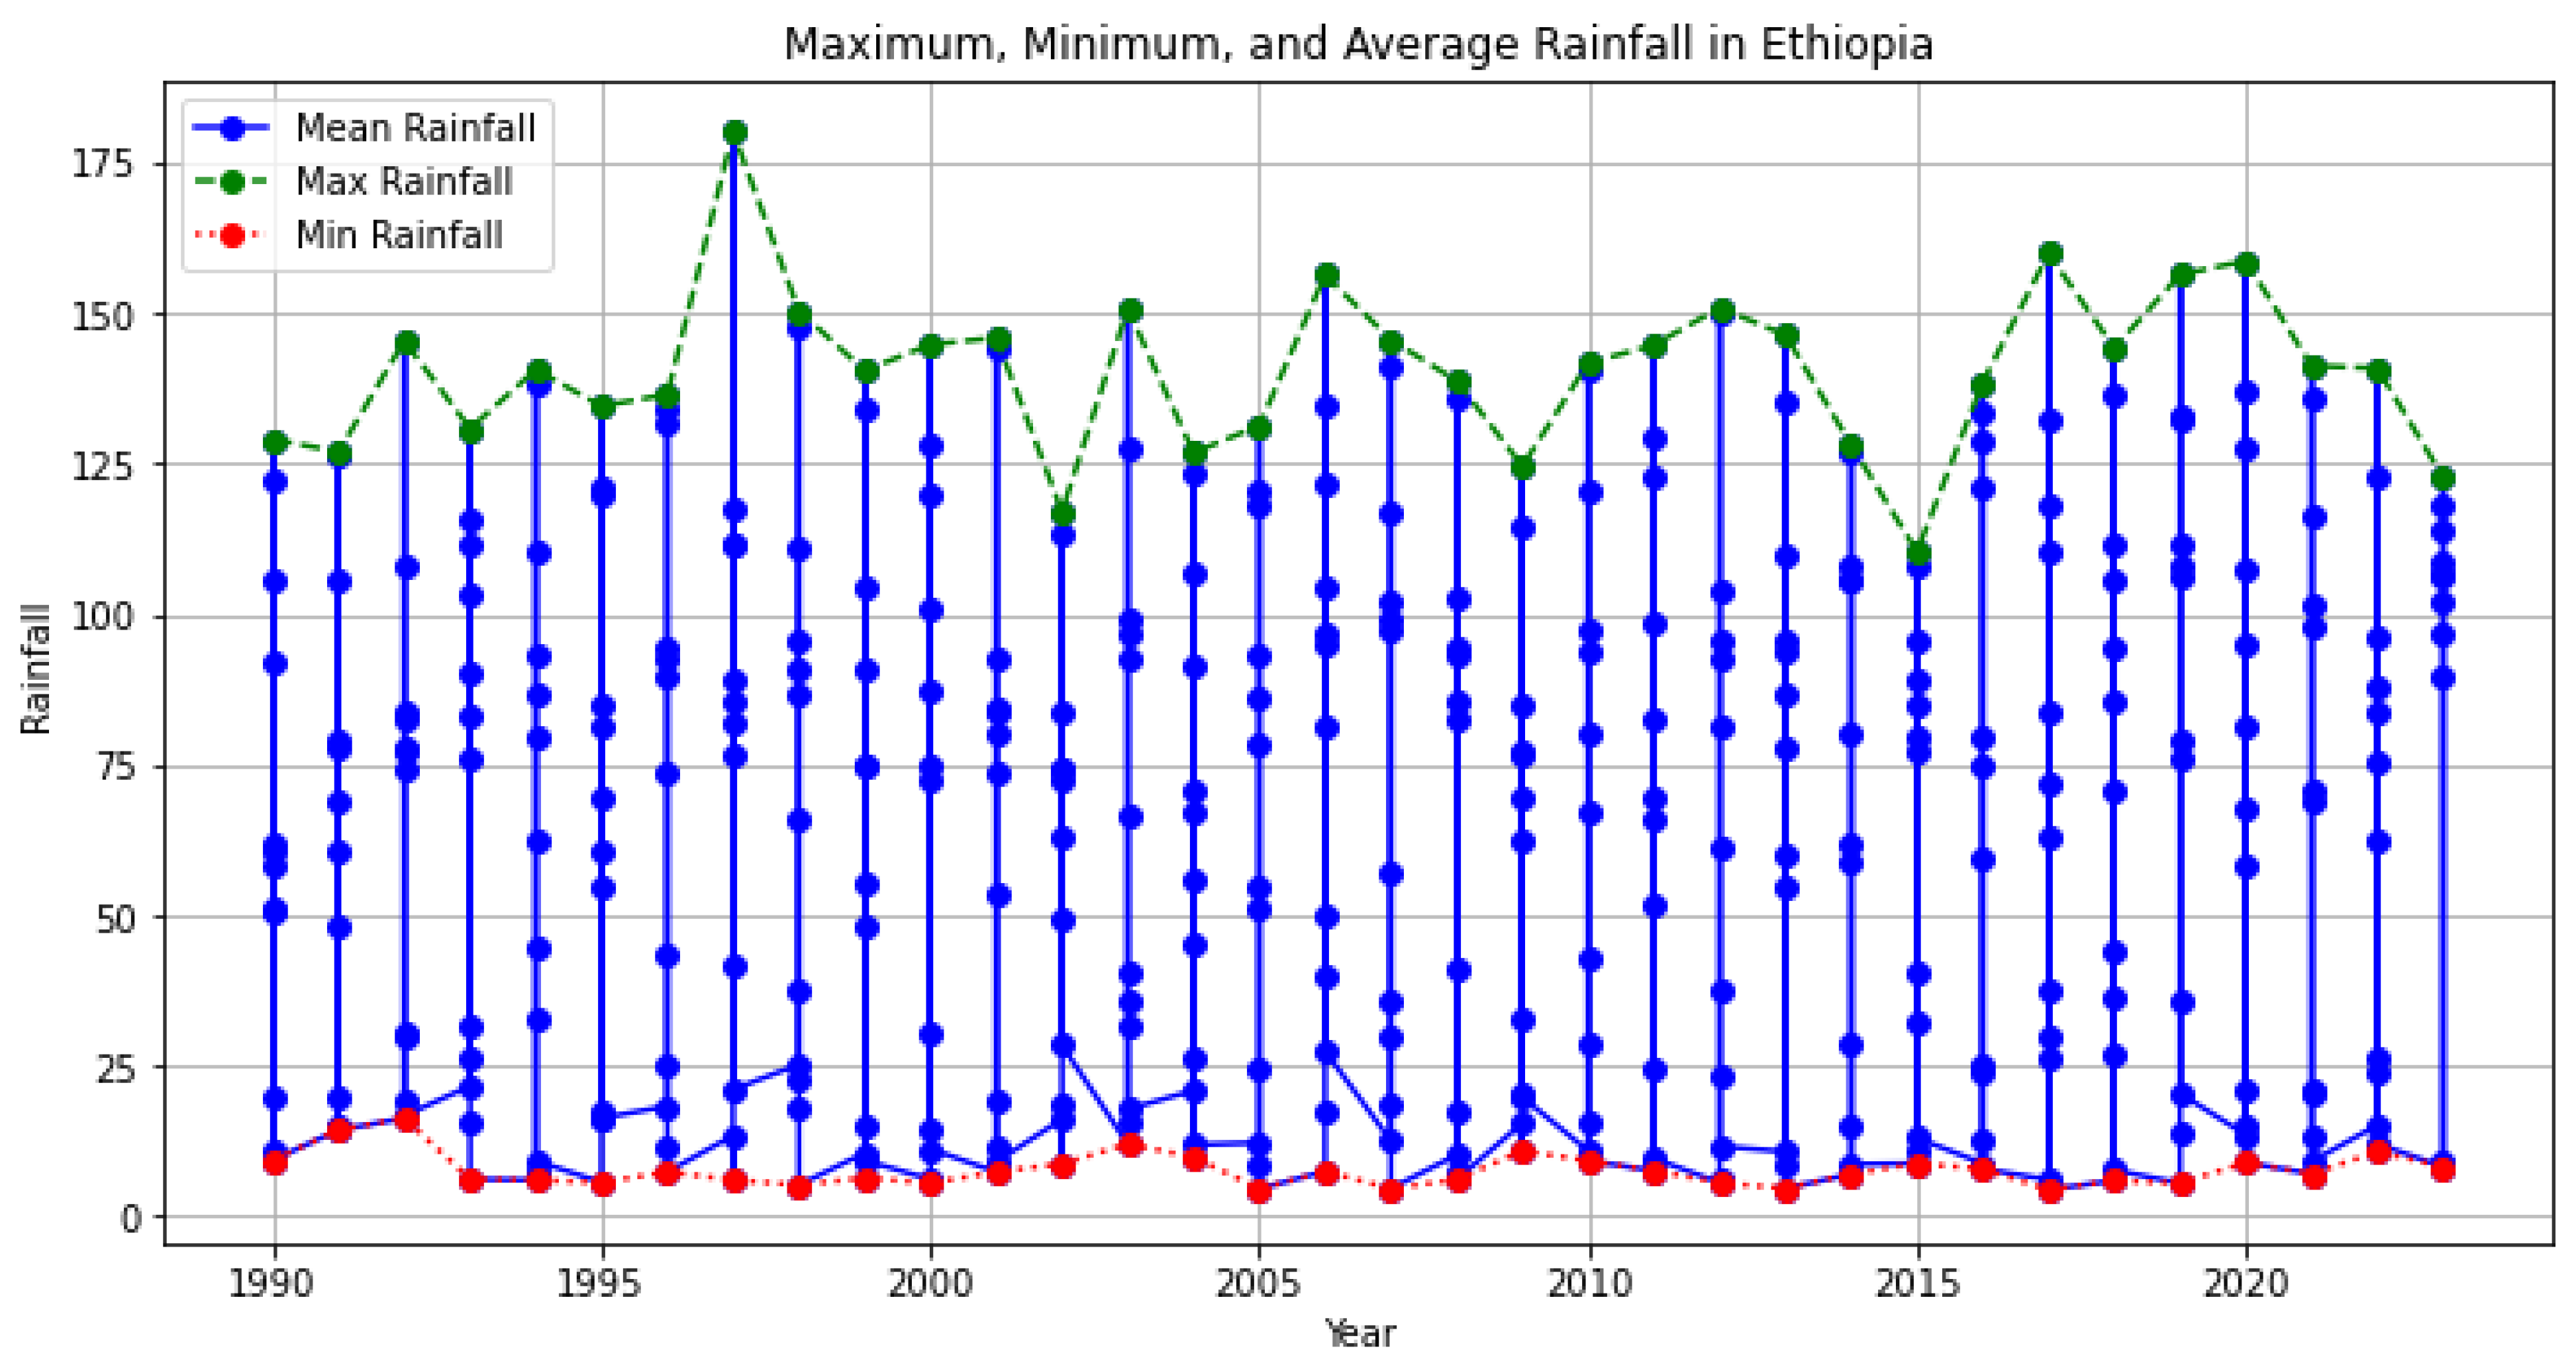
9]. Here is the graph showing the maximum, minimum, and average rainfall in Ethiopia over the years.
Figure 5.
Actual and predictive rainfall in Ethiopia.
Figure 5.
Actual and predictive rainfall in Ethiopia.
5. Result and Discussion
Figure 6.
Maximum, minimum and average of Ethiopia rainfall in years.
Figure 6.
Maximum, minimum and average of Ethiopia rainfall in years.
Now create a graph showing the maximum, minimum, and average rainfall in Ethiopia over the years. The concept of "Maximum, minimum, and average of Ethiopia rainfall in years" refers to the analysis and discussion of the highest, lowest, and average rainfall values recorded in Ethiopia over a specific period of time, typically multiple years. This concept involves studying the climatic patterns and variations in rainfall in Ethiopia to gain insights into the country's hydrological cycle and its impact on various sectors such as agriculture, water resources management, and environmental planning. By examining the maximum rainfall values, one can identify the periods or regions with the highest recorded rainfall, which may indicate areas prone to flooding or regions with high agricultural productivity. Understanding the maximum rainfall values can be valuable for infrastructure planning, flood management, and disaster preparedness.
On the other hand, analyzing the minimum rainfall values provides insights into the periods or regions with the lowest recorded rainfall. This information is crucial for understanding drought-prone areas, water scarcity issues, and the impact of climate change on the availability of water resources. It helps in designing strategies for water conservation, irrigation systems, and sustainable water management practices. The average rainfall value gives an overall picture of the typical rainfall pattern in Ethiopia over the years under consideration. It provides a baseline for comparison and can be used to evaluate the relative wetness or dryness of a specific year or region compared to the long-term average. This information is valuable for agricultural planning, crop selection, and assessing the overall water resource availability of the country. Discussing the maximum, minimum, and average rainfall values in Ethiopia over multiple years can lead to various topics of discussion, such as the impact of climate change on rainfall patterns, the influence of geographical factors on rainfall distribution, the relationship between rainfall and agricultural productivity, and the effectiveness of water management strategies in mitigating the effects of droughts and floods.
Overall, this concept provides a foundation for understanding the climatic conditions in Ethiopia, their variability, and the implications for various sectors, ultimately contributing to informed decision-making and sustainable development practices.
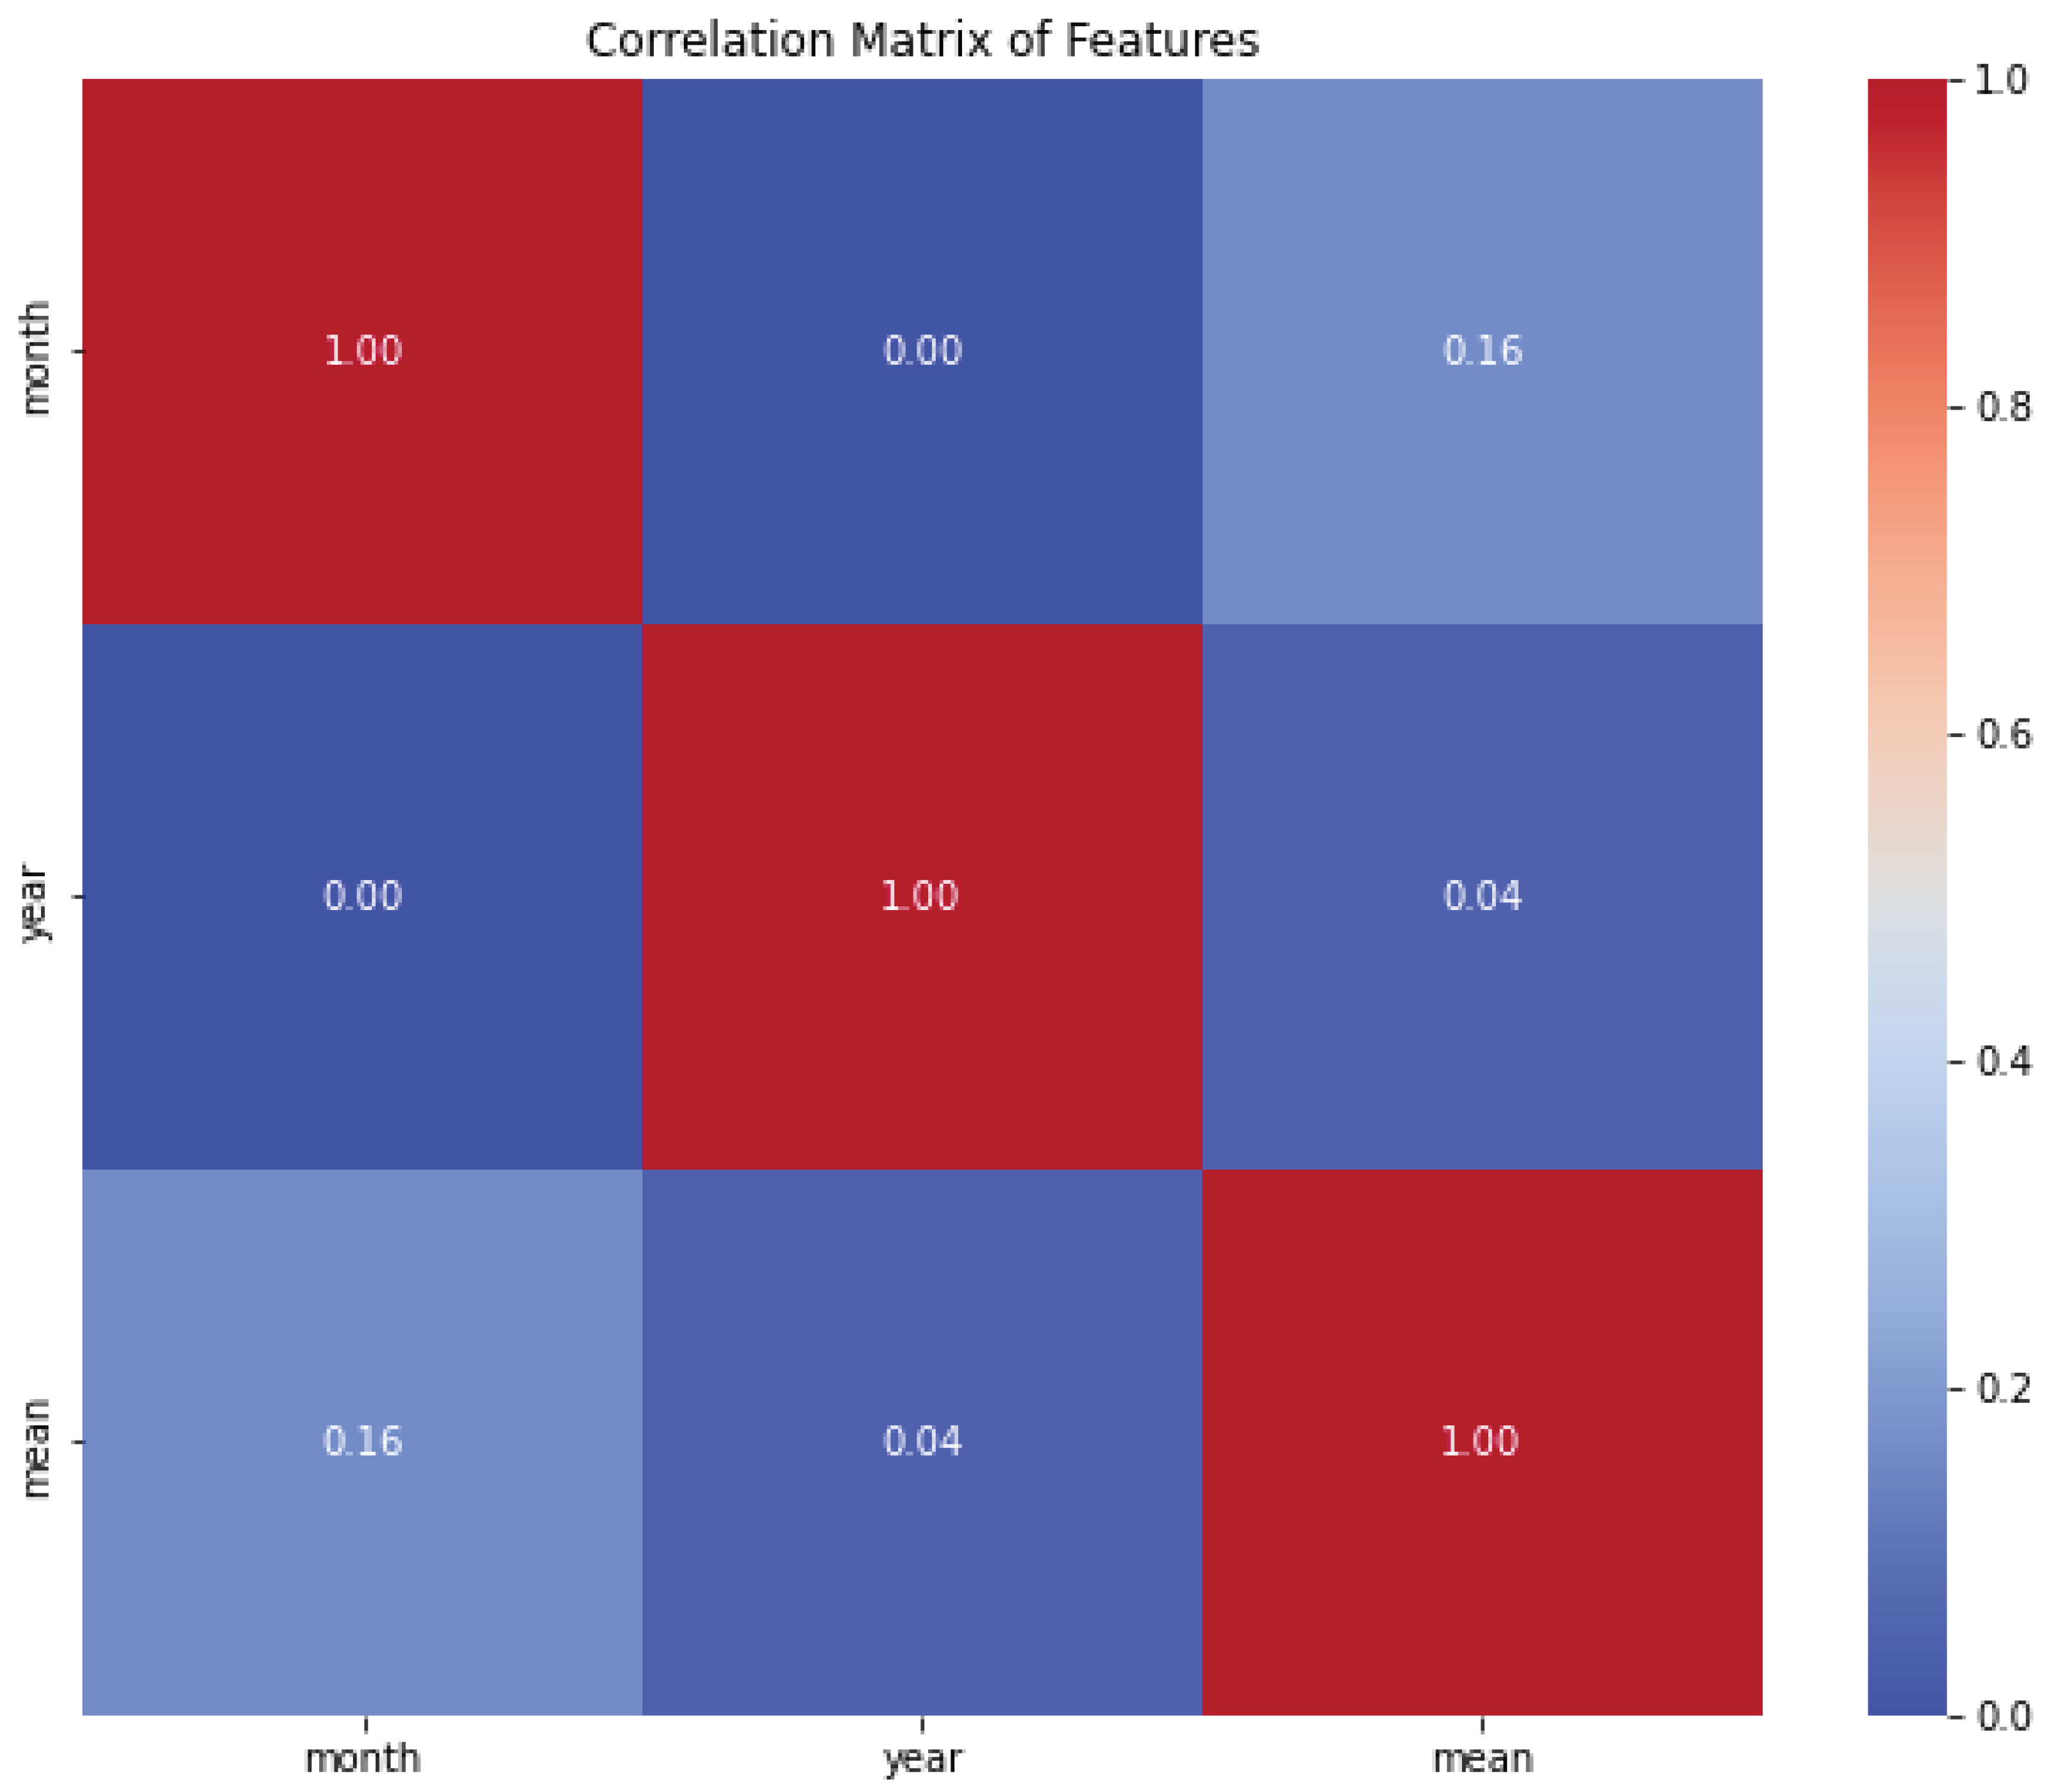
Figure 7.
Correlation matrix of features.
Figure 7.
Correlation matrix of features.
In the case of rainfall in Ethiopia, various factors can influence its patterns, including geographical features, climate systems, atmospheric conditions, and other meteorological variables. By constructing a correlation matrix of these features, we can identify which variables are positively or negatively correlated with rainfall and to what extent.
For example, we might include variables such as temperature, humidity, wind speed, elevation, vegetation index, and sea surface temperatures in the correlation matrix. The correlation coefficient can range from -1 to 1, with a value of 1 indicating a perfect positive correlation, 0 indicating no correlation, and -1 indicating a perfect negative correlation.
Analyzing the correlation matrix can provide valuable insights into the factors that are most strongly associated with rainfall in Ethiopia. Positive correlations between certain variables and rainfall would suggest that as those variables increase, so does the rainfall. For instance, if temperature and rainfall have a positive correlation, it implies that higher temperatures are associated with increased rainfall in Ethiopia.
On the other hand, negative correlations indicate an inverse relationship. If, for example, wind speed and rainfall have a negative correlation, it suggests that higher wind speeds are associated with lower rainfall amounts in Ethiopia. The correlation matrix can help identify potential drivers of rainfall variability in Ethiopia and provide a basis for further analysis and research. It can assist in understanding the complex interactions between different factors and their combined influence on rainfall patterns. This information is valuable for climate scientists, meteorologists, and policymakers in predicting and managing water resources, agricultural planning, and climate change adaptation strategies. It is important to note that correlation does not imply causation. While a strong correlation between two variables suggests an association, it does not necessarily mean that one variable directly causes changes in the other[
10]. Additional research and analysis are needed to establish causal relationships and understand the underlying mechanisms driving the observed correlations.
In summary, the correlation matrix of features related to rainfall in Ethiopia allows us to assess the relationships between different variables and rainfall patterns. It provides a quantitative measure of the strength and direction of these associations, aiding in the understanding of the factors influencing rainfall variability and supporting informed decision-making in areas such as water resource management, agriculture, and climate change adaptation.
The MSE of 1897.89, based on the provided numbers, shows that the squared difference between the actual and anticipated values is generally quite high. This implies that there is a notable deviation between the model's predictions and the actual results. A model that more closely matches the real data in its predictions would ideally have a lower MSE. With respect to the independent variables employed, the model only explains 5.3% of the variance in the dependent variable (rainfall), according to the R-squared score of 0.053. The model may not have as much predictive power as it does now, based on its low R-squared score. Put otherwise, a significant amount of the variation in the dependent variable is not being captured by the independent variables that are part of the model. All of these values point to an unsatisfactory performance of the model. The model's predictions are not accurate, and there is little correlation between the independent factors and the dependent variable (rainfall), as seen by the relatively high MSE and low R-squared score. Because of this, the model may not be appropriate for explaining or forecasting rainfall given the provided independent variables.
6. Conclusion
Ethiopia uses the Linear regression model, a machine learning approach, to forecast rainfall. It creates forecasts for future rainfall patterns using past rainfall data from different places and times. To make predictions on its own, the model makes use of an ensemble of decision trees, each of which has been trained on a portion of the data. More precise and reliable predictions are produced by averaging the predictions made by each tree to arrive at the final projection.The quantity and quality of historical data used, the choice of pertinent input features, and the data preparation all have an impact on the accuracy of the model. To guarantee the correctness and dependability of the model, regular validation and assessment using the proper metrics are required. The model's independent variables can only account for about 5.3% of the variance in rainfall, according to the low R-squared score of 0.053. This suggests that there is little correlation between the selected independent variables and rainfall and that a sizable amount of the variance in the dependent variable is not captured by the model. Furthermore, the model's average predictions depart significantly from the actual rainfall values, as seen by the high MSE of 1897.89. This indicates that the squared disparities between the expected and actual values are relatively significant, and the model's accuracy in predicting rainfall is rather low. These measures lead to the conclusion that Ethiopian rainfall patterns cannot be reliably predicted or analyzed using the linear regression model as it is currently designed. It might be required to consider other modeling strategies, include more pertinent variables, and make sure that high-quality data that precisely depicts the region's rainfall patterns is available in order to enhance the model's effectiveness.
In conclusion, the Linear regression model is used for Ethiopian rainfall prediction, leveraging machine learning techniques to analyze historical data and generate predictions for future rainfall patterns. However, it is crucial to consider the limitations and uncertainties associated with any predictive model and continuously evaluate and refine its performance to improve its accuracy and reliability.
Author Contributions
Every author contributes to conceptualization, methodology, software, validation, formal analysis, original draft, review, and editing writing, as well as data collecting and visualization. Curation of data.
Funding
This research has not received any funding from any organization or person.
Declaration of interests
The authors declare that they have no known competing financial interests or personal relationships that could have appeared to influence the work reported in this paper.
Ethics statements
Not Applicable.
Data Availability Statement
The processed data will be made available on request of the corresponding author.
Acknowledgments
I would like to acknowledge Google earth engine for giving dataset.
Conflicts of Interest
The authors declare that there is no conflict of interest.
References
- S. Kachwala, M. Jha, D. Shah, U. Shinde, and H. Namdeo Bhor, “Predicting Rainfall from Historical Data Trends,” SSRN Electron. J., 2020. [CrossRef]
- K. N. Kumar, “Rainfall Accuracy Prediction using Machine Learning Technique based on Linear Regression over Logistic Regression,” vol. 15, no. 4, pp. 424–430, 2022.
- M. R. Jury, “Statistical prediction of summer rainfall and vegetation in the Ethiopian highlands,” Adv. Meteorol., vol. 2014, 2014. [CrossRef]
- 4. Alhamshry, F. A. Ayele, H. Yasuda, R. Kimura, and K. Shimizu, “Seasonal Rainfall Variability in Ethiopia and Its,” Water, vol. 12, no. 55, pp. 1–19, 2020.
- E. Bojago and D. YaYa, “Trend analysis of seasonal rainfall and temperature pattern in Damota Gale districts of Wolaita Zone, Ethiopia,” ResearchSquare, 2021. [CrossRef]
- T. M. Weldegerima, T. T. Zeleke, B. S. Birhanu, B. F. Zaitchik, and Z. A. Fetene, “Analysis of Rainfall Trends and Its Relationship with SST Signals in the Lake Tana Basin, Ethiopia,” Adv. Meteorol., vol. 2018, 2018. [CrossRef]
- Begum, N. J. Kheya, and M. Z. Rahman, “Housing Price Prediction with Machine Learning,” Int. J. Innov. Technol. Explor. Eng., vol. 11, no. 3, pp. 42–46, 2022. [CrossRef]
- S. Prabakaran, P. Naveen Kumar, and P. Sai Mani Tarun, “Rainfall prediction using modified linear regression,” ARPN J. Eng. Appl. Sci., vol. 12, no. 12, pp. 3715–3718, 2017.
- M. Olumana Dinka, “Development and Application of Conceptual Rainfall-Altitude Regression Model: The Case of Matahara Area (Ethiopia),” Top. Hydrometerology, 2019. [CrossRef]
- M. Omer, “Modeling of rainfall in addis ababa (Ethiopia) using a sarima model,” Mausam, vol. 69, no. 4, pp. 571–576, 2018. [CrossRef]
|
Disclaimer/Publisher’s Note: The statements, opinions and data contained in all publications are solely those of the individual author(s) and contributor(s) and not of MDPI and/or the editor(s). MDPI and/or the editor(s) disclaim responsibility for any injury to people or property resulting from any ideas, methods, instructions or products referred to in the content. |
© 2024 by the authors. Licensee MDPI, Basel, Switzerland. This article is an open access article distributed under the terms and conditions of the Creative Commons Attribution (CC BY) license (http://creativecommons.org/licenses/by/4.0/).
