Submitted:
12 March 2024
Posted:
13 March 2024
You are already at the latest version
Abstract
Keywords:
1. Introduction
2. Methods
2.1. Study Population
2.2. Asthma Severity Assessment
2.3. Exposure Zones
2.4. Sample Size Determination
2.5. Data Collection
2.6. Statistical Analysis
2.7. Ethical Considerations
3. Results
3.1. Distribution of Asthma Severity among Omani Patients
3.2. Industrial Zones in Sohar and Severe Asthma
3.3. Industrial Areas and Prevalence of Severe Asthma
3.4. Age-Related Patterns in Asthma Severity
3.5. Asthma Severity and Smoking Status
3.6. Asthma Severity and Air Contaminants
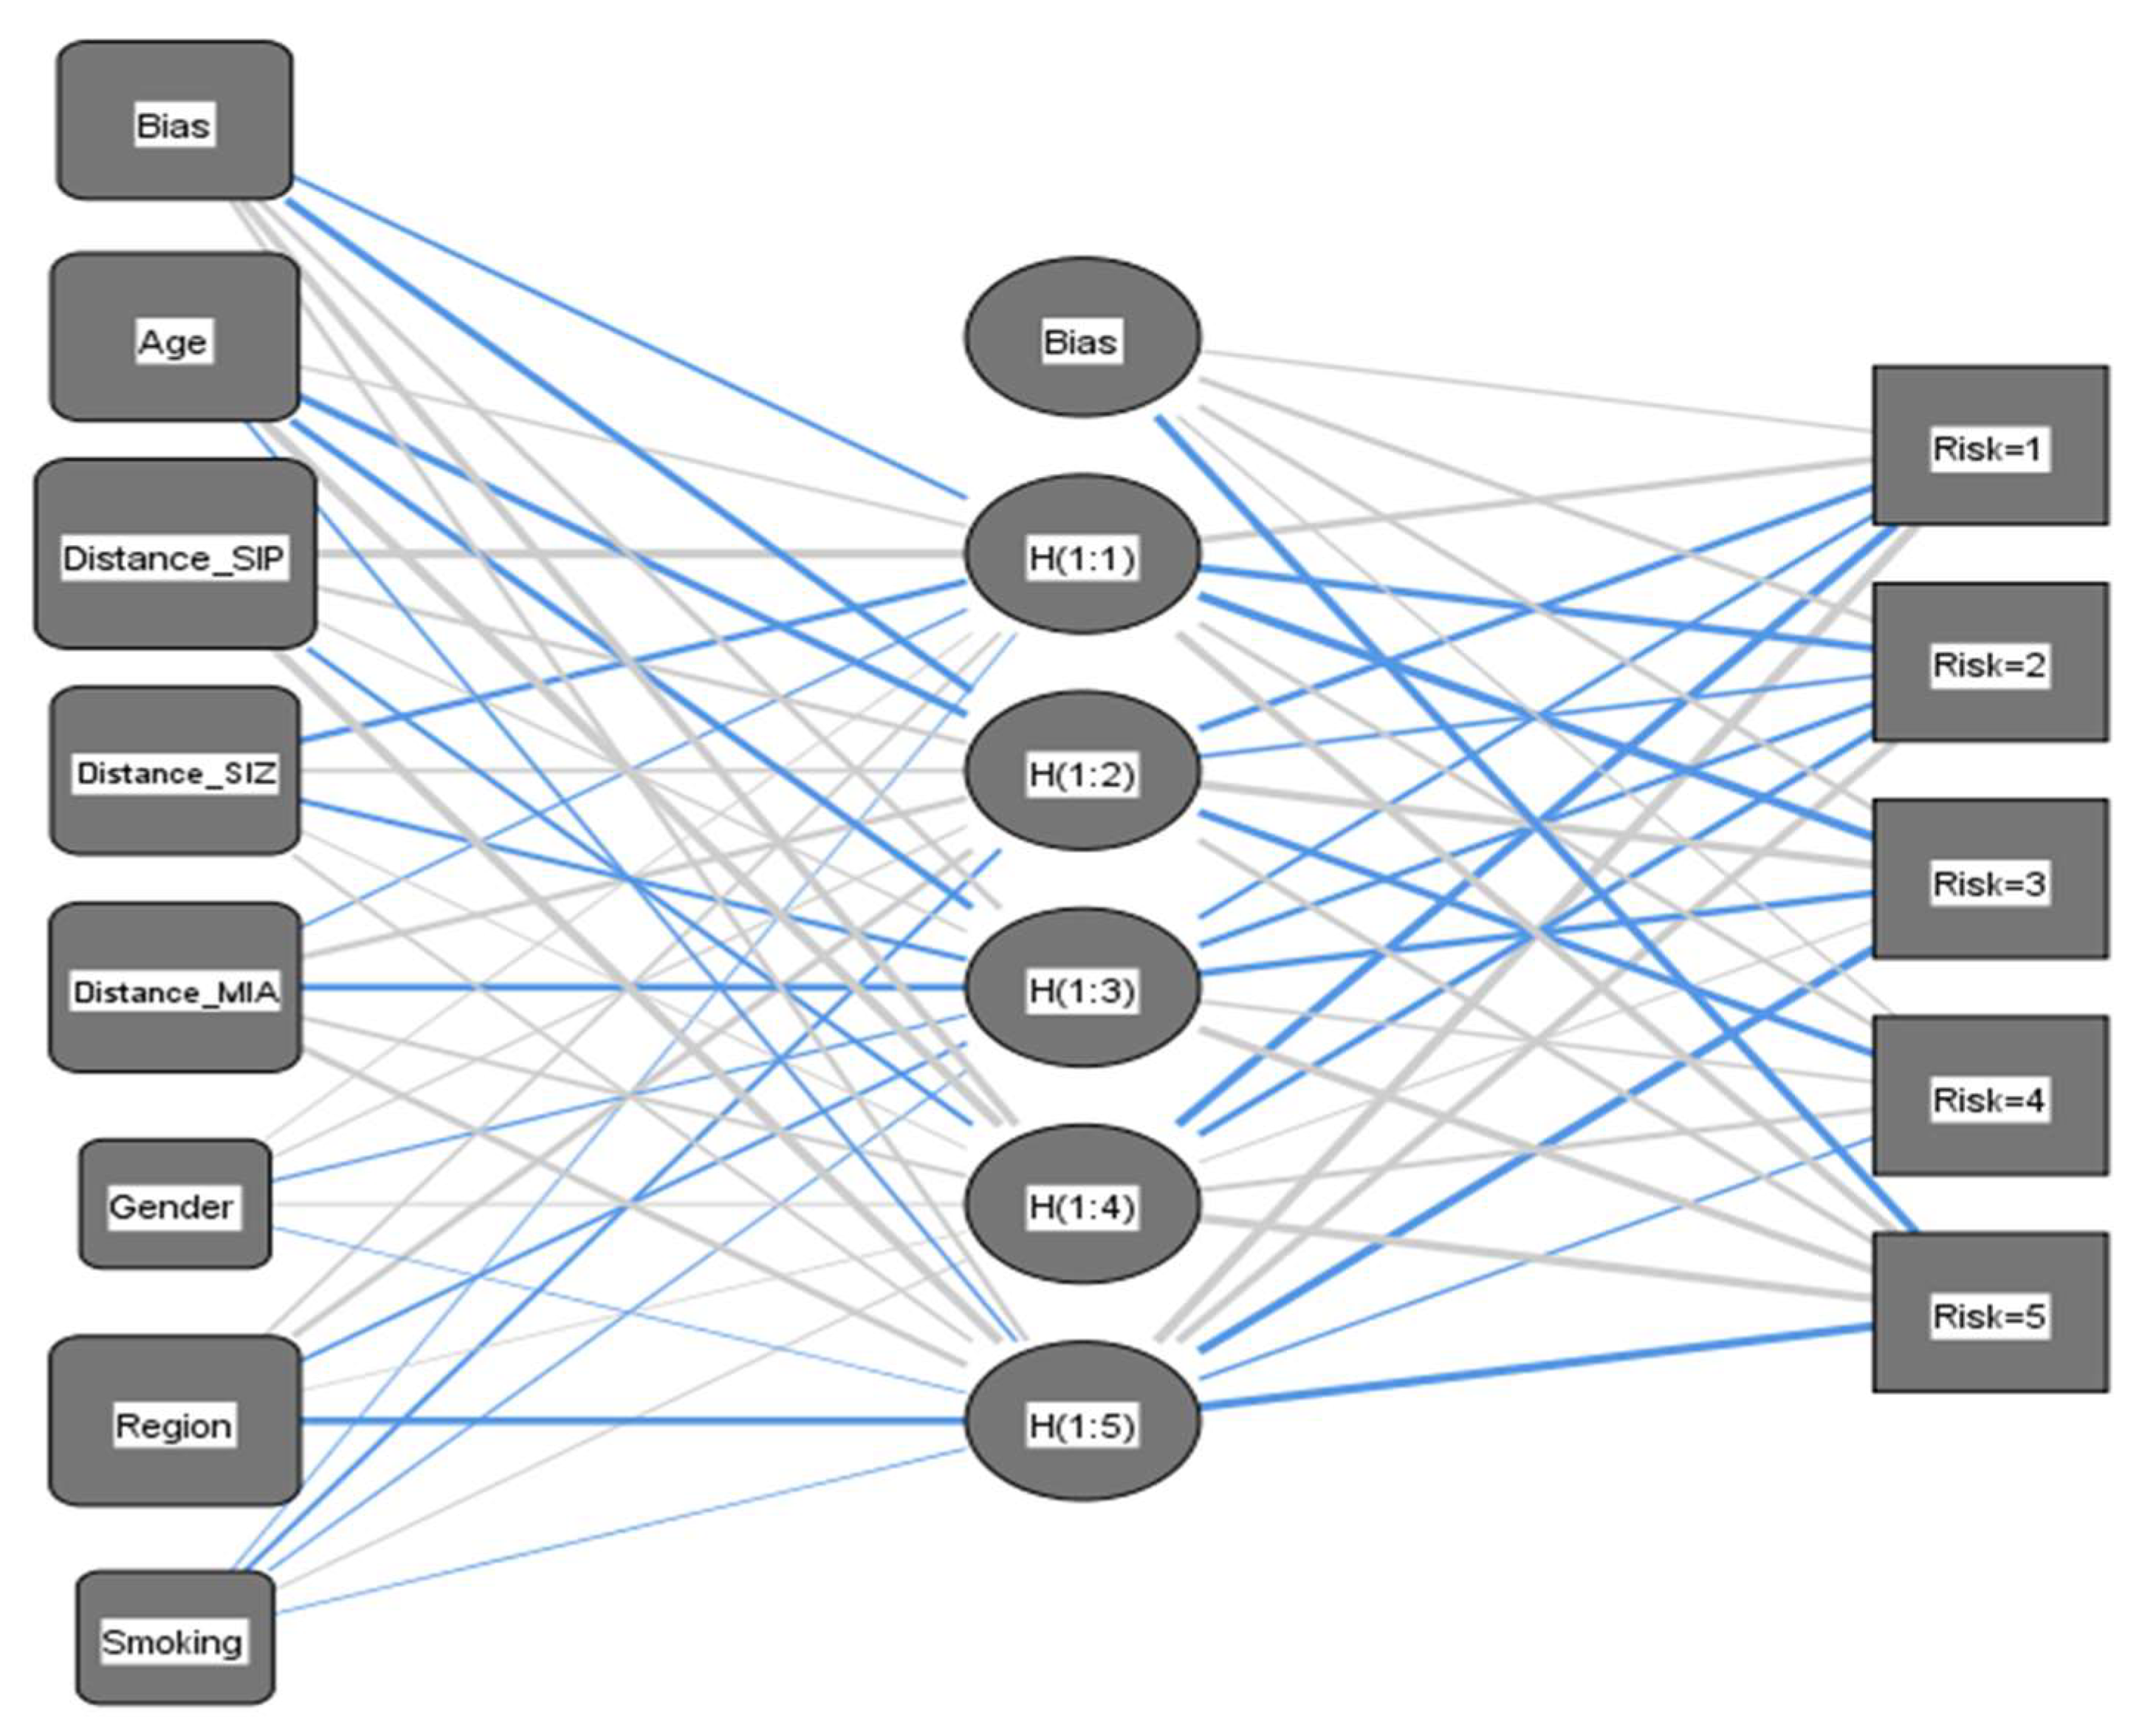
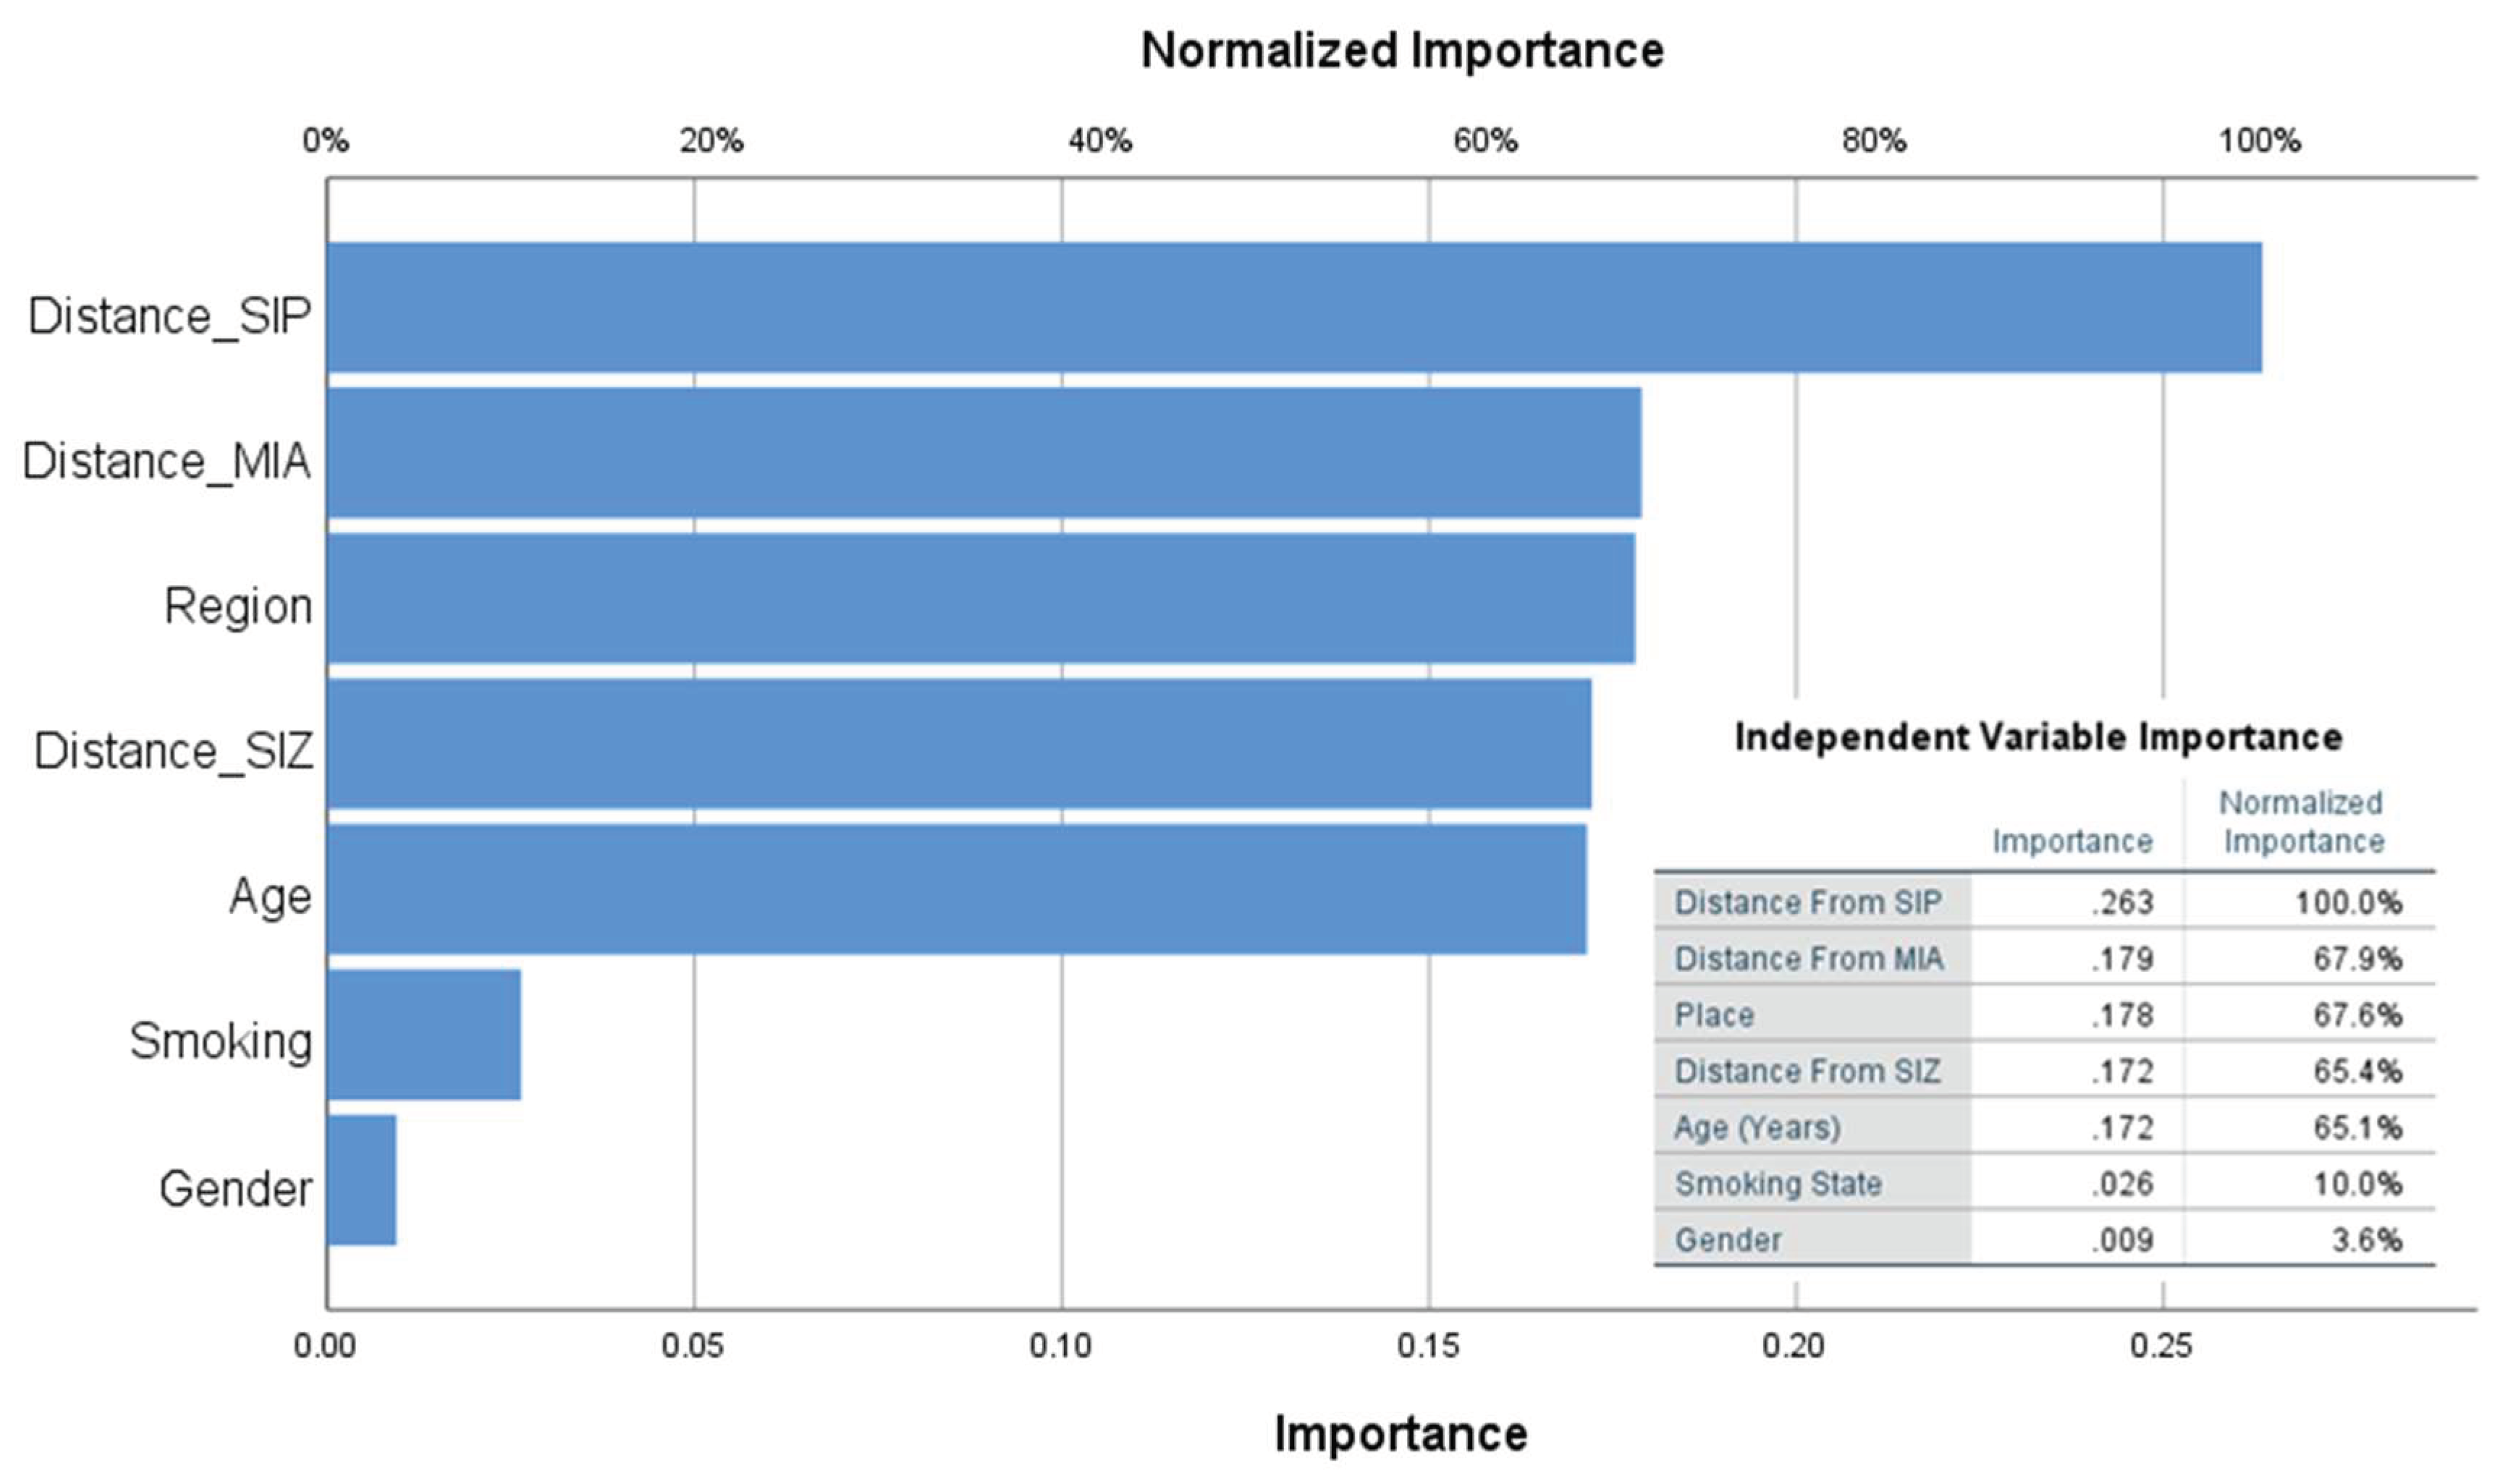
3.7. Predicting Asthma Risk by Artificial Neural Networks
4. Discussion
5. Conclusion
Author Contributors
Role of funding source
Conflicts of interest
References
- E. Garcia, K.T. Berhane, T. Islam, R. McConnell, R. Urman, Z. Chen, F.D. Gilliland, Association of Changes in Air Quality With Incident Asthma in Children in California, 1993-2014., JAMA. 321 (2019) 1906–1915. [CrossRef]
- S.M. Simkovich, D. Goodman, C. Roa, M.E. Crocker, G.E. Gianella, B.J. Kirenga, R.A. Wise, W. Checkley, The health and social implications of household air pollution and respiratory diseases., NPJ Prim. Care Respir. Med. 29 (2019) 12. [CrossRef]
- C. Cheng, C. Han, Q. Fang, Y. Liu, X. Chi, X. Li, Associations between air pollutants and hospital admissions for chronic obstructive pulmonary disease in Jinan: potential benefits from air quality improvements., Environ. Sci. Pollut. Res. Int. 30 (2023) 46435–46445. [CrossRef]
- S.C. Anenberg, D.K. Henze, V. Tinney, P.L. Kinney, W. Raich, N. Fann, C.S. Malley, H. Roman, L. Lamsal, B. Duncan, R.V. Martin, A. van Donkelaar, M. Brauer, R. Doherty, J.E. Jonson, Y. Davila, K. Sudo, J.C.I. Kuylenstierna, Estimates of the Global Burden of Ambient PM2.5, Ozone, and NO2 on Asthma Incidence and Emergency Room Visits., Environ. Health Perspect. 126 (2018) 107004. [CrossRef]
- S. D’Antona, I. Castiglioni, D. Porro, C. Cava, Consequences of exposure to pollutants on respiratory health: From genetic correlations to causal relationships., PLoS ONE. 17 (2022) e0277235. [CrossRef]
- A.J. Cohen, M. Brauer, R. Burnett, H.R. Anderson, J. Frostad, K. Estep, K. Balakrishnan, B. Brunekreef, L. Dandona, R. Dandona, V. Feigin, G. Freedman, B. Hubbell, A. Jobling, H. Kan, L. Knibbs, Y. Liu, R. Martin, L. Morawska, C.A. Pope, M.H. Forouzanfar, Estimates and 25-year trends of the global burden of disease attributable to ambient air pollution: an analysis of data from the Global Burden of Diseases Study 2015., Lancet. 389 (2017) 1907–1918. [CrossRef]
- G.D. Thurston, J.R. Balmes, E. Garcia, F.D. Gilliland, M.B. Rice, T. Schikowski, L.S. Van Winkle, I. Annesi-Maesano, E.G. Burchard, C. Carlsten, J.R. Harkema, H. Khreis, S.R. Kleeberger, U.P. Kodavanti, S.J. London, R. McConnell, D.B. Peden, K.E. Pinkerton, J. Reibman, C.W. White, Outdoor Air Pollution and New-Onset Airway Disease. An Official American Thoracic Society Workshop Report., Ann. Am. Thorac. Soc. 17 (2020) 387–398. [CrossRef]
- C.-K. Chang, Y.-K. Lin, C.-W. Lin, M.-W. Su, H.-W. Chu, C.-D. Wu, Y.-T. Zeng, B.-L. Chang, Effects of long-term exposure to major outdoor air pollutants for the risk of chronic inflammatory airway diseases in adults with potential interaction detection in Taiwan Biobank, Atmos. Environ. 288 (2022) 119296. [CrossRef]
- D. Kim, Z. Chen, L.-F. Zhou, S.-X. Huang, Air pollutants and early origins of respiratory diseases., Chronic Diseases and Translational Medicine. 4 (2018) 75–94. [CrossRef]
- M. Guarnieri, J.R. Balmes, Outdoor air pollution and asthma., Lancet. 383 (2014) 1581–1592. [CrossRef]
- T.F. Carr, E. Bleecker, Asthma heterogeneity and severity., World Allergy Organiz. J. 9 (2016) 41. [CrossRef]
- GBD 2016 Disease and Injury Incidence and Prevalence Collaborators, Global, regional, and national incidence, prevalence, and years lived with disability for 328 diseases and injuries for 195 countries, 1990-2016: a systematic analysis for the Global Burden of Disease Study 2016., Lancet. 390 (2017) 1211–1259. https://doi.org/10.1016/S0140-6736(17)32154-2. [CrossRef]
- GBD 2015 Chronic Respiratory Disease Collaborators, Global, regional, and national deaths, prevalence, disability-adjusted life years, and years lived with disability for chronic obstructive pulmonary disease and asthma, 1990-2015: a systematic analysis for the Global Burden of Disease Study 2015., Lancet Respir. Med. 5 (2017) 691–706. https://doi.org/10.1016/S2213-2600(17)30293-X. [CrossRef]
- Menzies-Gow, D.J. Jackson, M. Al-Ahmad, E.R. Bleecker, F. de B.G. Cosio Piqueras, S. Brunton, G.W. Canonica, C.K.N. Chan, J. Haughney, S. Holmes, J. Kocks, T. Winders, A renewed charter: key principles to improve patient care in severe asthma., Adv. Ther. 39 (2022) 5307–5326. [CrossRef]
- M. Netz, D.A. Fedele, R. Sweenie, D. Baker, M. Light, E.L. McQuaid, Asthma management responsibility, control, and quality of life among emerging adolescents., J. Pediatr. Psychol. 45 (2020) 40–49. [CrossRef]
- H.K. Reddel, E.D. Bateman, A. Becker, L.-P. Boulet, A.A. Cruz, J.M. Drazen, T. Haahtela, S.S. Hurd, H. Inoue, J.C. de Jongste, R.F. Lemanske, M.L. Levy, P.M. O’Byrne, P. Paggiaro, S.E. Pedersen, E. Pizzichini, M. Soto-Quiroz, S.J. Szefler, G.W.K. Wong, J.M. FitzGerald, A summary of the new GINA strategy: a roadmap to asthma control., Eur. Respir. J. 46 (2015) 622–639. [CrossRef]
- H. Tarraf, O. Aydin, D. Mungan, M. Albader, B. Mahboub, A. Doble, A. Lahlou, L. Tariq, F. Aziz, A. El Hasnaoui, Prevalence of asthma among the adult general population of five Middle Eastern countries: results of the SNAPSHOT program., BMC Pulm. Med. 18 (2018) 68. [CrossRef]
- N. Al-Busaidi, J.B. Soriano, Asthma Control in Oman: National Results within the Asthma Insights and Reality in the Gulf and the Near East (AIRGNE) Study., Sultan Qaboos Univ. Med. J. 11 (2011) 45–51.
- N. Al-Busaidi, Z. Habibulla, M. Bhatnagar, N. Al-Lawati, Y. Al-Mahrouqi, The burden of asthma in oman., Sultan Qaboos Univ. Med. J. 15 (2015) e184-90.
- N.H. Al-Busaidi, Z. Habibullah, J.B. Soriano, The asthma cost in oman., Sultan Qaboos Univ. Med. J. 13 (2013) 218–223.
- B.M.S. Al-Riyami, O.A.S. Al-Rawas, A.A. Al-Riyami, L.G. Jasim, A.J. Mohammed, A relatively high prevalence and severity of asthma, allergic rhinitis and atopic eczema in schoolchildren in the Sultanate of Oman., Respirology. 8 (2003) 69–76. [CrossRef]
- F. Kauffmann, F. Demenais, Gene-environment interactions in asthma and allergic diseases: challenges and perspectives., J. Allergy Clin. Immunol. 130 (2012) 1229–40; quiz 1241. [CrossRef]
- A.J. Burbank, A.K. Sood, M.J. Kesic, D.B. Peden, M.L. Hernandez, Environmental determinants of allergy and asthma in early life., J. Allergy Clin. Immunol. 140 (2017) 1–12. [CrossRef]
- R. Hall, I.P. Hall, I. Sayers, Genetic risk factors for the development of pulmonary disease identified by genome-wide association., Respirology. 24 (2019) 204–214. [CrossRef]
- F. Moheimani, A.C.-Y. Hsu, A.T. Reid, T. Williams, A. Kicic, S.M. Stick, P.M. Hansbro, P.A.B. Wark, D.A. Knight, The genetic and epigenetic landscapes of the epithelium in asthma., Respir. Res. 17 (2016) 119. [CrossRef]
- T. Zhang, P. Huang, C. Qiu, Progresses in epigenetic studies of asthma from the perspective of high-throughput analysis technologies: a narrative review., Ann. Transl. Med. 10 (2022) 493. [CrossRef]
- S. Salvi, S. Limaye, Effects of air pollution on allergy and asthma, in: P.K. Vedanthan, H.S. Nelson, S.N. Agashe, P.A. Mahesh, R. Katial (Eds.), Textbook of Allergy for the Clinician, CRC Press, Second edition. | Boca Raton : CRC Press, 2021., 2021: pp. 219–230. [CrossRef]
- T.A. Platts-Mills, S.P. Commins, Increasing prevalence of asthma and allergic rhinitis and the role of environmental factors, UpToDate. (2016).
- W. Lin, B. Brunekreef, U. Gehring, Meta-analysis of the effects of indoor nitrogen dioxide and gas cooking on asthma and wheeze in children., Int. J. Epidemiol. 42 (2013) 1724–1737. [CrossRef]
- R.J. Delfino, J. Wu, T. Tjoa, S.K. Gullesserian, B. Nickerson, D.L. Gillen, Asthma morbidity and ambient air pollution: effect modification by residential traffic-related air pollution., Epidemiology. 25 (2014) 48–57. [CrossRef]
- G. Bowatte, C. Lodge, A.J. Lowe, B. Erbas, J. Perret, M.J. Abramson, M. Matheson, S.C. Dharmage, The influence of childhood traffic-related air pollution exposure on asthma, allergy and sensitization: a systematic review and a meta-analysis of birth cohort studies., Allergy. 70 (2015) 245–256. [CrossRef]
- H. Khreis, C. Kelly, J. Tate, R. Parslow, K. Lucas, M. Nieuwenhuijsen, Exposure to traffic-related air pollution and risk of development of childhood asthma: A systematic review and meta-analysis, Environ. Int. 100 (2017) 1–31. [CrossRef]
- C.-R. Jung, W.-T. Chen, Y.-H. Tang, B.-F. Hwang, Fine particulate matter exposure during pregnancy and infancy and incident asthma., J. Allergy Clin. Immunol. 143 (2019) 2254-2262.e5. [CrossRef]
- E. Toskala, D.W. Kennedy, Asthma risk factors., Int. Forum Allergy Rhinol. 5 Suppl 1 (2015) S11-6. [CrossRef]
- M. Feng, Z. Yang, L. Pan, X. Lai, M. Xian, X. Huang, Y. Chen, P.C. Schröder, M. Roponen, B. Schaub, G.W.K. Wong, J. Li, Associations of early life exposures and environmental factors with asthma among children in rural and urban areas of guangdong, china., Chest. 149 (2016) 1030–1041. [CrossRef]
- M.E. Soto-Martínez, M.E. Soto-Quiros, A. Custovic, Childhood Asthma: Low and Middle-Income Countries Perspective., Acta Med. Acad. 49 (2020) 181–190. [CrossRef]
- GBD 2019 Universal Health Coverage Collaborators, Measuring universal health coverage based on an index of effective coverage of health services in 204 countries and territories, 1990-2019: a systematic analysis for the Global Burden of Disease Study 2019., Lancet. 396 (2020) 1250–1284. [CrossRef]
- M.O. Zeitouni, M.S. Al-Moamary, M.L. Coussa, M. Riachy, B. Mahboub, F. AlHuraish, M.H. Zidan, M.M. Metwally, K. Aksu, E. Yavuz, I.S. Kalla, J. Chakaya, S. Abdelmadjid, H. Ghedira, Challenges and recommendations for the management of asthma in the Middle East and Africa., Ann. Thorac. Med. 17 (2022) 71–80. [CrossRef]
- Farahat, Air quality in the Gulf Cooperation Council (GCC) countries, in: Asian Atmospheric Pollution, Elsevier, 2022: pp. 201–226. [CrossRef]
- J. Yousif, N. Alattar,, M. Fekihal, Forecasting Models Based CO2 Emission for Sultanate of Oman, Int J Appl Eng Res. 12 (2012) 95–100.
- M.S. Baawain, A.S. Al-Serihi, Systematic Approach for the Prediction of Ground-Level Air Pollution (around an Industrial Port) Using an Artificial Neural Network, Aerosol Air Qual. Res. 14 (2014) 124–134. [CrossRef]
- GINA, Global Initiative for Asthma - GINA, GINA Main Report. (2022). https://ginasthma.org/gina-reports/ (accessed January 1, 2022).
- T. To, J. Zhu, P.J. Villeneuve, J. Simatovic, L. Feldman, C. Gao, D. Williams, H. Chen, S. Weichenthal, C. Wall, A.B. Miller, Chronic disease prevalence in women and air pollution--A 30-year longitudinal cohort study., Environ. Int. 80 (2015) 26–32. [CrossRef]
- S.B. Henderson, B. Beckerman, M. Jerrett, M. Brauer, Application of land use regression to estimate long-term concentrations of traffic-related nitrogen oxides and fine particulate matter., Environ. Sci. Technol. 41 (2007) 2422–2428. [CrossRef]
- Y. Zhang, H. Ni, L. Bai, Q. Cheng, H. Zhang, S. Wang, M. Xie, D. Zhao, H. Su, The short-term association between air pollution and childhood asthma hospital admissions in urban areas of Hefei City in China: A time-series study., Environ. Res. 169 (2019) 510–516. [CrossRef]
- G.E. Hinton, R.R. Salakhutdinov, Reducing the dimensionality of data with neural networks., Science. 313 (2006) 504–507. [CrossRef]
- Al-Wahaibi, A. Zeka, Health impacts from living near a major industrial park in Oman., BMC Public Health. 15 (2015) 524. [CrossRef]
- G.D. Nielsen, S.T. Larsen, P. Wolkoff, Recent trend in risk assessment of formaldehyde exposures from indoor air., Arch. Toxicol. 87 (2013) 73–98. [CrossRef]
- C.Y. Yang, J.F. Chiu, M.F. Cheng, M.C. Lin, Effects of indoor environmental factors on respiratory health of children in a subtropical climate., Environ. Res. 75 (1997) 49–55. [CrossRef]
- K. Mock, A.M. Palma, J. Wu, J. Billimek, K.D. Lu, Breathing room: industrial zoning and asthma incidence using school district health records in the city of santa ana, california., Int. J. Environ. Res. Public Health. 19 (2022). [CrossRef]
- J.S. Lwebuga-Mukasa, T.J. Oyana, P. Wydro, Risk factors for asthma prevalence and chronic respiratory illnesses among residents of different neighbourhoods in Buffalo, New York., J. Epidemiol. Community Health. 58 (2004) 951–957. [CrossRef]
- Y. Kim, J. Cho, F. Wen, S. Choi, The built environment and asthma: Los Angeles case study, J Public Health (Bangkok). 31 (2023) 57–64. [CrossRef]
- P. Orellano, N. Quaranta, J. Reynoso, B. Balbi, J. Vasquez, Effect of outdoor air pollution on asthma exacerbations in children and adults: Systematic review and multilevel meta-analysis., PLoS ONE. 12 (2017) e0174050. [CrossRef]
- Y. Jin, H. Andersson, S. Zhang, Air pollution control policies in china: A retrospective and prospects., Int. J. Environ. Res. Public Health. 13 (2016). [CrossRef]
- G. Cesaroni, F. Forastiere, M. Stafoggia, Z.J. Andersen, C. Badaloni, R. Beelen, B. Caracciolo, U. de Faire, R. Erbel, K.T. Eriksen, L. Fratiglioni, C. Galassi, R. Hampel, M. Heier, F. Hennig, A. Hilding, B. Hoffmann, D. Houthuijs, K.-H. Jöckel, M. Korek, A. Peters, Long term exposure to ambient air pollution and incidence of acute coronary events: prospective cohort study and meta-analysis in 11 European cohorts from the ESCAPE Project., BMJ. 348 (2014) f7412. [CrossRef]
- Raaschou-Nielsen, P. Vineis, B. Brunekreef, M. Nieuwenhuijsen, B. Hoffmann, F. Forastiere, A. Oudin, G. Hoek, K. Katsouyanni, P. Schwarze, R. Beelen, ESCAPE group, Air pollution and lung cancer in Europe - authors’ reply., Lancet Oncol. 14 (2013) e440. [CrossRef]
- Al-Rawas, A.A. Al-Maniri, B.M. Al-Riyami, Home exposure to Arabian incense (bakhour) and asthma symptoms in children: a community survey in two regions in Oman., BMC Pulm. Med. 9 (2009) 23. [CrossRef]
- H. Khreis, M. Cirach, N. Mueller, K. de Hoogh, G. Hoek, M.J. Nieuwenhuijsen, D. Rojas-Rueda, Outdoor air pollution and the burden of childhood asthma across Europe., Eur. Respir. J. 54 (2019). [CrossRef]
- Pierangeli, M.J. Nieuwenhuijsen, M. Cirach, D. Rojas-Rueda, Health equity and burden of childhood asthma - related to air pollution in Barcelona., Environ. Res. 186 (2020) 109067. [CrossRef]
- U. Gehring, A.H. Wijga, G.H. Koppelman, J.M. Vonk, H.A. Smit, B. Brunekreef, Air pollution and the development of asthma from birth until young adulthood., Eur. Respir. J. 56 (2020). [CrossRef]
- A.I. Tiotiu, P. Novakova, D. Nedeva, H.J. Chong-Neto, S. Novakova, P. Steiropoulos, K. Kowal, Impact of air pollution on asthma outcomes., Int. J. Environ. Res. Public Health. 17 (2020). [CrossRef]
- J.R. Balmes, M. Cisternas, P.J. Quinlan, L. Trupin, F.W. Lurmann, P.P. Katz, P.D. Blanc, Annual average ambient particulate matter exposure estimates, measured home particulate matter, and hair nicotine are associated with respiratory outcomes in adults with asthma., Environ. Res. 129 (2014) 1–10. [CrossRef]
- G. Moscato, C. Apfelbacher, K. Brockow, C. Eberle, J. Genuneit, C.G. Mortz, C. Quecchia, S. Quirce, A. Siracusa, S.M. Tarlo, V. van Kampen, J. Walusiak-Skorupa, M. Raulf, Gender and occupational allergy: Report from the task force of the EAACI Environmental and Occupational Allergy Interest Group., Allergy. 75 (2020) 2753–2763. [CrossRef]
- M. Kogevinas, J.-P. Zock, D. Jarvis, H. Kromhout, L. Lillienberg, E. Plana, K. Radon, K. Torén, A. Alliksoo, G. Benke, P.D. Blanc, A. Dahlman-Hoglund, A. D’Errico, M. Héry, S. Kennedy, N. Kunzli, B. Leynaert, M.C. Mirabelli, N. Muniozguren, D. Norbäck, J.M. Antó, Exposure to substances in the workplace and new-onset asthma: an international prospective population-based study (ECRHS-II)., Lancet. 370 (2007) 336–341. [CrossRef]
- H. Fuseini, D.C. Newcomb, Mechanisms driving gender differences in asthma., Curr. Allergy Asthma Rep. 17 (2017) 19. [CrossRef]
- G. Sit, N. Letellier, Y. Iwatsubo, M. Goldberg, B. Leynaert, R. Nadif, C. Ribet, N. Roche, Y. Roquelaure, R. Varraso, M. Zins, A. Descatha, N. Le Moual, O. Dumas, Occupational exposures to organic solvents and asthma symptoms in the CONSTANCES cohort., Int. J. Environ. Res. Public Health. 18 (2021). [CrossRef]
- P. Ilmarinen, L.E. Tuomisto, H. Kankaanranta, Phenotypes, Risk Factors, and Mechanisms of Adult-Onset Asthma., Mediators Inflamm. 2015 (2015) 514868. [CrossRef]
- R. Golden, Identifying an indoor air exposure limit for formaldehyde considering both irritation and cancer hazards., Crit. Rev. Toxicol. 41 (2011) 672–721. [CrossRef]
- D.J. Tan, E.H. Walters, J.L. Perret, J.A. Burgess, D.P. Johns, A.J. Lowe, C.J. Lodge, P. Hayati Rezvan, J.A. Simpson, S. Morrison, B.R. Thompson, P.S. Thomas, I. Feather, G.G. Giles, J.L. Hopper, M.J. Abramson, M.C. Matheson, S.C. Dharmage, Clinical and functional differences between early-onset and late-onset adult asthma: a population-based Tasmanian Longitudinal Health Study., Thorax. 71 (2016) 981–987. [CrossRef]
- G. Bowatte, B. Erbas, C.J. Lodge, L.D. Knibbs, L.C. Gurrin, G.B. Marks, P.S. Thomas, D.P. Johns, G.G. Giles, J. Hui, M. Dennekamp, J.L. Perret, M.J. Abramson, E.H. Walters, M.C. Matheson, S.C. Dharmage, Traffic-related air pollution exposure over a 5-year period is associated with increased risk of asthma and poor lung function in middle age., Eur. Respir. J. 50 (2017). [CrossRef]
- E. Rönmark, A. Lindberg, L. Watson, B. Lundbäck, Outcome and severity of adult onset asthma--report from the obstructive lung disease in northern Sweden studies (OLIN)., Respir. Med. 101 (2007) 2370–2377. [CrossRef]
- S. Bronnimann, B. Burrows, A prospective study of the natural history of asthma. Remission and relapse rates., Chest. 90 (1986) 480–484. [CrossRef]
- P. Maestrelli, Natural History of Adult-Onset Asthma, Am. J. Respir. Crit. Care Med. 169 (2004) 331–332. [CrossRef]
- G.A. Settipane, W.A. Greisner, R.J. Settipane, Natural history of asthma: a 23-year followup of college students., Ann. Allergy Asthma Immunol. 84 (2000) 499–503. [CrossRef]
- B.A. Bauer, C.E. Reed, J.W. Yunginger, P.C. Wollan, M.D. Silverstein, Incidence and outcomes of asthma in the elderly. A population-based study in Rochester, Minnesota., Chest. 111 (1997) 303–310. [CrossRef]
- C.E. Reed, The natural history of asthma in adults: the problem of irreversibility., J. Allergy Clin. Immunol. 103 (1999) 539–547. [CrossRef]
- M. Masoli, D. Fabian, S. Holt, R. Beasley, Global Initiative for Asthma (GINA) Program, The global burden of asthma: executive summary of the GINA Dissemination Committee report., Allergy. 59 (2004) 469–478. [CrossRef]
- Y. Feng, Y. Wang, C. Zeng, H. Mao, Artificial intelligence and machine learning in chronic airway diseases: focus on asthma and chronic obstructive pulmonary disease., Int. J. Med. Sci. 18 (2021) 2871–2889. [CrossRef]
- X. Li, S. Huang, A. Jiao, X. Yang, J. Yun, Y. Wang, X. Xue, Y. Chu, F. Liu, Y. Liu, M. Ren, X. Chen, N. Li, Y. Lu, Z. Mao, L. Tian, H. Xiang, Association between ambient fine particulate matter and preterm birth or term low birth weight: An updated systematic review and meta-analysis., Environ. Pollut. 227 (2017) 596–605. [CrossRef]
- W.-C. Ho, W.R. Hartley, L. Myers, M.-H. Lin, Y.-S. Lin, C.-H. Lien, R.-S. Lin, Air pollution, weather, and associated risk factors related to asthma prevalence and attack rate., Environ. Res. 104 (2007) 402–409. [CrossRef]
| Exposure Zone | Total | Severe | Moderate | Mild | |
|---|---|---|---|---|---|
| (Exposure Zones %) | Cases Number (Asthma severity % - Exposure zones %) |
||||
| All | High (<6 km) | 210 (51.2%) |
56 (26.7%-51.9%) |
107 (51%-49.1%) |
47 (22.4%-56%) |
| Middle (6 - 12 km) | 146 (35.6%) |
38 (26%-35.2%) |
76 (52.1%-34.9%) |
32 (21.9%-38.1%) |
|
| Low (>12 km) | 54 (13.2%) |
14 (25.9%-13%) |
35 (64.8%-16.1%) |
5 (9.3%-6%) |
|
| Male | High (<6 km) | 105 (55.6%) |
31 (29.5%-63.3%) |
52 (49.5%-49.5%) |
22 (21%-62.9%) |
| Middle (6 - 12 km) | 61 (32.3%) |
14 (23%-28.6%) |
35 (57.4%-33.3%) |
12 (19.7%-34.3%) |
|
| Low (>12 km) | 23 (12.2%) |
4 (17.4%-8.2%) |
18 (78.3%-17.1%) |
1 (4.3%-2.9%) |
|
| Female | High (<6 km) | 105 (47.5%) |
25 (23.8%-42.4%) |
55 (52.4%-48.7%) |
25 (23.8%-51%) |
| Middle (6 - 12 km) | 85 (38.5%) |
24 (28.2%-40.7%) |
41 (48.2%-36.3%) |
20 (23.5%-40.8%) |
|
| Low (>12 km) | 31 (14%) |
10 (32.3%-16.9%) |
17 (54.8%-15%) |
4 (12.9%-8.2%) |
|
| Valid Samples | High | Low | Severe Asthma (High/Low) | Moderate & Mild Asthma (High/Low) | RR (CI95%) | X2 | |
|---|---|---|---|---|---|---|---|
| SIP | 264 | <6 km | >12 km | 47/5 | 163/49 | 2.42 (1.01-5.78) | 0.031* |
| SIZ | 264 | <10 km | >20 km | 40/11 | 122/64 | 1.68 (0.92-3.09) | 0.081 |
| MIA | 176 | <6 km | >12 km | 27/11 | 72/66 | 1.91 (1.01-3.6) | 0.038* |
| CA | 323 | <8 km | >12 km | 25/41 | 118/139 | 0.77 (0.49-1.2) | 0.241 |
| SIP-North | 223 | Middle | North | 23/20 | 82/98 | 1.29 (0.75-2.21) | 0.349 |
| SIP-South | 269 | Middle | South | 23/40 | 82/124 | 0.9 (0.57-1.41) | 0.639 |
| Distance From SIP (km) | Distance From SIZ (km) | Distance From MIA (km) | Total N. | Severe Asthma N. | Moderate&Mild Asthma N. | Severe Asthma % | Latitude | Longitude | RR (CI95%) | χ2 | |
|---|---|---|---|---|---|---|---|---|---|---|---|
| Ghadhfan | 2.6 | 11.3 | 5.3 | 30 | 8 | 22 | 27% | 24.471 | 56.602 | 2.88 (1.03-8.02) | 0.035* |
| Al Hadd | 3.4 | 13.8 | 6.2 | 21 | 5 | 16 | 24% | 24.487 | 56.585 | 2.57 (0.83-7.98) | 0.10 |
| Liwa | 4.0 | 16.0 | 8.8 | 22 | 5 | 17 | 23% | 24.512 | 56.586 | 2.45 (0.79-7.65) | 0.12 |
| Harmul | 4.1 | 16.7 | 10.3 | 21 | 5 | 16 | 24% | 24.523 | 56.596 | 2.57 (0.83-7.98) | 0.10 |
| Al Khuwayriyyah | 4.7 | 8.0 | 6.1 | 12 | 2 | 10 | 17% | 24.449 | 56.626 | 1.8 (0.4-8.2) | 0.45 |
| Al Eqdah | 5.1 | 15.7 | 7.2 | 13 | 3 | 10 | 23% | 24.498 | 56.569 | 2.49 (0.68-9.12) | 0.17 |
| Mikhaylif | 5.1 | 16.5 | 8.4 | 19 | 2 | 17 | 11% | 24.508 | 56.572 | 1.14 (0.24-5.38) | 0.87 |
| Majees | 6.0 | 8.2 | 9.6 | 72 | 17 | 55 | 24% | 24.455 | 56.657 | 2.55 (1-6.48) | 0.036* |
| Harat Ash Shaykh | 6.1 | 6.8 | 7.6 | 8 | 2 | 6 | 25% | 24.442 | 56.641 | 2.7 (0.63-11.65) | 0.19 |
| Falaj Al Qabail | 6.4 | 6.4 | 5.9 | 69 | 19 | 50 | 28% | 24.433 | 56.626 | 2.97 (1.19-7.45) | 0.011* |
| Az Zahiyah | 7.7 | 19.7 | 11.5 | 40 | 5 | 35 | 13% | 24.537 | 56.563 | 1.35 (0.42-4.35) | 0.61 |
| Nabr | 10.1 | 22.5 | 14.5 | 20 | 5 | 15 | 25% | 24.563 | 56.559 | 2.7 (0.87-8.35) | 0.08 |
| Rumelah | 10.7 | 23.1 | 15.4 | 7 | 1 | 6 | 14% | 24.572 | 56.563 | 1.54 (0.21-11.37) | 0.67 |
| Control | 19.0 | 26.0 | 18.8 | 54 | 5 | 49 | 9% | 24.505 | 56.499 | - | - |
| Exposure Zone | Age Range | Total | Severe | Moderate | Mild | All | Male | Female | |||
|---|---|---|---|---|---|---|---|---|---|---|---|
| Age ranges (%) |
Cases Number (Asthma severity % - Age range %) |
RR (CI95%) |
χ2 | RR (CI95%) |
χ2 | RR (CI95%) |
χ2 | ||||
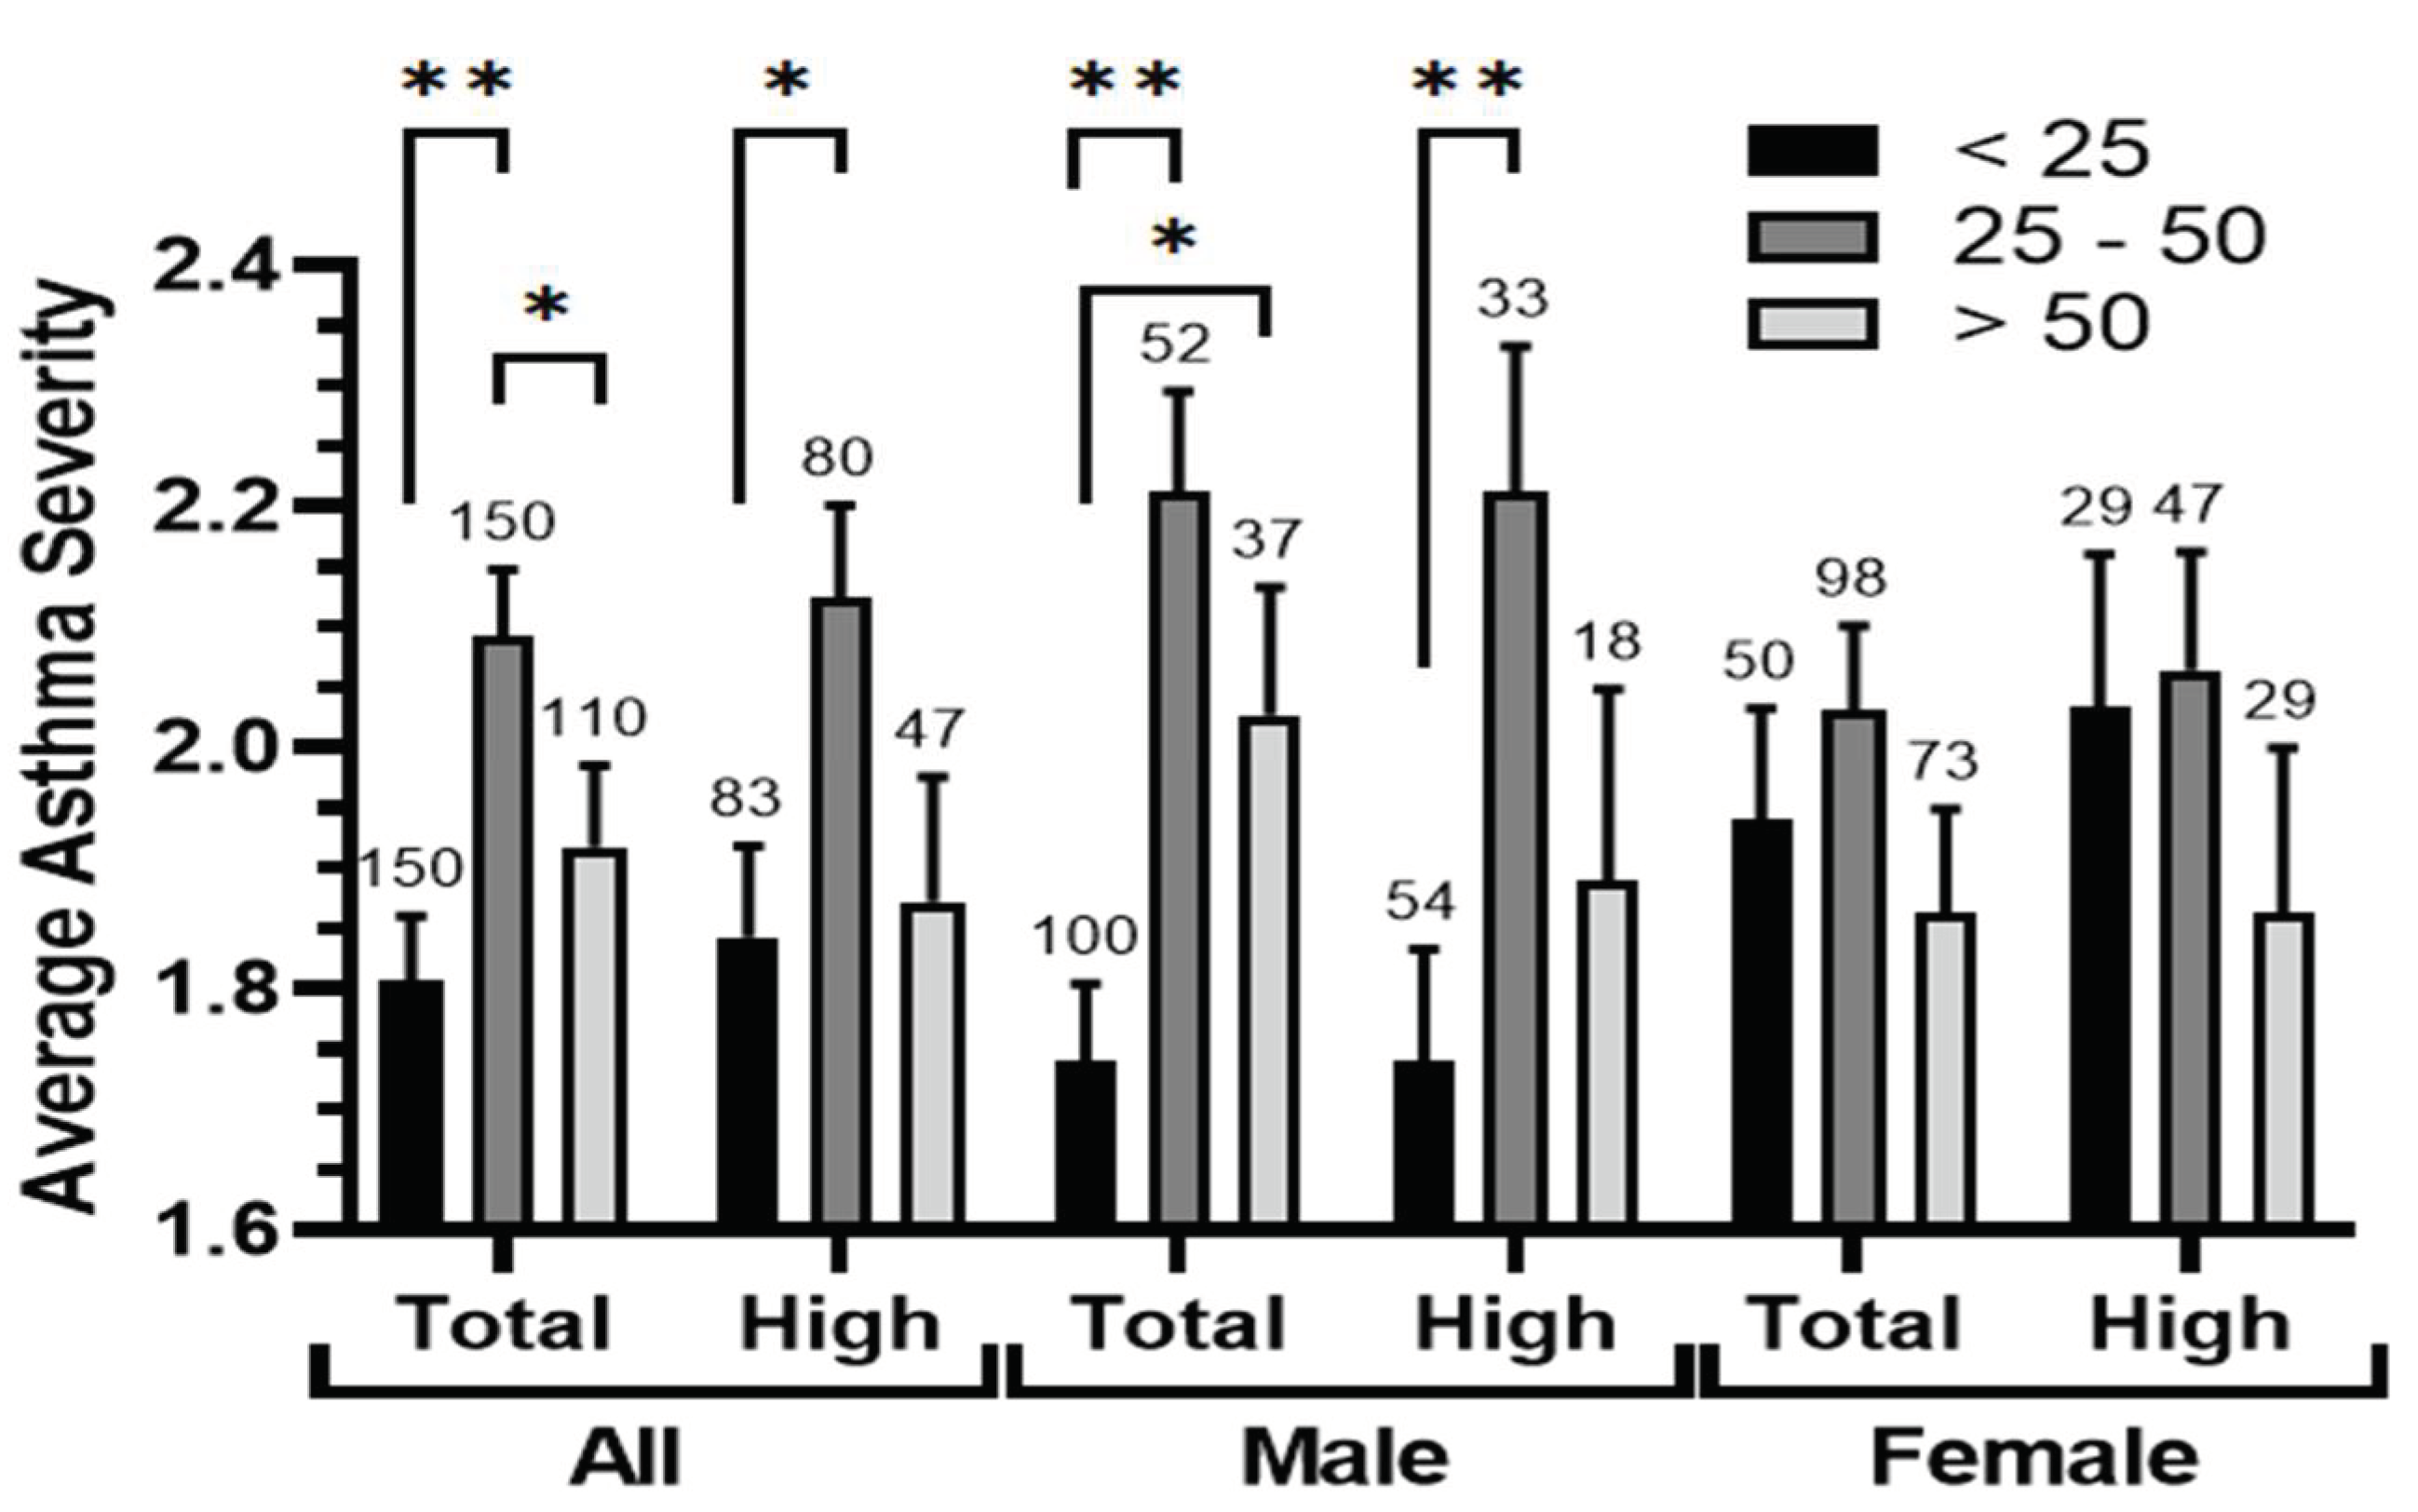
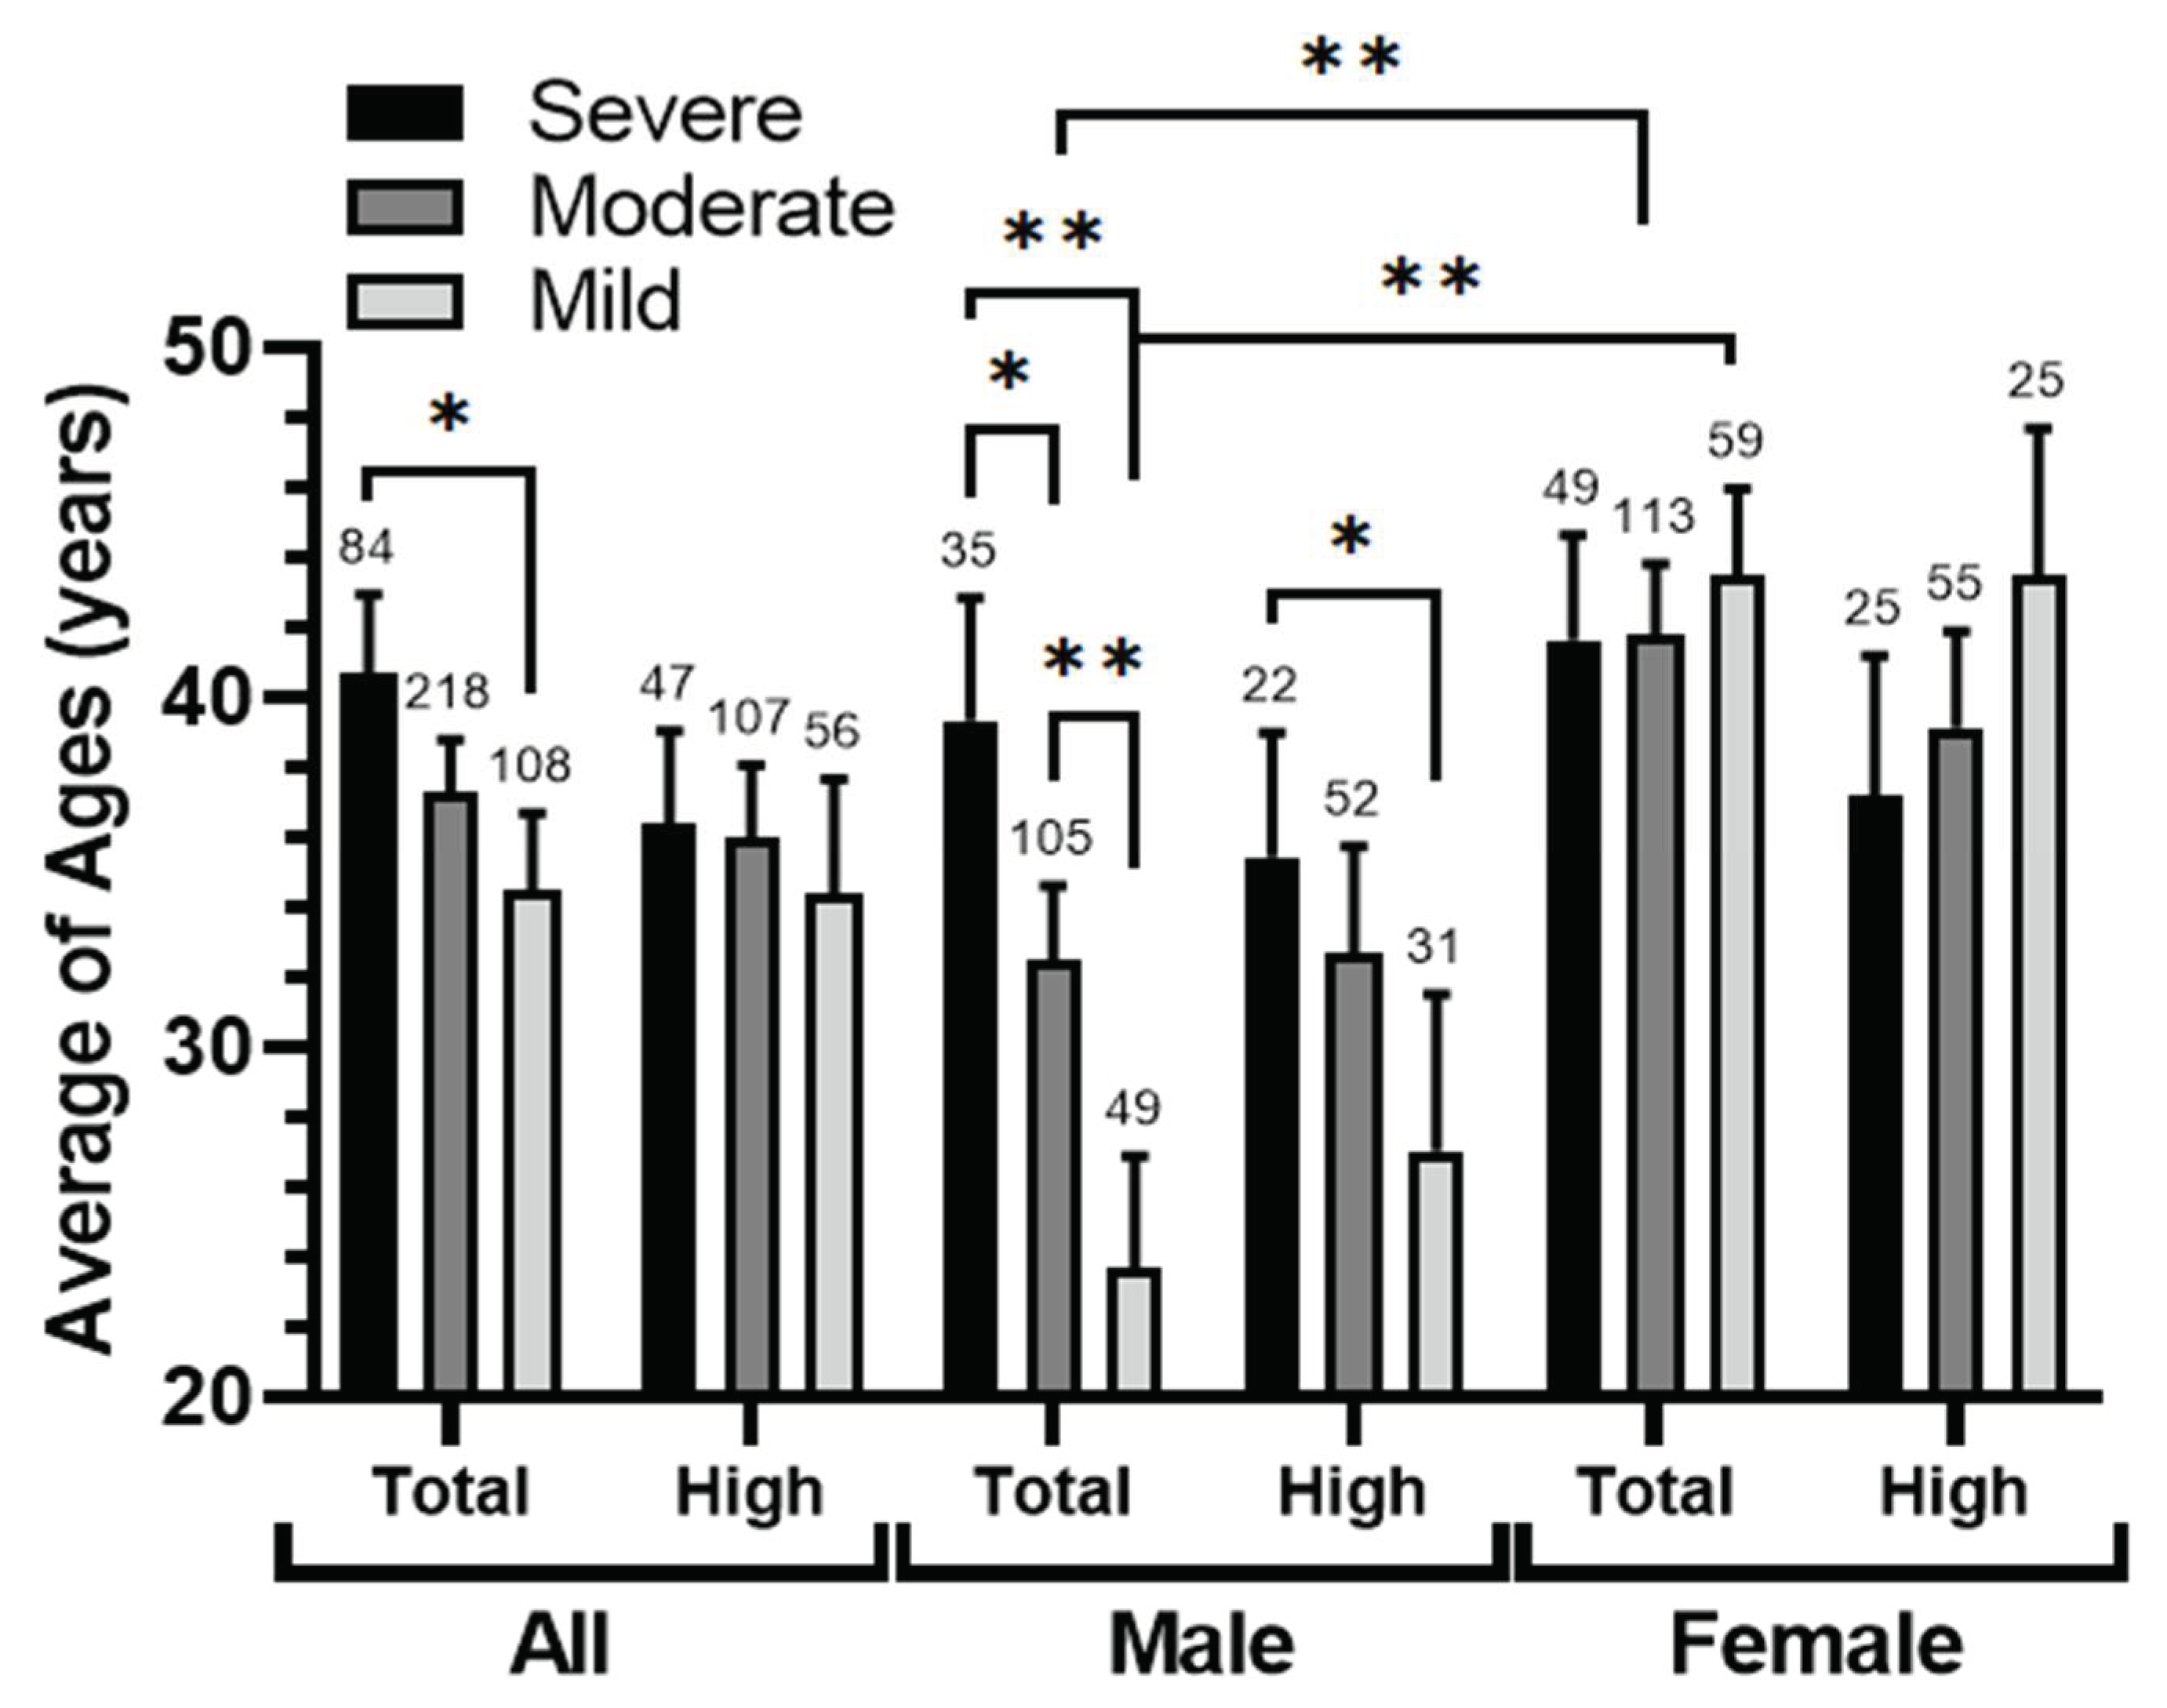
| Total | < 25 | 150 (36.6%) |
20 (13.3%-23.8%) |
81 (54%-37.2%) |
49 (32.7%-45.4%) |
- | - | - | - | - | - |
| 25 - 50 | 150 (36.6%) |
41 (27.3%-48.8%) |
82 (54.7%-37.6%) |
27 (18%-25%) |
2.05 (1.26-3.33) |
0.003* | 2.8 (1.4-5.58) |
0.002* | 1.417 (0.72-2.80) |
0.304 | |
| > 50 | 110 (26.8%) |
23 (20.9%-27.4%) |
55 (50%-25.2%) |
32 (29.1%-29.6%) |
1.57 (0.91-2.71) |
0.104 | 1.97 (0.86-4.5) |
0.11 | 1.14 (0.54-2.4) |
0.727 | |
|
High <6 Km from SIP |
< 25 | 83 (39.5%) |
14 (16.9%-29.8%) |
42 (50.6%-39.3%) |
27 (32.5%-48.2%) |
- | - | - | - | - | - |
| 25 - 50 | 80 (38.1%) |
24 (30%-51.1%) |
42 (52.5%-39.3%) |
14 (17.5%-25%) |
1.78 (0.99-3.19) |
0.047* | 2.81 (1.23-6.4) |
0.1 | 1.058 (0.47-2.38) |
0.892 | |
| > 50 | 47 (22.4%) |
9 (19.1%-19.1%) |
23 (48.9%-21.5%) |
15 (31.9%-26.8%) |
1.14 (0.53-2.42) |
0.743 | 1.286 (0.37-4.46) |
0.694 | 0.857 (0.33-2.24) |
0.753 | |
| Exposure Zone | Smoking State | All | Male/Female | Severe* | Moderate* | Mild* | Severe/Mild | Severe/Comb** | ||
|---|---|---|---|---|---|---|---|---|---|---|
| (Smoking groups %) | Cases Number (Asthma severity % - Smoking groups %) |
RR (CI 95%) |
χ2 | RR (CI 95%) |
χ2 | |||||
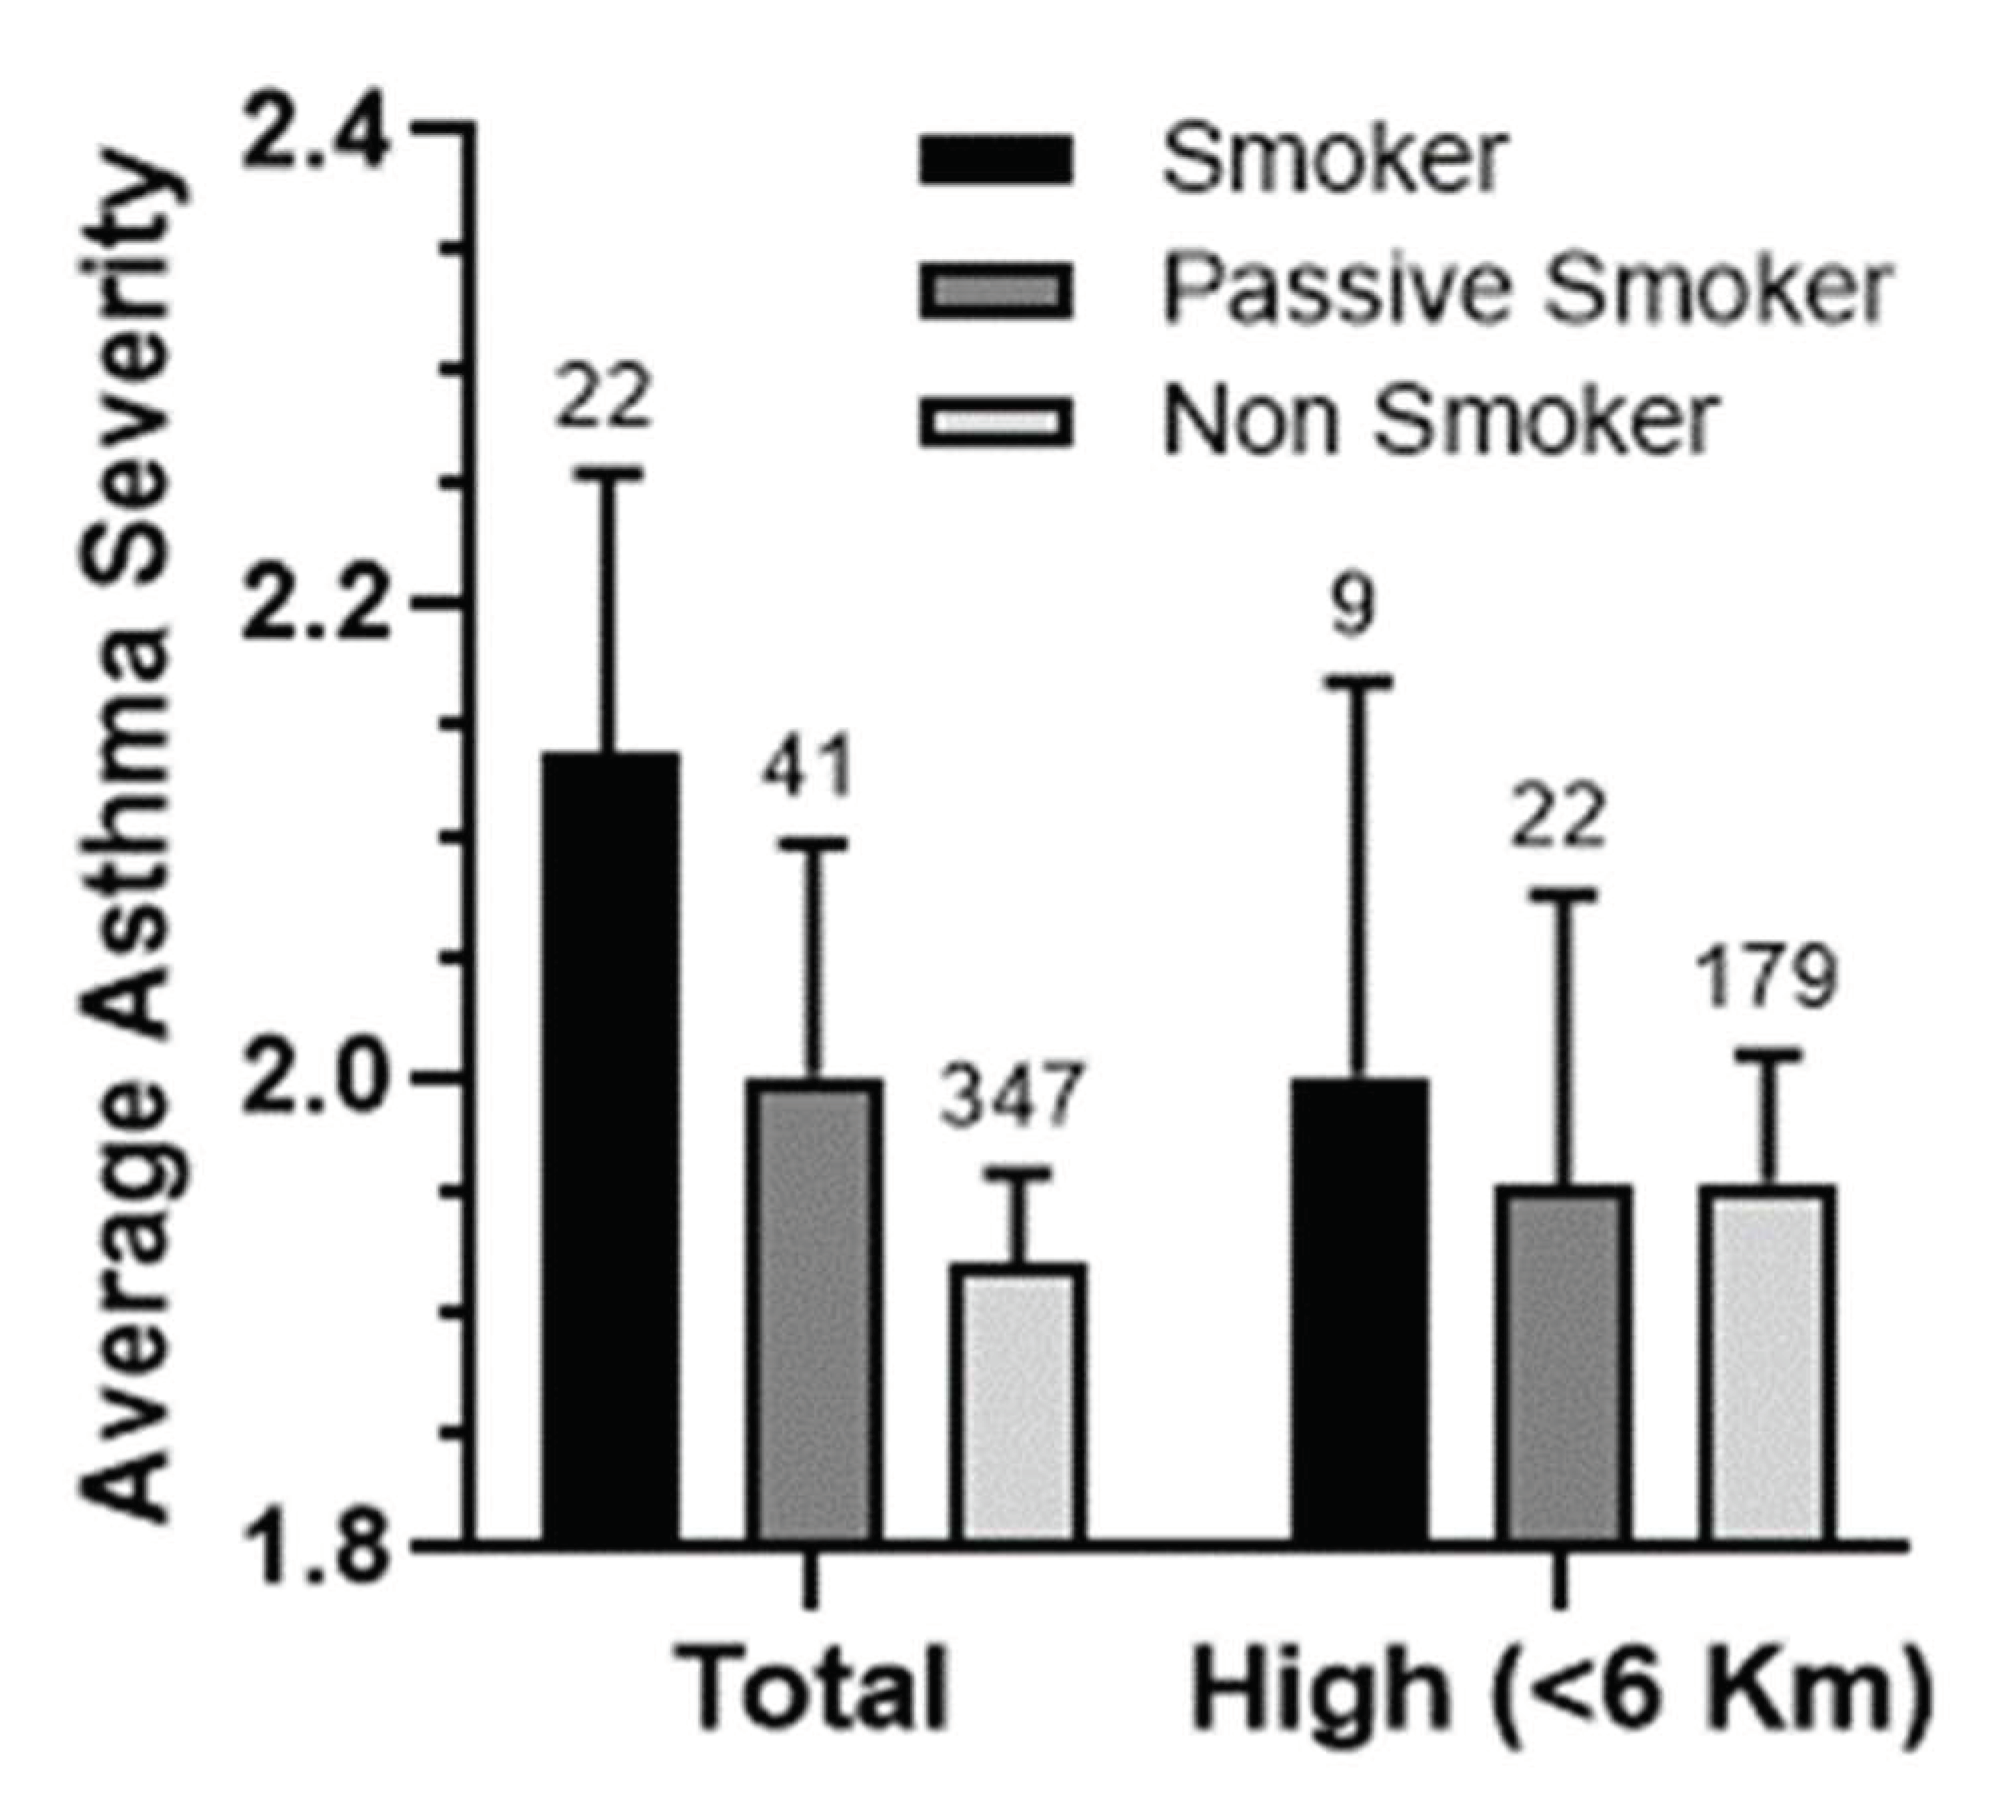
| Total | Non Smoker | 347 (84.6%) |
155/192 (82.0%-86.9%) |
71 (20.5%-84.5%) |
178 (51.3%-81.6%) |
98 (28.2%-90.7%) |
- | - | - | - |
| Smoker | 22 (5.4%) |
19/3 (10.1%-1.4%) |
5 (22.7%-5.9%) |
15 (68.2%-6.9%) |
2 (9.1%-1.8%) |
1.7 (1.03-2.81) |
0.12 | 1.11 (0.5-2.47) |
0.80 | |
| Passive Smoker | 41 (10%) |
15/26 (7.9%-11.8%) |
8 (19.5%-9.5%) |
25 (61%-11.5%) |
8 (19.5%-7.4%) |
1.19 (0.71-2) |
0.54 | 0.95 (0.5-1.84) |
0.89 | |
|
High <6 Km from SIP |
Non Smoker | 179 (85.2%) |
89/90 (84.8%-85.7%) |
43 (24%-91.5%) |
85 (47.5%-79.4%) |
51 (28.5%-91.1%) |
- | - | - | - |
| Smoker | 9 (4.3%) |
8/1 (7.6%-1.0%) |
1 (11.1%-2.1%) |
7 (77.8%-6.5%) |
1 (11.1%-1.8%) |
1.09 (0.27-4.45) |
0.90 | 0.46 (0.07-2.99) |
0.37 | |
| Passive Smoker | 22 (10.5%) |
8/14 (7.6%-13.3%) |
3 (13.6%-6.4%) |
15 (68.2%-14%) |
4 (18.2%-7.1%) |
0.94 (0.39-2.27) |
0.88 | 0.57 (0.19-1.68) |
0.27 | |
| Contaminants | Respondent N | Respondent % | Responses % | Severe Asthma % | Severe Asthma Y/N | Comb Asthma Y/N | Total | High (<6 Km) | ||
|---|---|---|---|---|---|---|---|---|---|---|
| RR (CI95%) |
χ2 | RR (CI95%) |
χ2 | |||||||
| Yes | 281 | 68.5% | - | 19.2% | 54 | 227 | 0.83 (0.56-1.23) |
0.347 | 0.76 (0.45-1.28) |
0.303 |
| Uncertain | 129 | 31.5% | - | 23.3% | 30 | 99 | - | - | - | - |
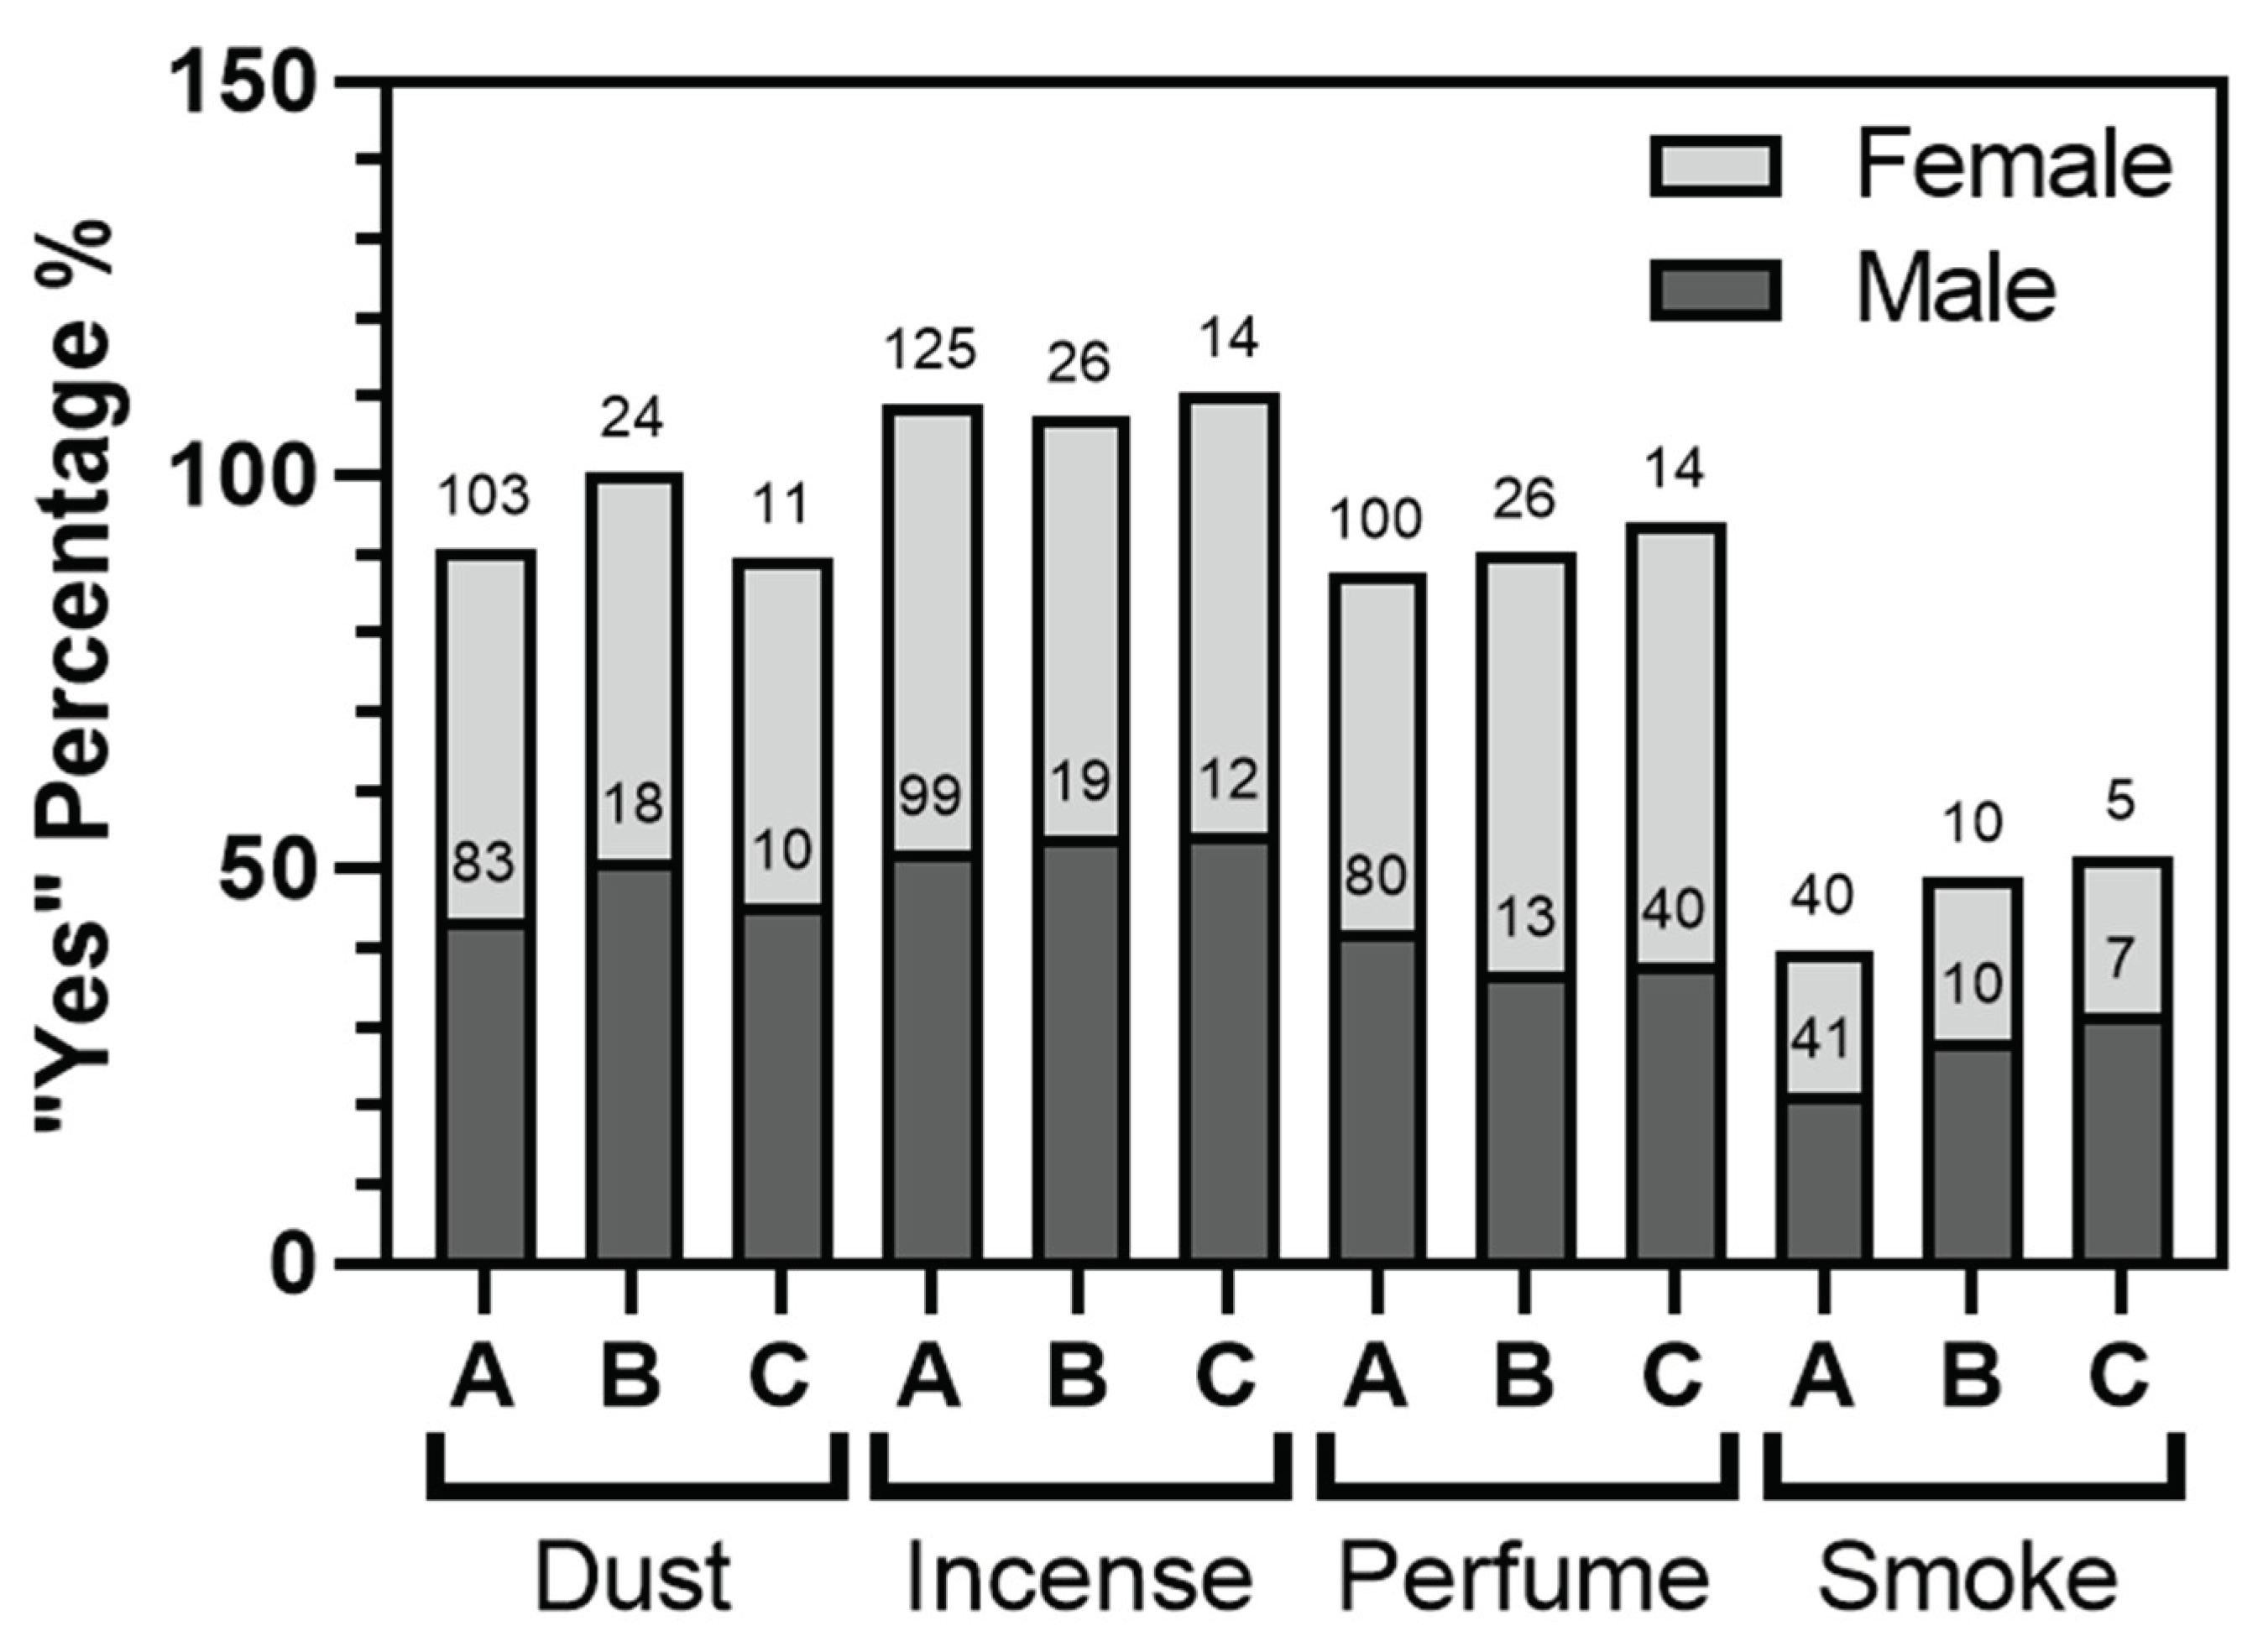
| Dust | 186 | 67.9% | 27.7% | 22.6% | 42/42 | 144/182 | 1.2 (0.82-1.76) |
0.339 | 1.02 (0.61-1.69) |
0.951 |
| Incense | 224 | 81.8% | 33.4% | 20.1% | 45/39 | 179/147 | 0.96 (0.65-1.4) |
0.826 | 1 (0.6-1.67) |
0.99 |
| Perfume | 180 | 65.7% | 26.8% | 21.7% | 39/45 | 141/185 | 1.11 (0.76-1.62) |
0.601 | 1.21 (0.73-2.01) |
0.457 |
| Smoke | 81 | 29.6% | 12.1% | 24.7% | 20/64 | 61/265 | 1.27 (0.82-1.97) |
0.295 | 1.41 (0.81-2.47) |
0.238 |
| Total Respondent | 274 | 100.0% | - | 19.3% | 53 | 221 | - | - | - | - |
| Total Responses | 671 | - | 100.0% | 21.8% | 146 | 525 | - | - | - | - |
|
|
Predicted | ||||||
|---|---|---|---|---|---|---|---|
| Very Low Risk | Low Risk | Average Risk | High Risk | Very High Risk | Percent Correct | ||
| Training | Very Low Risk | 47 | 1 | 0 | 0 | 0 | 97.9% |
| Low Risk | 1 | 59 | 4 | 0 | 0 | 92.2% | |
| Average Risk | 0 | 1 | 53 | 1 | 3 | 91.4% | |
| High Risk | 0 | 0 | 0 | 57 | 2 | 96.6% | |
| Very High Risk | 0 | 0 | 1 | 1 | 55 | 96.5% | |
| Overall Percent | 16.8% | 21.3% | 20.3% | 20.6% | 21.0% | 94.8% | |
| Testing | Very Low Risk | 29 | 0 | 0 | 0 | 0 | 100.0% |
| Low Risk | 1 | 24 | 1 | 1 | 1 | 88.9% | |
| Average Risk | 0 | 0 | 17 | 2 | 3 | 77.3% | |
| High Risk | 0 | 0 | 1 | 18 | 2 | 85.7% | |
| Very High Risk | 17.7 | 0 | 0 | 1 | 24 | 96.0% | |
| Overall Percent | 23.4% | 19.4% | 15.3% | 17.7% | 24.2% | 90.3% | |
Disclaimer/Publisher’s Note: The statements, opinions and data contained in all publications are solely those of the individual author(s) and contributor(s) and not of MDPI and/or the editor(s). MDPI and/or the editor(s) disclaim responsibility for any injury to people or property resulting from any ideas, methods, instructions or products referred to in the content. |
© 2024 by the authors. Licensee MDPI, Basel, Switzerland. This article is an open access article distributed under the terms and conditions of the Creative Commons Attribution (CC BY) license (http://creativecommons.org/licenses/by/4.0/).


