1. Introduction
Cheese whey (CW) is the by-product of cheese production and large amounts are generated worldwide. CW contains more than 50% of the solids present in the original whole milk, namely lactose, whey proteins, water-soluble vitamins and minerals [
1,
2]. About half of the CW generated worldwide is valorized through the production of whey powder (WP), whey protein concentrates (WPC), isolates (WPI), hydrolysates (WPH) or dried lactose [
3,
4]. In some countries such as Portugal, Spain and Italy, part of the whey is used to produce whey cheeses, respectively known as
Requeijão,
Requesón or
Ricotta [
5]. Whey cheese is a traditional product manufactured via thermal processing of whey, which allows for the retrieval of most of the original protein and fat fractions of CW [
6]. Whey, previously acidified or not, is heated at 90-95 ºC to precipitate whey proteins. The protein aggregates originate a matrix that entraps fat and other solids present in whey. The liquid remaining after production of whey cheeses is called second cheese whey (SCW) or “deproteinized” whey [
7]. Whey cheeses are mostly produced with whey resulting from the production of sheep’s or goat’s milk cheeses. However, cow’s whey can also be used to produce such cheeses, although the yield is lower. In Italy only about 15% of CW obtained annually is used to produce
Ricotta cheese [
8]. The low valorization of whey through the production of whey cheese (WC) results from the fact that WC production is an energy intensive process, which associated to the short shelf life of the product, represents a challenge for producers.
To overcome the difficulties related to the low yield and high energy consumption associated to WC production, selective concentration of CW by ultrafiltration (UF) can represent a major aid for producers. Tangential filtration technologies such as UF or nanofiltration (NF) can be considered the best available tool to manage dairy byproducts, allowing for the selective concentration of its specific components, namely proteins. CW is concentrated by UF prior to whey cheese manufacture, reducing drastically the volume of product to be submitted to the thermal treatment, hence, the energy required to produce whey cheeses [
9,
10,
11,
12,
13,
14,
15]. Some authors also propose the use of transglutaminase to increase the yield in whey cheese production [
16].
Several attempts have also been made to increase the shelf life of whey cheeses, most of them based on the use of modified atmosphere packaging [
17,
18,
19,
20] and more recently using lactic acid bacteria, including probiotics, as bioprotective cultures [
21,
22,
23,
24,
25,
26]. Regarding the use of
Requeijão as carrier of probiotic bacteria, extensive research has been carried out by Madureira and coworkers [
27,
28,
29,
30,
31,
32,
33,
34]. However, the color and the rheological, textural and sensory properties of the resulting probiotic whey cheeses can be different to those of control WC what can originate lower acceptance by consumers.
The aim of the present work was to produce whey cheeses with added probiotics or probiotics plus protective cultures, using UF concentrated bovine cheese whey. The products were compared with control whey cheeses without added cultures.
2. Materials and Methods
2.1. Production of liquid whey concentrates
Sweet cheese whey resulted from the production of cow’s milk cheese at the dairy pilot plant of Polytechnic Institute of Coimbra, School of Agriculture (Coimbra, Portugal). CW (200 L) was subjected to ultrafiltration (UF) in a pilot plant supplied by Proquiga Biotech SA (A Coruña, Spain) equipped with an organic UF membrane (3838 PVDF/polysulfone) with an effective filtration area of 7 m2 and 10 kDa cut-off, supplied by FipoBiotech (Vigo, Spain). The process was carried out at 40-45 °C, at a transmembrane pressure of 3.0-3.5 bar, aiming a volumetric concentration factor (VCF=Vol. Feed/Vol. Retentate) of 5. The UF concentration step allowed for the obtention of 40 L of liquid whey concentrate (LWC), which was used in the production of whey cheeses.
2.2. Manufacture of whey cheeses
2% (v/v) full-fat milk (3.2% protein; 3.6% fat), 1% (w/v) salt, 2% (w/v) starch (Pregeflo™ CH 20, Roquette Freres, Lestrem, France) and 0.04% (v/v) CaCl2 (51% w/v, supplied by Tecnilac, Viseu, Portugal) were added to the LWC. The mixture was heated at 90-95 ºC for 20 min to allow coagulation and subsequent precipitation of whey proteins. The precipitated fraction was separated from the remaining liquid and divided in three similar portions which were submitted to different treatments: control without any addition (C); with the addition of 10% (w/w) full-fat milk fermented with the probiotic Lactobacillus acidophilus (LA5™ Chr. Hansen, Hoersholm, Denmark) (LA5); with the addition of 10% (w/w) full-fat milk fermented with the probiotic culture (LA5) plus a protective culture containing Lactobacillus paracasei and Lactobacillus rhamnosus (FreshQ4™, Chr. Hansen, Hoersholm, Denmark) (LA5FQ4). Both starter cultures were previously inoculated in the milk and incubated for 15 h at 30 °C according to manufacturer’s instructions. The whey cheeses were packaged in closed polypropylene boxes (Ondipack™, Makro, Carnaxide, Portugal) and stored under refrigerated conditions at 4 ± 1 ºC for 28 days. Consecutive analyses were performed at 1st, 7th 14th, 21st and 28th days of storage.
2.3. Physicochemical analysis
Dry matter was determined by drying the samples in a Schutzart DIN 40050-IP20 Memmert™ oven, according to NP 703:1982 for yoghurt [
35]. Ashes were determined by incineration of dry samples in a HD-23 Hobersal™ electric muffle furnace. Fat was determined by the Gerber method (SuperVario-N Funke Gerber™ centrifuge) according to NP 2105:1983 [
36]. Total nitrogen content was determined by the Kjeldahl method in the Digestion System 6 1007 Digester Tecator™ following the AOAC (1997) standard [
37]. To calculate the percentage of protein a conversion factor of 6.38 was used. All analyzes were performed in triplicate.
2.3.1. pH and titratable acidity
The pH of all samples was directly determined with the aida of a HI 9025 HANNA Instruments pH meter, immediately after production and on the 1st, 7th 14th, 21st and 28th days of storage. Titratable acidity, expressed in % lactic acid, was determined by titration using a 0.1 N NaOH solution according to NP 701:1982 for yoghurts [
38].
2.3.2. Color parameters
The color of whey cheese samples was determined with a Minolta™ Chroma Meter, model CR-200B colorimeter (Tokyo, Japan) calibrated with a white standard (CR-A47: Y = 94.7; x 0.313; y 0.3204) under the following conditions: illuminant C, 1 cm diameter aperture, 10° standard observer. Color coordinates were measured in the CIEL*a*b* system. Three measurements were taken for each sample. Color difference (ΔEab*) was calculated as:
where L*
0, a*
0, and b*
0 and L*, a*, and b* were the values measured for the samples under comparison.
2.3.3. Rheological parameters
Rheological tests were performed at 5 °C, using a Rheostress 6000 rheometer with a plate-to-plate (TMP35 bottom plate and P35 TiL upper plate) equipped with the software HAAKE RheoWin Job Manager software, version 4.82.0002 for data acquisition (ThermoHaake™, ThermoFisher Scientific, Waltham, MA, USA). The measurement system consisted of a cone and plate geometry, C60/Ti-0.052mm (35 mm diameter and 1° angle). Stress sweep tests were performed at 1 Hz to determine the rheological linear viscoelastic behavior of all samples. The measurements were made on the 1st, 14th and 28th days of storage. Values for the elastic and viscous modulii (G′ and G″) and of the complex viscosity (η*) were obtained at frequencies from 0.05 to 1.0 Hz.
The complex viscosity of the samples was adjusted to the power law model according to equation 2, and the consistency index K (Pa.s
n−1) and power-law index (n) were determined. This model is usually applied for shear-thinning fluids such as weak gels and low-viscosity dispersions.
𝑘 = flow consistency index
𝛾˙= shear strain
𝑛 = flow behavior index (Pa.sn)
2.3.4. Texture parameters
A Stable Micro Systems™ texture analyzer, model TA.XT Express Enhanced (Godalming, UK), was used to evaluate the textural properties of WC samples and the results were calculated using the Specific Expression PC software (version 1.1.9.0). The test was run with a penetration distance of 15 mm at 2 mm/s using an acrylic cylindrical probe with a diameter of 25.4 mm and a height of 38.1 mm.
2.4. Microbiological analysis
The microbial counts of lactic acid bacteria (LAB) of the genera
Lactobacillus spp. and
Lactococcus spp. were evaluated at the 1st, 7th 14th, 21st and 28th days of storage. Microorganisms were enumerated on plates incubated at 37 °C for 48 h on M17 agar for lactococci (in aerobiosis) and on MRS agar (in anaerobiosis) for lactobacilli, according to ISO 7889, IDF 117 (2003) [
39]. Yeasts and moulds were enumerated in plates at 25 °C according to ISO 6611 IDF 94 (2204) [
40]. Culture media were supplied by Biokar Diagnostics, Allonee, France. Analyses were carried out in triplicate along with two controls for each medium and results are expressed as log CFU/g of product.
2.5. Sensory analysis
Analysis of the sensory characteristics was conducted in isolated booths with the same lighting and temperature conditions. The formulations coded with three-digit random numbers were analysed for aroma, taste, texture, and global impression by the acceptance test employing 9-point hedonic scale, in which 1= dislike extremely; and 9= likely extremely, using a non-trained panel with 30 members [
41]. The members of panel were also asked to rank the samples according to their preference, from 1-most preferred to 3-less preferred, according to ISO 8587 (1988) [
42]. The members of the panel were informed the objectives of the test and signed the informed consent form in practice at the Polytechnic of Coimbra giving their consent for the treatment and publication of results.
2.6. Statistical analysis
The influence of days of storage and kind of whey cheese and their interaction on all the parameters determined were analyzed by a two-way ANOVA. The differences among whey cheeses and among different days of storage were assessed by one-way ANOVA being the means compared by Tukey’s post hoc test. For all mean evaluations, a significance level of p < 0.05 was used (IBM SPSS Statistics for Windows (version 27); (2021; IBM Corp, Armonk, NY, USA). Graphs were produced using the Statistica Software, version 8 (Stasoft Europe, Hamburg, Germany).
3. Results
Table 1 represents the protein, fat and ashes content of the different WC samples. Non-significant differences were observed regarding the protein content of whey cheeses, but the products with added microbial cultures presented a higher fat and a lower mineral content. These differences, most probably, resulted from the added milk in which the cultures were pre-incubated (which was added at a level of 10% w/w of the whey cheeses).
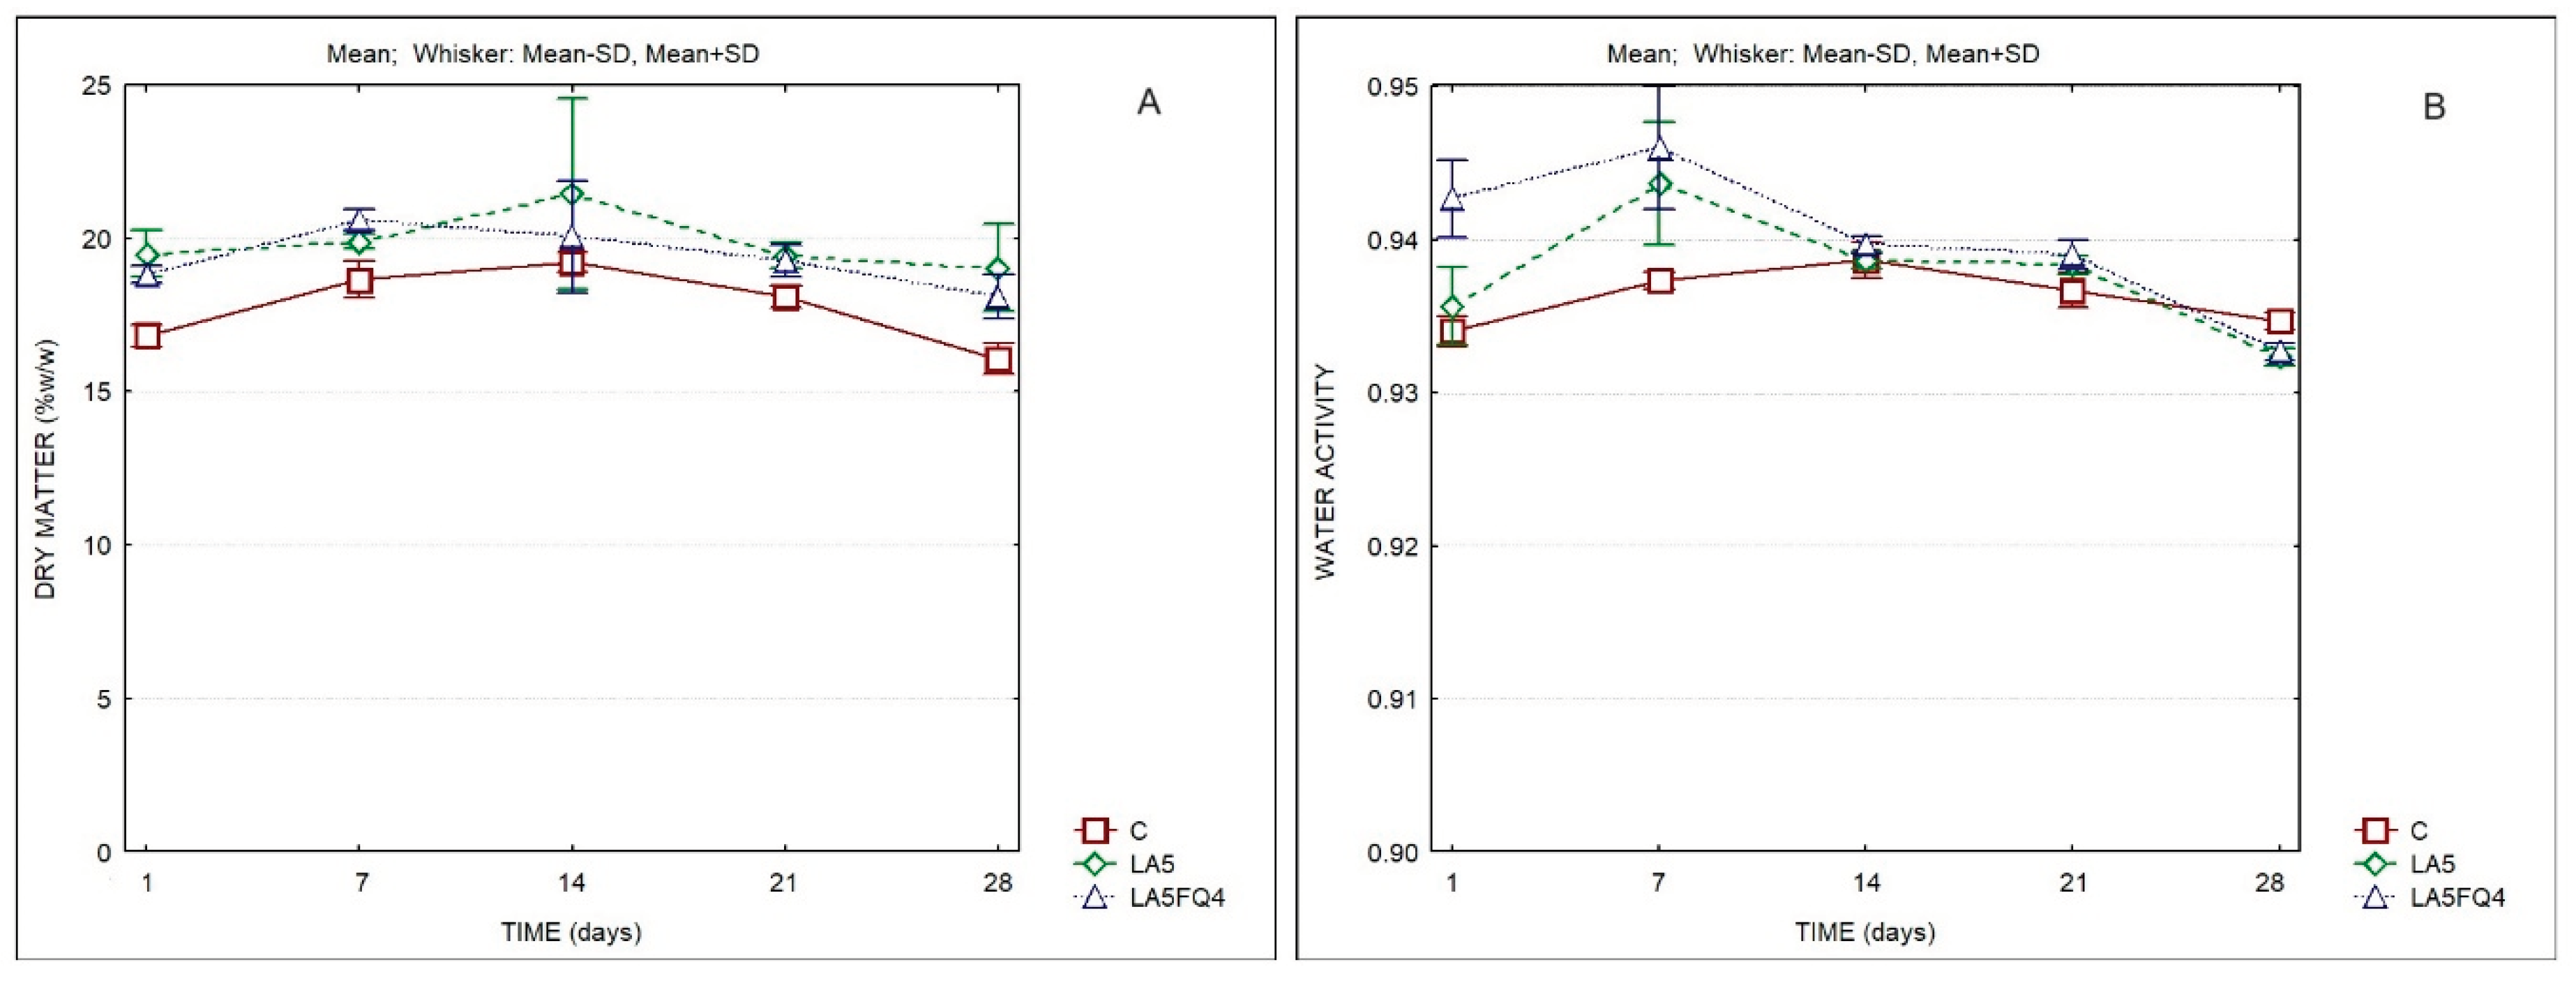
The evolution of the dry matter and of the water activity of the products is presented in
Figure 1. Significant differences were observed with regard to the evolution of the dry matter, either between products, or for the same product at different days of storage. The samples LA5 and LA5FQ4 presented slightly higher solids content when compared to the control, except at the 14th day of storage. However, the two factor Anova did not indicate differences resulting from the interaction of factors. Differences were also observed regarding the water activity of whey cheese samples, chiefly during the first 7 days of storage (
Table S1).
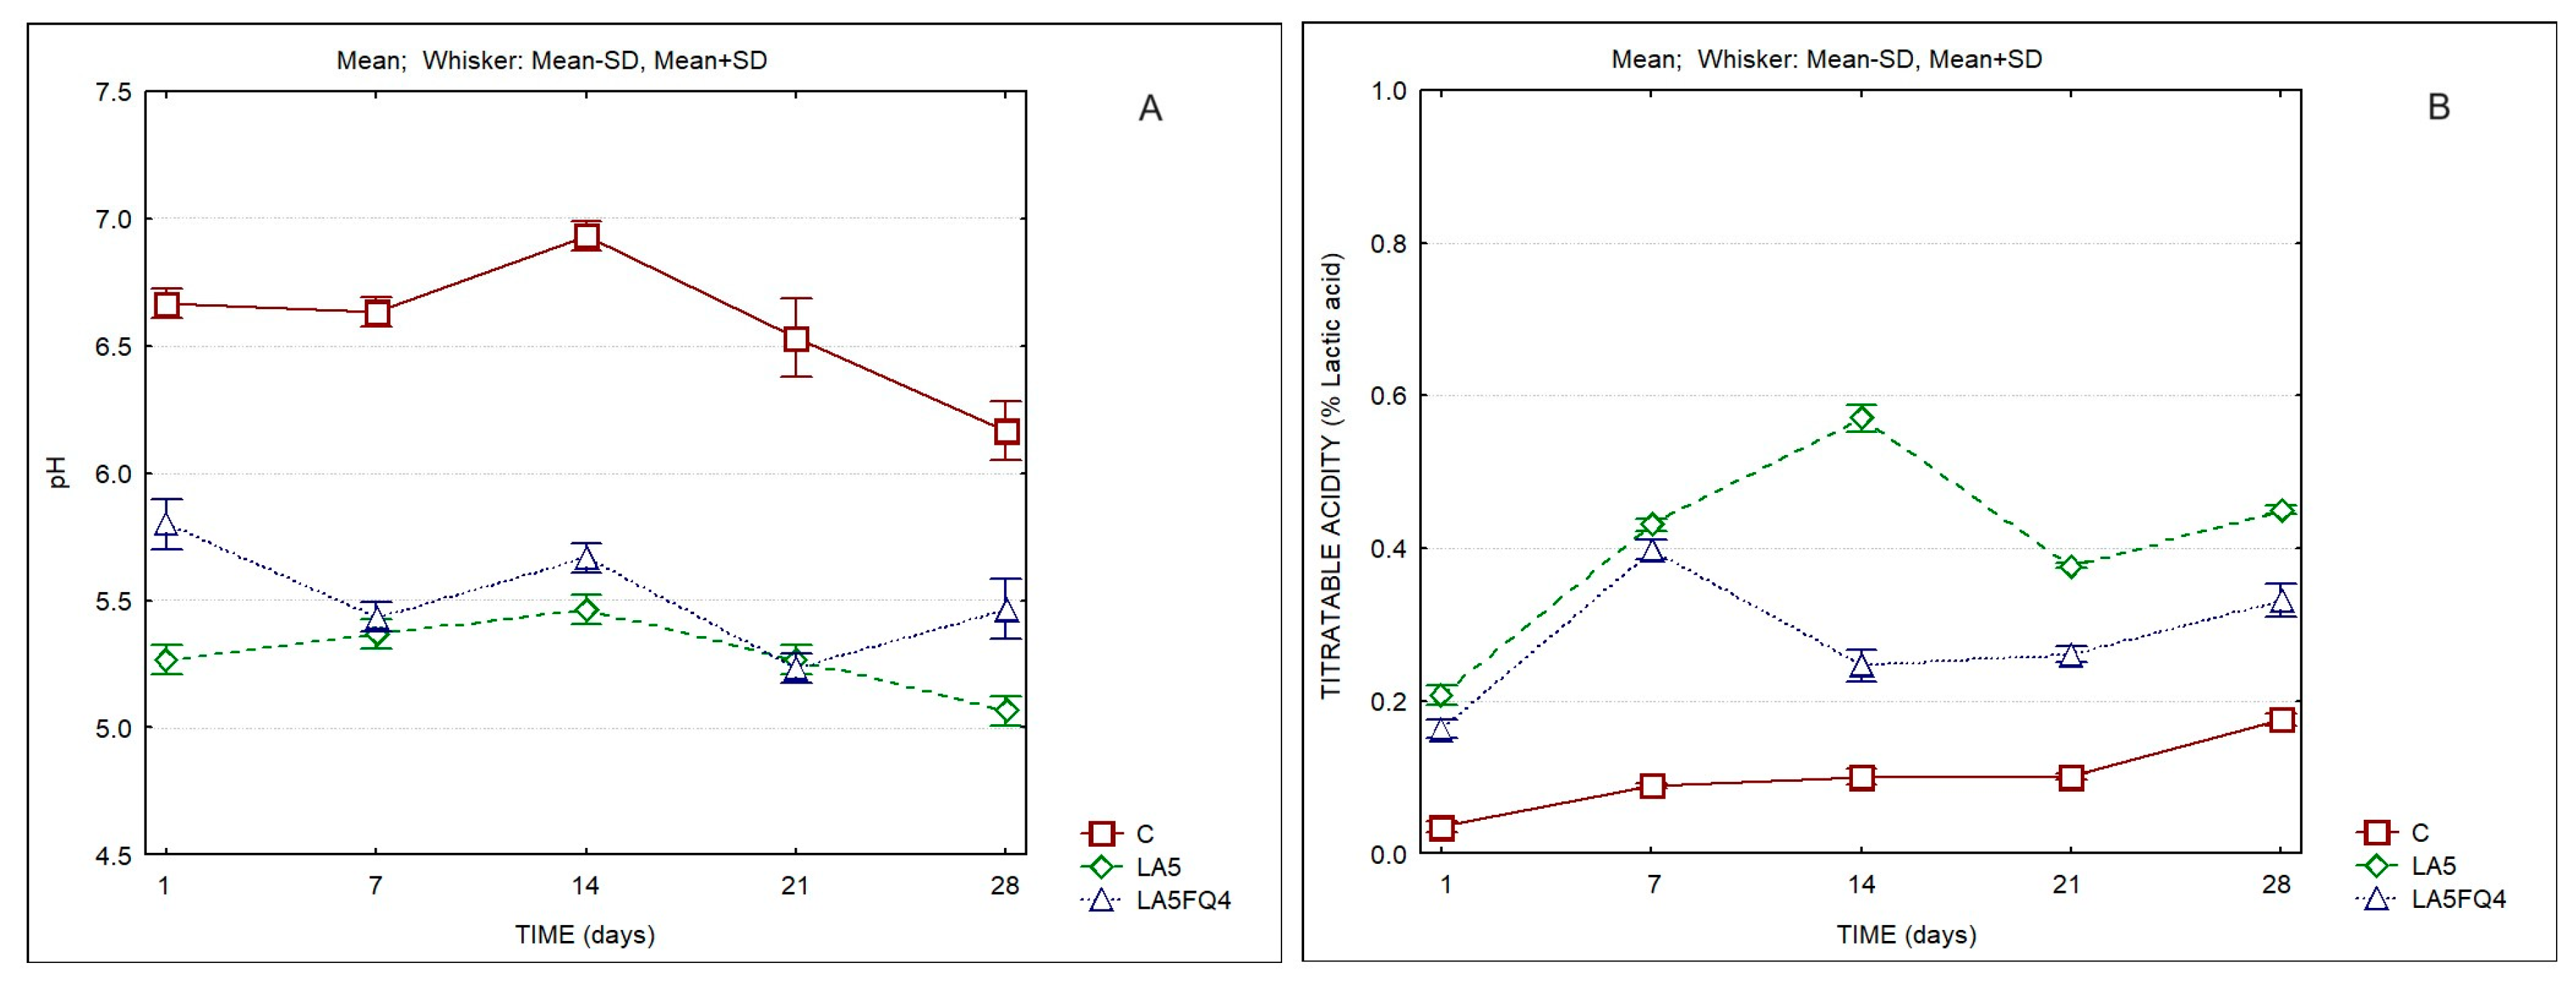
Significant differences were also observed regarding the pH and titratable acidity (
Figure 2,
Table 2 and
Table S1). As expected, the products with added cultures presented a lower pH and a higher titratable acidity when compared to the control. The sample LA5 presented the lowest pH and the highest titratable acidity. LA5FQ4 presented intermediate values (pH 5.47 and TA 0.33% lactic acid at the end of storage). These values most probably played an important role regarding the better acceptance of this sample by consumers, as it will be discussed later.
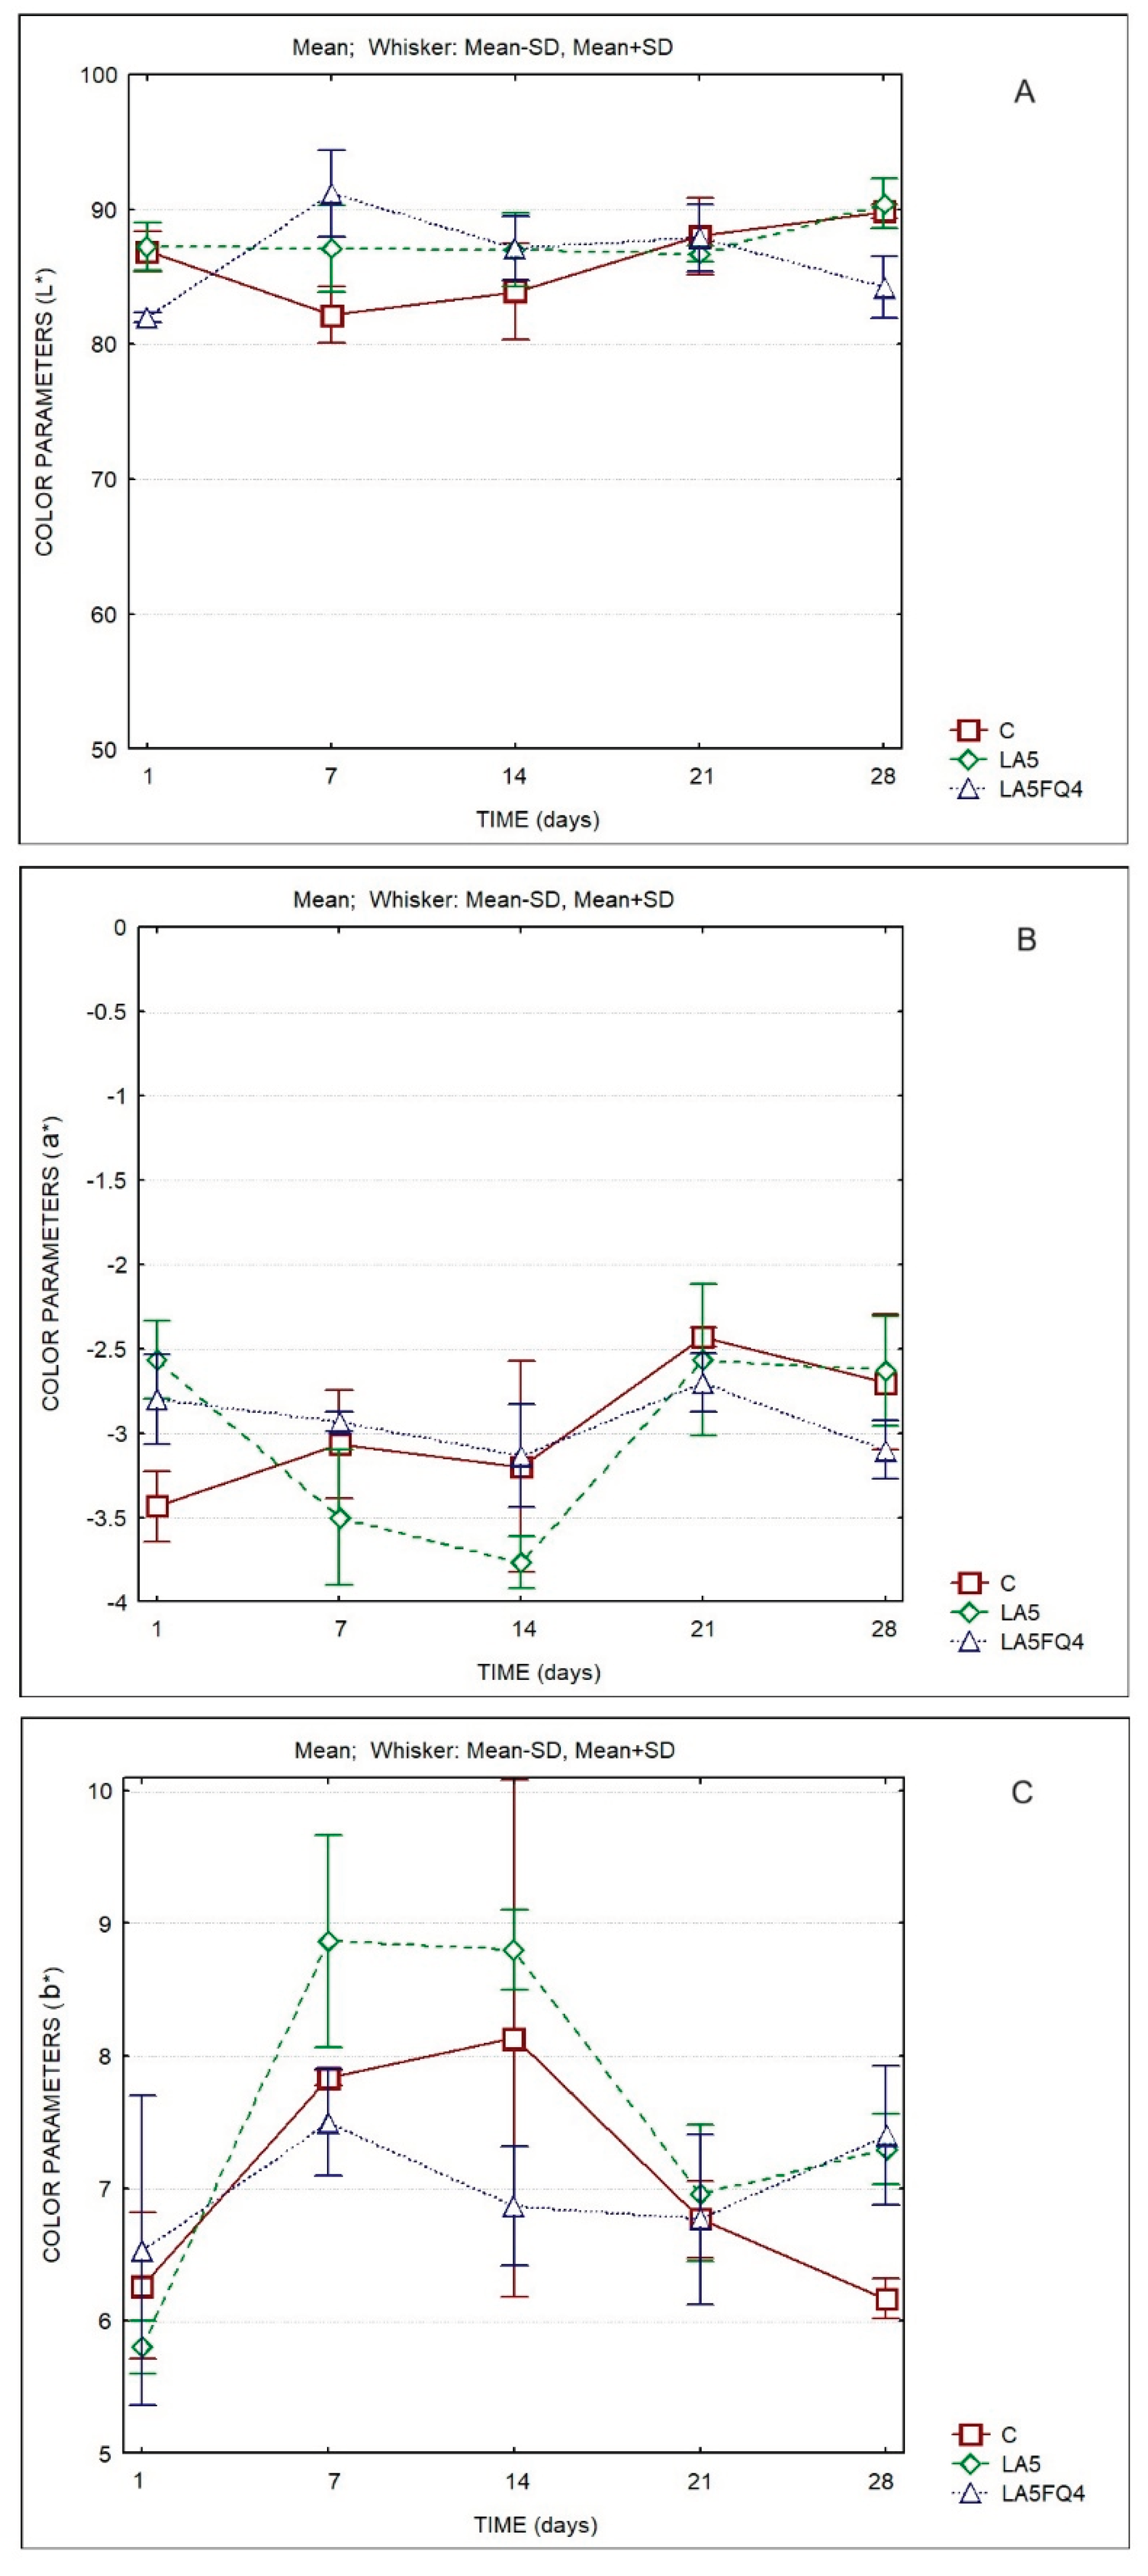
The evolution of the color parameters of the whey cheeses is shown in
Figure 3. The lightness (L*) ranged between 80 and 90 over storage. The lowest L* values were observed for sample LA5FQ4 (
Table 2S). The a* values decreased between the 1st and the 14th day, then tended to increase slightly. Conversely, the b* values increased from the 1st to the 14th day, then decreased.
A better indicator of the differences in color are the values of ΔEab* (
Table 3). It can be observed that no color differences were observed between the control and LA5, at the 1st, 21st and 28th days (values <1), while the sample LA5FQ4 was similar to the control at the 21st day of storage, being different in all other days at which were compared. Significant differences were observed for the same sample at different days of storage being more evident between the 7th and the 1st day, chiefly for the control (C) and for LA5FQ4. The sample LA5 presented lower differences between the 1st and the 7th day of storage and between the 14th and the 7th, as well as between the 21st and the 14th. In
Table 4 it can be observed that the L* parameter was not different between products (
p=0.176) and neither as a result of storage time (
p=0.101). No differences were also observed between products regarding parameters a* (
p=0.815) and b* (
p=0.087).
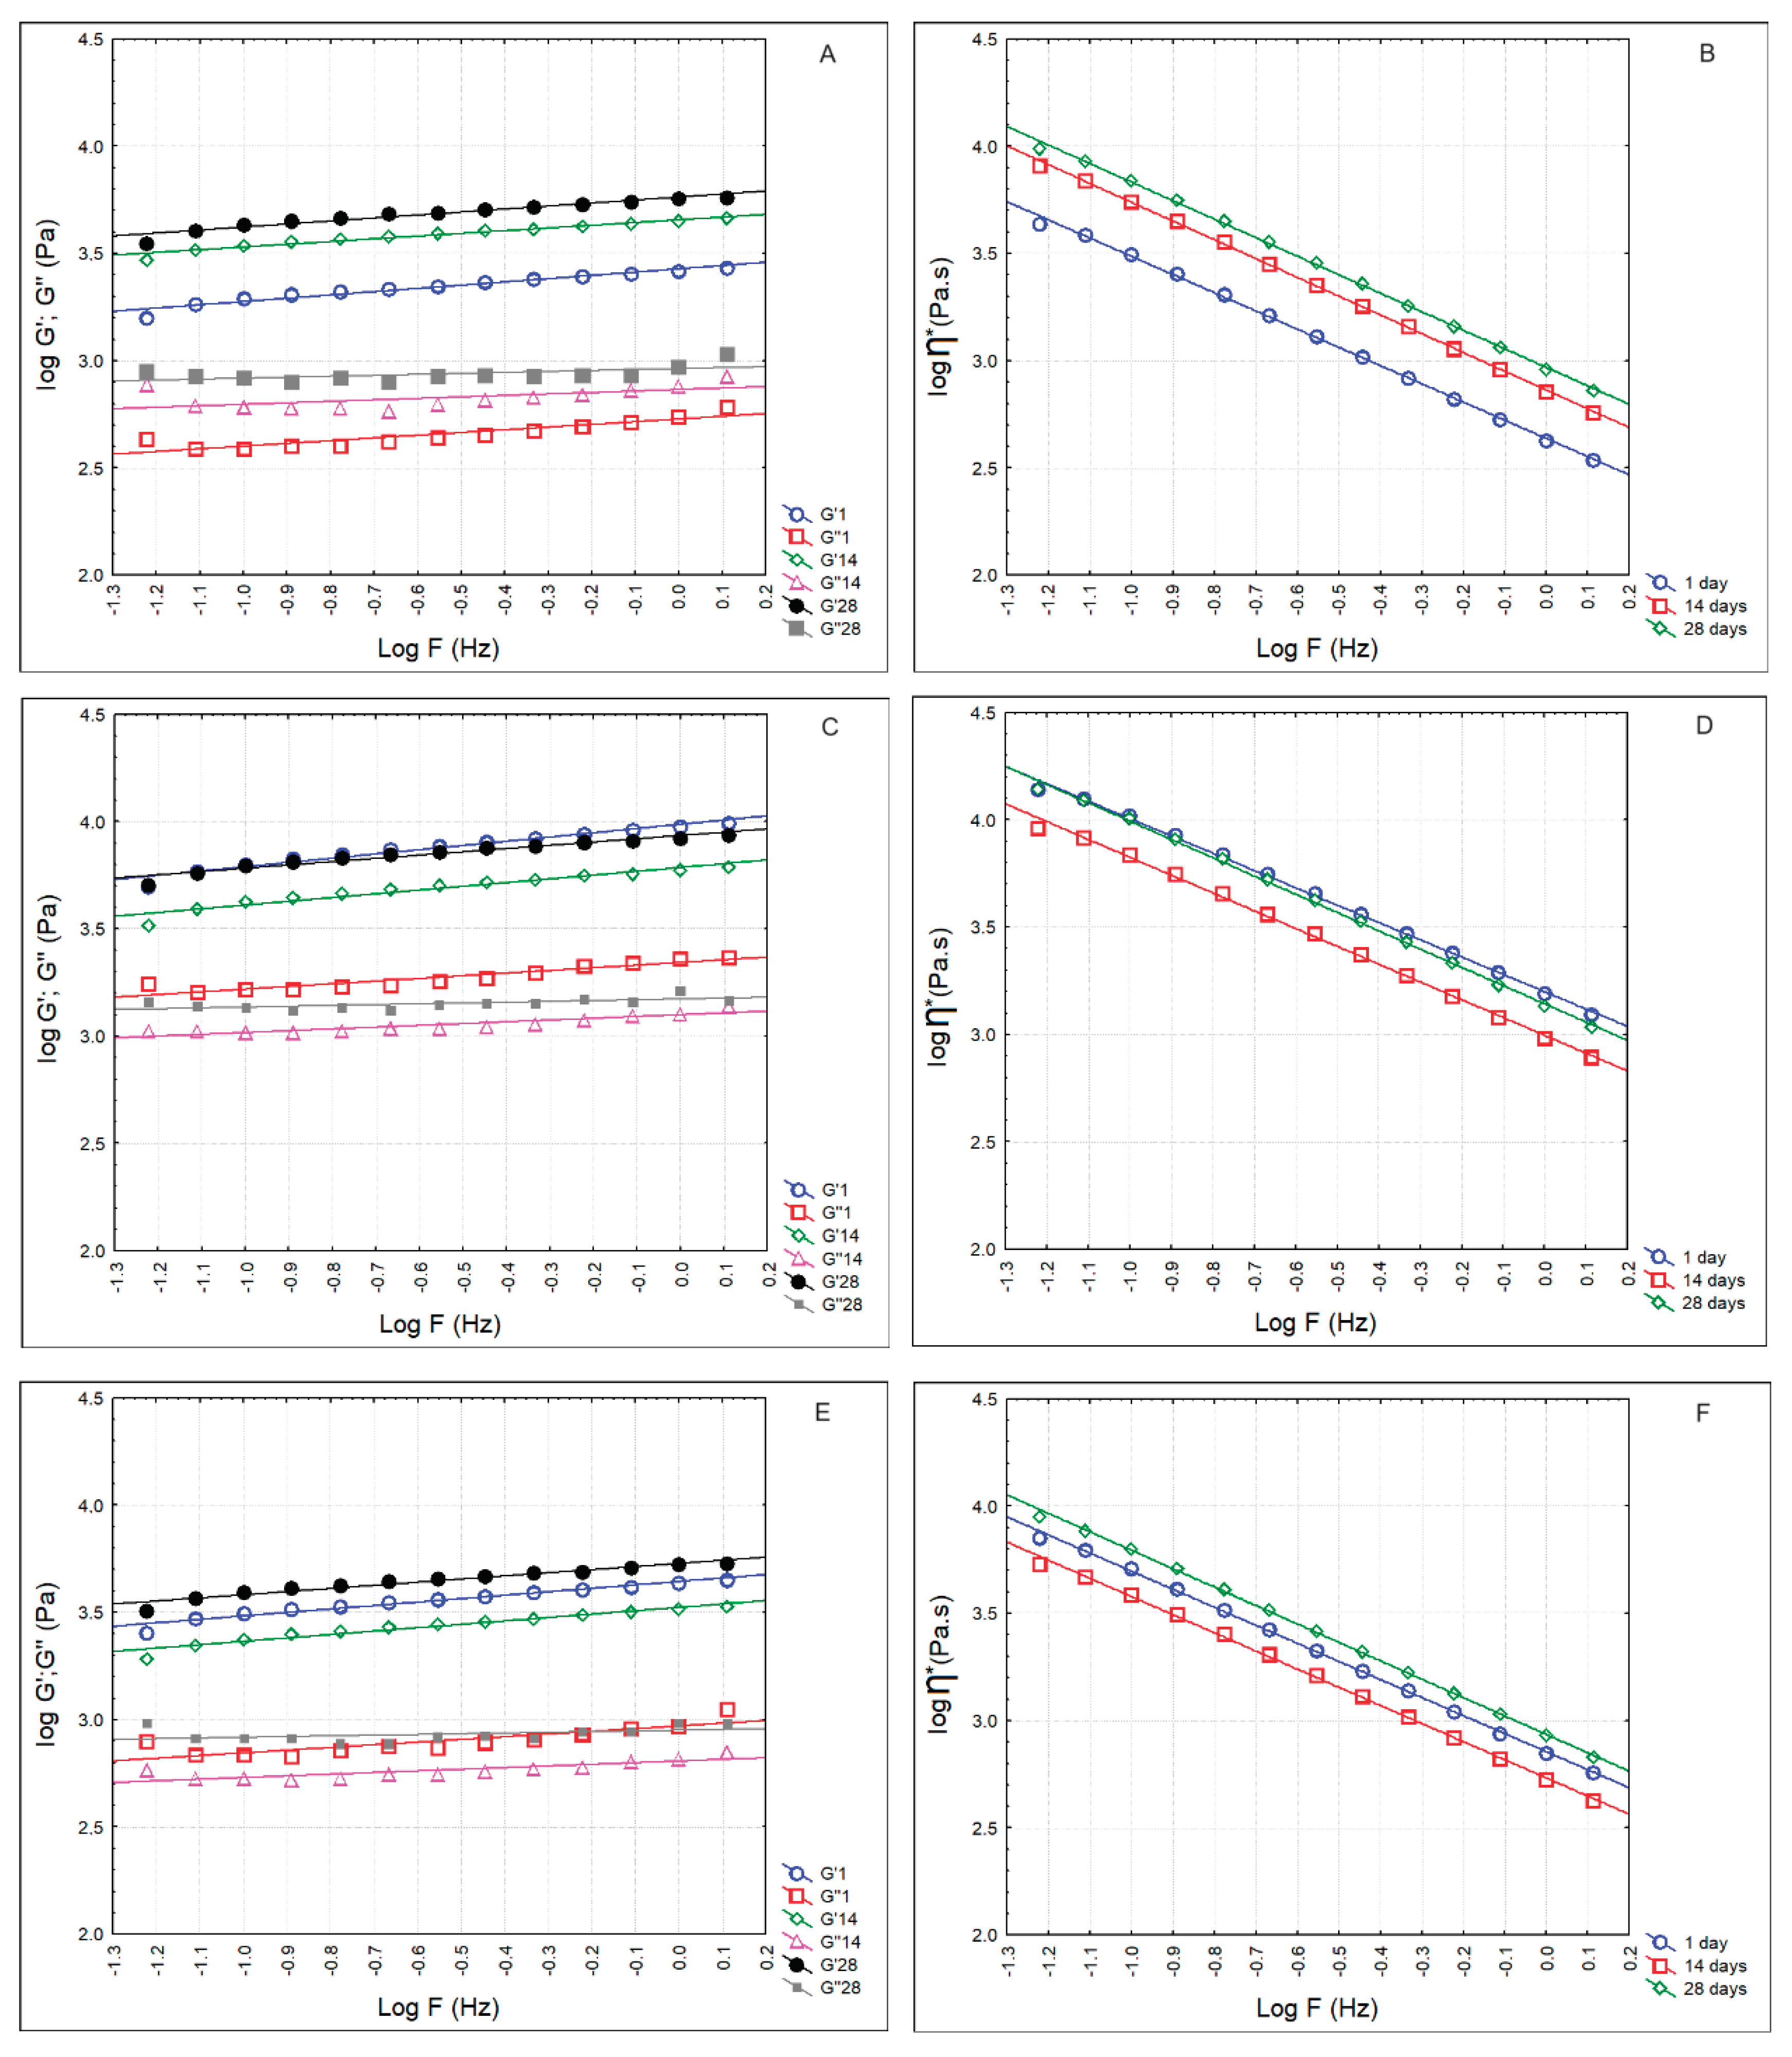
Figure 4 presents the rheological parameters of whey cheese samples at the 1st, 14th and 28th days of storage. In all cases, the elastic modulus (G’) was higher than the viscous modulus (G’’). Hence, t
he loss tangent (tan δ), which is the ratio of G″/G′, another characteristic for the evaluation of the viscoelastic behavior of the whey cheeses, was lower than 1 (C-0.187 ± 0.017; LA5-0.230 ± 0.024; LA5FQ4-0.211 ± 0.013)
. Values of tan δ < 1 indicate predominantly elastic behavior, while tan δ > 1 values indicate predominantly viscous behavior. Whey cheese samples showed a shear dependent flow behavior as the complex dynamic viscosity (η*) decreased linearly with increasing frequency on a double logarithmic scale (Figure 4 B,D,F
). Therefore, we can conclude that whey cheese samples demonstrated a non-Newtonian shear-thinning or pseudoplastic behavior. Besides, the power law parameters indicate the pseudoplastic, or
shear-thinning nature of the products (n<1). Pseudoplastic are those fluids whose behavior is time-independent and that have a lower apparent viscosity at higher shear rates. These fluids are usually solutions of large, polymeric molecules in a solvent with smaller molecules. An explanation for such behavior is that the large molecular chains tumble at random and affect large volumes of fluid under low shear, but that gradually align themselves in the direction of increasing shear and produce less resistance and, consequently, lower dynamic viscosity values. Sample LA5 presented significantly higher values for G’, G’’ and
η* over the storage period. This is evident in Table 6, that displays the calculated power law parameters.
Table 5.
Regression equations for the log/log plots of dynamic viscosity/frequency (r2 > 0.99).
Table 5.
Regression equations for the log/log plots of dynamic viscosity/frequency (r2 > 0.99).
| Products/Storage Time |
C |
LA5 |
LA5FQ4 |
| 1 day |
y = 2.637 – 0.849*x |
y = 3.200 – 0.808*x |
y = 2.855 – 0.842*x |
| 14 days |
y = 2.863 – 0.876*x |
y = 2.996 – 0.830*x |
y = 2.733 – 0.846*x |
| 28 days |
y = 2.969 – 0.864*x |
y = 3.143 – 0.852*x |
y = 2.936 – 0.859*x |
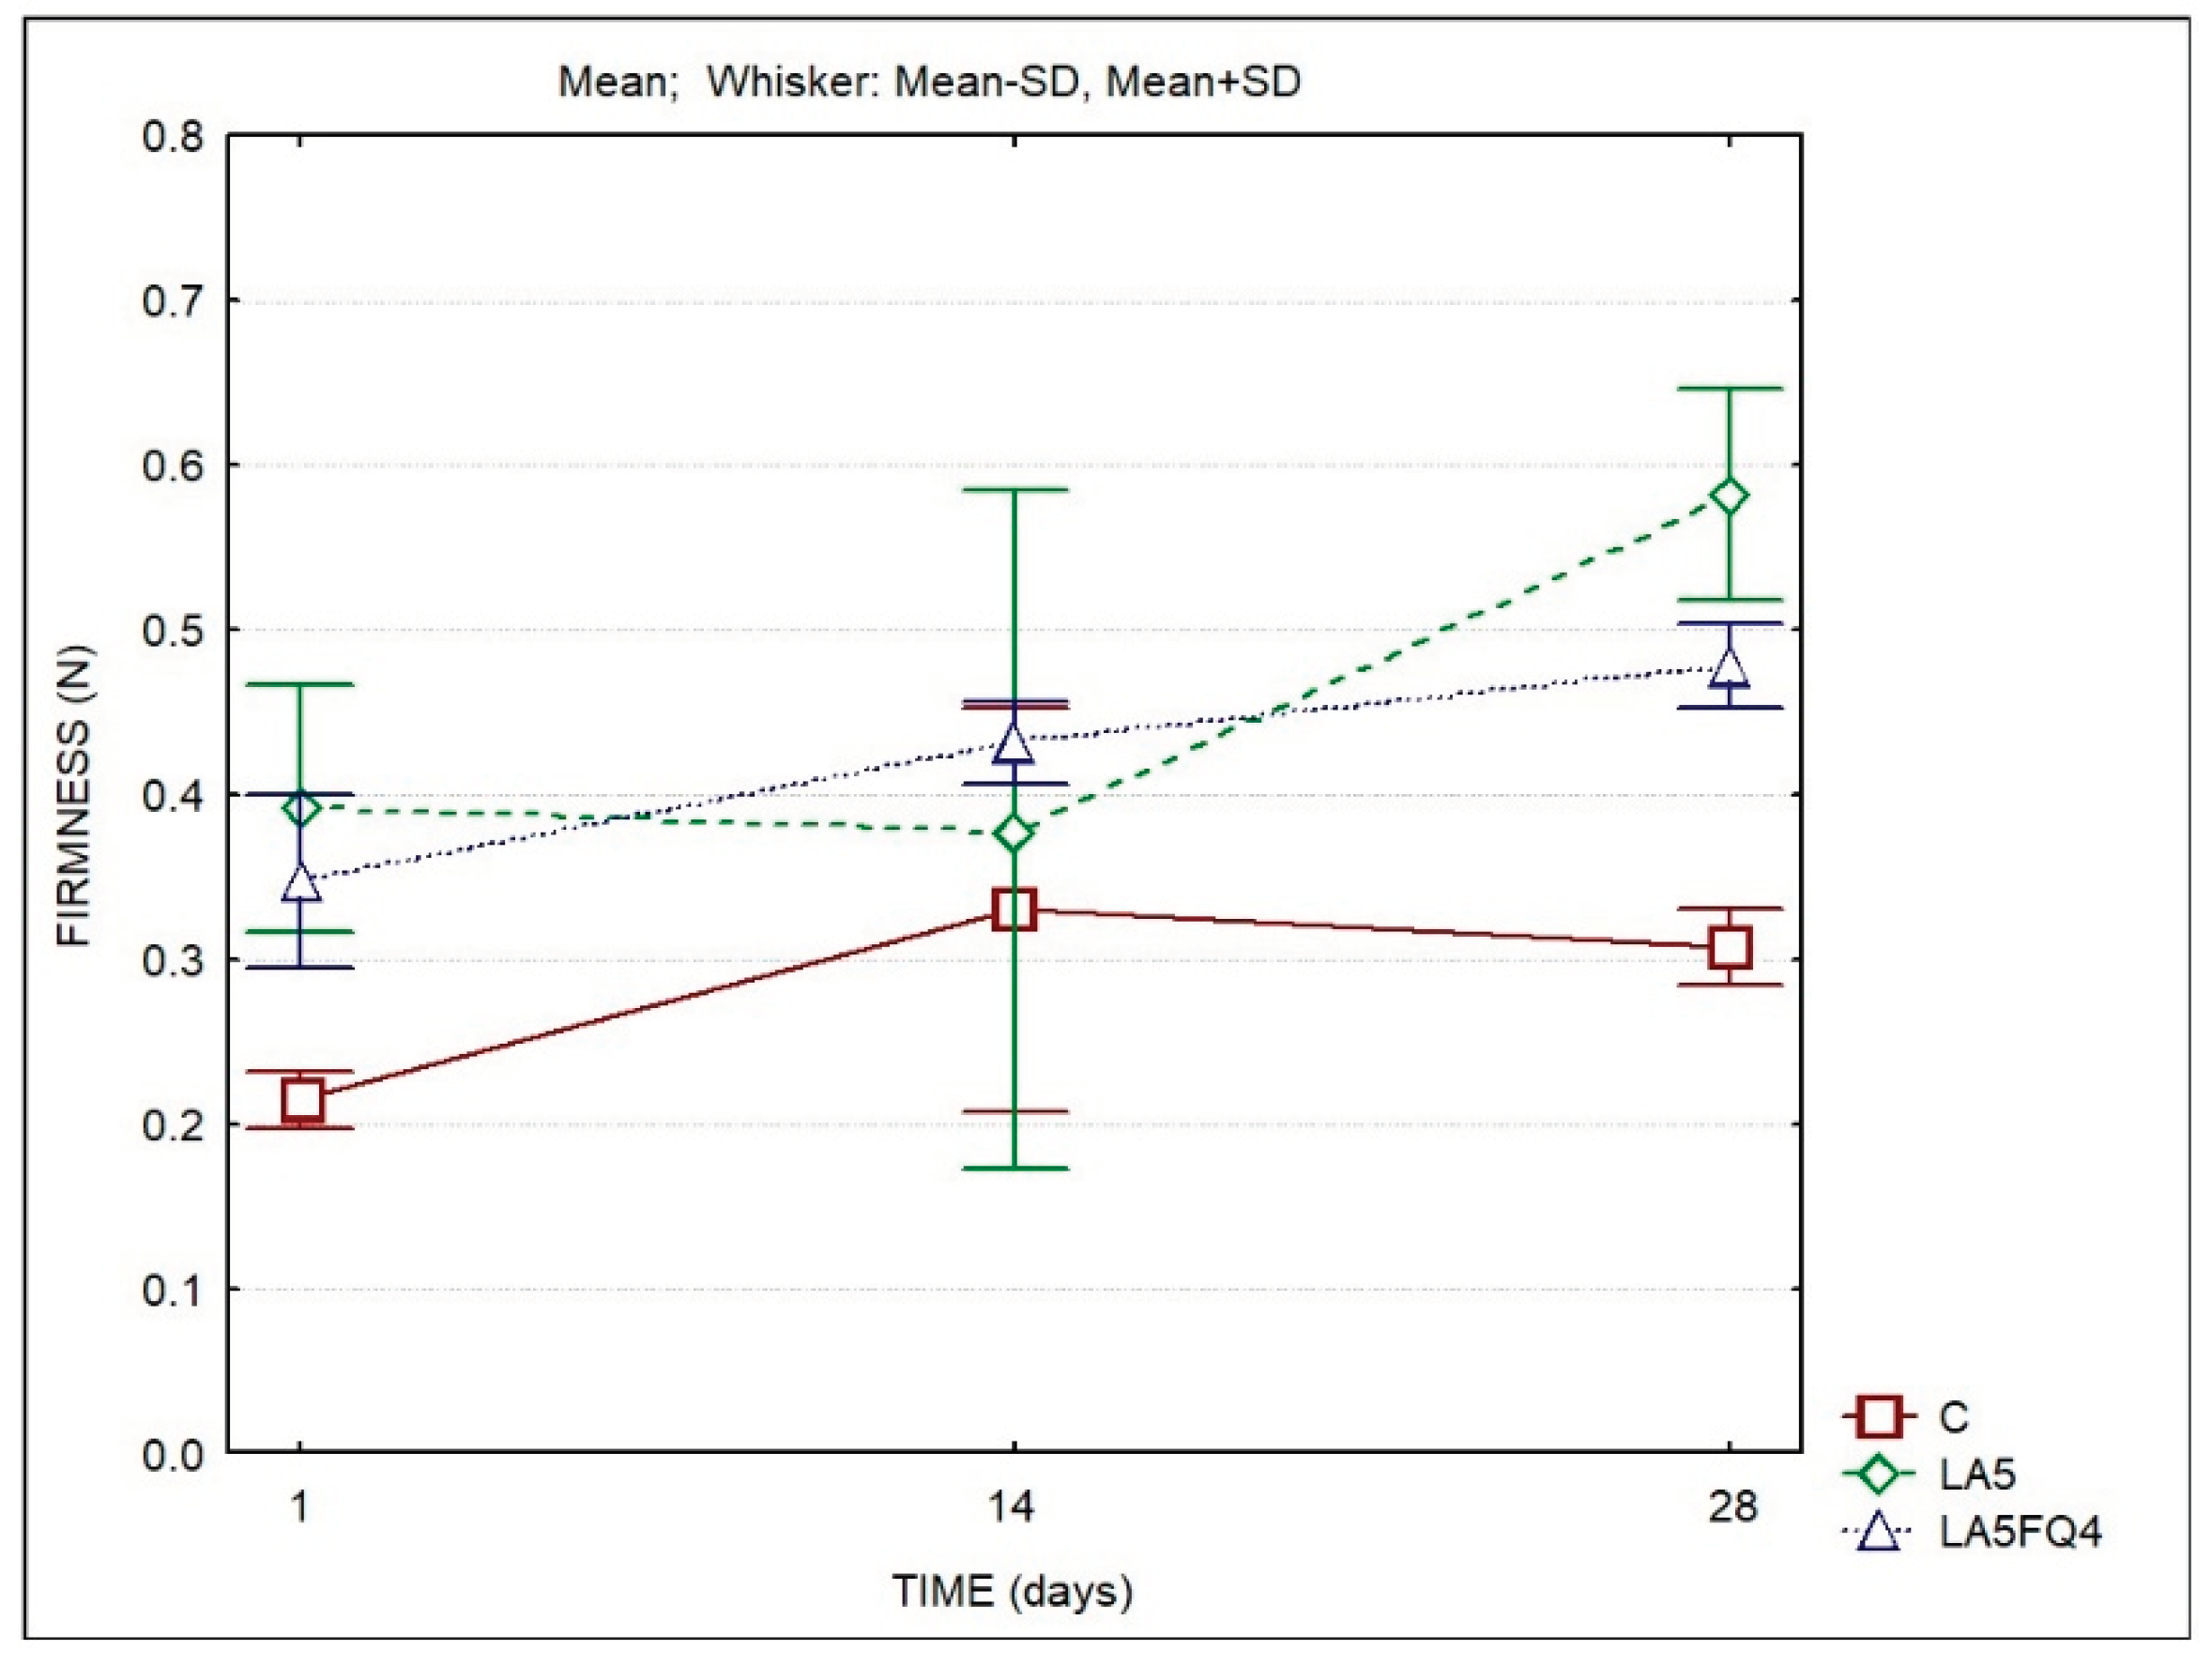
The firmness of the samples was also determined using a texturometer. The determined values agree with the rheological parameters obtained with the rheometer. The samples with added cultures were firmer when compared to the control all over the storage period. These differences were more marked at the beginning and at the end of the storage period. Sample LA5 presented the highest values by the end of storage.
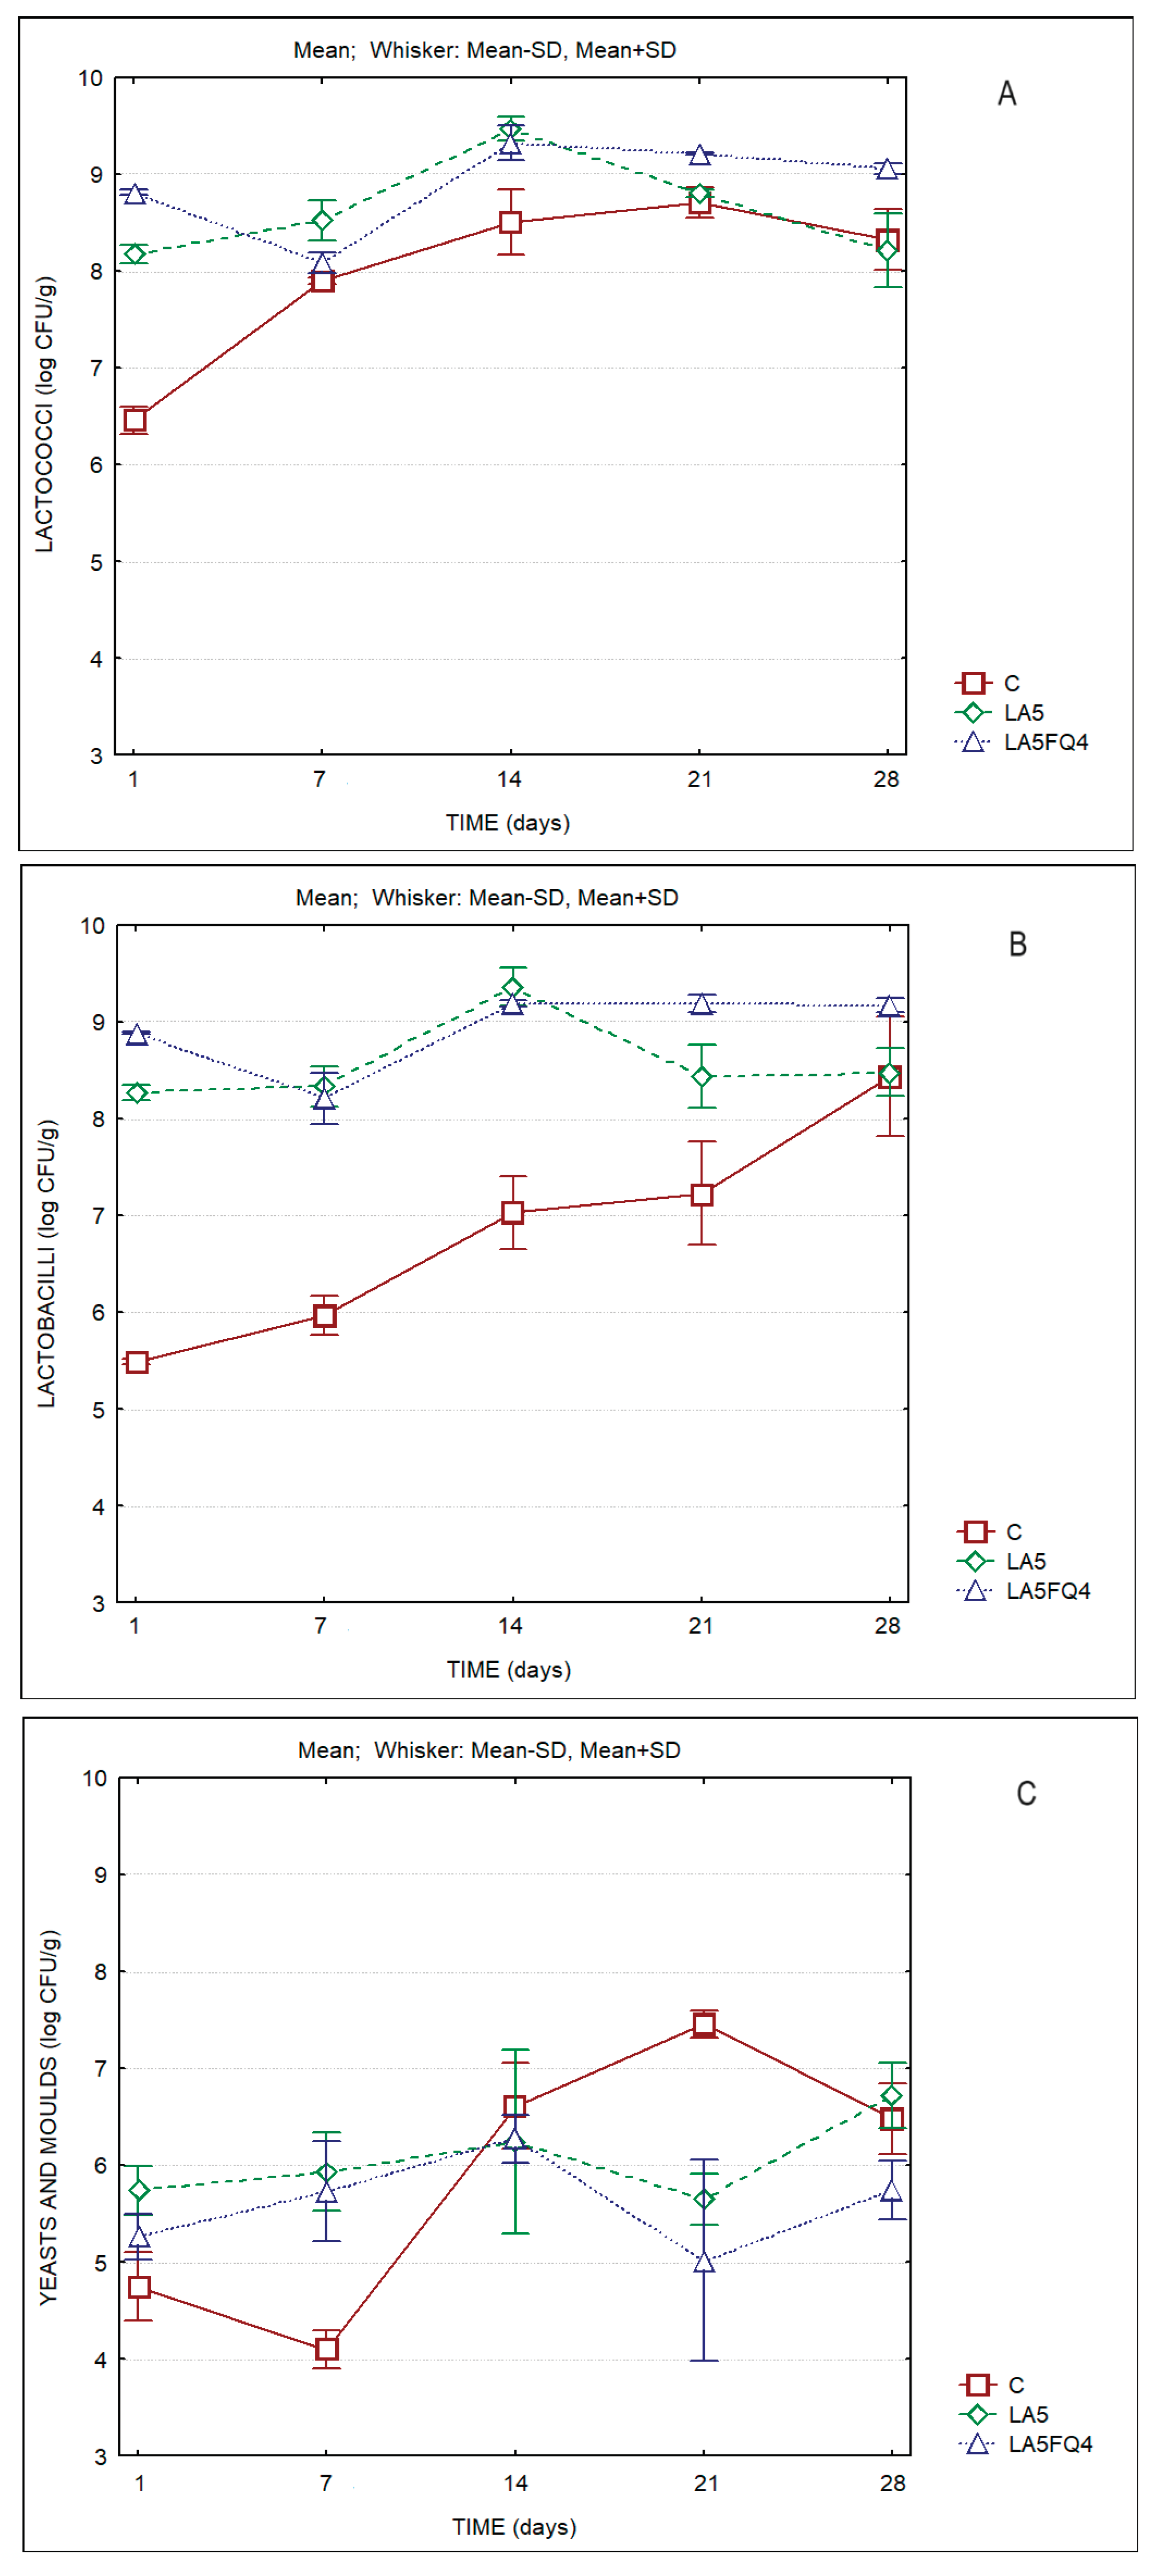
The microbiological characteristics of the whey cheeses are displayed in
Figure 6. Lactobacilli and lactococci counts are of the order of log 8-9 CFU/g for the products with added cultures. The control sample presented levels of lactococci and lactobacilli of ca. of 6.5 and 5.5 log CFU/g respectively, at the beginning of storage, but their counts increased steadily towards the end of storage (to ca. log 8 CFU/g). It is worth mention the lower levels of yeasts and moulds detected on the sample with the protective culture (LA5FQ4), that by the end of storage presented counts one log cycle lower than C and LA5. Hence, it is evident the beneficial impact of the protective culture (FQ4™) on the shelf life of the product.
Table 5 presents the results of the two-way Anova test and clearly indicates the significant differences in the microbiota of whey cheeses, either between products and as a result of storage time.
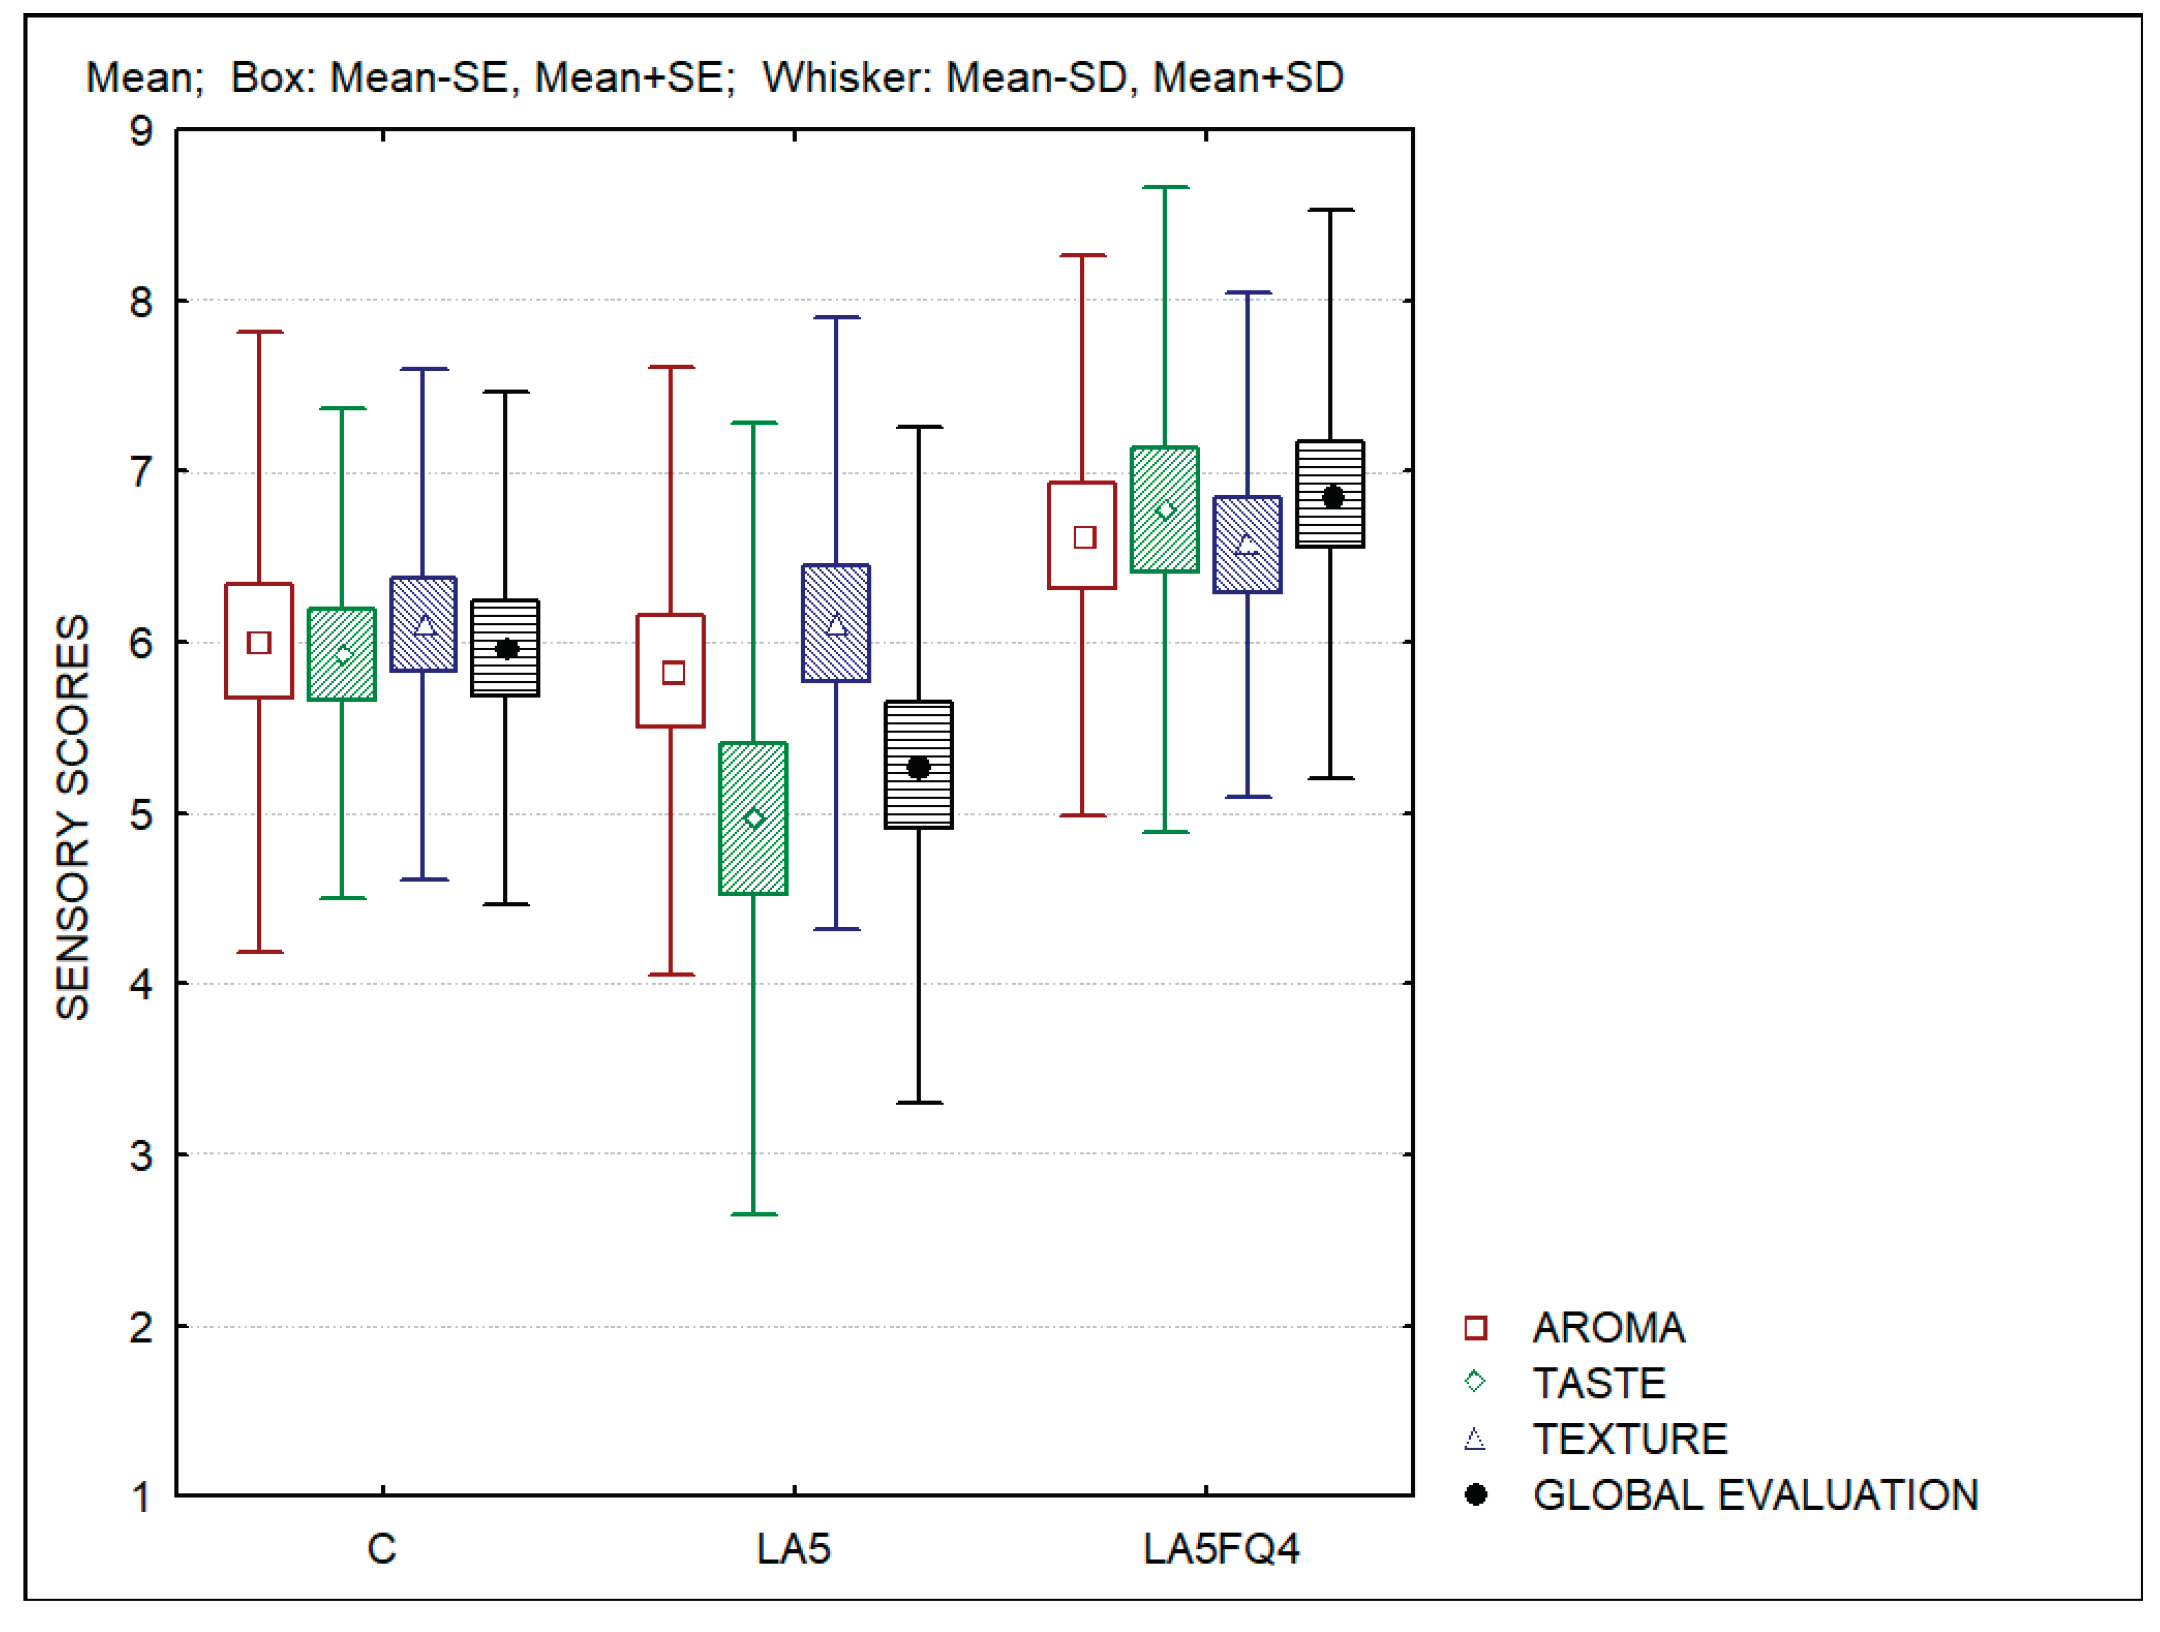
Figure 7 presents the results of the sensory evaluation of the whey cheese samples. Significant differences were observed regarding the taste (
p=0.0031), and the global evaluation (
p=0.0032). No differences were observed for the aroma (
p=0.1963) and for the texture (
p=0.4455) of the products. Whey cheese containing probiotics (LA5) obtained lower scores for the taste and for the global evaluation, while the sample LA5FQ4 obtained the highest scores regarding all parameters evaluated. The ranking test also differentiated this sample in comparison with the control (C) and LA5 which were ranked 2nd and 3rd respectively. The higher acidity of sample LA5 was the reason for its lower acceptance.
4. Discussion
Whey cheeses showed lower values of dry matter, protein and fat than those observed in a previous work [
11], in which, whey cheeses with added fermented cream as the vehicle for probiotics presented a higher level of total solids (22–25 % w/w) protein (33–36%, dry basis) and fat (30–33% dry basis). Most probably, these differences result from the type of product used to pre-incubate the cultures (cream). Garcia and coworkers prepared goat’s probiotic whey cheeses using a similar approach and reported higher values of dry matter (25-27%), but lower average values for fat (25.91 ± 4.05 %, dry basis) and protein (43.18 ± 1.96 %, dry basis) contents [
6].
The color values were different to those reported in whey cheeses with kefir or probiotics [
11] where the values of L* were higher (between 94 and 96), a* values were lower (between -3.0 and -3.5) and b* values were higher (between 8 and 9). We have not found studies about the effect of inclusion of probiotic bacteria in the color of WC.
Regarding the rheological properties, the whey cheeses with added cultures were firmer when compared to the control products. On the contrary, Pires et al. [
11] observed that the addition of probiotics and kefir caused decreases in the elastic modulus (G’) of the whey cheeses. They indicated that the cultures used (
Bifidobacterium spp. and a commercial kefir culture) could weaken the protein structure. In the present study, the cultures of
Lactobacillus acidophilus,
Lactobacillus paracasei and
Lactobacillus rhamnosus used did not affect the protein structure. On the contrary, the whey cheeses with
Lactobacillus acidophilus showed higher firmness. Madureira et al. [
30,
32] studied the rheological characteristic of whey cheeses manufactured with probiotic bacteria
Lactobacillus casei [
30] or
Lactobacillus casei and
Bifidobacterium animalis [
32]. They reported that in all the whey cheeses, the elastic modulus (G’) was higher than viscous modulus (G’’) typical of solid viscoelastic foods. They also observed, as in our study, that the probiotic whey cheeses were firmer, more elastic and more viscous than non inoculated whey cheeses. They indicated that this was due to the lower pH of these cheeses indicating that there is a positive correlation between acidity and hardness of cheeses and that higher acidity values lead to firmer matrices. In the cheeses of our study, the whey cheeses with added cultures had higher titratable acidity and lower pH than control whey cheeses and, consequently, presented higher firmness; LA5 whey cheeses showed the highest firmness values by the end of storage and had the lowest pH.
Madureira et al. [
30,
32] also indicated that higher acidity values affected negatively the sensory acceptance of probiotic whey cheeses. In the present study, despite LA5FQ4 whey cheeses had higher acidity than the control whey cheeses, they obtained higher sensorial valoration. It was also reported that whey cheeses inoculated with cultures of
Lactobacillus spp. were reported to have better sensory scores than whey cheeses with Bifidobacterium spp. due to the production of acetic acid by the latter, which has a negative effect in sensorial evaluation [
32].
Results for viable cell counts of goat’s probiotic whey cheeses (containing
Lactobacillus rhamnosus and
Bifidobacterium animalis) presented an average of log 8.24 CFU/g on the final day of storage [
6], whereas in the present study microbial counts of lactic acid bacteria (LAB) were of the order of log 9 CFU/g for LA5FQ4 and of log 8 CFU/g for LA5. Although the concentration of probiotic microorganisms that provides health benefits is usually strain and host-dependent, levels equal to or greater than log 7 CFU/g have been suggested as the minimum concentration for a positive effect of probiotic bacteria [
43,
44]. Hence, it can be concluded that, even at the end of storage, probiotic counts of LA5 and of LA5FQ4 are at levels that allow for that claim. It must be referred that, at the end of storage, the control sample presented values of log 8 CFU/g for LAB, but these values result from adventitious contamination and subsequent growth during storage. Whey cheeses with kefir culture or
Bifidobacterium spp. showed lower counts of lactic acid bacteria (log 7 UFC/g) after 21 days of storage [
11]. These results may indicate that the cultures used in the present study have a better adaptation to the whey cheese matrix. Besides, Pires et al. [
11] did not observe reduction in the counts of yeasts and moulds in the whey cheeses with
Bifidobacterium spp. and commercial kefir culture in relation to control whey cheeses, while in the present study, the protective culture reduced yeasts and moulds counts by one log cycle. The protective culture with
Lactobacillus paracasei and
Lactobacillus rhamnosus (together with
Lactobacillus acidophilus) showed a better effect on the shelf-life of the product than the culture with only the probiotic
Lactobacillus acidophilus.
The research of Madureira and coworkers indicated that whey cheese protected the probiotic strains during transit throughout the simulated gastrointestinal system, therefore comprising a promising carrier of those bacteria. Probiotic bacteria (
Lactobacillus casei and
Bifidobacterium animalis) added to whey cheese also showed positive effects concerning control of spoilage and pathogenic microorganisms, promoting the extension of the shelf-life of the product [
28,
31,
33]. Hence, the approach of adding probiotic or probiotic plus protective cultures to whey cheeses can increase the shelf-life of whey cheeses while providing benefitial health effects to consumers.
5. Conclusions
The probiotic whey cheeses (with Lactobacillus acidophilus and with a protective culture containing Lactobacillus paracasei and Lactobacillus rhamnosus) showed the lowest levels of yeasts and moulds at the end of the storage. Despite these probiotic whey cheeses showed some differences (lower pH, higher titratable and firmer texture) in relation to control whey cheeses, the one with probiotic plus bioprotective culture had a better global sensory evaluation. So, the addition of protective cultures could be very useful to prolong the shelf-life of whey cheeses while improving the sensory valoration of whey cheeses while providing the health benefits associated to probiotic’s consumption.
Supplementary Materials
The following supporting information can be downloaded at the website of this paper posted on Preprints.org, Table S1. Physicochemical parameters of whey cheese samples. Average values and standard deviation (±). Table S2. CIEL*a*b* parameters of whey cheese samples. Average values and standard deviation (±). Table S3. Table S4. Microbiological counts of whey cheese samples (log CFU/g). Average values and standard deviation (±).
Author Contributions
Conceptualization, C.P., A.P. O.D., A.C.; methodology, C.P., A.P., O.D., A.C.; validation, C.P., K.S., O.D., A.C.; investigation, A.P., H.P., A.B., D.G.; resources, C.P.; data curation, C.P., O.D., A.C., K.S.; writing—original draft preparation, A.P., C.P., O.D., A.C.; writing—review and editing, C.P, O.D., A.C., K.S.; supervision, C.P.; project administration, C.P.; funding acquisition, C.P. All authors have read and agreed to the published version of the manuscript.
Funding
This research was supported by the Foundation for Science and Technology (FCT, Portugal) through national funds provided to the research unit Research Centre for Natural Resources, Environment, and Society—CERNAS (
https://doi.org/10.54499/UIDP/00681/2020, accessed on 10 February 2024).
Data Availability Statement
Data from physicochemical and colour parameters and microbiological counts are available in the manuscript and supplementary materials. Further inquiries can be directed to the corresponding author.
Conflicts of Interest
The authors declare no conflict of interest.
References
- Pintado, M.E.; Lopes da Silva, J.A.; Malcata, F.X. Characterization of Requeijão and technological optimization of its manufacturing process. J. Food Eng. 1996, 30, 363–376. [Google Scholar] [CrossRef]
- Pintado, M.E.; Malcata, F.X. Characterization of whey cheese packaged under vacuum. J. Food Prot. 2000, 63, 216–221. [Google Scholar] [CrossRef] [PubMed]
- Mollea, C.; Marmo, L.; Bosco, F. Valorisation of cheese whey, a by-product from the dairy industry. In Food Industry; IntechOpen: London, UK, 2013; pp. 549–588. [Google Scholar]
- Pires, A.F.; Marnotes, N.G.; Rubio, O.D.; Garcia, A.C.; Pereira, C. D. Dairy by-products: a review on the valorization of whey and second cheese whey. Foods 2021, 10, 1067. [Google Scholar] [CrossRef]
- Pintado, M.E.; Macedo, A.C.; Malcata, F.X. Review: technology, chemistry and microbiology of whey cheeses. Food Sci. Technol. Int. 2001, 7, 105–116. [Google Scholar] [CrossRef]
- Garcia, M.M.E.; Pereira, C.J.D.; Freitas, A.C.; Gomes, A.M.P.; Pintado, M.M.E. Development and characterization of a novel sustainable probiotic goat whey cheese containing second cheese whey powder and stabilized with thyme essential oil and sodium citrate. Foods 2022, 11, 2698. [Google Scholar] [CrossRef] [PubMed]
- Pereira, C.D.; Diaz, O.; Cobos, A. Impact of ovine whey protein concentrates and clarification by-products on the yield and quality of whey cheese. Food Technol. Biotechnol. 2007, 45, 32–37. [Google Scholar]
- Maragkoudakis, P.; Vendramin, V.; Bovo, B.; Treu, L.; Corich, V.; Giacomini, A. Potential use of scotta, the by-product of the ricotta cheese manufacturing process, for the production of fermented drinks. J. Dairy Res. 2016, 83, 104–108. [Google Scholar] [CrossRef]
- Henriques, M.; Gomes, D.; Pereira, C. Liquid whey protein concentrates produced by ultrafiltration as primary raw materials for thermal dairy gels. Food Technol. Biotechnol. 2017, 55, 454–463. [Google Scholar] [CrossRef]
- Henriques, M.H.F.; Gomes, D.; Borges, A.R.; Pereira, C.J.D. Liquid whey protein concentrates as primary raw material for acid dairy gels. Food Sci. Tech. 2019, 40, 361–369. [Google Scholar] [CrossRef]
- Pires, A.F.; Marnotes, N.G.; Bella, A.; Viegas, J.; Gomes, D.M.; Henriques, M.H.F.; Pereira, C.J.D. Use of ultrafiltrated cow’s whey for the production of whey cheese with Kefir or probiotics. J. Sci. Food Agr. 2020, 101, 555–563. [Google Scholar] [CrossRef]
- Marnotes, N.G.; Pires, A.F.; Díaz, O.; Cobos, A.; Pereira, C.D. Sheep’s and goat’s frozen yoghurts produced with ultrafiltrated whey concentrates. Appl. Sci. 2021, 11, 6568. [Google Scholar] [CrossRef]
- Pires, A.; Gomes, D.; Noronha, J.; Díaz, O.; Cobos, A.; Pereira, C.D. Evaluation of the characteristics of sheep’s and goat’s ice cream, produced with UF concentrated second cheese whey and different starter cultures. Foods 2022, 11, 4091. [Google Scholar] [CrossRef]
- Pires, A.; Tan, G.; Gomes, D.; Pereira-Dias, S.; Díaz, O.; Cobos, A.; Pereira, C. Application of ultrafiltration to produce sheep’s and goat’s whey-based synbiotic kefir products. Membranes 2023, 13, 473. [Google Scholar] [CrossRef]
- Monti, L.; Donati, E.; Zambrini, A.V.; Contarini, G. Application of membrane technologies to bovine Ricotta cheese exhausted whey (scotta). Int. Dairy J. 2018, 85, 121–128. [Google Scholar] [CrossRef]
- Ceren Akal, H. Transglutaminase induced whey cheese production: impact of different ratios on yield, texture, and sensory properties. Mljekarstvo 2023, 73, 225–237. [Google Scholar] [CrossRef]
- Temíz, H.; Aykut, U.; Hurşít, A.K. Shelf life of Turkish whey cheese (lor) under modified atmosphere packaging. Int. J. Dairy Technol. 2009, 62, 378–386. [Google Scholar] [CrossRef]
- Papaioannou, G.; Chouliara, I.; Karatapanis, A.E.; Kontominas, M.G.; Savvaidis, I.M. Shelf-life of a Greek whey cheese under modified atmosphere packaging. Int. Dairy J. 2007, 17, 358–364. [Google Scholar] [CrossRef]
- Irkin, R. Shelf-life of unsalted and light Lor whey cheese stored under various packaging conditions microbiological and sensory attributes. J. Food Process. Preserv. 2011, 35, 163–178. [Google Scholar] [CrossRef]
- Arvanitoyannis, I.; Kargaki, G.K.; Hadjichristodoulou, C. Effect of three MAP compositions on the physical and microbiological properties of a low-fat Greek cheese known as “Anthotyros”. Anaerobe 2011, 17, 295–297. [Google Scholar] [CrossRef] [PubMed]
- Dimitrellou, D.; Kandylis, P.; Kourkoutas, Y.; Kanellaki, M. Novel probiotic whey cheese with immobilized lactobacilli on casein. LWT 2017, 86, 627–634. [Google Scholar] [CrossRef]
- Irkin, R.; Yalcin, O. The potential use of probiotic strains lactobacillus acidophilus nrrl b 4495, Bifidobacterium bifidum nrrl b41410 in “lor whey cheese” and the effects on sensory properties. Acta Sci. Pol. Technol. Aliment. 2017, 16, 181–189. [Google Scholar] [CrossRef]
- Carrero-Puentes, S.; Fuenmayor, C.; Jiménez-Pérez, C.; Guzmán-Rodríguez, F.; Gómez-Ruiz, L.; Rodríguez-Serrano, G.; Alatorre-Santamaría, S.; García-Garibay, M.; Cruz-Guerrero, A. Development and characterization of an exopolysaccharide-functionalized acid whey cheese (requesón) using Lactobacillus delbrueckii ssp. bulgaricus. J. Food Proc. Pres. 2022, 46, e16095. [Google Scholar] [CrossRef]
- Hilmi, M.; Prastujati, A.U.; Khusna, A.; Khirzin, M.H.; Yannuarista, D. Effects add kefir grains to whey cheese on chemical and microbiological qualities. J. Ilmu-Ilmu Peternakan 2019, 29, 46–55. [Google Scholar] [CrossRef]
- Kaminarides, S.; Aktypis, A.; Koronios, G.; Massouras, T.; Papanikolaou, S. Effect of in situ produced bacteriocin thermophilin T on the microbiological and physicochemical characteristics of Myzithra whey cheese. Int. J. Dairy Technol. 2018, 71, 213–222. [Google Scholar] [CrossRef]
- Spanu, C.; Piras, F.; Mocci, A.M.; Nieddu, G.; De Santis, E.P.L.; Scarano, C. Use of Carnobacterium spp protective culture in MAP packed Ricotta fresca cheese to control pseudomonas spp. Food Microbiol. 2018, 74, 50–56. [Google Scholar] [CrossRef] [PubMed]
- Madureira, A.R.; Gião, M.S.; Pintado, M.E.; Gomes, A.M.P.; Freitas, A.C.; Malcata, F.X. Incorporation and survival of probiotic bacteria in whey cheese matrices. J. Food Sci. 2005, 70. [Google Scholar] [CrossRef]
- Madureira, A.R.; Pereira, C.I.; Truszkowska, K.; Gomes, A.M.; Pintado, M.E.; Malcata, F.X. Survival of probiotic bacteria in a whey cheese vector submitted to environmental conditions prevailing in the gastrointestinal tract. Int. Dairy J. 2005, 15, 921–927. [Google Scholar] [CrossRef]
- Madureira, A.R.; Soares, J.C.; Pintado, M.E.; Gomes, A.M.P.; Freitas, A.C.; Malcata, F.X. Sweet whey cheese matrices inoculated with the probiotic strain Lactobacillus paracasei LAFTI® L26. Dairy Sci. Tech. 2008, 88, 649–665. [Google Scholar] [CrossRef]
- Madureira, A.R.; Brandão, T.; Gomes, A.M.; Pintado, M.E.; Malcata, F.X. Technological optimization of manufacture of probiotic whey cheese matrices. J. Food Sci. 2011, 76. [Google Scholar] [CrossRef]
- Madureira, A.R.; Pintado, M.E.; Gomes, A.M.P.; Malcata, F.X. Incorporation of probiotic bacteria in whey cheese: Decreasing the risk of microbial contamination. J. Food Prot. 2011, 74, 1194–1199. [Google Scholar] [CrossRef]
- Madureira, A.R.; Pintado, A.I.; Gomes, A.M.; Pintado, M.E.; Malcata, F.X. Rheological, textural and microstructural features of probiotic whey cheeses. LWT 2011, 44, 75–81. [Google Scholar] [CrossRef]
- Madureira, A.R.; Amorim, M.; Gomes, A.M.; Pintado, M.E.; Malcata, F.X. Protective effect of whey cheese matrix on probiotic strains exposed to simulated gastrointestinal conditions. Food Res. Int. 2011, 44, 465–470. [Google Scholar] [CrossRef]
- Madureira, A.R.; Soares, J.C.; Amorim, M.; Tavares, T.; Gomes, A.M.; Pintado, M.M.; Malcata, F.X. Bioactivity of probiotic whey cheese: Characterization of the content of peptides and organic acids. J. Sci. Food Agr. 2013, 93, 1458–1465. [Google Scholar] [CrossRef]
-
NP 703:1982; Iogurte. Determinação do resíduo seco e do resíduo seco isento de gordura. (In Portuguese). Comissão Técnica-32: Lisboa, Portugal.
-
NP 2105:1983; Queijos. Determinação do teor de matéria gorda. Técnica de Van Gulick. Processo Corrente. (In Portuguese). Direção Geral da Qualidade: Lisboa, Portugal.
- AOAC. Official Methods of Analysis of Association of Official Analytical Chemists, 16th ed.; AOAC: Rockville, MD, USA, 1997; Volume II, p. p.33. [Google Scholar]
-
NP 701:1982; Iogurte. Determinação da acidez. Comissão Técnica-32. (In Portuguese). Direção Geral da Qualidade: Lisboa, Portugal.
-
IDF 117:2003; Yoghurt-enumeration of characteristic microorganisms-colony-count technique at 37 °C. International Organization for Standardization: Geneva, Switzerland.
-
IDF 94:2004; Milk and Milk Products-Enumeration of Colony-Forming Units of Yeasts and/or Moulds—Colony-Count Technique at 25 °C. International Organization for Standardization:: Geneva, Switzerland.
- Stone, H.; Sidel, J. Sensory Evaluation Practices, 3rd ed.; Food Science and Technology; Academic Press: New York, NY, USA, 2004. [Google Scholar]
-
ISO 8587:1988; Sensory Analysis. Methodology. Ranking. Technical Committee ISO/TC 34/SC 12 Sensory Analysis. International Organization for Standardization: Geneva, Switzerland: Geneva, Switzerland.
- Tripathi, M.; Giri, S. ; Probiotic functional foods: survival of probiotics during processing and storage. J. Funct. Foods 2014, 9, 225–241. [Google Scholar] [CrossRef]
- Guarner, F.; Sanders, M.H.; Al, E. World Gastroenterology Organisation Global Guidelines, Probiotics and Prebiotics; World Gastroenterology Organisation: Milwaukee, WI, USA, 2023. [Google Scholar]
|
Disclaimer/Publisher’s Note: The statements, opinions and data contained in all publications are solely those of the individual author(s) and contributor(s) and not of MDPI and/or the editor(s). MDPI and/or the editor(s) disclaim responsibility for any injury to people or property resulting from any ideas, methods, instructions or products referred to in the content. |
© 2024 by the authors. Licensee MDPI, Basel, Switzerland. This article is an open access article distributed under the terms and conditions of the Creative Commons Attribution (CC BY) license (http://creativecommons.org/licenses/by/4.0/).
