Submitted:
12 March 2024
Posted:
13 March 2024
You are already at the latest version
Abstract
Keywords:
1. Introduction
2. Materials and Methods
2.1. Study Site and Data
2.2. Methodology
2.2.1. Variable Selection and Transformation
2.2.2. Model fitting.
2.2.3. Aggregation Level Comparison
3. Results
3.1. Variable Selection
3.2. Model Fitting and Comparison
3.3. Level Comparison
4. Discussion
Supplementary Materials
Author Contributions
Funding
Data Availability Statement
Conflicts of Interest
References
- Kurane, I. Dengue Hemorrhagic Fever with Special Emphasis on Immunopathogenesis. Comparative Immunology, Microbiology and Infectious Diseases 2007, 30, 329–340. [Google Scholar] [CrossRef]
- Dengue and Severe Dengue. Available online: https://www.who.int/news-room/fact-sheets/detail/dengue-and-severe-dengue (accessed on 28 October 2022).
- Silva, M.M.O.; Rodrigues, M.S.; Paploski, I.A.D.; Kikuti, M.; Kasper, A.M.; Cruz, J.S.; Queiroz, T.L.; Tavares, A.S.; Santana, P.M.; Araújo, J.M.G.; et al. Accuracy of Dengue Reporting by National Surveillance System, Brazil. Emerg. Infect. Dis. 2016, 22, 336–339. [Google Scholar] [CrossRef]
- Padilla, J.C.; Rojas, D.P.; Sáenz Gómez, R. Dengue en Colombia: epidemiología de la reemergencia a la hiperendemia; Primera edición en español.; Verlag nicht ermittelbar: Erscheinungsort nicht ermittelbar, 2012; ISBN 978-958-46-0661-7. [Google Scholar]
- Guha-Sapir, D.; Schimmer, B. Dengue Fever: New Paradigms for a Changing Epidemiology. Emerg Themes Epidemiol 2005, 2, 1. [Google Scholar] [CrossRef] [PubMed]
- Reiter, P.; Lathrop, S.; Bunning, M.; Biggerstaff, B.; Singer, D.; Tiwari, T.; Baber, L.; Amador, M.; Thirion, J.; Hayes, J.; et al. Texas Lifestyle Limits Transmission of Dengue Virus. Emerg. Infect. Dis. 2003, 9, 86–89. [Google Scholar] [CrossRef] [PubMed]
- Queiroz, E.R. da S.; Medronho, R. de A. Spatial Analysis of the Incidence of Dengue, Zika and Chikungunya and Socioeconomic Determinants in the City of Rio de Janeiro, Brazil. Epidemiol. Infect. 2021, 149, e188. [Google Scholar] [CrossRef]
- Alcaldía Municipal de Ibagué - Ibagué Vibra Available online:. Available online: https://ibague.gov.co/portal/seccion/contenido/index.php?type=3&cnt=53 (accessed on 28 October 2022).
- Carrasquilla, M.C.; Ortiz, M.I.; León, C.; Rondón, S.; Kulkarni, M.A.; Talbot, B.; Sander, B.; Vásquez, H.; Cordovez, J.M.; González, C.; et al. Entomological Characterization of Aedes Mosquitoes and Arbovirus Detection in Ibagué, a Colombian City with Co-Circulation of Zika, Dengue and Chikungunya Viruses. Parasites Vectors 2021, 14, 446. [Google Scholar] [CrossRef] [PubMed]
- Faruk, M.O.; Jannat, S.N.; Rahman, Md.S. Impact of Environmental Factors on the Spread of Dengue Fever in Sri Lanka. Int. J. Environ. Sci. Technol. 2022, 19, 10637–10648. [Google Scholar] [CrossRef]
- Rose, N.H.; Sylla, M.; Badolo, A.; Lutomiah, J.; Ayala, D.; Aribodor, O.B.; Ibe, N.; Akorli, J.; Otoo, S.; Mutebi, J.-P.; et al. Climate and Urbanization Drive Mosquito Preference for Humans. Current Biology 2020, 30, 3570–3579. [Google Scholar] [CrossRef]
- Lee, S.A.; Jarvis, C.I.; Edmunds, W.J.; Economou, T.; Lowe, R. Spatial Connectivity in Mosquito-Borne Disease Models: A Systematic Review of Methods and Assumptions. J. R. Soc. Interface. 2021, 18, 20210096. [Google Scholar] [CrossRef]
- Kuddus, M.A.; Tynan, E.; McBryde, E. Urbanization: A Problem for the Rich and the Poor? Public Health Rev 2020, 41, 1. [Google Scholar] [CrossRef] [PubMed]
- Vatanpour, N.; Malvandi, A.M.; Hedayati Talouki, H.; Gattinoni, P.; Scesi, L. Impact of Rapid Urbanization on the Surface Water’s Quality: A Long-Term Environmental and Physicochemical Investigation of Tajan River, Iran (2007–2017). Environ Sci Pollut Res 2020, 27, 8439–8450. [Google Scholar] [CrossRef]
- Romeo-Aznar, V.; Picinini Freitas, L.; Gonçalves Cruz, O.; King, A.A.; Pascual, M. Fine-Scale Heterogeneity in Population Density Predicts Wave Dynamics in Dengue Epidemics. Nat Commun 2022, 13, 996. [Google Scholar] [CrossRef]
- Pickett, K.E. Multilevel Analyses of Neighbourhood Socioeconomic Context and Health Outcomes: A Critical Review. Journal of Epidemiology & Community Health 2001, 55, 111–122. [Google Scholar] [CrossRef]
- Diez Roux, A.V. Investigating Neighborhood and Area Effects on Health. Am J Public Health 2001, 91, 1783–1789. [Google Scholar] [CrossRef]
- Waller, L.A.; Gotway, C.A. Applied Spatial Statistics for Public Health Data; Wiley series in probability and statistics; John Wiley & Sons: Hoboken, N.J, 2004; ISBN 978-0-471-38771-8. [Google Scholar]
- Chaix, B.; Merlo, J.; Evans, D.; Leal, C.; Havard, S. Neighbourhoods in Eco-Epidemiologic Research: Delimiting Personal Exposure Areas. A Response to Riva, Gauvin, Apparicio and Brodeur. Social Science & Medicine 2009, 69, 1306–1310. [Google Scholar] [CrossRef]
- Diez Roux, A.V.; Mair, C. Neighborhoods and Health: Neighborhoods and Health. Annals of the New York Academy of Sciences 2010, 1186, 125–145. [Google Scholar] [CrossRef] [PubMed]
- Jaya, I.G.N.M.; Folmer, H. Bayesian Spatiotemporal Mapping of Relative Dengue Disease Risk in Bandung, Indonesia. J Geogr Syst 2020, 22, 105–142. [Google Scholar] [CrossRef]
- Rotejanaprasert, C.; Ekapirat, N.; Areechokchai, D.; Maude, R.J. Bayesian Spatiotemporal Modeling with Sliding Windows to Correct Reporting Delays for Real-Time Dengue Surveillance in Thailand. Int J Health Geogr 2020, 19, 4. [Google Scholar] [CrossRef] [PubMed]
- Sani, A.; Abapihi, B.; Mukhsar, M.; Kadir, K. Relative Risk Analysis of Dengue Cases Using Convolution Extended into Spatio-Temporal Model. Journal of Applied Statistics 2015, 42, 2509–2519. [Google Scholar] [CrossRef]
- Telle, O.; Nikolay, B.; Kumar, V.; Benkimoun, S.; Pal, R.; Nagpal, B.; Paul, R.E. Social and Environmental Risk Factors for Dengue in Delhi City: A Retrospective Study. PLoS Negl Trop Dis 2021, 15, e0009024. [Google Scholar] [CrossRef] [PubMed]
- Lowe, R.; Lee, S.A.; O’Reilly, K.M.; Brady, O.J.; Bastos, L.; Carrasco-Escobar, G.; de Castro Catão, R.; Colón-González, F.J.; Barcellos, C.; Carvalho, M.S.; et al. Combined Effects of Hydrometeorological Hazards and Urbanisation on Dengue Risk in Brazil: A Spatiotemporal Modelling Study. The Lancet Planetary Health 2021, 5, e209–e219. [Google Scholar] [CrossRef]
- Desjardins, M.R.; Eastin, M.D.; Paul, R.; Casas, I.; Delmelle, E.M. Space–Time Conditional Autoregressive Modeling to Estimate Neighborhood-Level Risks for Dengue Fever in Cali, Colombia. The American Journal of Tropical Medicine and Hygiene 2020, 103, 2040–2053. [Google Scholar] [CrossRef]
- Mukhsar; Abapihi, B. ; Sani, A.; Cahyono, E.; Adam, P.; Aini Abdullah, F. Extended Convolution Model to Bayesian Spatio-Temporal for Diagnosing the DHF Endemic Locations. Journal of Interdisciplinary Mathematics 2016, 19, 233–244. [Google Scholar] [CrossRef]
- Krüger, F.; Lerch, S.; Thorarinsdottir, T.L.; Gneiting, T. Predictive Inference Based on Markov Chain Monte Carlo Output. 2016. [Google Scholar] [CrossRef]
- Speagle, J.S. A Conceptual Introduction to Markov Chain Monte Carlo Methods. 2019. [Google Scholar] [CrossRef]
- Martino, S. ; Havard Rue Implementing Approximate Bayesian Inference Using Integrated Nested Laplace Approximation: A Manual for the Inla Program 2009.
- Scott, T.W.; Morrison, A.C. Vector Dynamics and Transmission of Dengue Virus: Implications for Dengue Surveillance and Prevention Strategies. In Dengue Virus; Rothman, A.L., Ed.; Current Topics in Microbiology and Immunology; Springer Berlin Heidelberg: Berlin, Heidelberg, 2010; Volume 338, pp. 115–128. ISBN 978-3-642-02214-2. [Google Scholar]
- MANUAL DE USO DEL MARCO GEOESTADÍSTICO NACIONAL EN EL PROCESO ESTADÍSTICO; Departamento Administrativo Nacional de Estadística, 2018; p. 40.
- McMillen, D.P. Geographically Weighted Regression: The Analysis of Spatially Varying Relationships. American Journal of Agricultural Economics 2004, 86, 554–556. [Google Scholar] [CrossRef]
- Rue, H.; Martino, S.; Chopin, N. Approximate Bayesian Inference for Latent Gaussian Models by Using Integrated Nested Laplace Approximations. Journal of the Royal Statistical Society Series B: Statistical Methodology 2009, 71, 319–392. [Google Scholar] [CrossRef]
- Kyle, J.L.; Harris, E. Global Spread and Persistence of Dengue. Annu. Rev. Microbiol. 2008, 62, 71–92. [Google Scholar] [CrossRef] [PubMed]
- DANE La información del DANE en la toma de decisiones regionales: Ibagué, Colombia 2020.
- Departamento Administrativo Nacional de Estadística Geoportal DANE Available online:. Available online: https://geoportal.dane.gov.co/servicios/descarga-y-metadatos/descarga-mgn-marco-geoestadistico-nacional/ (accessed on 23 November 2022).
- Wan, Z.; Hook, S.; Hulley, G. MODIS/Terra Land Surface Temperature/Emissivity Daily L3 Global 1km SIN Grid V061 2021.
- Didan, K. MODIS/Terra Vegetation Indices 16-Day L3 Global 250m SIN Grid V061 2021.
- Funk, C.; Peterson, P.; Landsfeld, M.; Pedreros, D.; Verdin, J.; Shukla, S.; Husak, G.; Rowland, J.; Harrison, L.; Hoell, A.; et al. The Climate Hazards Infrared Precipitation with Stations—a New Environmental Record for Monitoring Extremes. Sci Data 2015, 2, 150066. [Google Scholar] [CrossRef] [PubMed]
- Kache, P.; Ruiz-Carrascal, D.; Lowe, R.; Stewart-Ibarra, A.M.; Seto, K.; Diuk-Wasser, M.; Santos-Vega, M. Climate Extremes Increase Dengue Risk along Socio-Economic and Elevation Gradients. Nature Climate Change. Under review.
- Gollini, I.; Lu, B.; Charlton, M.; Brunsdon, C.; Harris, P. GWmodel : An R Package for Exploring Spatial Heterogeneity Using Geographically Weighted Models. J. Stat. Soft. 2015, 63. [Google Scholar] [CrossRef]
- Lu, B.; Harris, P.; Charlton, M.; Brunsdon, C. The GWmodel R Package: Further Topics for Exploring Spatial Heterogeneity Using Geographically Weighted Models. Geo-spatial Information Science 2014, 17, 85–101. [Google Scholar] [CrossRef]
- Thapa, R.B.; Estoque, R.C. Geographically Weighted Regression in Geospatial Analysis. In Progress in Geospatial Analysis; Murayama, Y., Ed.; Springer Japan: Tokyo, 2012; pp. 85–96. ISBN 978-4-431-53999-5. [Google Scholar]
- Wheeler, D.C.; Páez, A. Geographically Weighted Regression. In Handbook of Applied Spatial Analysis; Fischer, M.M., Getis, A., Eds.; Springer Berlin Heidelberg: Berlin, Heidelberg, 2010; pp. 461–486. ISBN 978-3-642-03646-0. [Google Scholar]
- Cazelles, B.; Chavez, M.; Berteaux, D.; Ménard, F.; Vik, J.O.; Jenouvrier, S.; Stenseth, N.C. Wavelet Analysis of Ecological Time Series. Oecologia 2008, 156, 287–304. [Google Scholar] [CrossRef]
- Gouhier, T.C.; Grinsted, A.; Simko, V. R Package Biwavelet: Conduct Univariate and Bivariate Wavelet Analyses 2021.
- Lowe, R.; Gasparrini, A.; Van Meerbeeck, C.J.; Lippi, C.A.; Mahon, R.; Trotman, A.R.; Rollock, L.; Hinds, A.Q.J.; Ryan, S.J.; Stewart-Ibarra, A.M. Nonlinear and Delayed Impacts of Climate on Dengue Risk in Barbados: A Modelling Study. PLoS Med 2018, 15, e1002613. [Google Scholar] [CrossRef]
- Gasparrini, A. Distributed Lag Linear and Non-Linear Models in R: The Package Dlnm. Journal of Statistical Software 2011, 43, 1–20. [Google Scholar] [CrossRef]
- Besag, J.; York, J.; Molliè, A. Bayesian Image Restoration, with Two Applications in Spatial Statistics. Ann Inst Stat Math 1991, 43, 1–20. [Google Scholar] [CrossRef]
- Martins, T.G.; Simpson, D.; Lindgren, F.; Rue, H. Bayesian Computing with INLA: New Features. Computational Statistics & Data Analysis 2013, 67, 68–83. [Google Scholar] [CrossRef]
- Schmidt, W.-P.; Suzuki, M.; Dinh Thiem, V.; White, R.G.; Tsuzuki, A.; Yoshida, L.-M.; Yanai, H.; Haque, U.; Huu Tho, L.; Anh, D.D.; et al. Population Density, Water Supply, and the Risk of Dengue Fever in Vietnam: Cohort Study and Spatial Analysis. PLoS Med 2011, 8, e1001082. [Google Scholar] [CrossRef]
- Romeo-Aznar, V.; Paul, R.; Telle, O.; Pascual, M. Mosquito-Borne Transmission in Urban Landscapes: The Missing Link between Vector Abundance and Human Density. Proc. R. Soc. B. 2018, 285, 20180826. [Google Scholar] [CrossRef]
- Rasid, H.; Mallsk, A.U. Living on the Edge of Stagnant Water: An Assessment of Environmental Impacts of Construction-Phase Drainage Congestion along Dhaka City Flood Control Embankment, Bangladesh. Environmental Management 1996, 20, 89–98. [Google Scholar] [CrossRef]
- Chitolina, R.F.; Anjos, F.A.; Lima, T.S.; Castro, E.A.; Costa-Ribeiro, M.C.V. Raw Sewage as Breeding Site to Aedes ( Stegomyia ) Aegypti (Diptera, Culicidae). Acta Tropica 2016, 164, 290–296. [Google Scholar] [CrossRef] [PubMed]
- Foster, W.A.; Walker, E.D. MOSQUITOES ( Culicidae). In Medical and Veterinary Entomology; Elsevier, 2002; pp. 203–262. ISBN 978-0-12-510451-7. [Google Scholar]
- Sur, D.; Von Seidlein, L.; Manna, B.; Dutta, S.; Deb, A.K.; Sarkar, B.L.; Kanungo, S.; Deen, J.L.; Ali, M.; Kim, D.R.; et al. The Malaria and Typhoid Fever Burden in the Slums of Kolkata, India: Data from a Prospective Community-Based Study. Transactions of the Royal Society of Tropical Medicine and Hygiene 2006, 100, 725–733. [Google Scholar] [CrossRef] [PubMed]
- Krystosik, A.; Njoroge, G.; Odhiambo, L.; Forsyth, J.E.; Mutuku, F.; LaBeaud, A.D. Solid Wastes Provide Breeding Sites, Burrows, and Food for Biological Disease Vectors, and Urban Zoonotic Reservoirs: A Call to Action for Solutions-Based Research. Front. Public Health 2020, 7, 405. [Google Scholar] [CrossRef]
- Klafke, F.; Barros, V.G.; Henning, E. Solid Waste Management and Aedes Aegypti Infestation Interconnections: A Regression Tree Application. Waste Manag Res 2023, 41, 1684–1696. [Google Scholar] [CrossRef] [PubMed]
- Naqvi, S.A.A.; Sajjad, M.; Tariq, A.; Sajjad, M.; Waseem, L.A.; Karuppannan, S.; Rehman, A.; Hassan, M.; Al-Ahmadi, S.; Hatamleh, W.A. Societal Knowledge, Attitude, and Practices towards Dengue and Associated Factors in Epidemic-Hit Areas: Geoinformation Assisted Empirical Evidence. Heliyon 2024, 10, e23151. [Google Scholar] [CrossRef]
- Diaz-Quijano, F.A.; Martínez-Vega, R.A.; Rodriguez-Morales, A.J.; Rojas-Calero, R.A.; Luna-González, M.L.; Díaz-Quijano, R.G. Association between the Level of Education and Knowledge, Attitudes and Practices Regarding Dengue in the Caribbean Region of Colombia. BMC Public Health 2018, 18, 143. [Google Scholar] [CrossRef] [PubMed]
- Urrea, V.; Ochoa, A.; Mesa, O. Seasonality of Rainfall in Colombia. Water Resour. Res. 2019, 55, 4149–4162. [Google Scholar] [CrossRef]
- Santoso, A.; Mcphaden, M.J.; Cai, W. The Defining Characteristics of ENSO Extremes and the Strong 2015/2016 El Niño. Reviews of Geophysics 2017, 55, 1079–1129. [Google Scholar] [CrossRef]
- Elsinga, J.; Lizarazo, E.F.; Vincenti, M.F.; Schmidt, M.; Velasco-Salas, Z.I.; Arias, L.; Bailey, A.; Tami, A. Health Seeking Behaviour and Treatment Intentions of Dengue and Fever: A Household Survey of Children and Adults in Venezuela. PLoS Negl Trop Dis 2015, 9, e0004237. [Google Scholar] [CrossRef]
- Duong, V.; Lambrechts, L.; Paul, R.E.; Ly, S.; Lay, R.S.; Long, K.C.; Huy, R.; Tarantola, A.; Scott, T.W.; Sakuntabhai, A.; et al. Asymptomatic Humans Transmit Dengue Virus to Mosquitoes. Proc. Natl. Acad. Sci. U.S.A. 2015, 112, 14688–14693. [Google Scholar] [CrossRef]
| Model | ||||
|---|---|---|---|---|
| Level | Metric | Spatial | Temporal | Spatio-temporal |
| Comunas | DIC | 5,345 | 4,861 | 4,860 |
| WAIC | 5,358 | 4,863 | 4,863 | |
| Sectores | DIC | 14,646 | 13,874 | 13,871 |
| WAIC | 14,656 | 13,874 | 13,869 | |
| Secciones | DIC | 33,942 | 32,206 | 32,163 |
| WAIC | 33,871 | 32,185 | 32,139 | |
| Manzanas | DIC | 89,900 | 84,728 | 84,051 |
| WAIC | 89,845 | 84,667 | 83,988 | |
| Comunas | Sectores | Secciones | Manzanas | |
|---|---|---|---|---|
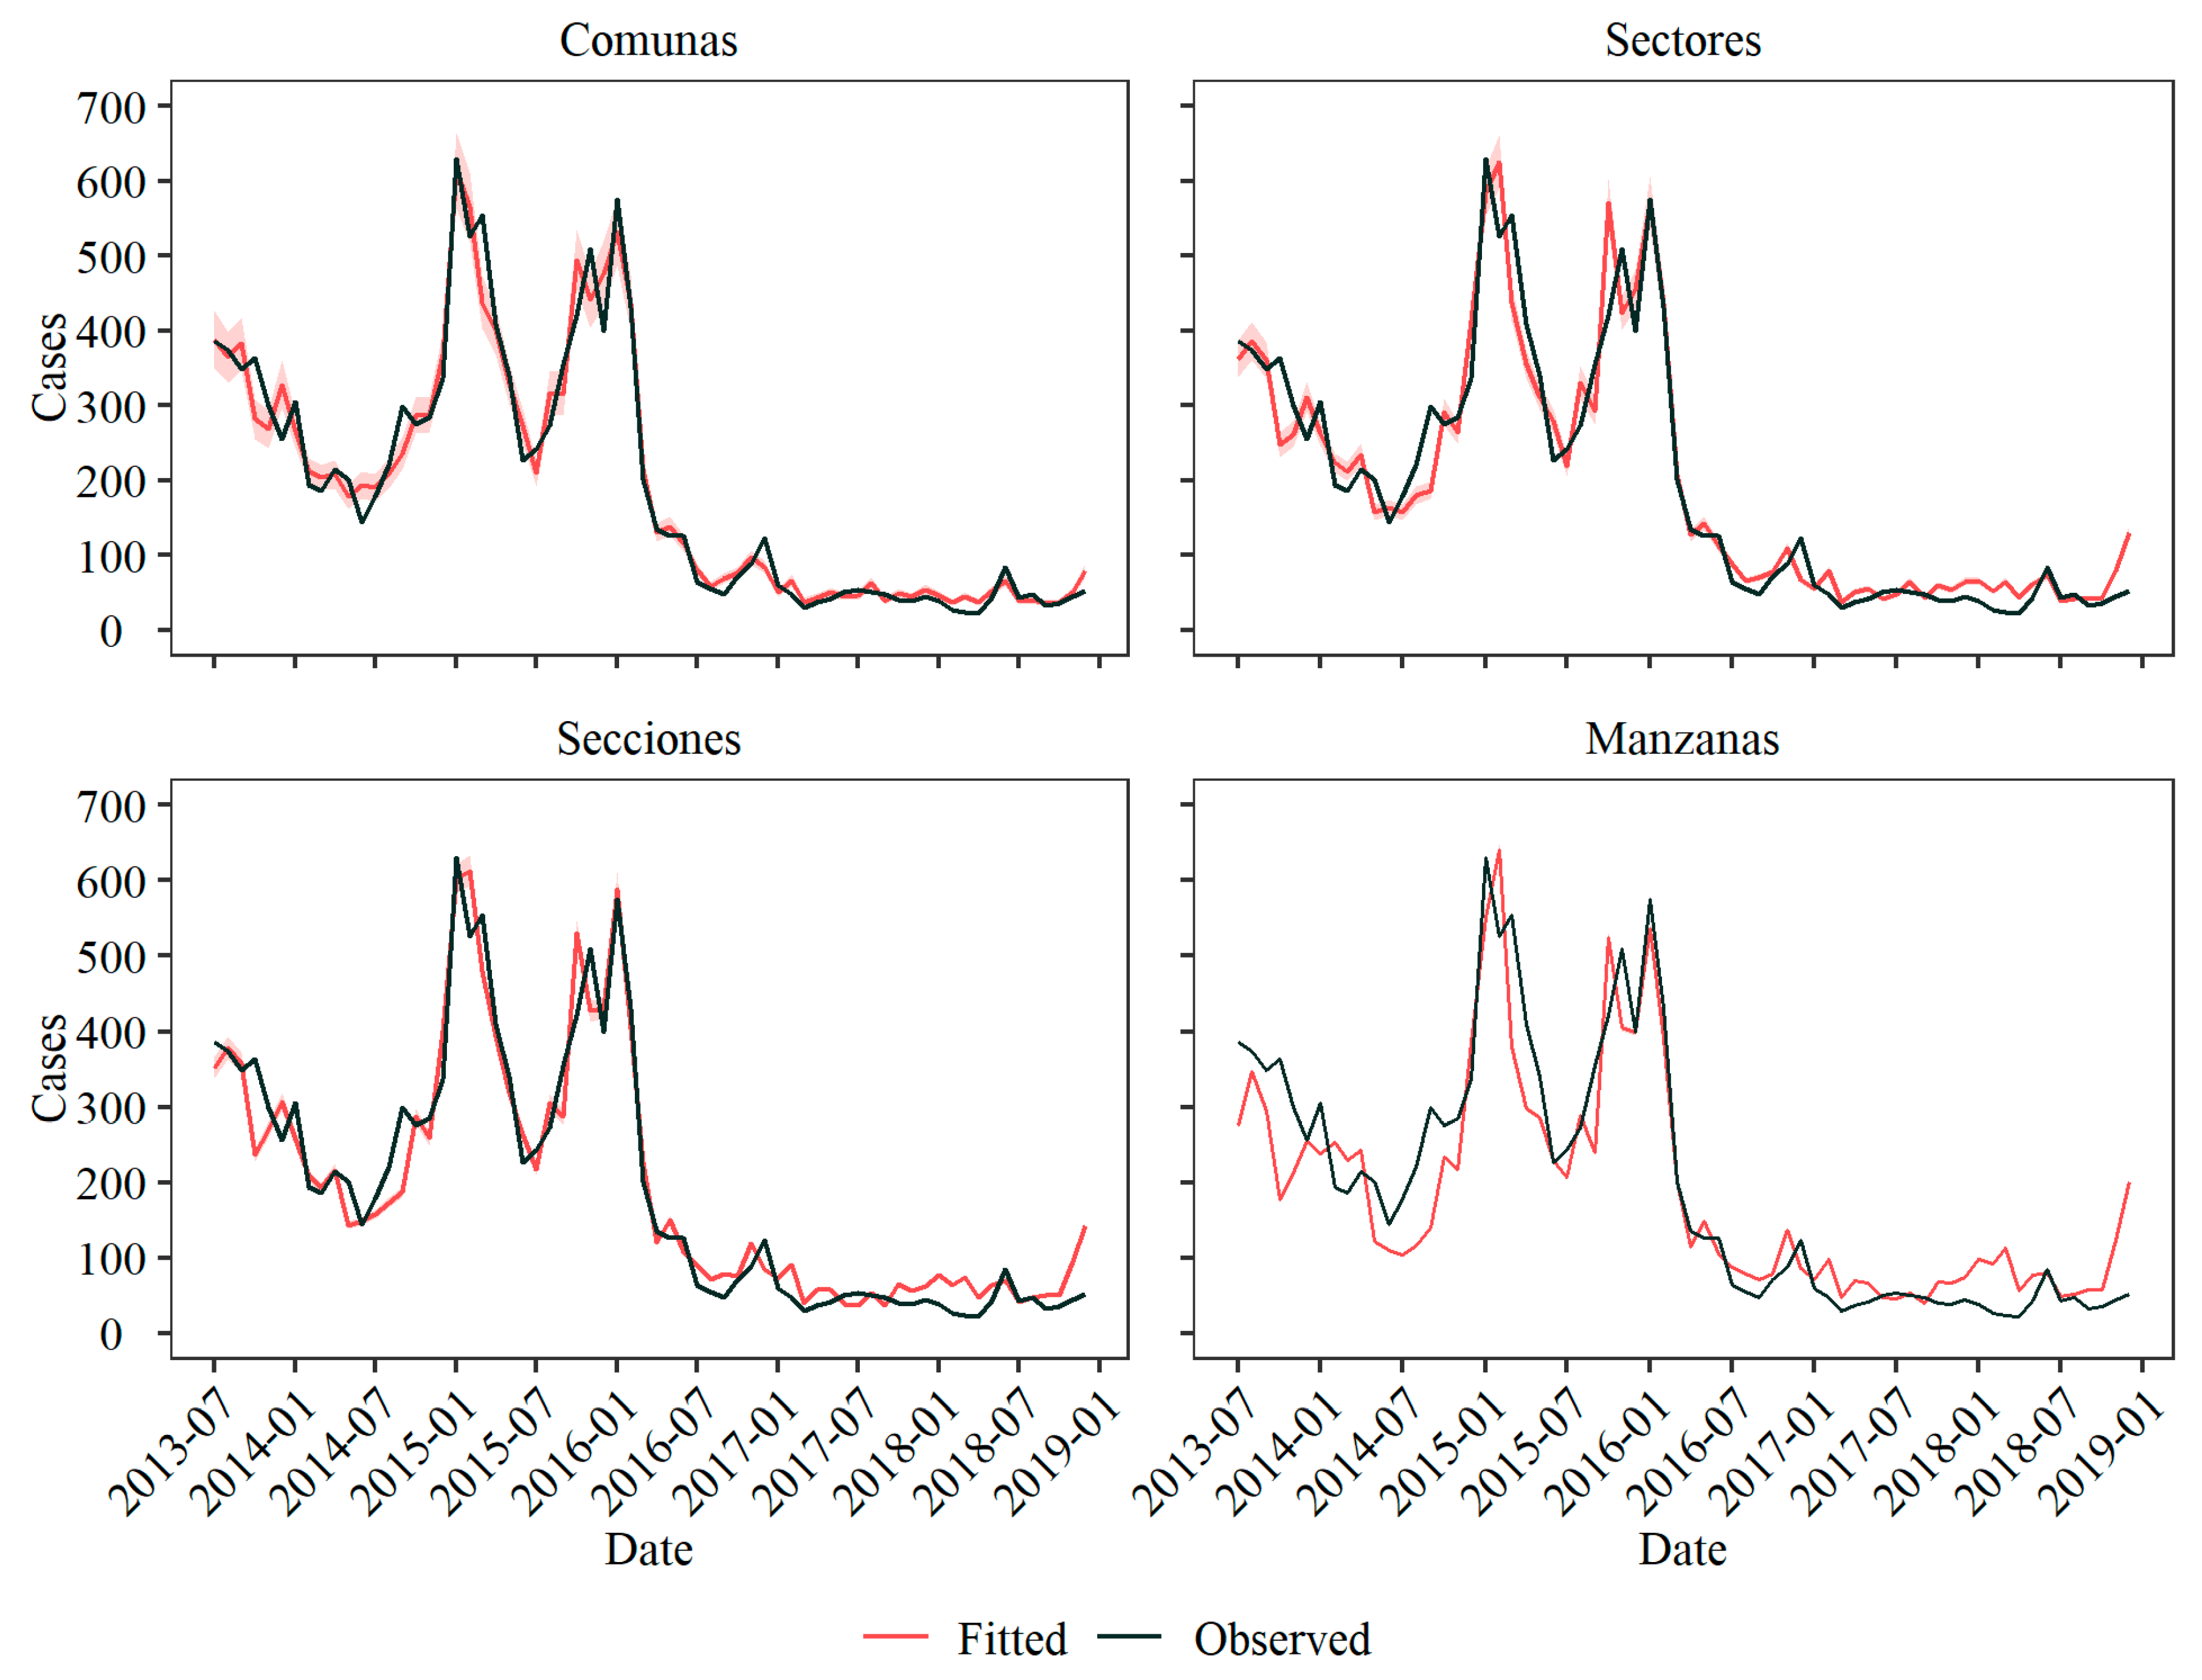
| RMSE | 32.69 | 45.80 | 42.34 | 66.63 |
Disclaimer/Publisher’s Note: The statements, opinions and data contained in all publications are solely those of the individual author(s) and contributor(s) and not of MDPI and/or the editor(s). MDPI and/or the editor(s) disclaim responsibility for any injury to people or property resulting from any ideas, methods, instructions or products referred to in the content. |
© 2024 by the authors. Licensee MDPI, Basel, Switzerland. This article is an open access article distributed under the terms and conditions of the Creative Commons Attribution (CC BY) license (https://creativecommons.org/licenses/by/4.0/).


