Submitted:
13 March 2024
Posted:
14 March 2024
You are already at the latest version
Abstract
A new algorithm is developed in this study to automatically detect reinforced concrete structures' rebar locations and diameters using the ground penetrating radar technique. The method approximates the hyperbolic signatures using two-way travel time and bi-quadratic equations. The study includes formulating electromagnetic wave speed in reinforced concrete (RC) structures. The algorithm was used in a computer code to provide an automated analysis of ground-penetrating radar data collected from a pre-planned survey grid. Two RC slabs were fabricated and tested to validate the proposed method. The proposed method is efficient in signal processing and accurately and reliably determining the rebar information.
Keywords:
nondestructive evaluation
; ground-penetrating radar (GPR)
; rebar depth
; rebar diameter
; reinforced-concrete structures
1. Introduction
Proper inspection, maintenance, and rehabilitation methods of concrete bridge structures play critical roles in both the nation’s economy and the traveling public’s safety. Visual inspection is a fast, convenient, inexpensive, versatile, and simple testing technique for in-situ inspection of concrete structures. It, however, typically limits the inspector to examine anomalies, defects, and discontinuities on the surface only and relies heavily on subjective assessments, which may significantly differ from one inspector expert to another [1,2]. Accordingly, more reliable, rapid, and cost-effective testing methods are necessary to optimize the rehabilitation and maintenance of the bridge structures.
Advanced non-destructive testing and evaluation (NDT & E) techniques are great solutions to assess deteriorated bridges, as they can provide fast, cost-effective, efficient, rapid data collection and reliable condition assessment of existing structures. These techniques are also becoming increasingly important because they can be carried out without significant detriment to bridge structures and potentially without traffic interruptions [3,4]. Non-destructive testing and evaluation of concrete structures can be performed by one or combinations of the following significant techniques: acoustic-based (e.g., impact echo and ultrasonic-pulse velocity) and electromagnetic-based (e.g., ground-penetrating radar, infrared thermography, and radiography). Each NDT & E technique has its advantages and limitations [5].
Ground-penetrating radar (GPR) has been used in geophysics for several decades for soil explorations. Due to the development of high-frequency antennas and advanced software and hardware computer systems, GPR has become a rapid and robust method for assessing concrete structures since the early 1990s. This technique was applied to monitor and assess bridge decks [6], to detect rebar size and location in the concrete structures [7,8,9], and to estimate the concrete cover and thickness of the bridge deck [10,11,12].
In addition, the GPR method has also been widely used for concrete moisture evaluation [13], deterioration mapping of old bridge decks [14], tracking cracks [15], assessment of rebar corrosion in concrete slabs [16,17], detection of embedded defects [18], detection voids in grouted post-tensioned concrete ducts [19], investigation of concrete mix variations and environmental conditions on defect detection [20], identification of corrosion-induced anomalies of bridge decks [21], rebar detection [22], visualization defects of fiber-reinforced polymer-wrapped reinforced concrete slabs [23,24,25], and mapping rebar layers [26].
Zatar et al. [27] proposed a method based on a synthetic aperture focusing technique to determine the rebar depth and spacing. Chang et al. [28] introduced a physical model that accounts for the electromagnetic signature of a buried reinforcing steel bar, considering the rebar’s radius. The GPR radargrams underwent several digital image processing stages, with subsequent analysis of power reflectivity variations within the energy zone as the GPR antenna traversed the reinforced concrete surface. Power reflectivity data for vertically oriented migration traces were produced, and their distances and the long dimension radius of an energy footprint were considered to calculate the radius of the reinforcing steel bar. Zhan and Xie [29] compared discrete and stationary wavelet transforms by creating a contour map of stationary wavelet transform detail coefficients. A conclusion was made that the stationary wavelet transform proves to be an effective method for measuring the diameter of a steel bar.
Wiwatrojanagul et al. [31] proposed a new method mainly focusing on automatically searching the locations of rebars in RC structures based on the modified existing hyperbolic signatures model. This method can efficiently detect embedded objects with the assumption of zero diameter of the rebars. Xiang et al. [32,33] presented an integrated approach based on pattern recognition and curve fitting principles to simultaneously determine the rebar’s horizontal location, depth, and size. This approach has a few limitations. Firstly, extracting precise points of interest from hyperbolas remains challenging, especially in environments with high noise levels. Secondly, estimating electromagnetic wave velocity based on imaginary curves is prone to errors.
This study utilizes GPR data to determine the depth and size of rebar in reinforced concrete structure components such as RC slabs. The primary objective of this research is to fill the current knowledge gaps in determining the rebar depth and size of reinforced concrete structures using GPR. A computer algorithm can extract the high accuracy of the hyperbola that represents the radargram’s rebar. In addition, the theoretical equation for the hyperbolic curve is developed. As a result, matching testing and theoretical curves provide rebar information regarding depth and size.2. Materials and Methods
2. GPR System and Data Processing
Ground-penetrating radar (GPR) refers to electromagnetic (EM) techniques that use radar pulses to image the subsurface. The GPR is based on the propagation of high-frequency electromagnetic waves that radiate into the media from a transmitting antenna. The wave frequency usually varies from 200 MHz to 2.6 GHz for most civil engineering applications. The dielectric constant and electrical conductivity are two physical properties of the GPR that control electromagnetic wave propagation. The GPR, an EM energy, is subjected to attenuation (i.e., loss of radar energy) as it propagates into a material. If the material is resistive (i.e., low conductivity), such as dry sand, ice, or dry concrete, the signal stays immaculate longer and is thus able to penetrate a considerable depth into the material.
In contrast, the GPR energy will be absorbed before going very far in the conductive materials (e.g., saltwater and wet concrete). As a result, the GPR techniques are suitable for inspecting construction materials such as concrete, sand, wood, and asphalt. The material’s dielectric constant indicates the speed of the radar energy traveling through the material. The GPR transmits EM waves into concrete, and it can measure travel time to receive the reflected waves from the embedded objects. As the energy speed is known, multiplying the two-way travel time and wave speed provides the objects’ depths. The GPR energy propagates in the air at almost the speed of light while it propagates in the water at about one-ninth speed, corresponding to the dielectric values ranging from 1 (air) to 81 (water). For construction materials, the dielectric values typically vary from 3 to 12, corresponding to radar wave velocities from 7 to 3.5 inches per nanosecond [34]. The GPR signal amplitude is stored in a two-dimensional matrix where column and row represent horizontal location and depth, respectively. It is directly exhibited in a two-dimensional unreconstructed image by a data interpretation proprietary software that comes with the GPR equipment.
When the radar energy encounters a subsurface/embedded object or a boundary between materials having different electrical conductivity and dielectric values, such as rebars, voids, the boundary between two different materials, or other inhomogeneous materials, it is reflected to the surface and picked up by the receiving antenna. The more significant the difference in these values, the stronger the reflections will be. For example, embedded rebars in concrete slabs show powerful reflection because they are conductive materials.
A typical GPR antenna consists of a pair of a transmitter (T) and a receiver (R); one transmits the signal, and the other receives the reflected signal (Figure 1). In this study, 1.6 GHz and 2.6 GHz antennas with 2.3” (58 mm) and 1.6” (40 mm) T-R offset, respectively, were selected for the GPR system. It should be noted that a common GPR signal processing technique called “background removal” has been used to remove noises of the surface reflection (i.e., direct coupling) pulses.
3. Experimental Program
3.1. Specimen Preparation and Details
Two reinforced concrete (RC) slabs were designed and tested to validate the in-house software's effectiveness. In the first specimen, S1, the overall dimensions are 910 × 610 × 89 mm (length × width × thickness), as shown in Figure 1a. In this slab, three different diameters of rebars (#3, #5, and #7 with nominal diameters of 10 mm, 16 mm, and 22 mm, respectively) were located at the same depth with an identical spacing of 203 mm. A thicker RC slab (specimen S2) with the dimensions of 1,143 × 356 × 178 mm (width × length × thickness) (Figure 1b) consisted of six rebars with diameters varied from #3 to #8 were embedded at the same depth and with identical spacing of 127 mm. The second RC slab was employed to examine the effect of overlap reflected signals from rebars with small spacing.
Ready-mix concrete from in-transit mixers was used to cast the RC slab specimens. The specimens were then cured and tested in laboratory conditions.
3.2. Data Collection and Acquisition
Data collection was performed in one direction, which was perpendicular to the steel rebars (i.e., parallel to the longer slab edge). The ground-coupled antenna with a frequency of 1.6 GHz was used for all RC slab specimens. The sample per scan and scan per meter parameters were changed to account for their effects on the hyperbolic shape. Table 1 shows the other parameters of the GPR device.
4. Signal Processing
4.1. Time Zero
The time zero is defined based on the purpose of the signal processing. The time zero can be the position of the first positive peak of the direct wave [35]. Wiwatrojanagul et al. [25] proposed a method that best fits the relationship between two-wave travel time and two-way travel length of the electromagnetic wave in the air. The positive peak times of the reflection waves from the copper plate located at different depths below the antenna were used in the best fitting to find the time zero. The following equation can determine the first positive peak:
where: t0 is time zero; tp is positive peak time; V0 is wave velocity in the air; L is two-way travel length calculated as:
where: z is depth of the copper plate; S is distance between the transmitter and the receiver.
Figure 2 shows the best-fitting curve using Eq. (2), where the time zero of 1.3268 ns was found. However, the calculated wave velocity of 1/0.0026=385 mm/ns is much higher than the electromagnetic wave velocity propagated in the air (299 mm/ns).
A simple method is proposed in this study, which does not use a metal plate to calibrate the time zero. The signal reflected from the rebar reversed its phase because the steel has infinite dielectric. The reflected signal's positive peak corresponds to the transmitted signal's negative peak. If the signal travels in the air from the transmitter to the receiver, the time zero can be determined by:
where: tnda is defined as the negative peak time of the direct wave in the air, as shown in Figure 3. For example, the tnda of around 1.48 ns at different distances (converted from traces) were found for a scan, as shown in Figure 4 then the time zero of ~1.3 ns can be calculated based on the equation (3).
4.2. Rebar Depth and Diameter
The shape of a hyperbola depends on two parameters [35]: 1) scan spacing, where a smaller scan's spacing (more scans per inch/cm) produces wide hyperbolas, and 2) wave velocity, where higher velocity (lower dielectric) produces wider hyperbolas and vice versa. Targets of larger diameter produce bright reflections. The shape of a hyperbola does not change significantly with target size for any diameter under 50 mm; all such targets are point-like for the radar as their size is a fraction of the wavelength.
The following assumptions are made to establish the equation of the hyperbola:
- Positive peaks of the reflected waves from rebar correspond to the negative peaks of the transmitting wave (phase reverse).
- The transmitting wave reflects at the surface of the rebar in the shortest two-wave travel path.
Consider a point on the hyperbolic curve; the two-wave travel time is expressed by:
where t0 is time zero; tp is the two-way travel time of the peak of the hyperbola;
Consider a point on the hyperbolic curve; the two-wave travel time is expressed as follows:
Substituting Eqs. (4) and (5) into Eq. (6) leads to:
Equation (7) presents the hyperbolic curve reflected from a rebar embedded in RC structures. In this equation, two unknown parameters must be determined: the rebar's center depth (z) and radius (r). The wave speed can be calculated using Eq. (6) after solving Eq. (7). Figure 6 shows the theoretical hyperbola for different rebar sizes, and the differences between them are insignificant.
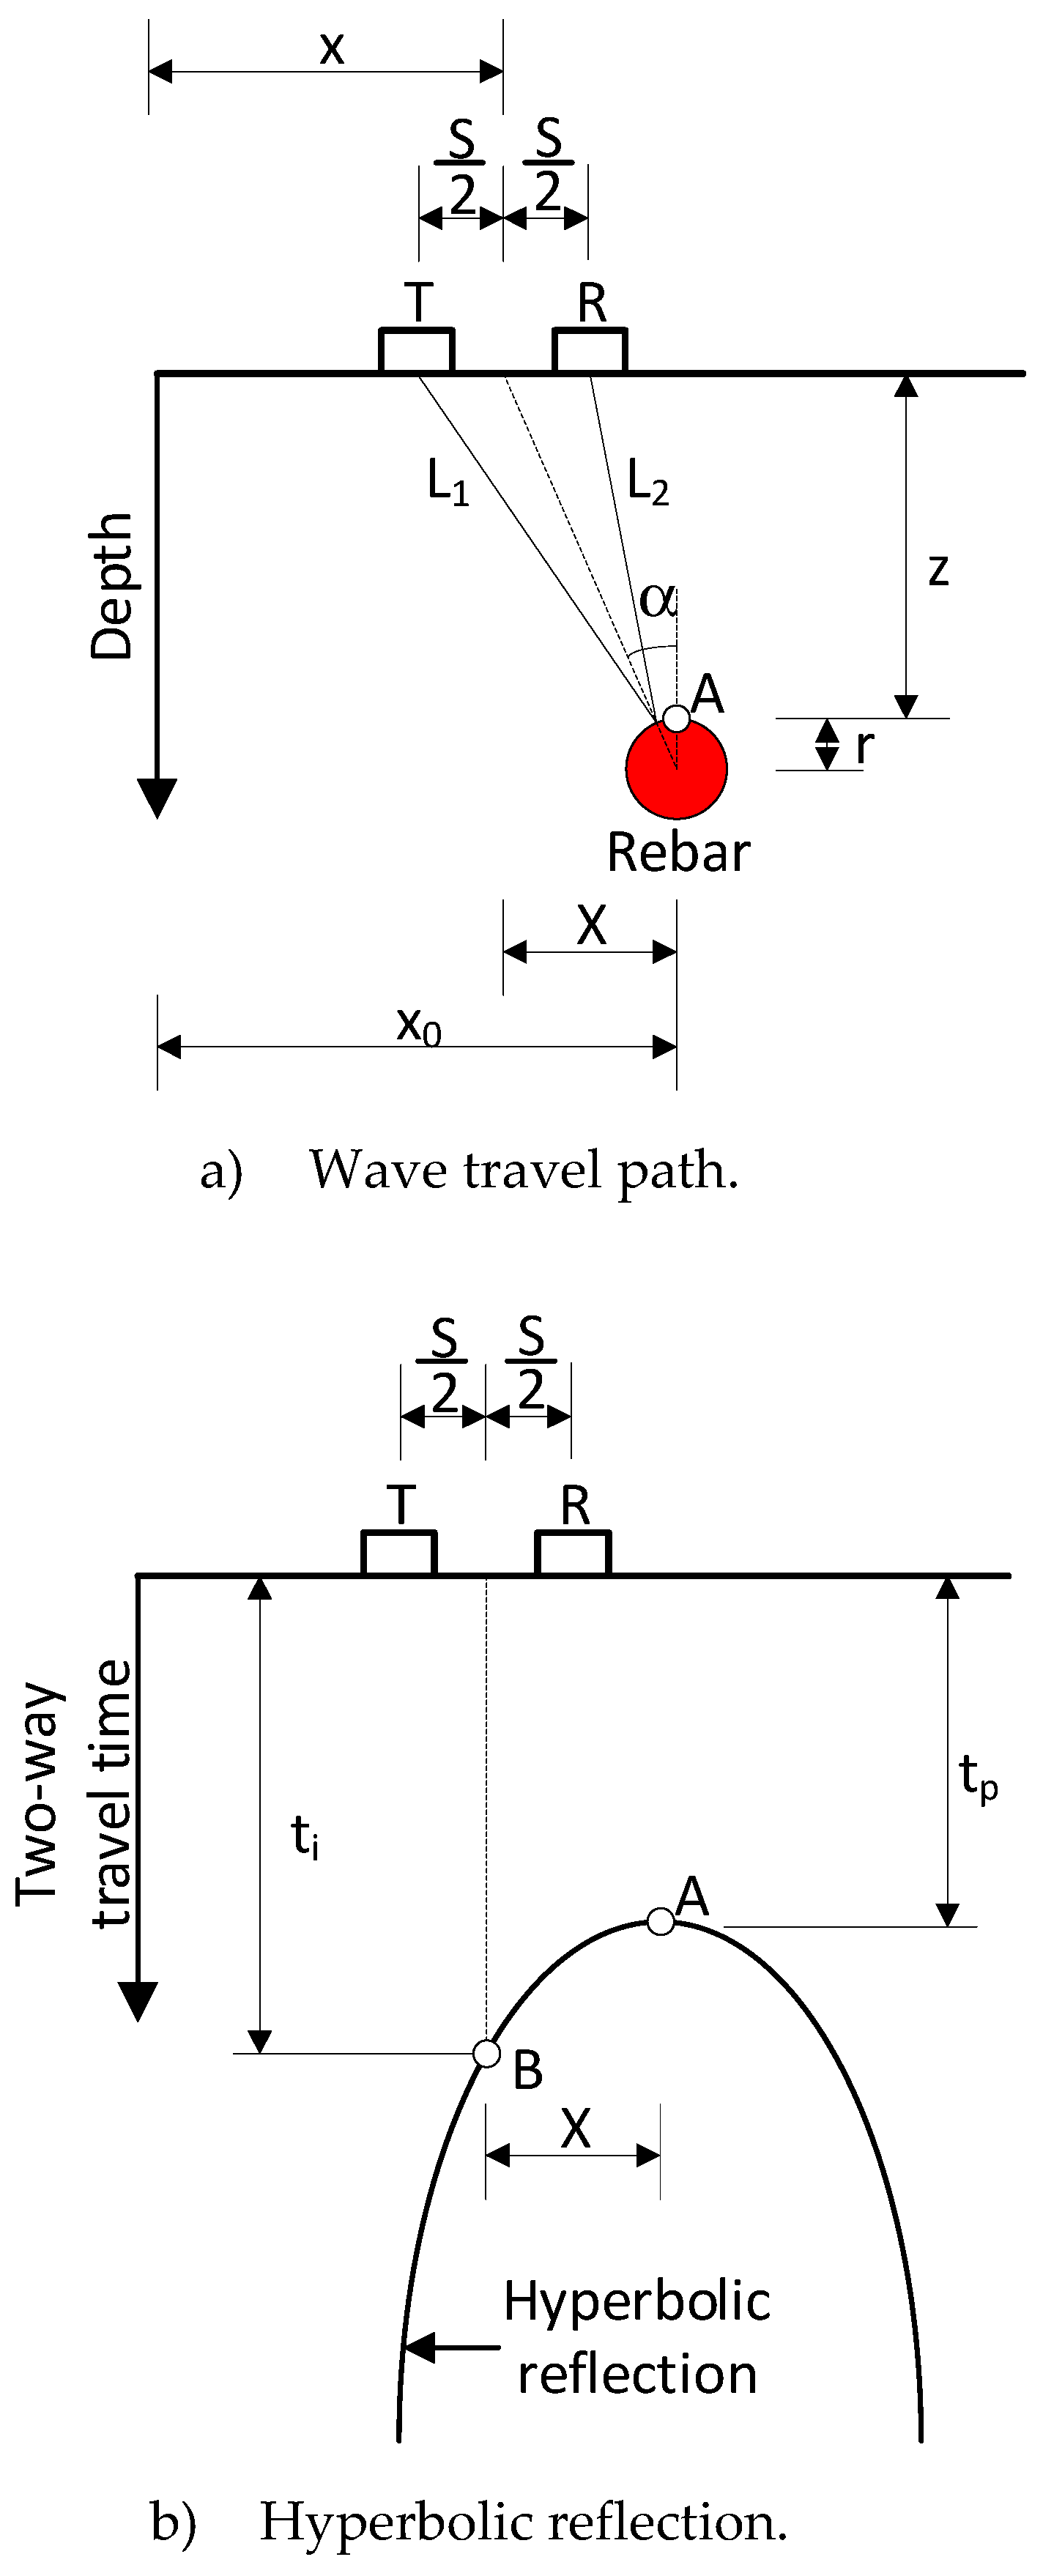
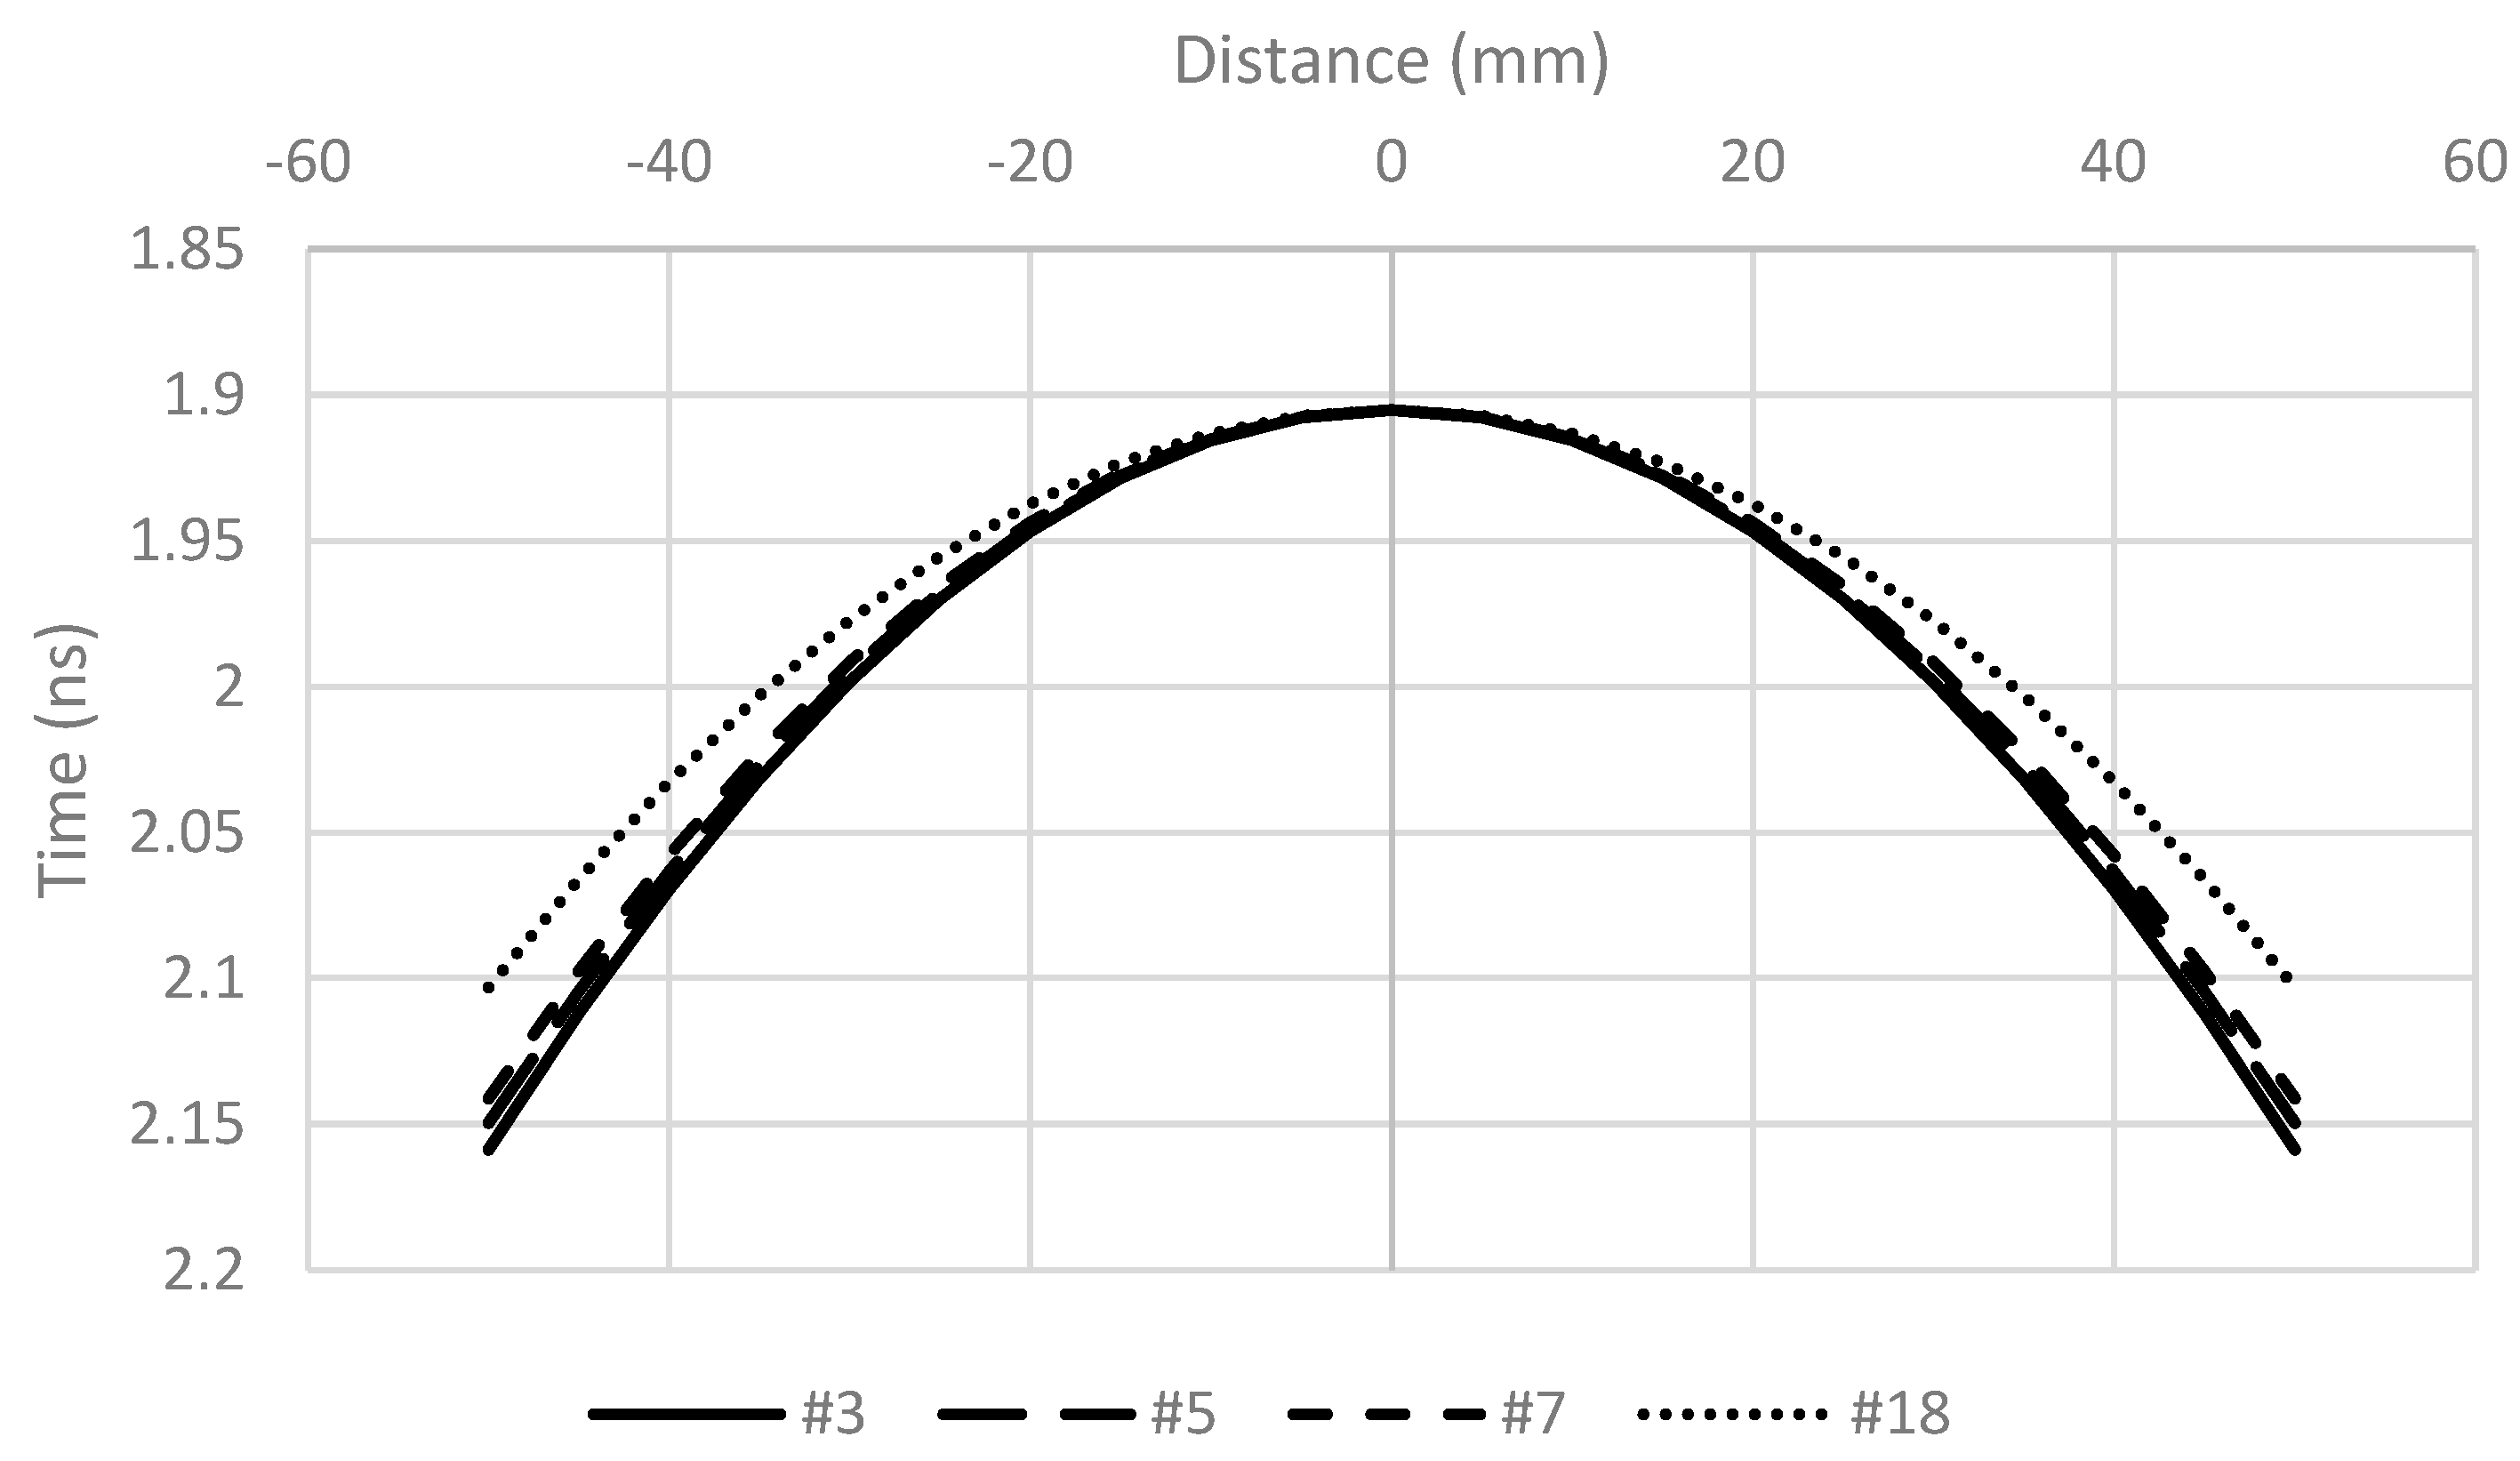
Figure 5.
Reflected wave from a rebar.
Figure 6.
Theoretical hyperbolas.
The locus of the positive peak reflections from the rebars extracted from a radargram are not smooth curves, and their peak coordinates (tp and xp) are not provided. The curves can be approximated by a bi-quadratic equation to determine the coordinates as follows:
The biquadratic equation (8) was selected because it fits the theoretical hyperbola (Eq. 7) with very high accuracy, as shown in Figure 7. The peak coordinates (tp and xp) then can be determined by solving the first derivative of Eq. (8):
A computer code with a fully graphical interface (written in Delphi) was developed to overcome the shortcomings of the current commercial GPR device’s post-processing software. The program can automatically detect and determine the rebar depth and size and electromagnetic wave velocity in concrete structures based on the theory presented in the previous section. All hyperbolic reflections represented by positive peaks are attracted from radargrams and best fitted by the biquadratic equations. An iterative method was employed to solve Equation (7) and find the unknowns to fit the biquadratic Equation accurately.
5. Results and Discussion
Figure 8 shows the radargram of the GPR scan for S1 with three rebars, #3, #5, and #7, represented by hyperbolic reflections. The positive peaks of the rebar reflections and the biquadratic and theoretical hyperbolic curves for all rebars are plotted in Figure 9. These best-fitting curves have very high accuracy with statistical measure R-squared values greater than 0.99. The solution's depth z and rebar radius vary from zero with an increment of 0.1 mm. With every value of rebar radius, the corresponding depth z can be derived based on the highest R-squared value. Figure 9 shows wave velocities, depths, and R-squared versus rebar diameter. The wave velocity of 124 mm/ns is determined from the reflection of the bottom of the slab (88.9 mm -thick), then the rebar depth and diameter are found based on the diagram in Figure 10. Table 2 presents the comparison between actual and calculated depth and diameter of the rebars with discrepancies less than 6%.
6. Conclusions
This study investigates the rebar depth and size based on hyperbola patterns in GPR data for RC structure. In the proposed method, the theoretical equation of the two-wave travel time is developed and approximated by a bi-quadratic equation. The theoretical hyperbolic equation is established based on the assumption of the positive peak reflection and shortest two-wave travel path. The properties of the rebar reflection curve, extracted from the radargrams, can be derived using the bi-quadratic equation. The rebar depth and sizes are obtained by matching the theoretical hyperbolic equation with the rebar reflection curve. The following conclusions are drawn:
- Time zero can be determined based on the negative peak of the transmitted signal in the air.
- The assumption of zero rebar diameters may lead to an inaccurate approximation of the wave velocity in the RC application.
- The solution of the theoretical hyperbolic equation provides multiple couples of rebar depth and size. First, the wave velocity needs to be determined to determine the appropriate values.
Compared with existing methods documented in the literature, the proposed method is efficient in signal processing and accurately and reliably determining the rebar information.
Acknowledgments
The authors would like to express their appreciation for the financial support provided by the West Virginia Department of Transportation (WVDOT) through the research project entitled “Corrosion Research to Maintain and Sustain Infrastructure in West Virginia.” The findings, conclusions, or recommendations expressed in this study are those of the author and do not necessarily reflect the viewpoints of the WVDOT. The author would like to express his sincere gratitude and appreciation to Dr. Tu Nguyen, Dr. Cumhur Cosgun, and Dr. Kien Dinh for their assistance while conducting this research project’s experimental and analytical tasks.
References
- Kaiser, H.; Karbhari, V.; Sikorsky, C. Non-destructive testing techniques for FRP rehabilitated concrete. II: an assessment. Int. J. Mater. Prod. Technol. 2004, 21, 385, . [CrossRef]
- Zatar, W.; Nguyen, H. Condition Assessment of Ground-Mount Cantilever Weathering-Steel Overhead Sign Structures. J. Infrastruct. Syst. 2017, 23, . [CrossRef]
- Büyüköztürk, O. Imaging of concrete structures. NDT E Int. 1998, 31, 233–243, . [CrossRef]
- Popovics, J.S., Roesler, J.R., Bittner, J., Amirkhanian, A.N., Brand, A.S., Gupta, P. and Flowers, K., 2017. Ultrasonic imaging for concrete infrastructure condition assessment and quality assurance. Illinois Center for Transportation/Illinois Department of Transportation.
- ACI Committee 228, 2013. Report on Nondestructive Test Methods for Evaluation of Concrete in Structures. Report ACI 228.2R-13, American Concrete Institute.
- Alani, A.M.; Aboutalebi, M.; Kilic, G. Applications of ground penetrating radar (GPR) in bridge deck monitoring and assessment. J. Appl. Geophys. 2013, 97, 45–54, . [CrossRef]
- He, X.Q., Zhu, Z.Q., Liu, Q.Y. and Lu, G.Y., 2009, March. Review of GPR rebar detection. In PIERS proceedings (pp. 804-813).
- Bala, D.C., Garg, R.D. and Jain, S.S., 2011. Rebar detection using GPR: an emerging non-destructive QC approach. Int. J. Eng. Res. Appl. (IJERA), 1(4), pp.2111-2117.
- Hasan, M.I. and Yazdani, N., 2016. An experimental study for quantitative estimation of rebar corrosion in concrete using ground penetrating radar. Journal of Engineering, 2016.
- Hugenschmidt, J. Concrete bridge inspection with a mobile GPR system. Constr. Build. Mater. 2002, 16, 147–154, . [CrossRef]
- Hasan, M.I. and Yazdani, N., 2014. Ground penetrating radar utilization in exploring inadequate concrete covers in a new bridge deck. Case Studies in Construction Materials, 1, pp.104-114.
- Zhou, F.; Chen, Z.; Liu, H.; Cui, J.; Spencer, B.F.; Fang, G. Simultaneous Estimation of Rebar Diameter and Cover Thickness by a GPR-EMI Dual Sensor. Sensors 2018, 18, 2969, . [CrossRef]
- Laurens, S.; Balayssac, J.P.; Rhazi, J.; Klysz, G.; Arliguie, G. Non-destructive evaluation of concrete moisture by GPR: Experimental study and direct modeling. Mater. Struct. 2005, 38, 827–832, . [CrossRef]
- Gucunski, N., Rascoe, C., Parrillo, R. and Roberts, R.L., 2009. Complementary Condition Assessment of Bridge Decks by High-Frequency Ground-Penetrating Radar and Impact Echo (No. 09-1282).
- Benedetto, A.; Manacorda, G.; Simi, A.; Tosti, F. Novel perspectives in bridges inspection using GPR. Nondestruct. Test. Evaluation 2012, 27, 239–251, . [CrossRef]
- Eisenmann, D., Margetan, F., Chiou, C.P.T., Roberts, R. and Wendt, S., 2013. Ground penetrating radar applied to rebar corrosion inspection. In AIP Conference Proceedings (Vol. 1511, No. 1, pp. 1341–1348). American Institute of Physics.
- Zaki, A.; Johari, M.A.M.; Hussin, W.M.A.W.; Jusman, Y. Experimental Assessment of Rebar Corrosion in Concrete Slab Using Ground Penetrating Radar (GPR). Int. J. Corros. 2018, 2018, 1–10, . [CrossRef]
- Eisenmann, D., Margetan, F.J., Koester, L. and Clayton, D., 2016. Inspection of a large concrete block containing embedded defects using ground penetrating radar. In AIP Conference Proceedings (Vol. 1706, No. 1, p. 020014). AIP Publishing LLC.
- Garg, S.; Misra, S. Efficiency of NDT techniques to detect voids in grouted post-tensioned concrete ducts. Nondestruct. Test. Evaluation 2020, 36, 1–22, . [CrossRef]
- Yehia, S.; Qaddoumi, N.; Farrag, S.; Hamzeh, L. Investigation of concrete mix variations and environmental conditions on defect detection ability using GPR. NDT E Int. 2014, 65, 35–46, . [CrossRef]
- Tarussov, A.; Vandry, M.; De La Haza, A. Condition assessment of concrete structures using a new analysis method: Ground-penetrating radar computer-assisted visual interpretation. Constr. Build. Mater. 2013, 38, 1246–1254, . [CrossRef]
- Zatar, W.A., Nghiem, H.M., and Nguyen, H.D., 2022. Effects of antenna frequencies on detectability and reconstructed image of embedded objects in concrete structures using ground-penetrating radar. 9th Forensic Engineering Congress, ASCE.
- Zatar, W.A., Nguyen, H.D., and Nghiem, H.M., 2021a. FRP Retrofitting and Non-Destructive Evaluation for Corrosion-Deteriorated Bridges in West Virginia. Special Publication 346: 11-30.
- Zatar, W.A., Nguyen, H.D., Nghiem, H.M. and Cosgun, C., 2021b. Non-Destructive Testing of GFRP-Wrapped Reinforced-Concrete Slabs (No. TRBAM-21-03354).
- Zatar, W. and Nghiem, H., 2023. Detectability of embedded defects in FRP strengthened concrete deck slabs. Risk-Based Strategies for Bridge Maintenance. CRC Press, pp.221-34.
- Hugenschmidt, J.; Kalogeropoulos, A.; Soldovieri, F.; Prisco, G. Processing strategies for high-resolution GPR concrete inspections. NDT E Int. 2010, 43, 334–342, . [CrossRef]
- Zatar, W.A.; Nguyen, H.D.; Nghiem, H.M. Ultrasonic pitch and catch technique for non-destructive testing of reinforced concrete slabs. J. Infrastruct. Preserv. Resil. 2020, 1, 1–13, . [CrossRef]
- Chang, C.W.; Lin, C.H.; Lien, H.S. Measurement radius of reinforcing steel bar in concrete using digital image GPR. Constr. Build. Mater. 2009, 23, 1057–1063, . [CrossRef]
- Utsi, V. and Utsi, E., 2004, June. Measurement of reinforcement bar depths and diameters in concrete. In Proceedings of the Tenth International Conference on Grounds Penetrating Radar, 2004. GPR 2004. (pp. 659-662). IEEE.
- Zhan, R.; Xie, H. GPR measurement of the diameter of steel bars in concrete specimens based on the stationary wavelet transform. Insight - Non-Destructive Test. Cond. Monit. 2009, 51, 151–155, . [CrossRef]
- Wiwatrojanagul, P.; Sahamitmongkol, R.; Tangtermsirikul, S.; Khamsemanan, N. A new method to determine locations of rebars and estimate cover thickness of RC structures using GPR data. Constr. Build. Mater. 2017, 140, 257–273, . [CrossRef]
- Xiang, Z.; Ou, G.; Rashidi, A. Integrated Approach to Simultaneously Determine 3D Location and Size of Rebar in GPR Data. J. Perform. Constr. Facil. 2020, 34, 04020097, . [CrossRef]
- Xiang, Z., Ou, G. and Rashidi, A., 2020. An Innovative Approach to Determine Rebar Depth and Size by Comparing GPR Data with a Theoretical Database. Construction Research Congress 2020, 86-95.
- GSSI. Concrete Handbook, GPR inspection of concrete.
Figure 1.
Details of the RC slab specimens S1 and S2 (units in millimeters).
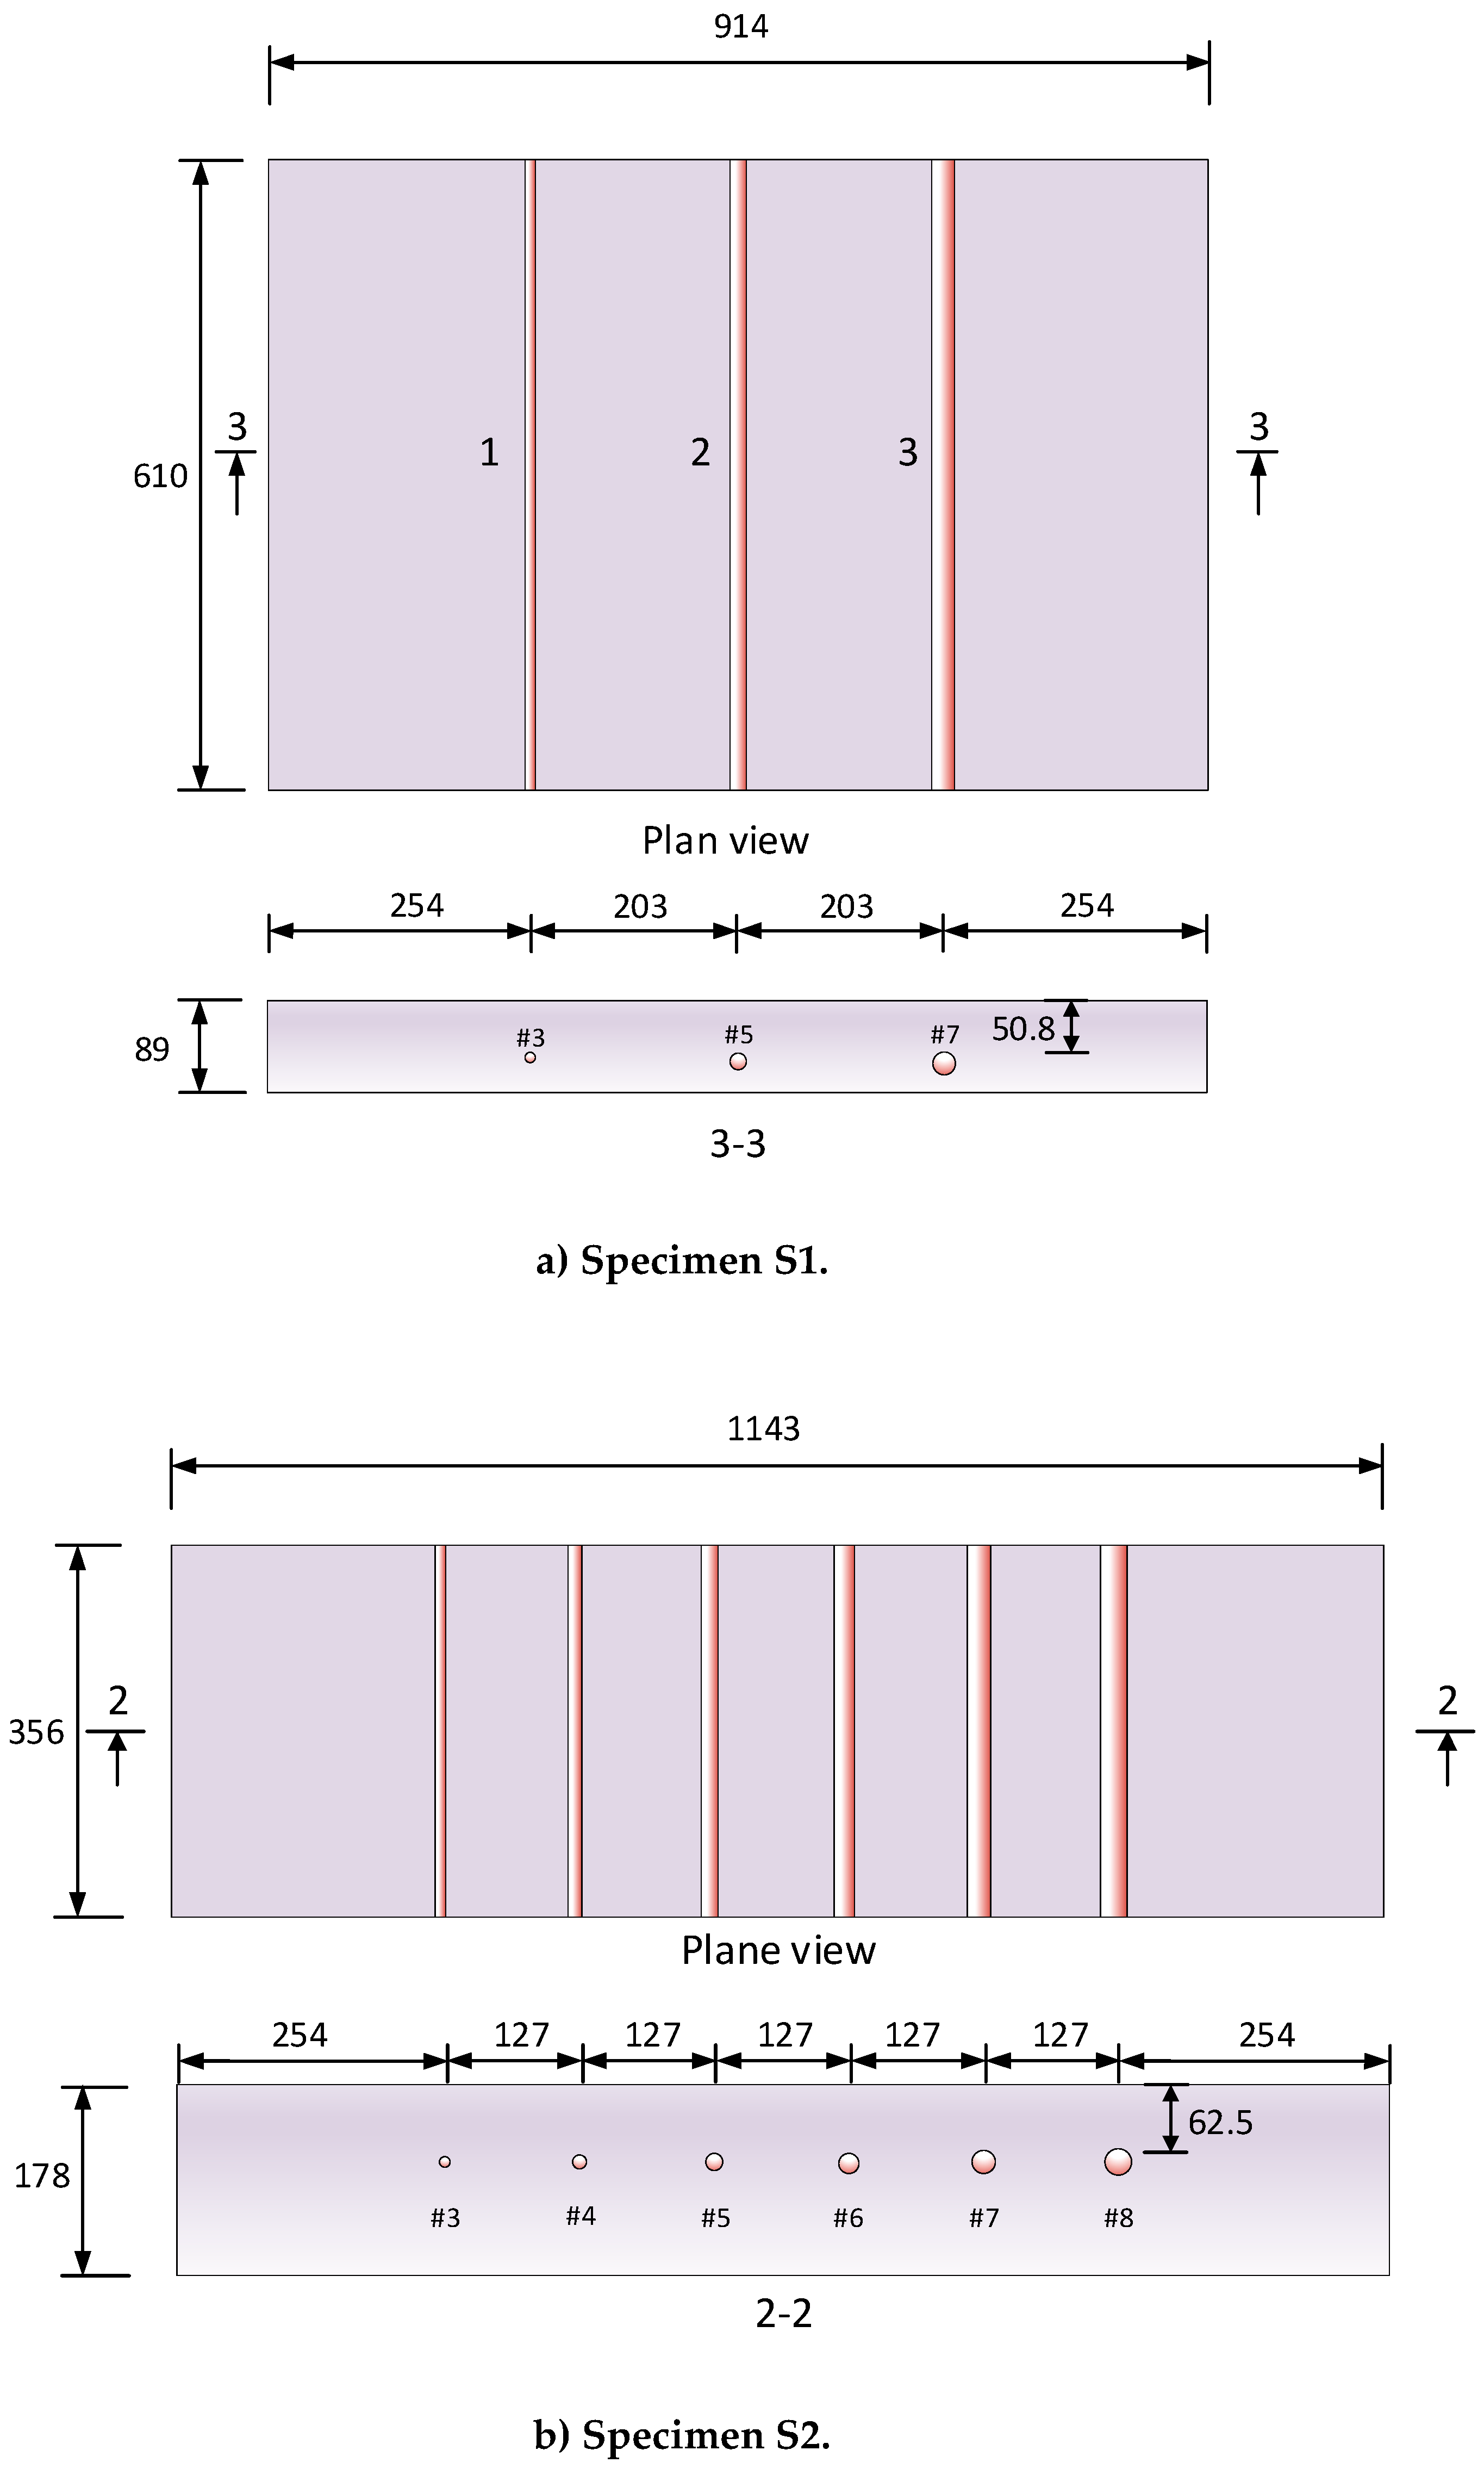
Figure 2.
Best fitting curve for time zero.
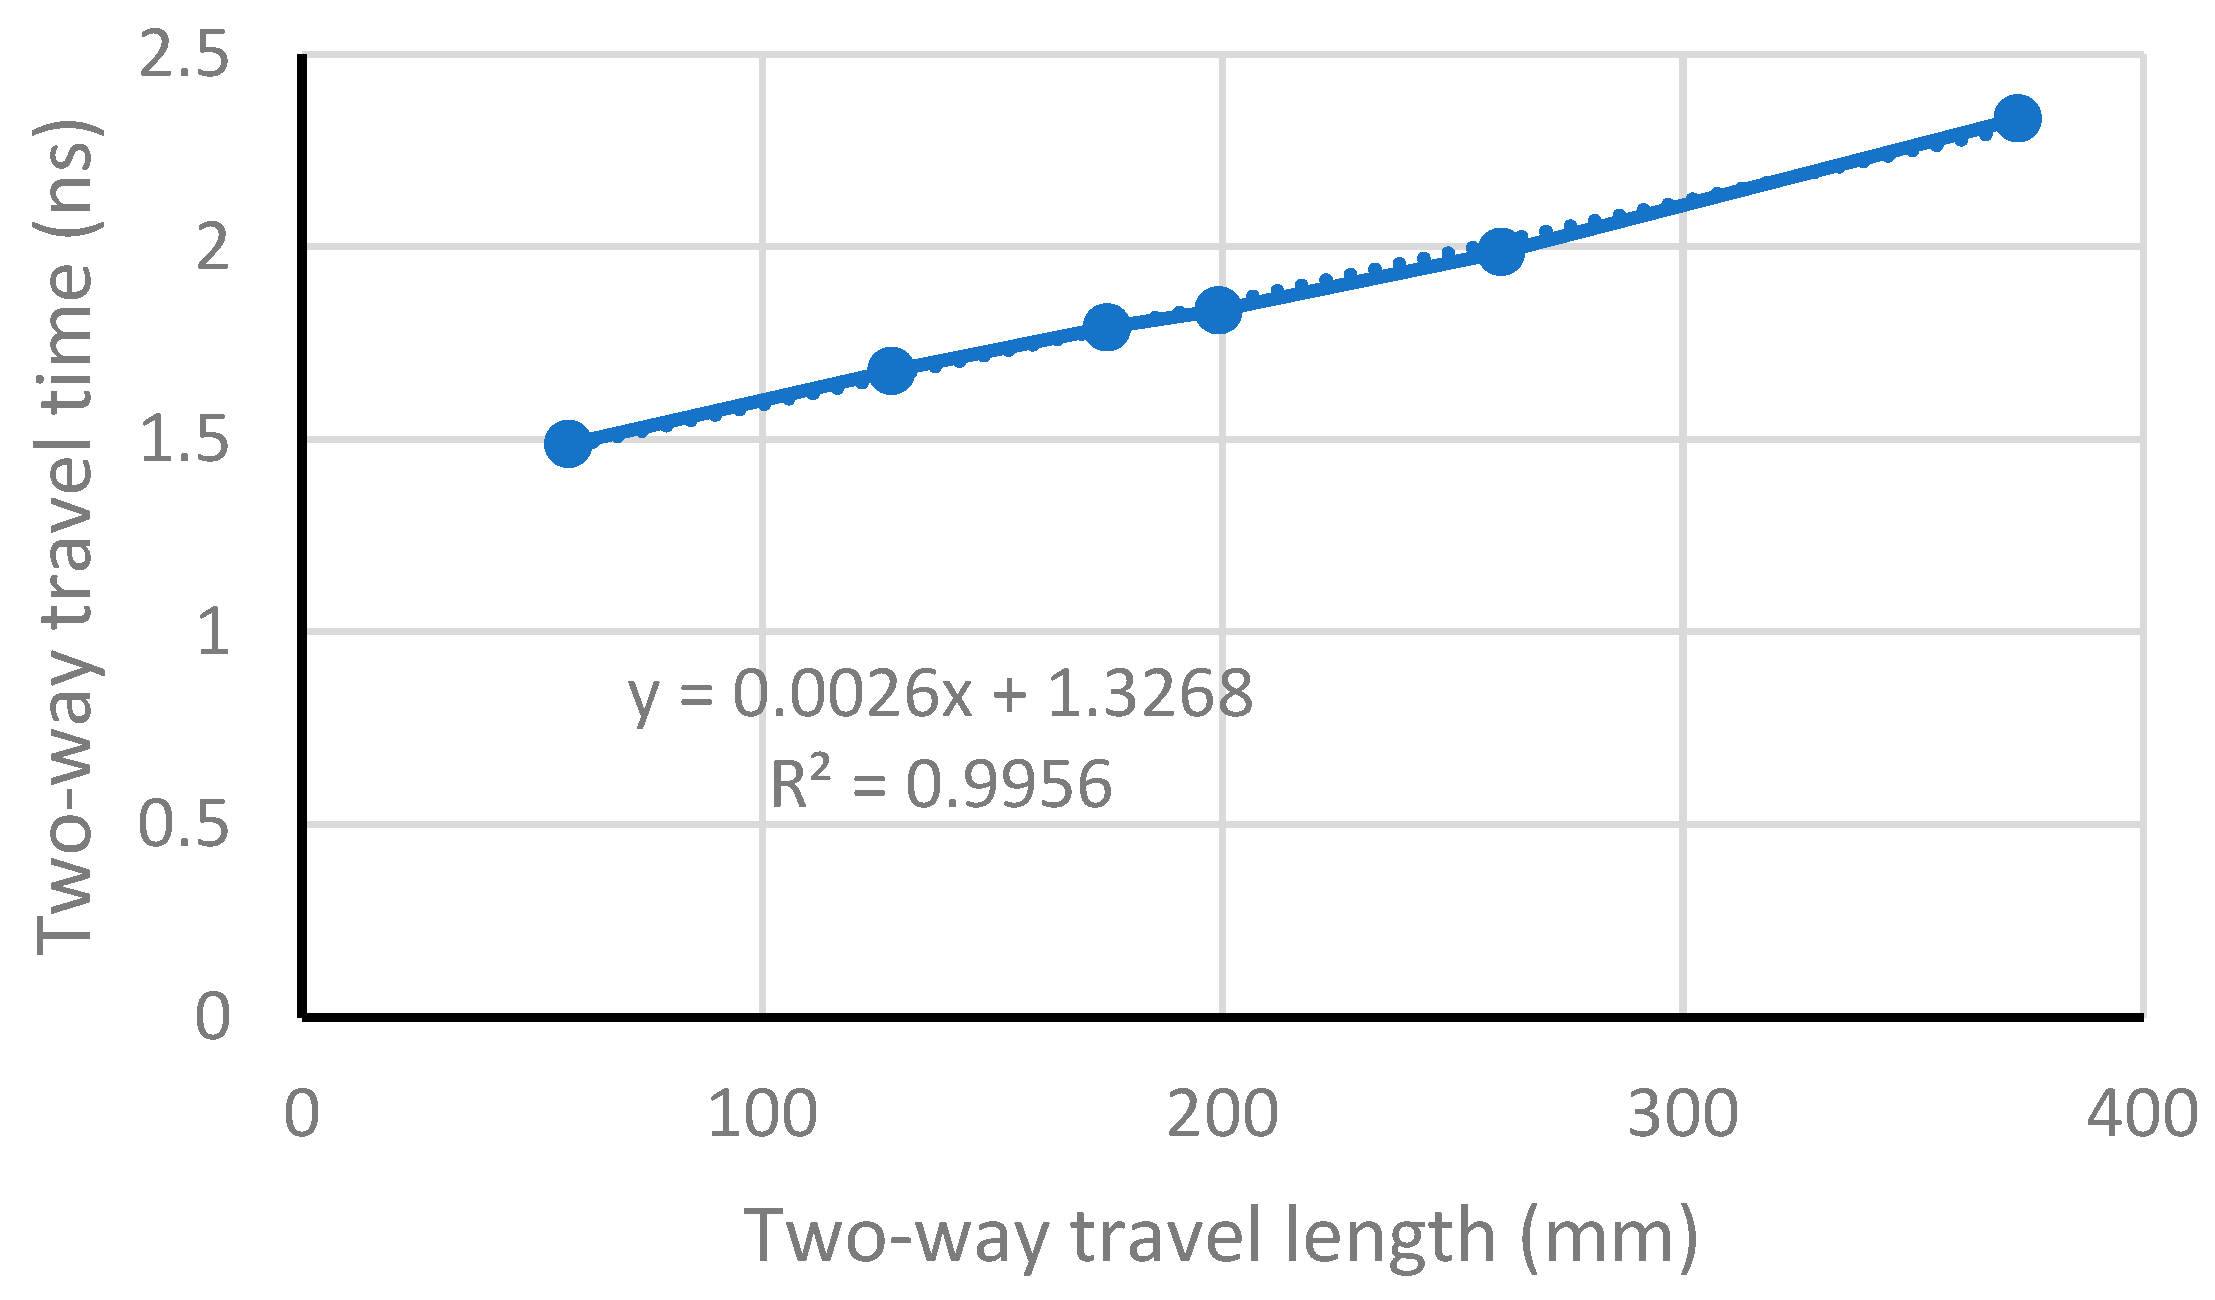
Figure 3.
Definition of the negative peak time of the direct wave.
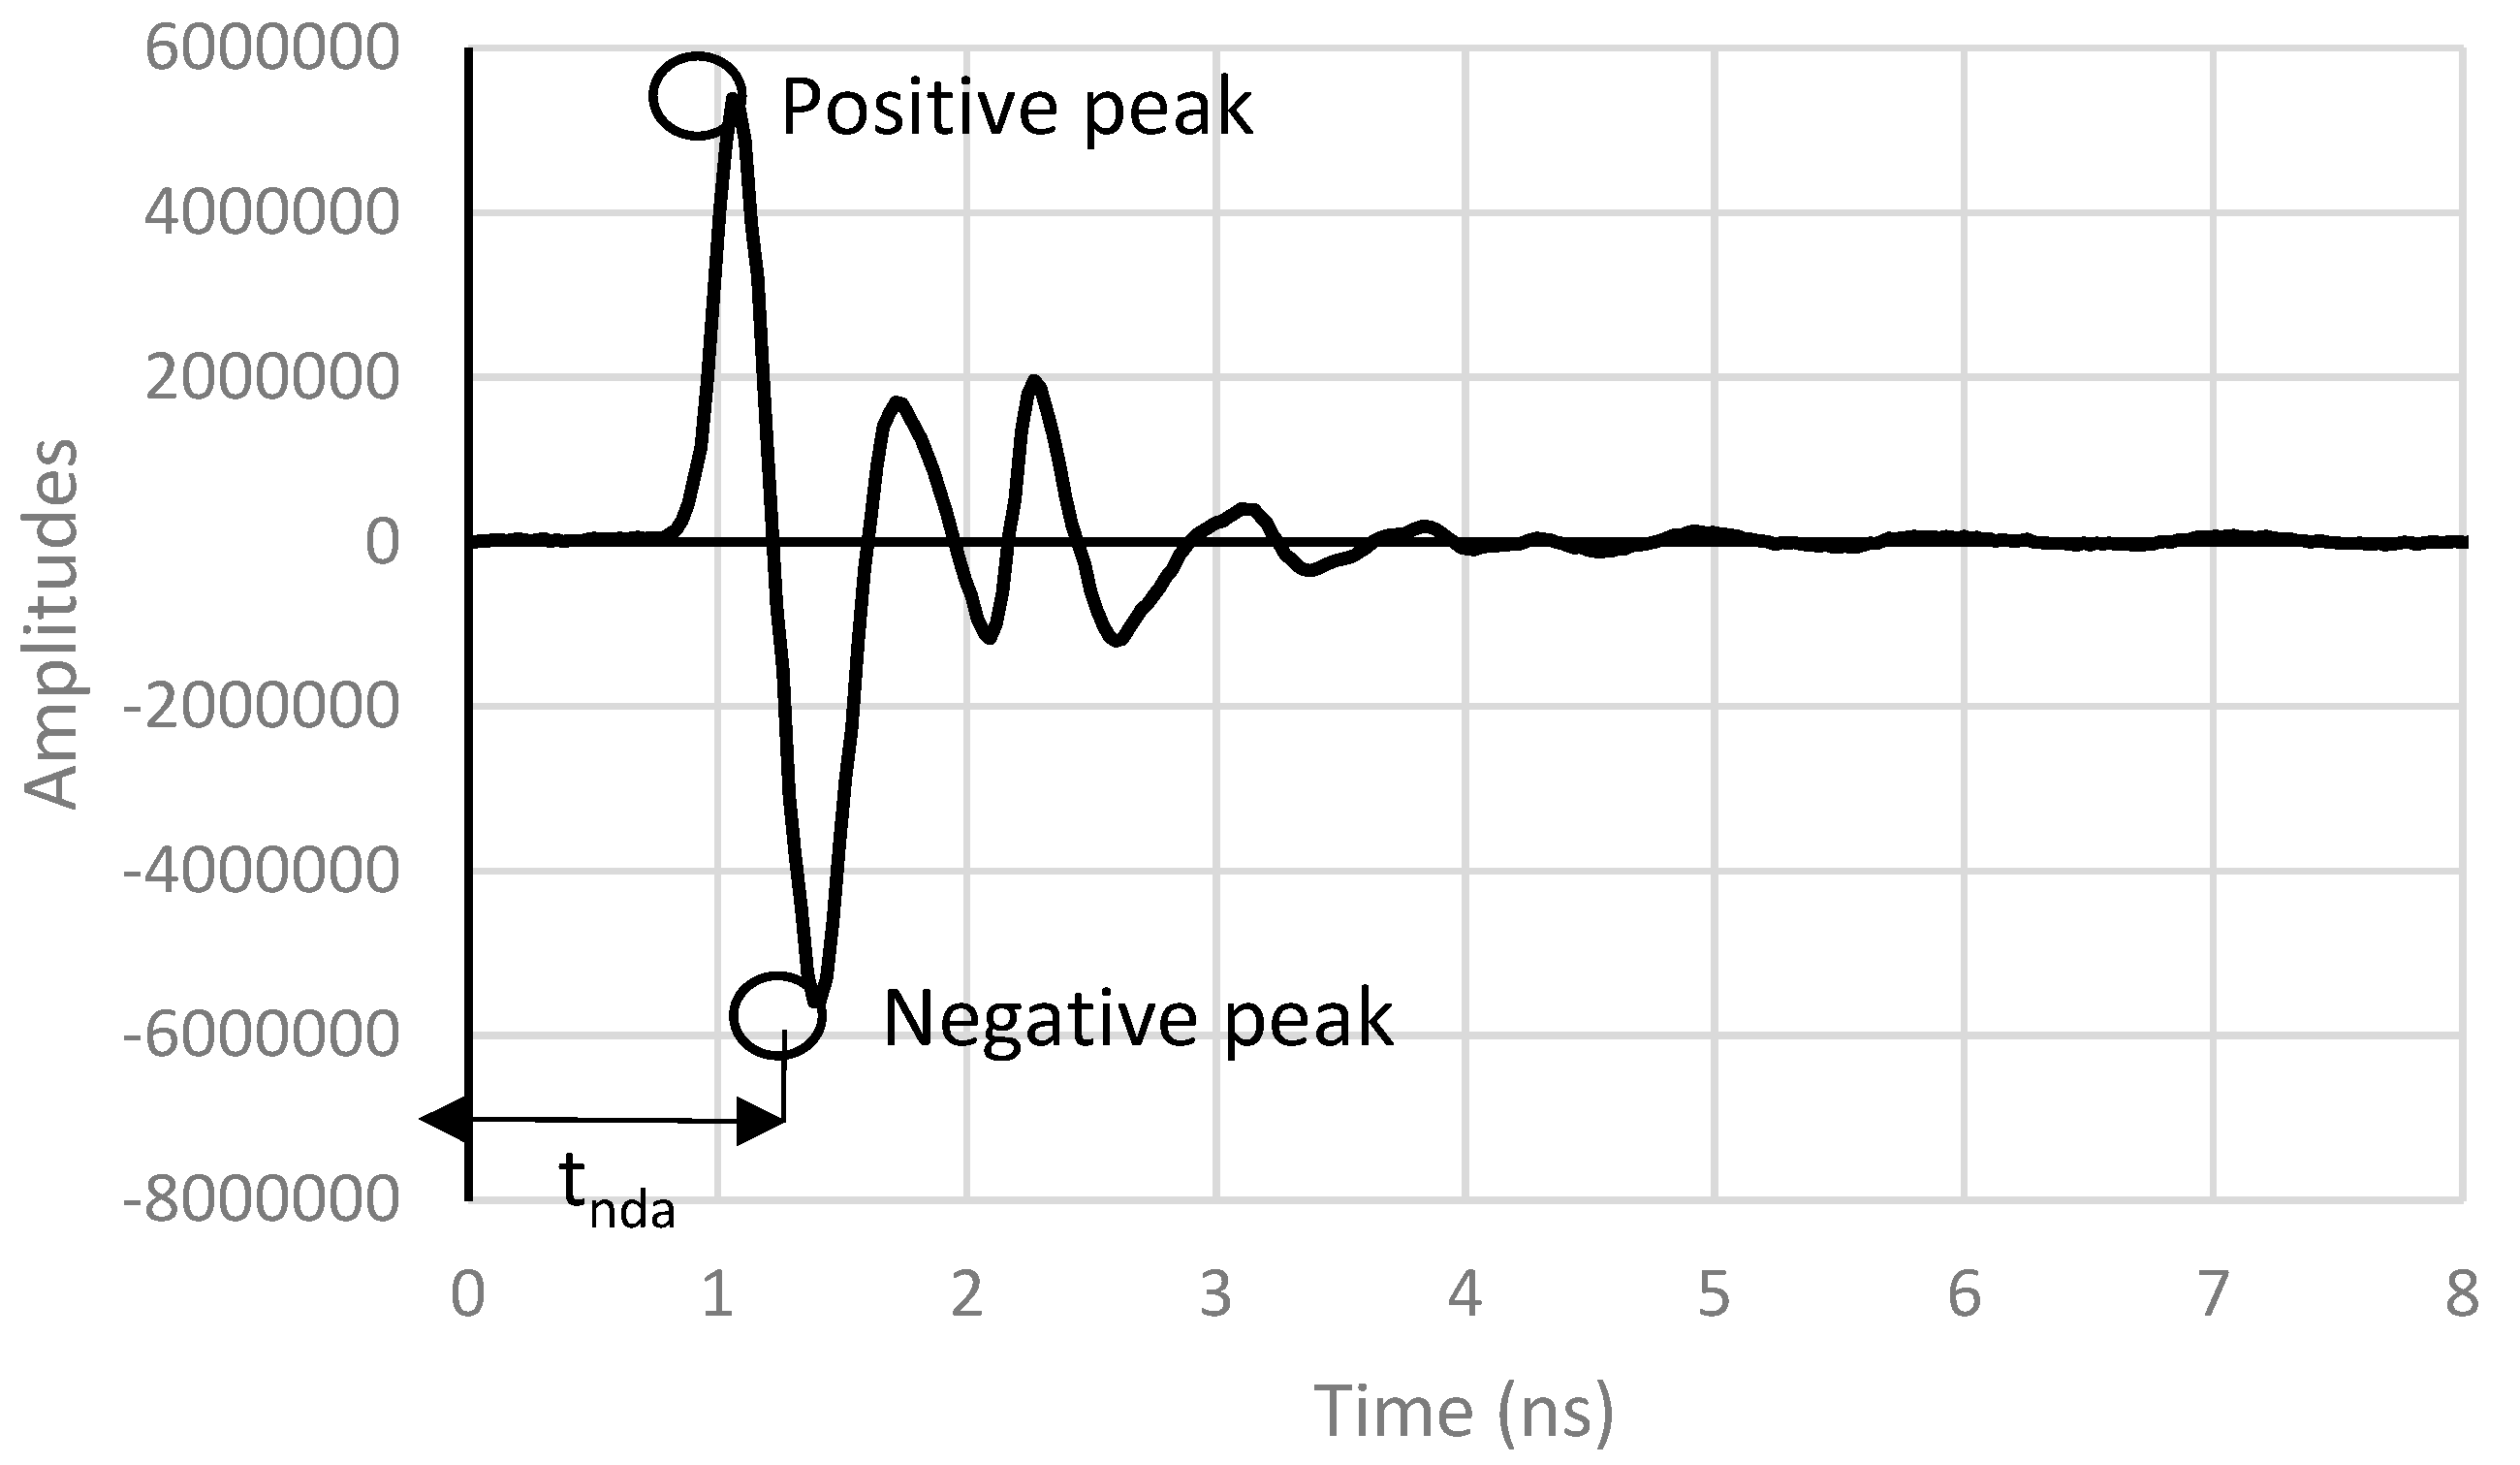
Figure 4.
The negative peaks times of the direct signals.
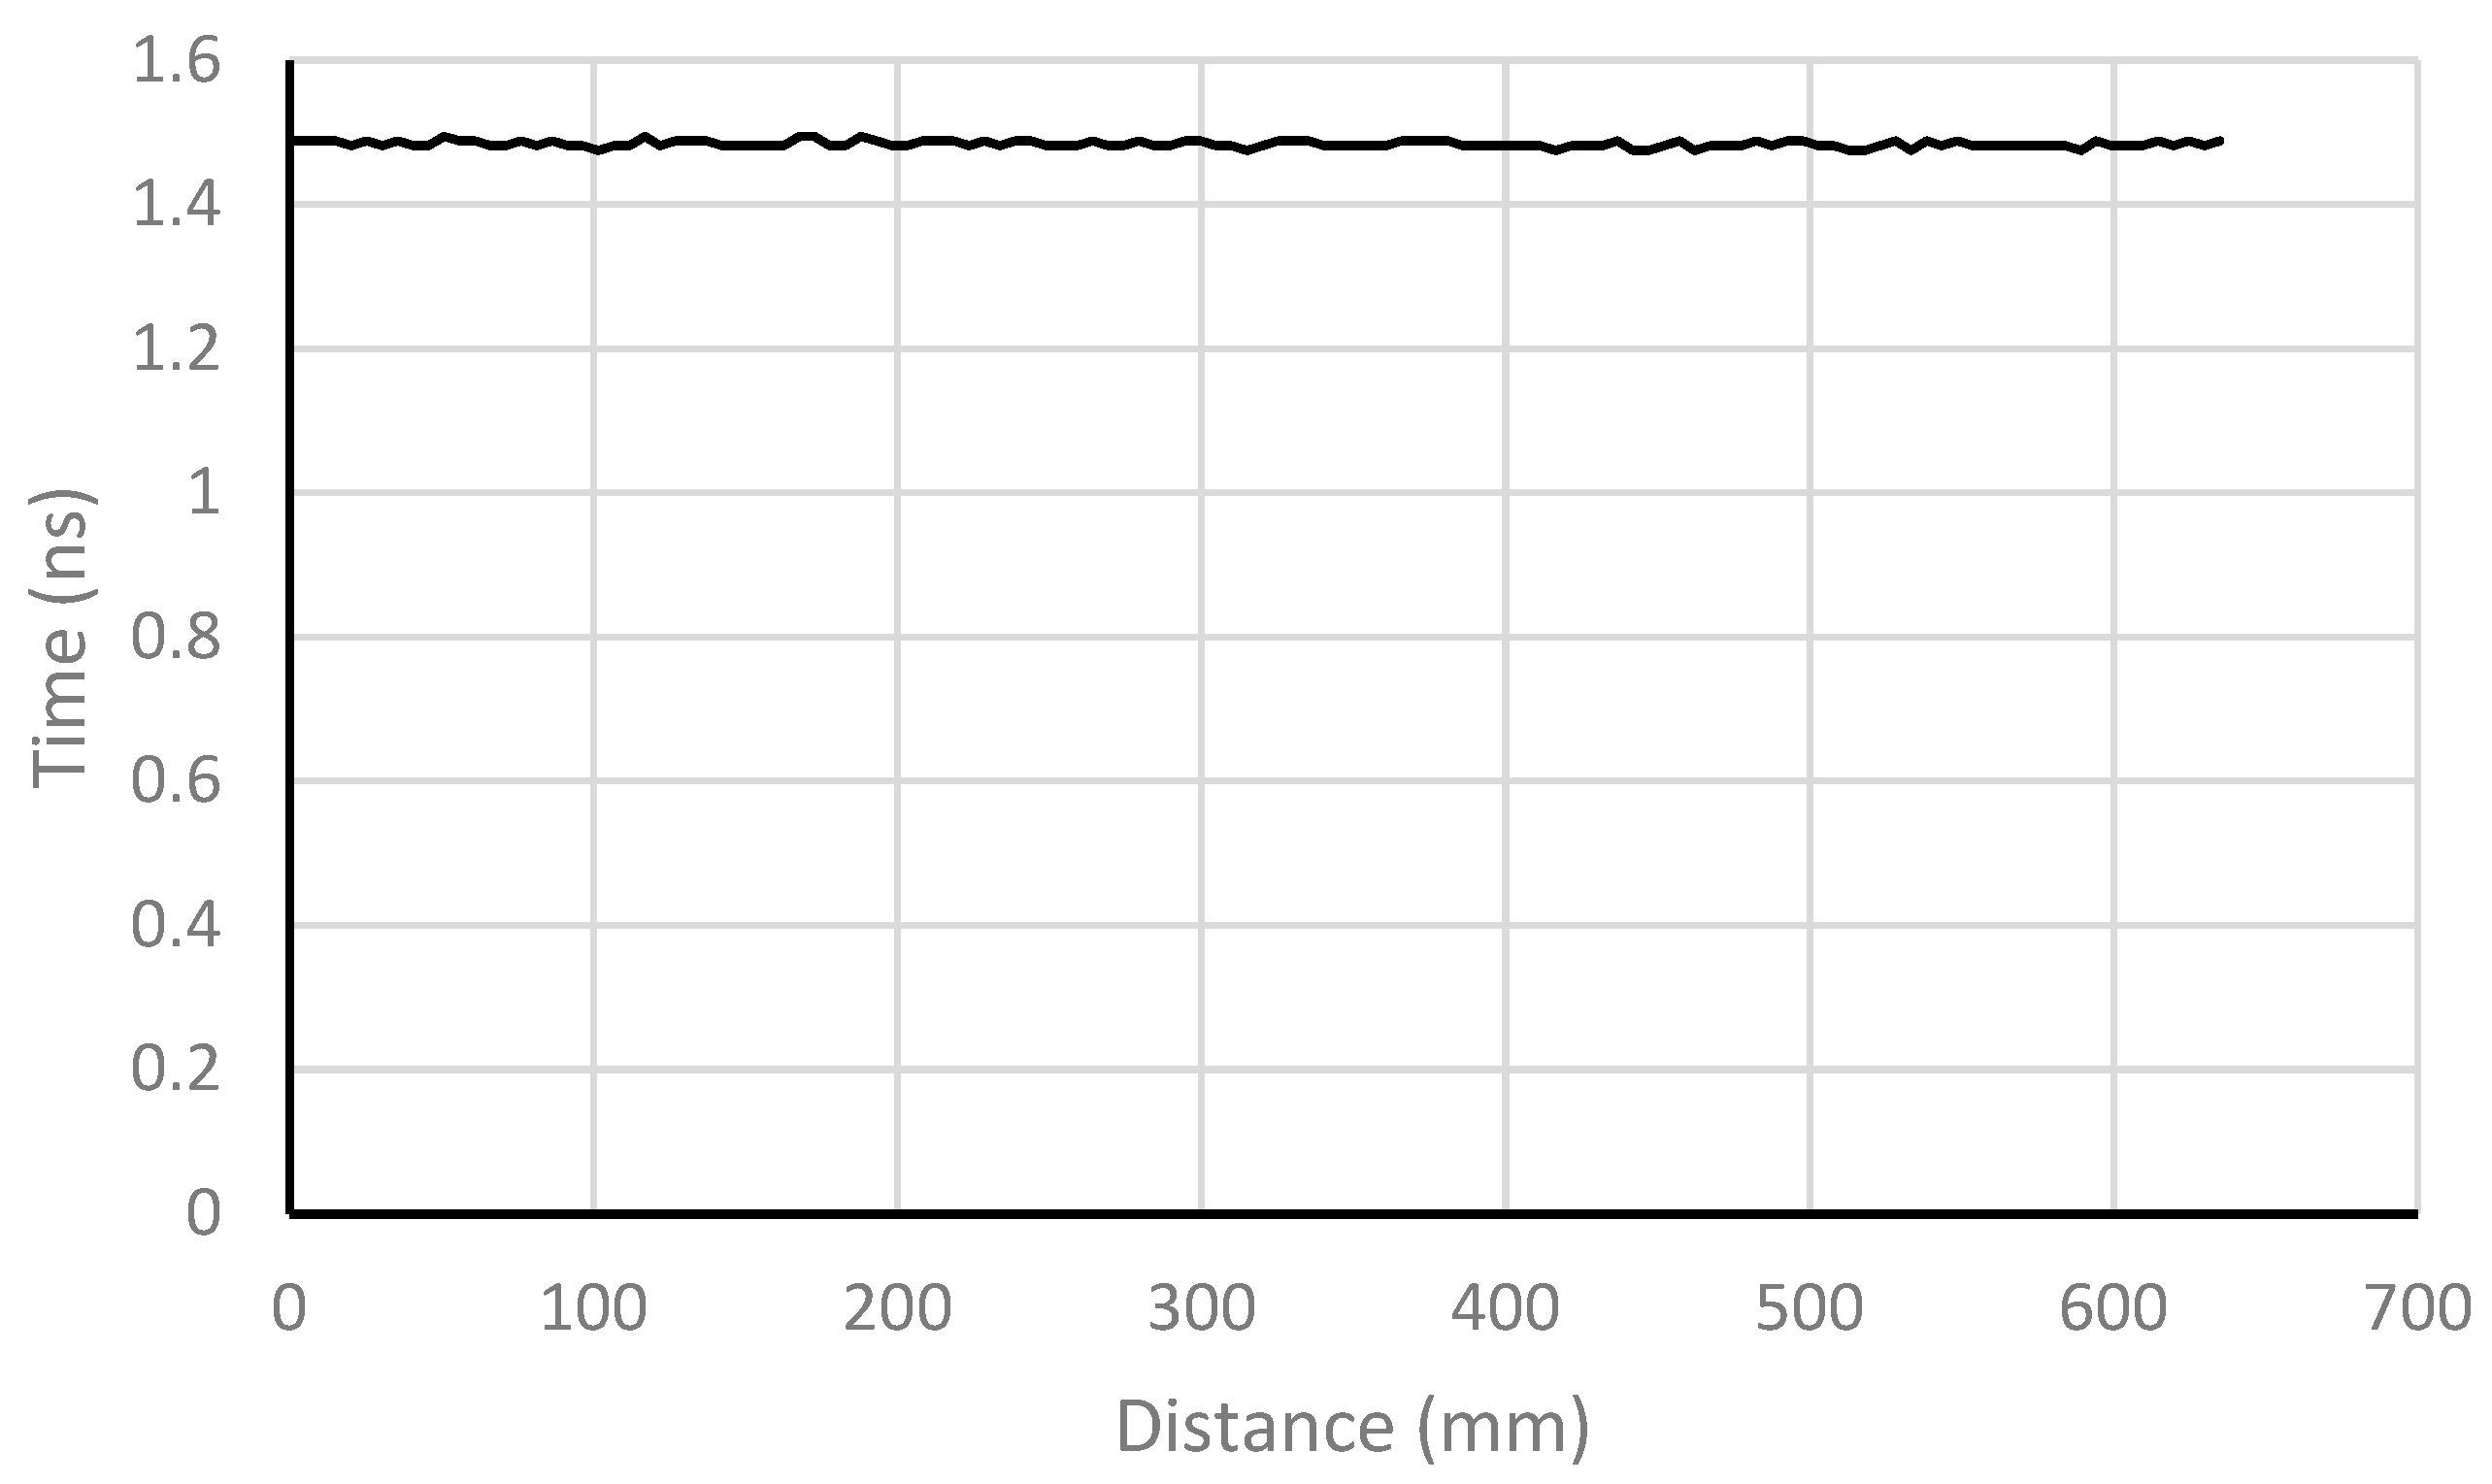
Figure 7.
Biquadratic approximation.
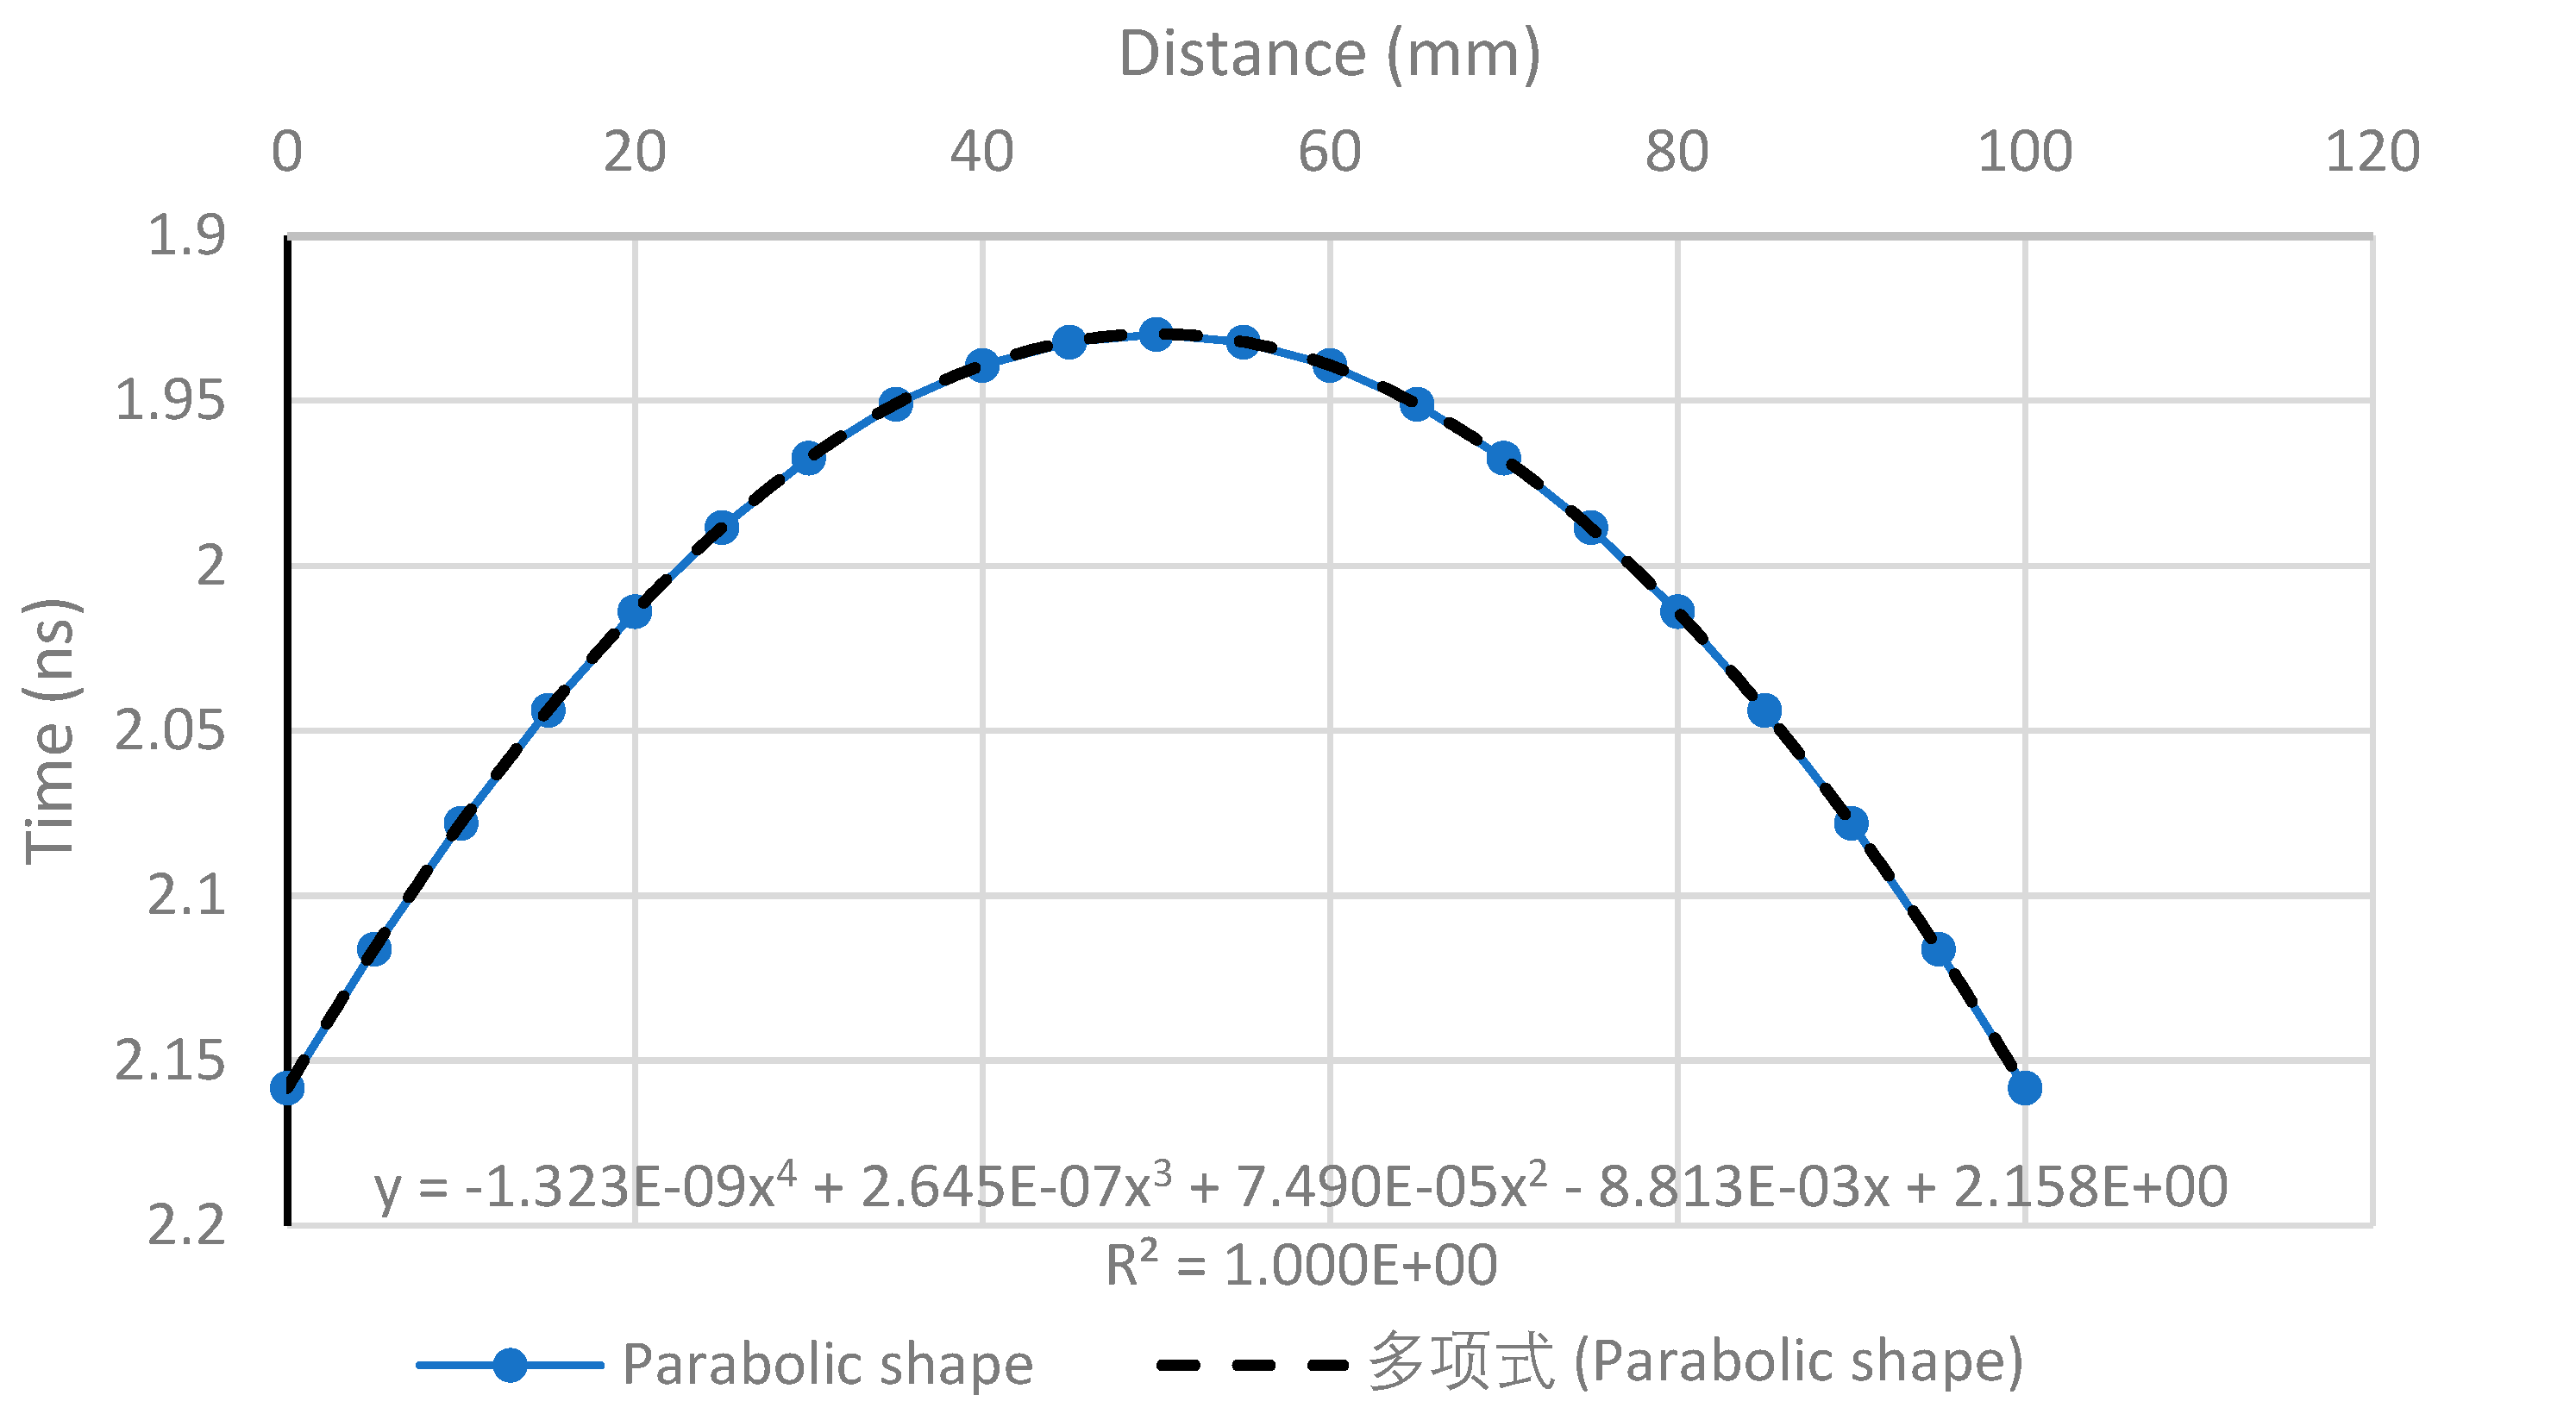
Figure 8.
Radargram of the S1.
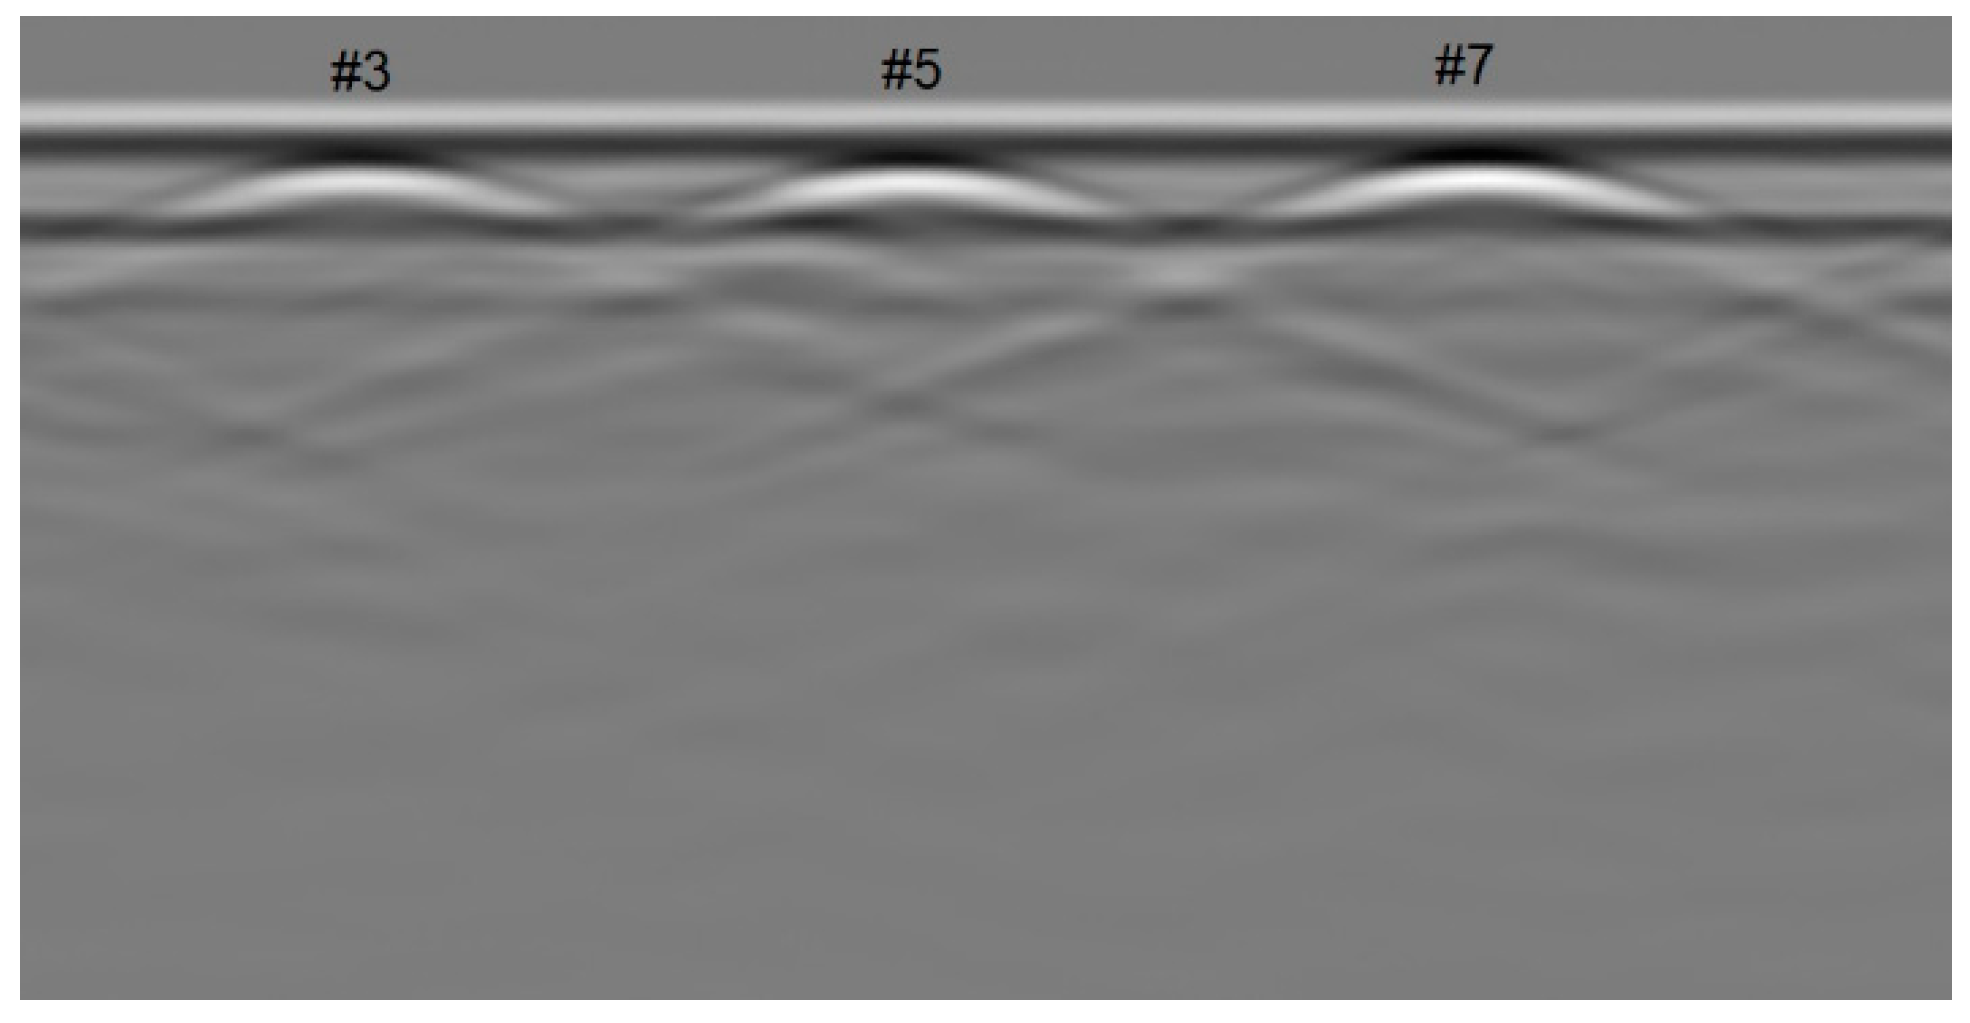
Figure 9.
Best fit curves for rebars in S1.
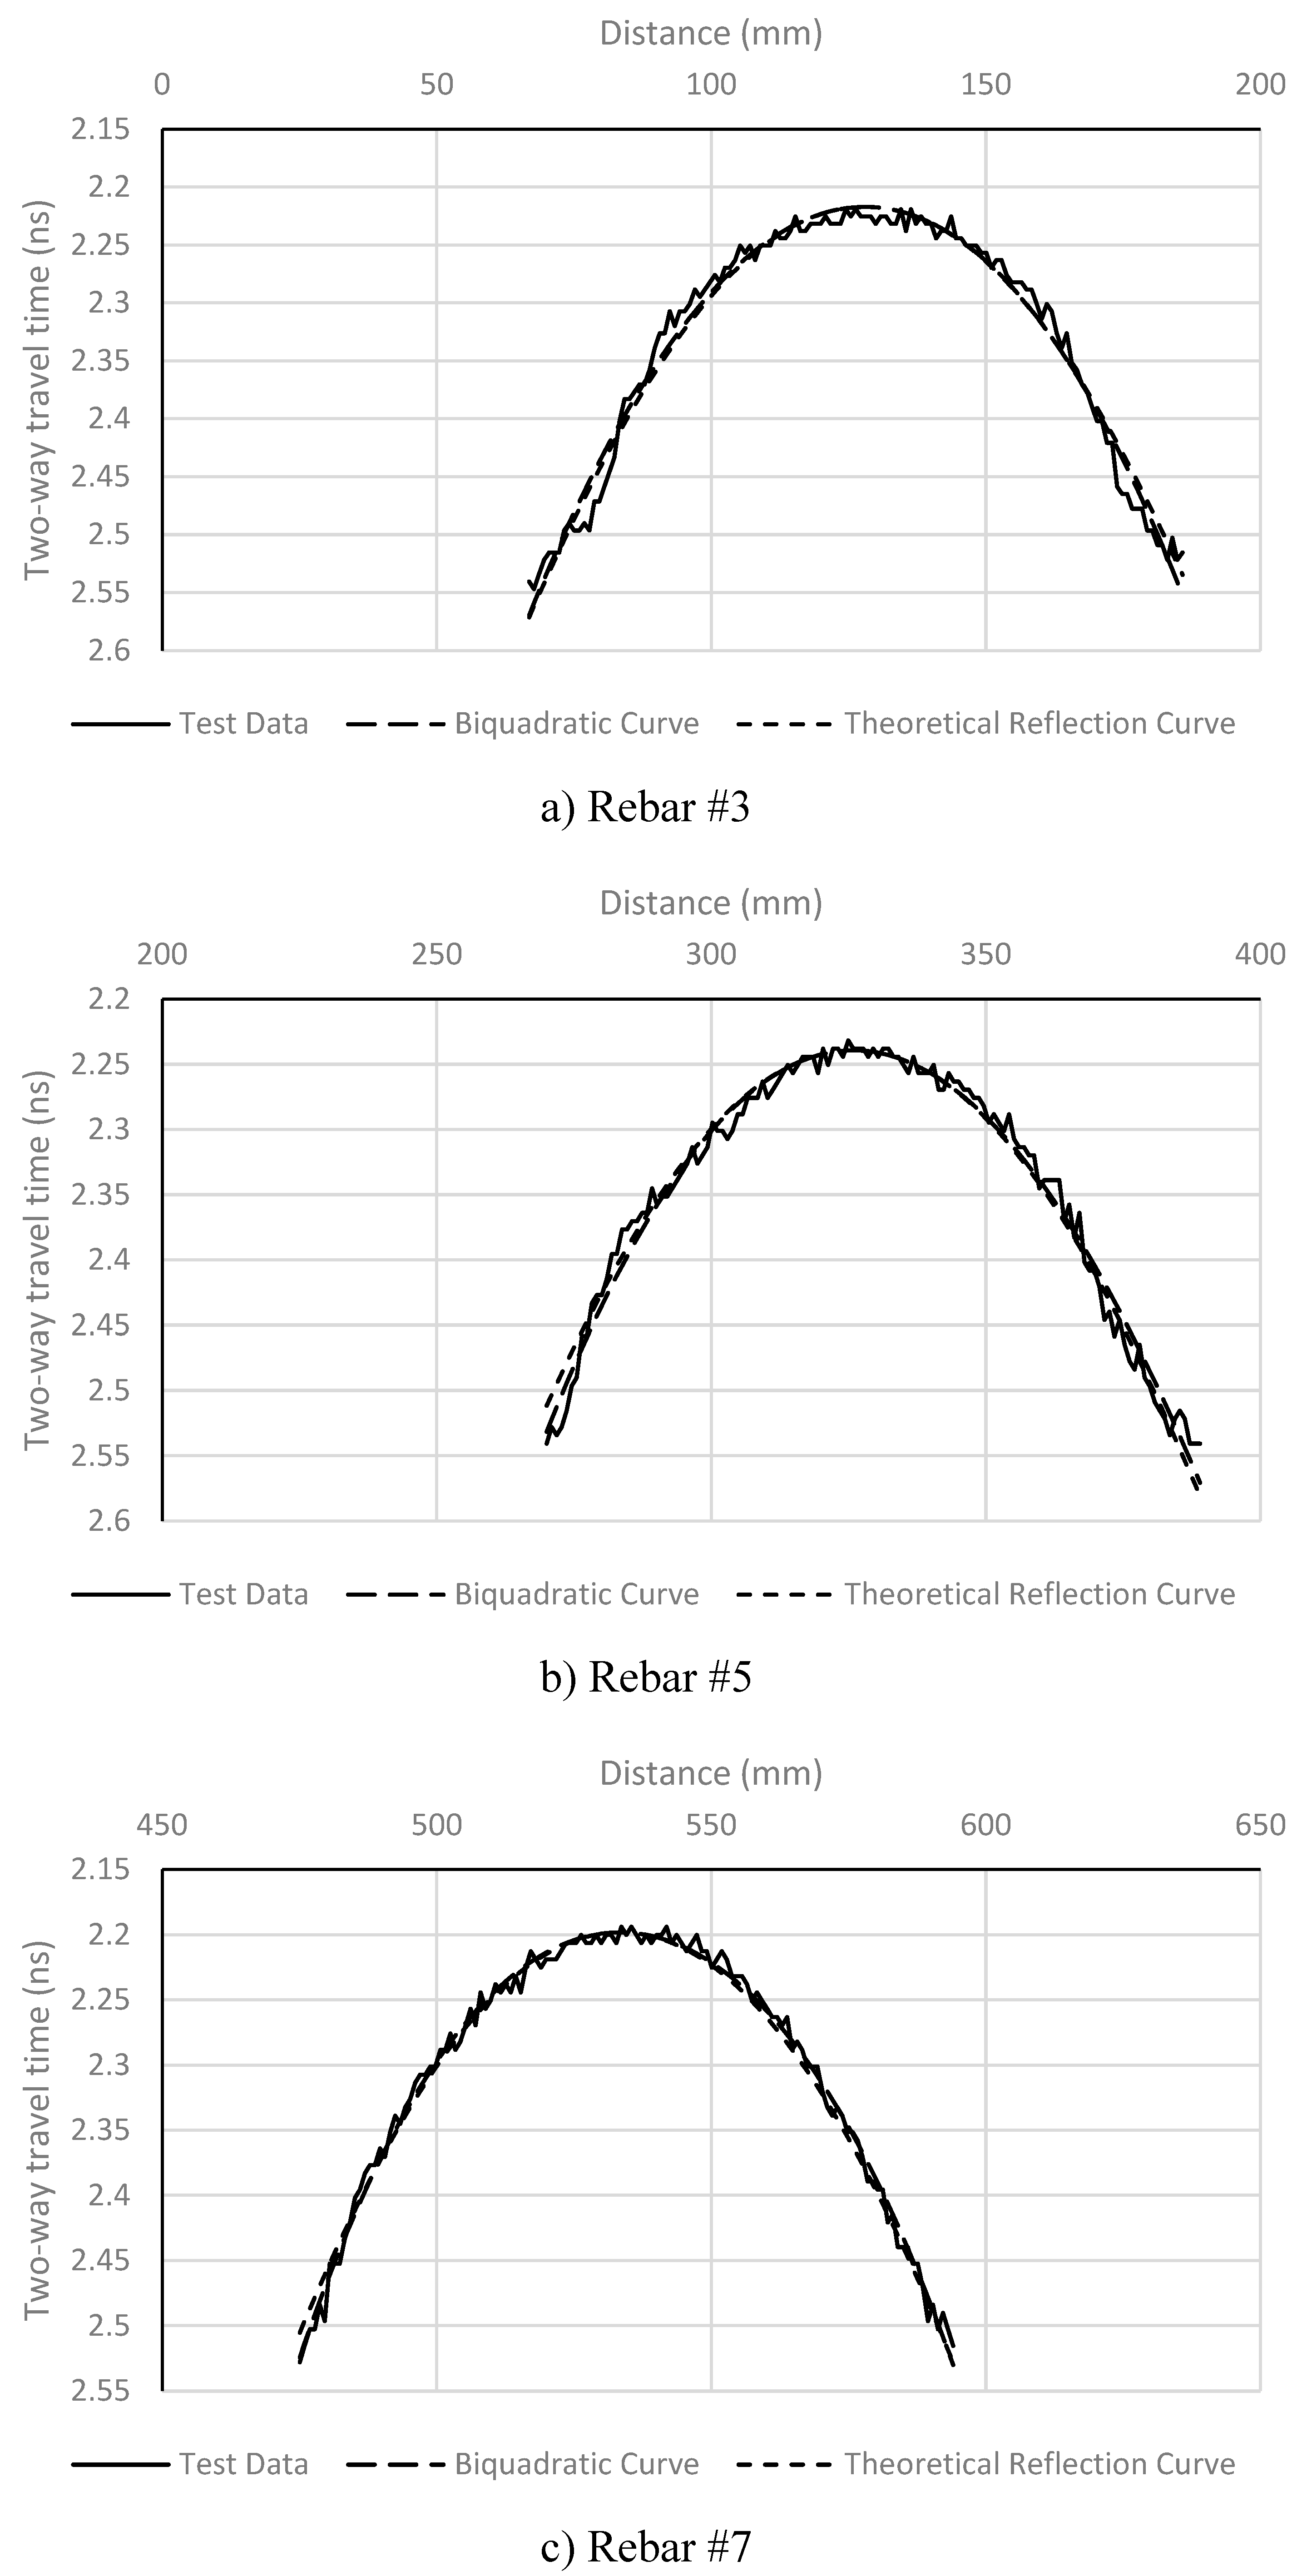
Figure 10.
Analysis results for S1.
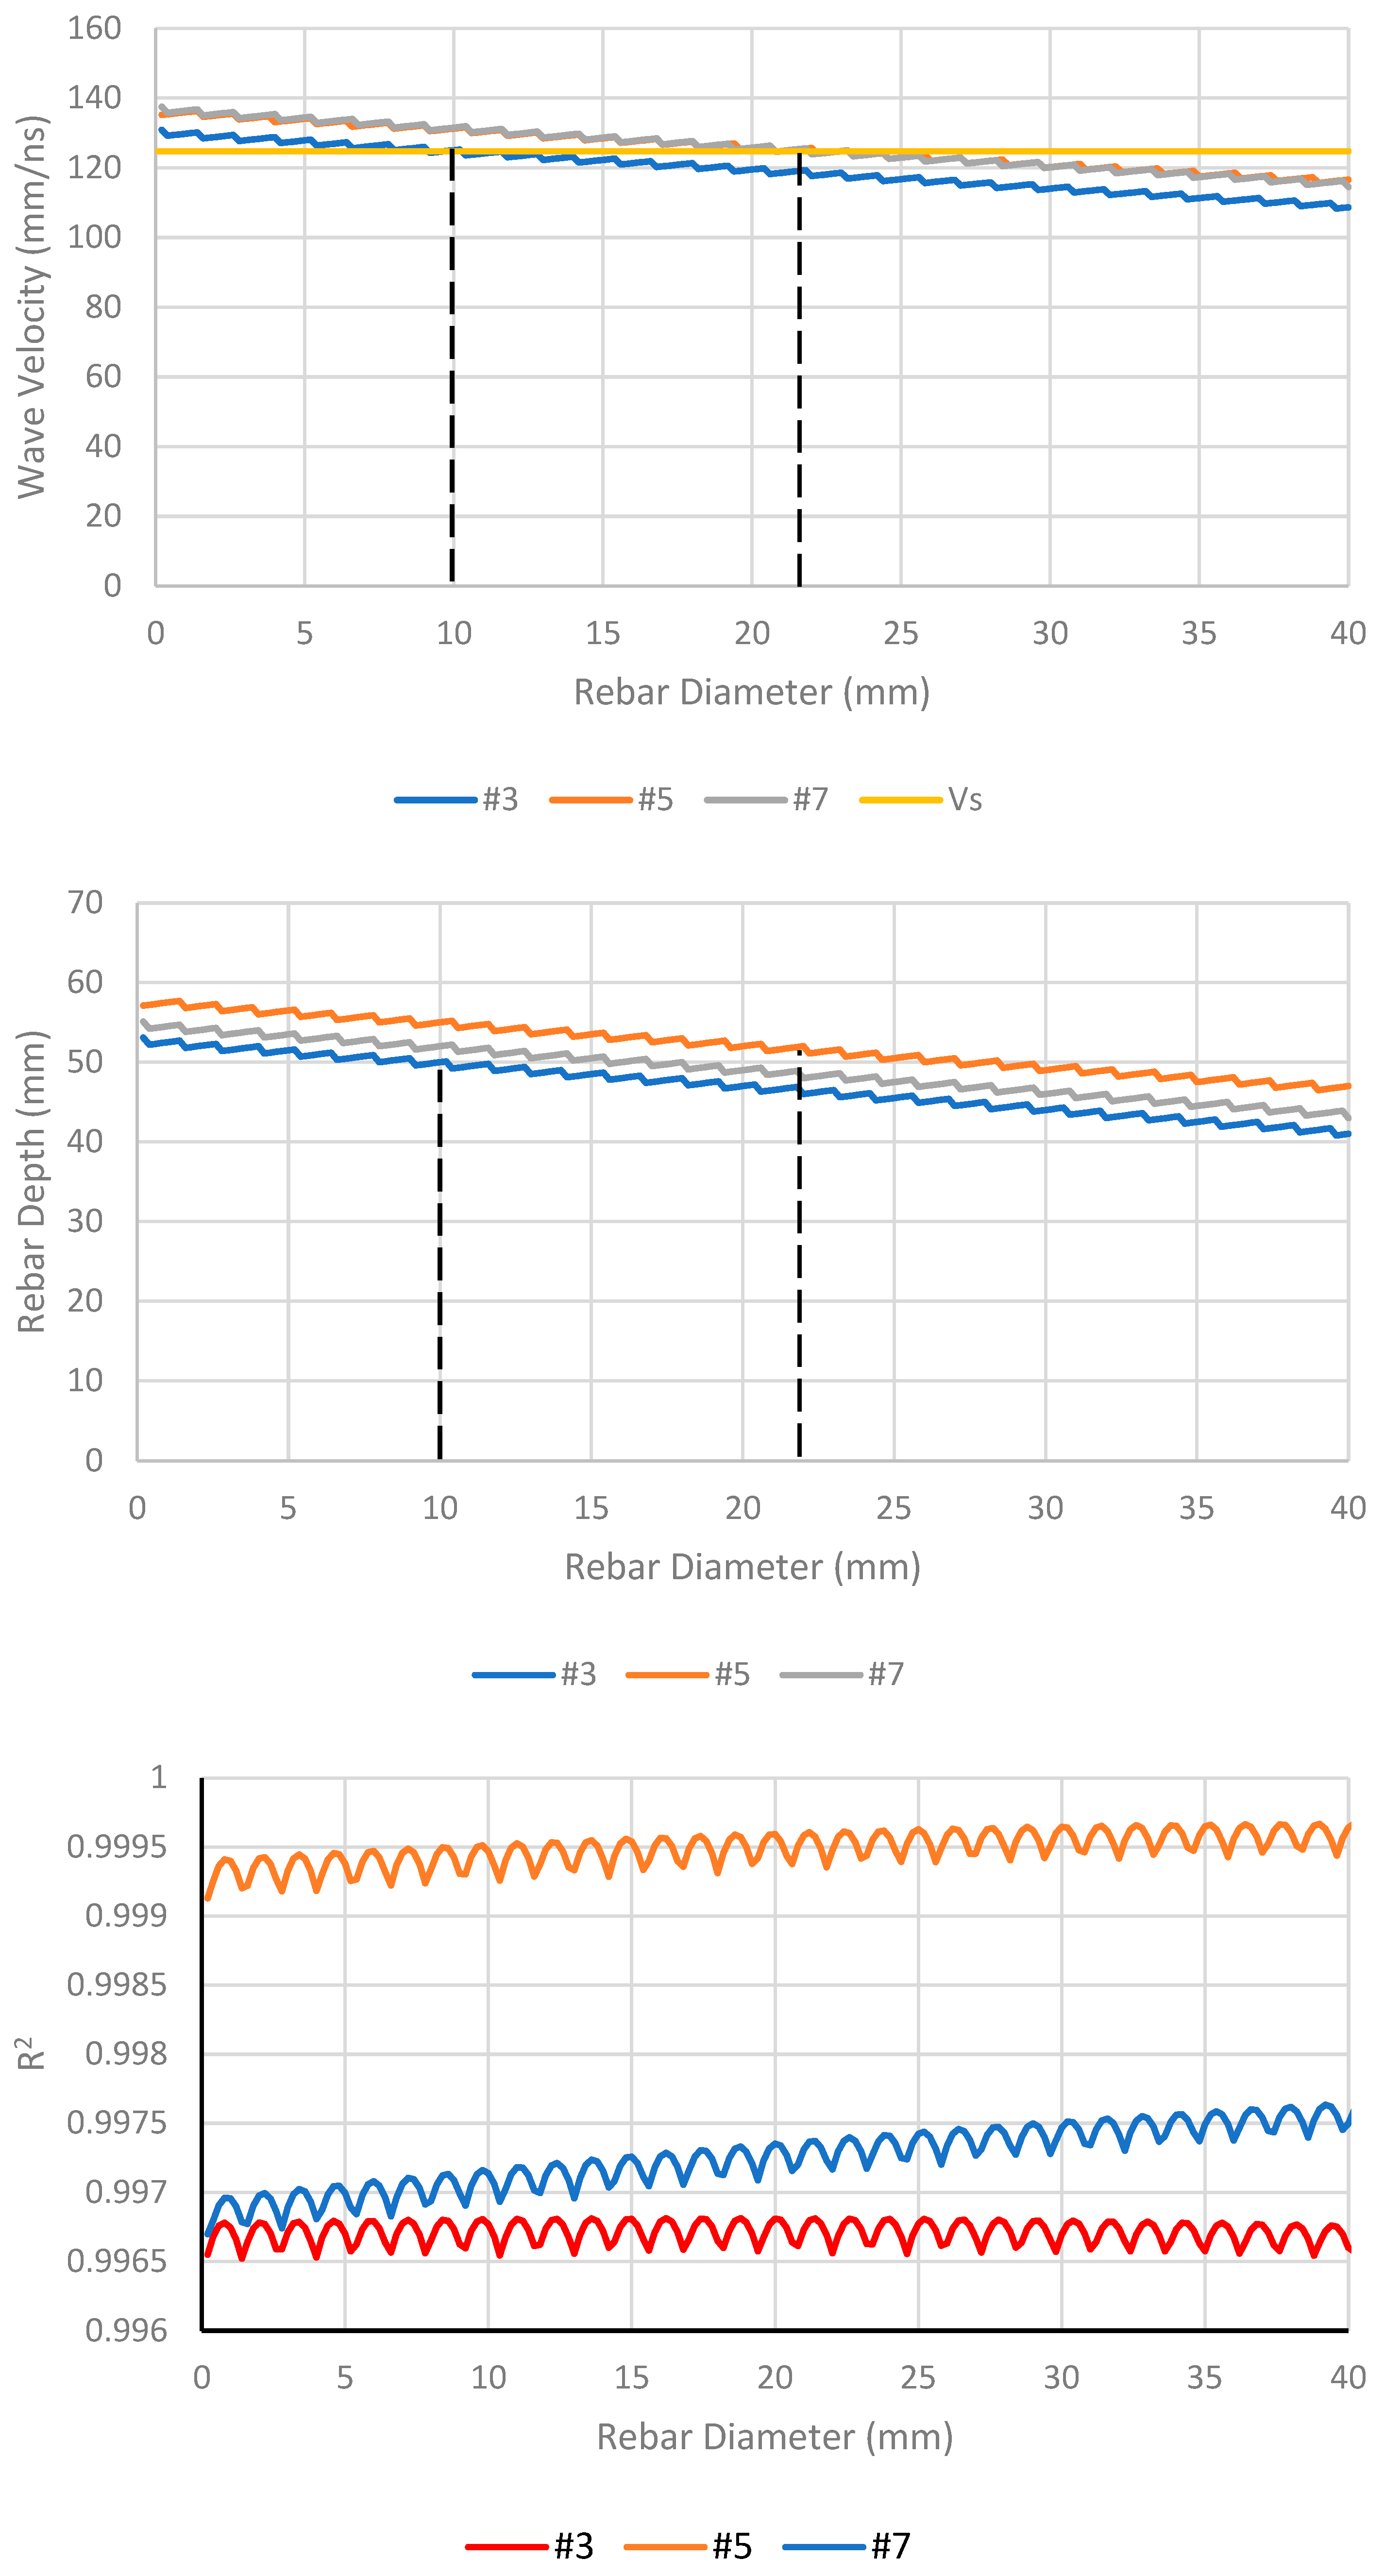
Figure 11.
Radargram of the S2.
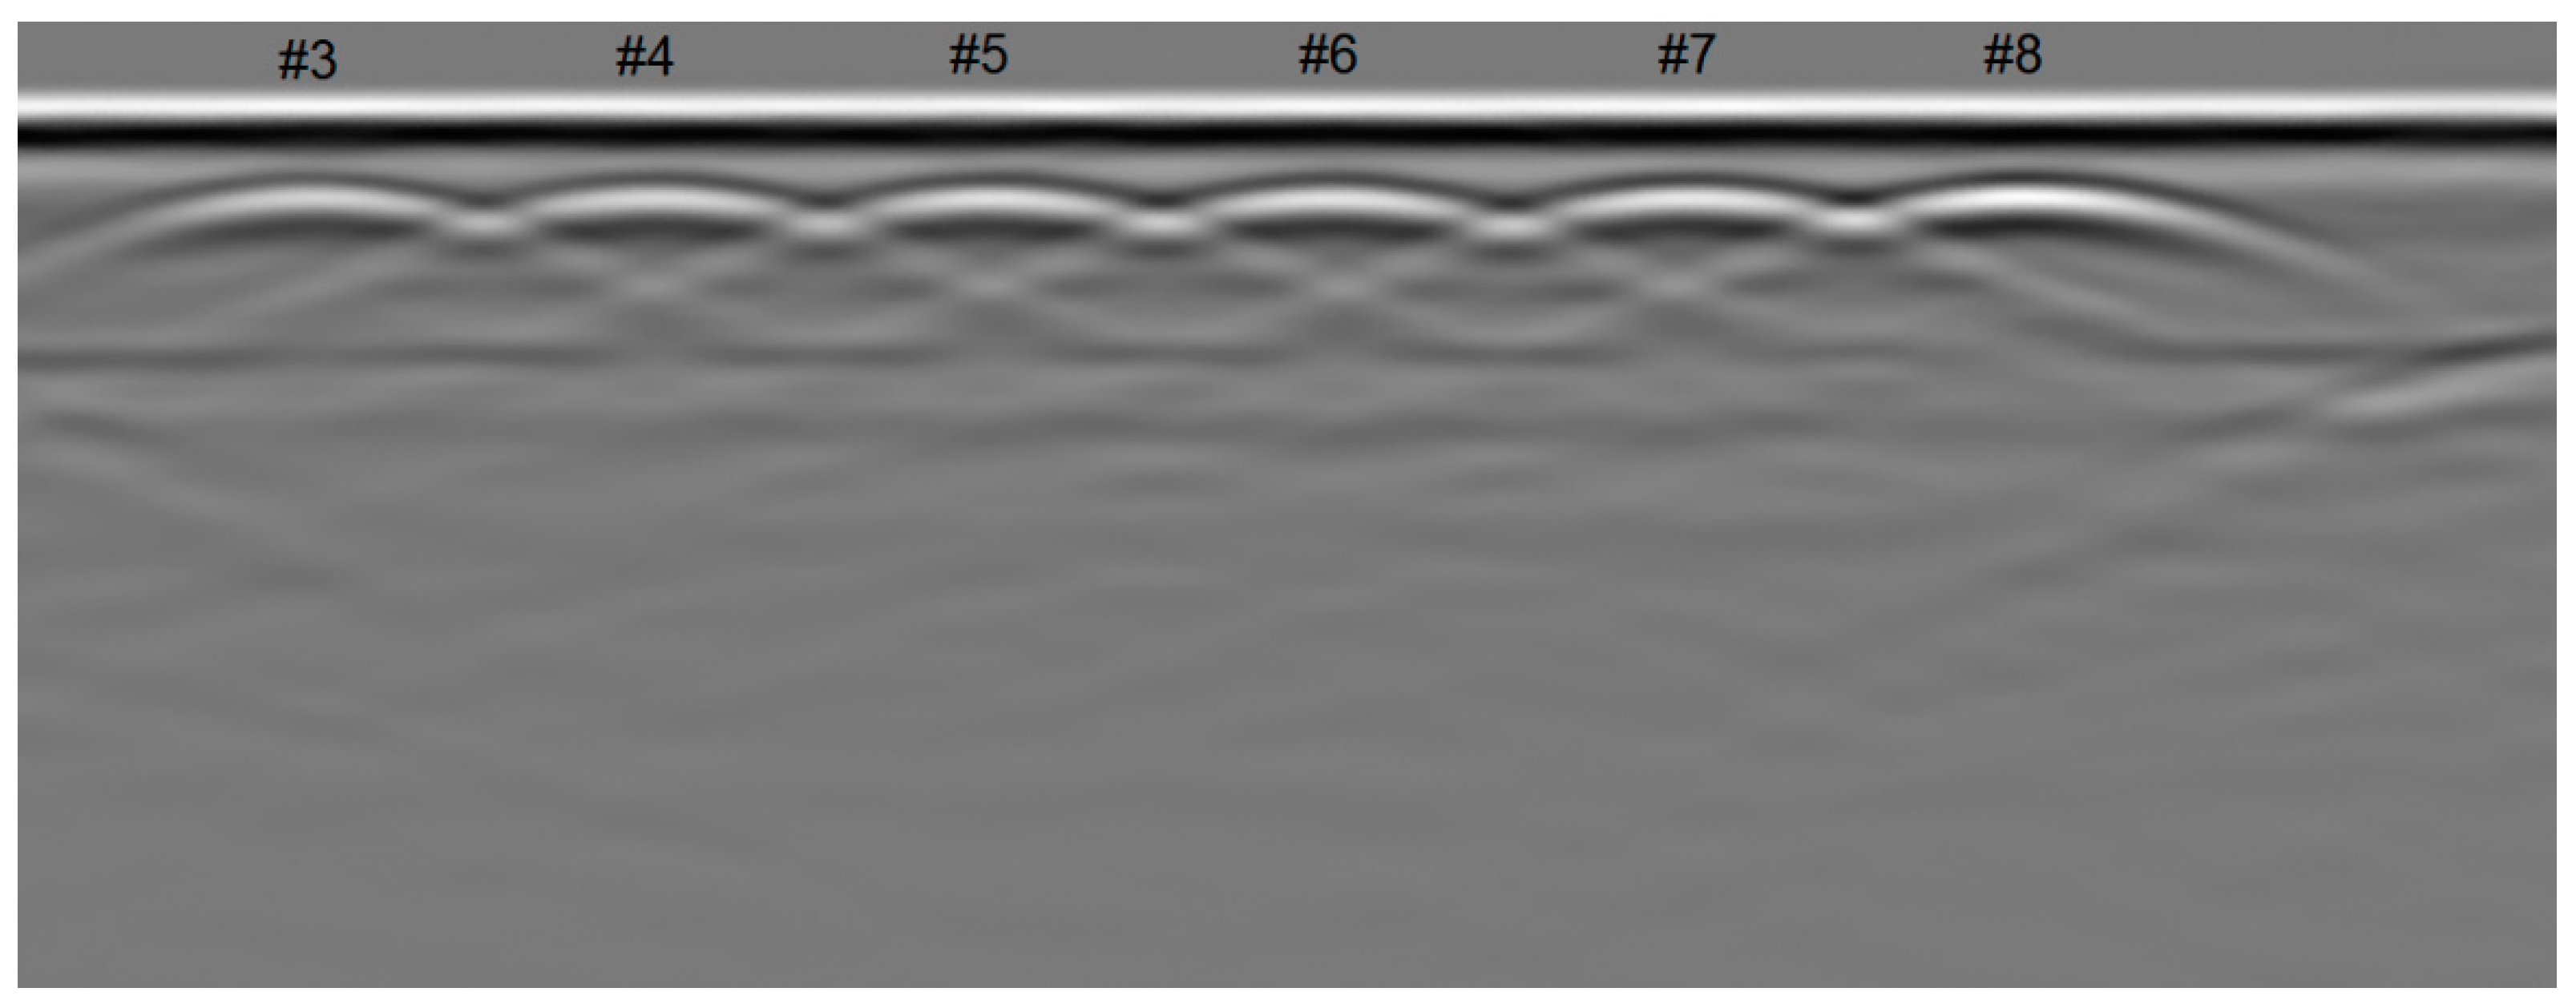
Figure 12.
Analysis results for SPC1.
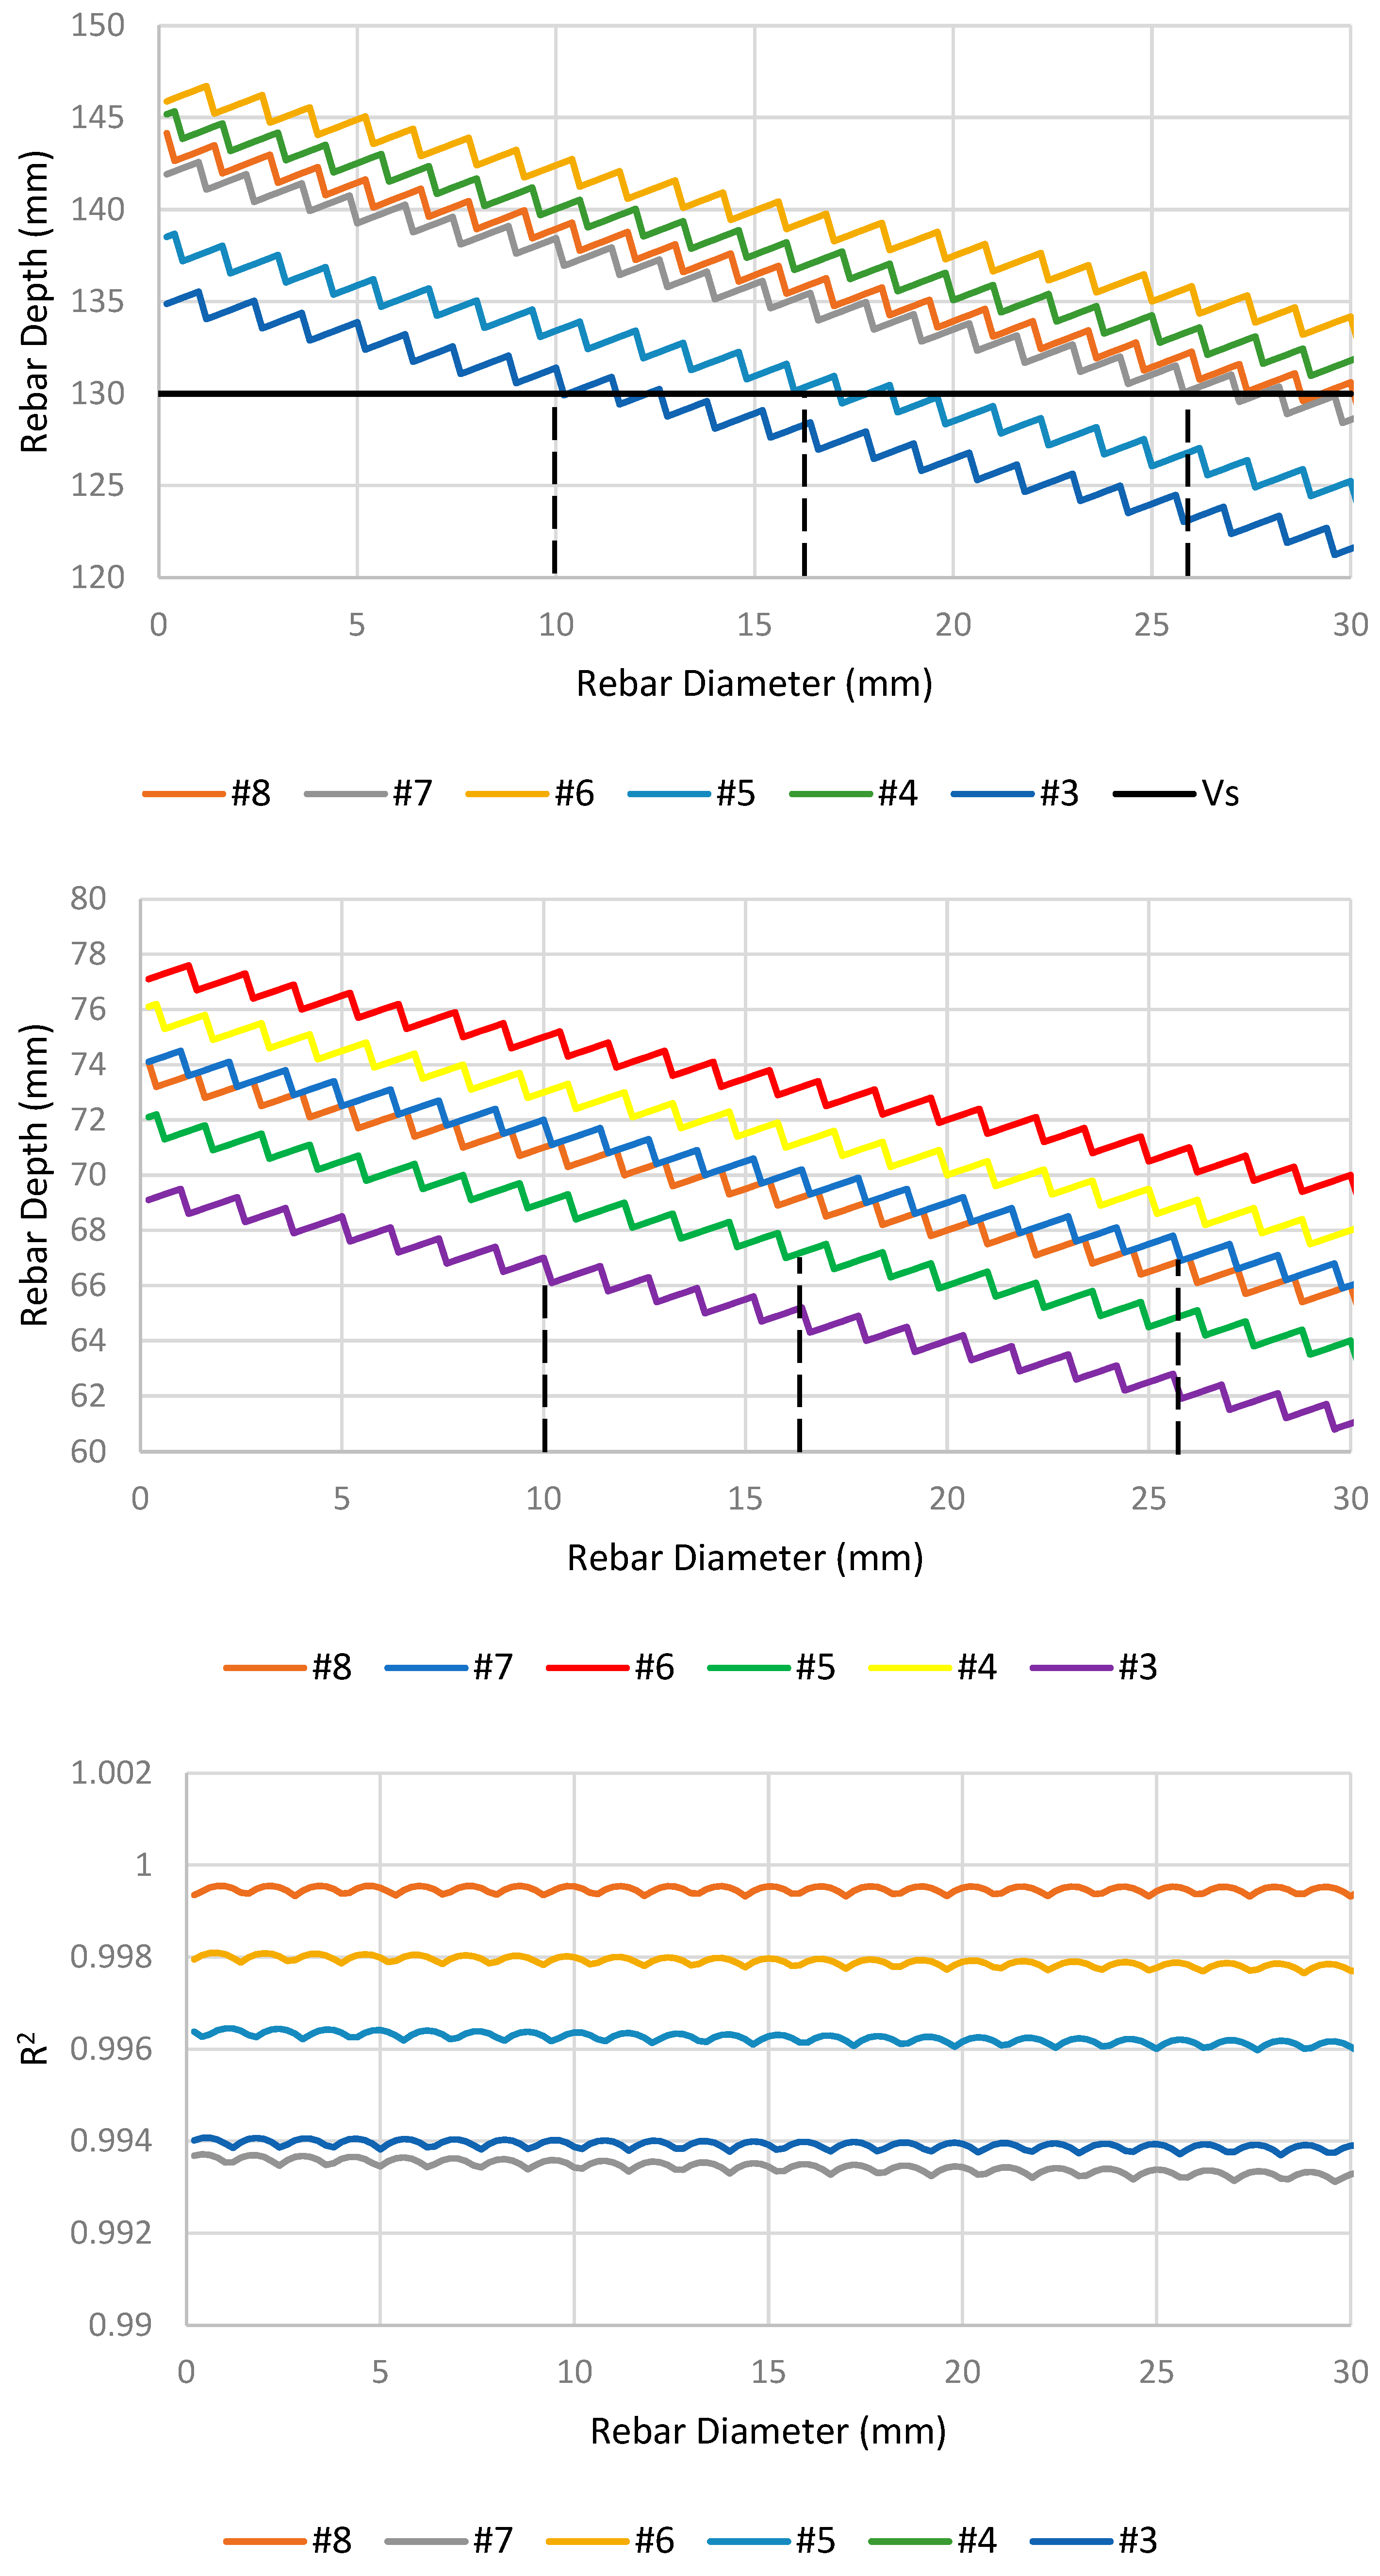

Table 1.
Parameters of the GPR device.
| Parameters | Unit | Value | Description |
|---|---|---|---|
| SPN | - | 512-16384 | Samples per scan |
| SPD | - | Varies | Scan per second |
| SPM (Ns) | - | 196.85-1000 | Scan per meter |
| Top position | m | 0.08 | Level of the antenna |
| Range | m | 0.8 | Scan depth |
| Scan spacing | mm | Varies | Scan spacing in a scan line |
| Antenna frequency | GHz | 1.6 | |
| T-R offset | mm | 58 | Distance between transmitter and receiver |
Table 2.
Rebar diameters and depths for S1.
| Actual diameter/depth(mm) | Calculated diameter/depth(mm) | Diameter differences (%) | Depth differences (%) |
|---|---|---|---|
| 9.525/50.8 | 10/50 | 4.99 | -1.57 |
| 15.875/50.8 | 15/53.5 | -5.51 | 5.31 |
| 22.225/50.8 | 22/48 | -1.01 | -5.51 |
Table 3.
Rebar depth with zero diameter assumption for S1.
| Location | Depth (mm) | Wave velocity (mm/ns) |
|---|---|---|
| Rebar #3 | 53 | 130.7 |
| Rebar #5 | 58 | 136.9 |
| Rebar #7 | 55 | 137.3 |
Table 4.
Rebar diameter and depth for S2.
| Actual diameter/depth (mm) | Calculated diameter/depth (mm) | Diameter differences (%) | Depth differences (%) |
| 9.525/62.5 | 10/66 | 5.0 | 5.6 |
| 15.875/62.5 | 15/67 | 7.9 | 7.2 |
| 22.225/62.5 | 26/67 | 16.9 | 7.2 |
| 25.4/62.5 | 26/67 | 2.4 | 7.2 |
Disclaimer/Publisher’s Note: The statements, opinions and data contained in all publications are solely those of the individual author(s) and contributor(s) and not of MDPI and/or the editor(s). MDPI and/or the editor(s) disclaim responsibility for any injury to people or property resulting from any ideas, methods, instructions or products referred to in the content. |
© 2024 by the authors. Licensee MDPI, Basel, Switzerland. This article is an open access article distributed under the terms and conditions of the Creative Commons Attribution (CC BY) license (http://creativecommons.org/licenses/by/4.0/).
Copyright: This open access article is published under a Creative Commons CC BY 4.0 license, which permit the free download, distribution, and reuse, provided that the author and preprint are cited in any reuse.


