1. Introduction
Glioblastoma (GBM) is the most common malignant primary brain cancer and the invasion capacity is a key factor for its agressiveness 1,2. GBM cell migration and invasion are highly dynamic processes and involve, among others, the reorganization of the cytoskeleton 3,4. We have shown that overexpression of the transmembrane protein ODZ1 in GBM primary cells increased the invasiveness of these cells by promoting cytoskeletal remodelling 3. Furthermore, disruption of ODZ1 protein by deleting the intracellular domain or blocking its expression significantly decreased the invasive capacity of tumor cells. ODZ1 has been related to different tumors through a chromosomal translocation involving exon 2 of C11orf73 and intron 19 of ODZ1. The fusion transcript is expected to trigger a nonsense-mediated decay mechanism resulting in mRNA degradation 5. We identified a deletion of the entire ODZ1 gene in a patient with GBM 3 and cells from this patient had a deficiency in cytoskeletal organization. Thus, ODZ1-deficient cells are unable to form long actin-filled protrusions and have lower migration and invasion capacities. Invasiveness is a key hallmark of GBM causing tumor recurrence, generally in close proximity to the original tumor site 4. However, targeting the invasive pathways of GBM, including cytoskeletal reorganization, cell migration and degradation of the extracelular matrix have not reached the stage of clinical development 4,6. One way to improve the therapeutic intervention is to understand the interacting network between GBM cells and their microenvironment. ODZ1 can be upregulated by a number of pathways involved in GBM pathogenesis. Hypoxia is one of the main biological hallmarks of the GBM microenvironment and it is associated with higher levels of ODZ1 through epigenetic and HIF2α-mediated transcriptional mechanisms 7,8. Moreover, IL-6 secreted by activated monocytes and the extracellular matrix protein fibronectin promote the expression of ODZ1 via activation of a Stat3-mediated transcriptional pathway 9. This might be another relevant strategy for tumor cells to induce migration, since immune cells, including activated monocytes/macrophages, comprise a significant amount of cells in GBM tumors. However, ODZ1 has not been linked to the epidermal growth factor receptor (EGFR), a key player in tumor malignancy in several cancer types, including GBM, and a target for therapeutic interventions 10. However, although EGFR inhibitors have been successful in other cancers, their application in GBM have not achived the same degree of success partly due to the blood-brain barrier and intrinsic resistance 10,11. Thus, deciphering potential paths forward to target the EGFR pathway may open new opportunities for therapies against GBM.
In this study, we showed that the invasion factor ODZ1 is upregulated by an EGFR-p38 MAP kinase signaling pathway that might explain, at least in part, the higher migration capacity of GBM cells in the presence of EGF, which is highly reduced through blockade of this pathway.
2. Materials and Methods
2.1. Cell Cultures
IDH1/2 wild type primary GBM cell lines used in this study were previously established from surgical specimens in our laboratory 12. Tumor cells were maintained as neurospheres in serum-free DMEM/F12 medium (Invitrogen, Carlsbad, CA, USA) and plated at a density of 3×10⁶ live cells/60-mm plate. Neurospheres were dissociated every 4–5 days to facilitate cell growth. Cells were used between passages 10 and 20. All cells were confirmed to retain their differentiation capacity, mainly towards astrocytes, reducing the stem cell markers CD133 and Sox2, and increasing the astrocytic marker GFAP as described 12. When indicated, GBM cells were incubated in the presence of 50 ng/ml EGF (Sigma-Aldrich, St Louis, MO, USA), with or without 2 μg/ml Cetuximab (Merck KGaA, Darmstadt, Germany) or 10μM SB203580 (Sigma-Aldrich).
All cells were tested for mycoplasma using the LookOut Mycoplasma qPCR Detection Kit (Sigma-Aldrich) within one week before the experimental work.
2.2. Analysis of RNA-Seq Data from the TCGA Database
We analyzed the ODZ1 gene expression according to EGFR mutational status in 214 GBM samples by using RNAseq data from The Cancer Genome Atlas (TCGA) database following a protocol previously reported 13. All single nucleotide mutations and insertions/deletions (indels) of the EGFR gene were included.
2.3. Gene Expression Analyses
The expression of individual genes was evaluated by qPCR on total cellular RNA as previously described 3. cDNA was generated and amplified using the following primers: β-Actin (5′GCGGGAAATCGTGCGTGACATT and 5′GATGGAGTTGAAGGTAGTTTCGTG), ODZ1 (5′ACTCAAGAGATGGAATTCTGTG and 5′CTTAGTGCATGGTCAGGTG), MAPK14 (5′CCAGGGGCTGAGCTTTTGAA and 5′TCGGCCACTGGTTCATCATC), MAPK11 (5′AGGAGCTGAACAAGACCGTG and 5′ACACTTCGCTGAAGTCCTCG). qPCR was performed in a QuantStudio 5 real-time PCR system (Life Technologies, Carlsbad, CA, USA).
2.4. PCR-Based Discrimination of EGFR Variants
The deletion of exons 2-7 of EGFR that characterizes the EGFRvIII mutant variant of the receptor was analysed by cDNA amplification with primers in exon 1 (5′GAGTCGGGCTCTGGAGGAAA) and exon 8 (5′CCATCTCATAGCTGTCGGCC) which amplify fragments of 893 bp (wild type EGFR) and 92 bp (EGFRvIII). Fragments were detected by agarose gel electrophoresis after 35 cycles of amplification with an annealing temperature of 60oC.
2.5. Flow Cytometry
Cells collected from culture flasks were washed with phosphate buffer saline containing 3% bovine serum albumin (Sigma-Aldrich) and then incubated with anti-EGFR antibody labelled with Alexa Fluor 488 (AY13, Biolegend, San Diego, CA, USA). Stained cells were analysed in a FACS Canto II flow cytometer (BD Biosciences, La Jolla, CA, USA).
2.6. Western Blot Analysis
Total protein from GBM cells were separated on 8% polyacrylamide gels and transferred to nitrocellulose. Blots were incubated with antibodies against pMAPKAPK2-Thr222 (9A7, Cell Signaling, Danvers, MA, USA), MAPKAPK2 (D1E11, Cell Signaling), p38α/β MAPK (Y122, Abcam, Cambridge, UK), ODZ1 (AF6324, R&D Systems, Minneapolis, MN, USA) and αTubulin (B-5-1-2, Santa Cruz Biotechnology. Santa Cruz, CA, USA), followed by secondary anti-rabbit, anti-sheep or anti-mouse antibodies conjugated to horseradish peroxidase (Santa Cruz Biotechnology). When indicated protein bands were quantitated by using ImageJ software (Windows version of NIH Image,
https://imagej.net/ij/).
2.7. Detection of EGFR Gene Amplification
EGFR amplification was determined by using the SALSA MLPA Probemix P135 (MRC Holland, Amsterdam, The Netherlands) following the manufacturer’s instructions. This probemix includes 30 MLPA probes for the EGFR gene, covering all EGFR exons except exon 11. The resulting fragments were separated by capillary electrophoresis using a SeqStudio analyser (Applied Biosystems, Waltham, MA, USA).
2.8. Gene Silencing
For MAPK11/14 knockdown experiments, we used 3 unique 27mer siRNA duplexes specific for either MAPK11 (Locus ID 5600) or MAPK14 (Locus ID 1432) and scrambled negative control siRNA duplexes (all from Origene, Rockville, MD, USA). Cells were transfected with 50 pmol siRNAs by using Lipofectamine RNAiMAX (Invitrogen) and 48h later protein expression was analized by western blotting.
2.9. Statistical Analysis
All statistics were calculated with the SPSS statistical package (version 13.0). Data are presented as mean ± SD of three independent experiments. Differences between groups were tested for statistical significance using the unpaired 2-tailed Student’s t-test. The significance level was set at p< 0.05.
3. Results
3.1. Activation of EGFR Correlates with the Expression of ODZ1
The constitutively active mutant EGFRvIII is one of the most commonly detected gene variants in GBM
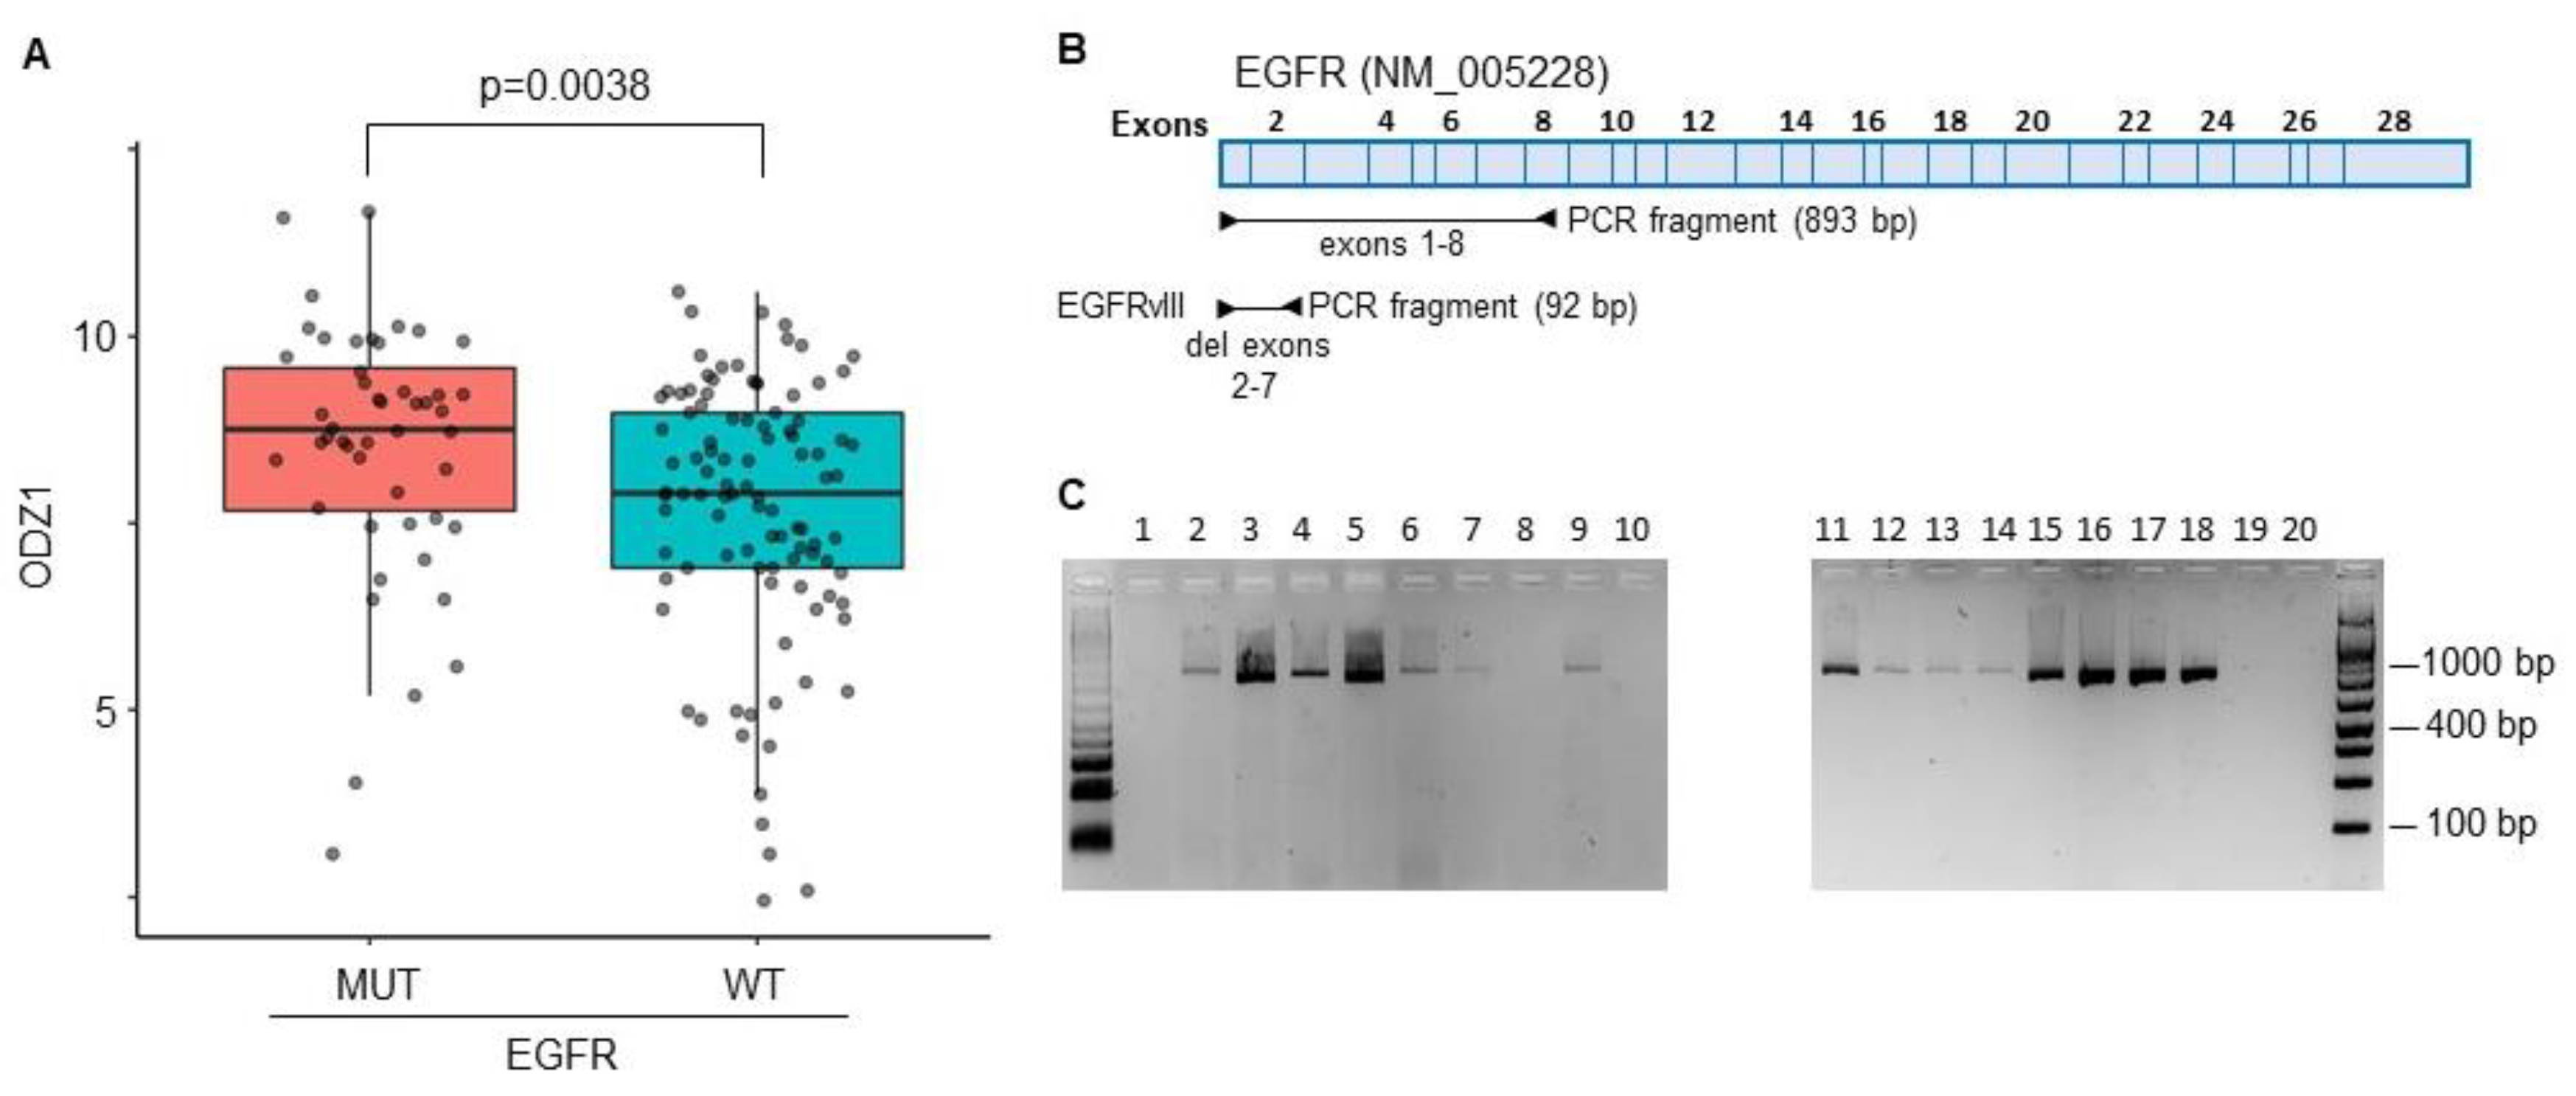
14. A correlation between EGFRvIII and ODZ1 expression was identified from RNA-seq data in the TCGA datasets that provided information of a GBM cohort containing 214 patient samples. Patients with GBM cells carrying the mutant version of EGFR expressed higher levels of ODZ1 mRNA than those with wild type EGFR (
Figure 1A).
We analysed the presence of EGFRvIII in 20 different GBM cell cultures derived from surgical specimens by using a PCR approach with primers flanking exons 2-7 (
Figure 1B). The deleted variant renders a PCR fragment of 92 bp while with the reference allele we observe a fragment of 893 bp. We could not detect the presence of the deleted variant in any of the cell lines (
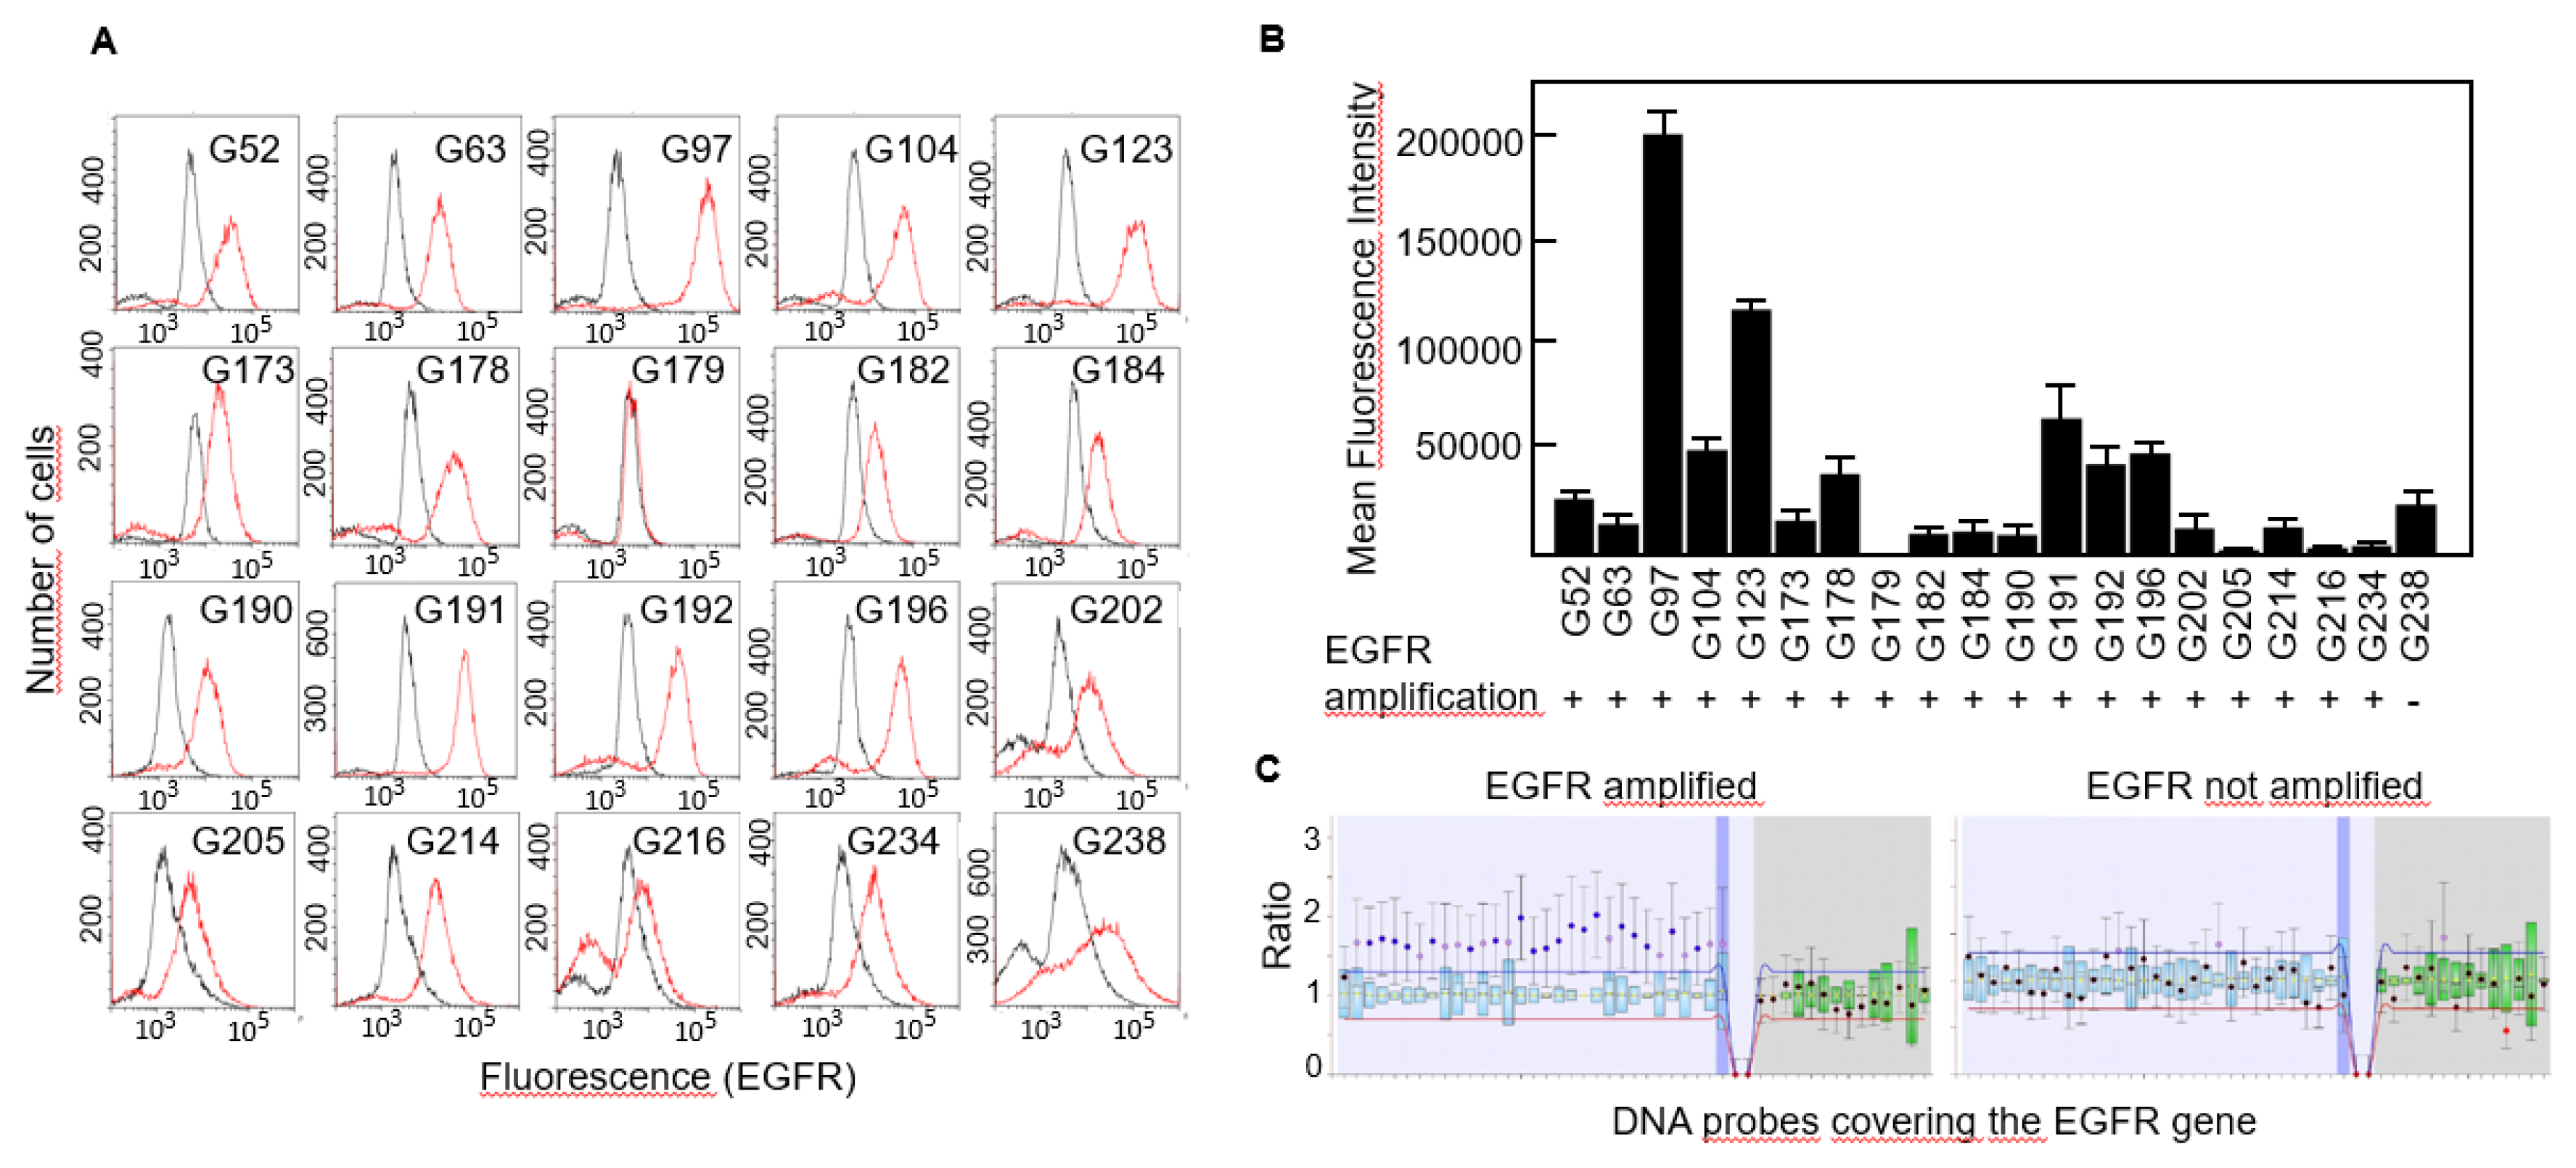
Figure 1C), not even following overamplification with high number of PCR cycles (data not shown). Then, we studied the expression of EGFR protein in all 20 cell lines by flow cytometry and found that virtually all of them expressed the receptor although the levels were significantly different, from almost no expression in G179 to the highly positive G97 cells (
Figure 2A,B).
EGFR amplification has been identified as a genetic hallmark of primary GBM and occurs in approximately 40-60% of these cases
15. We performed MLPA analyses to detect copy number variations of the EGFR gene in all cell lines and found that all of them but one carried an amplified variant of the gene (
Figure 2B,C).
3.2. ODZ1 Is Upregulated through an EGF-p38 Pathway
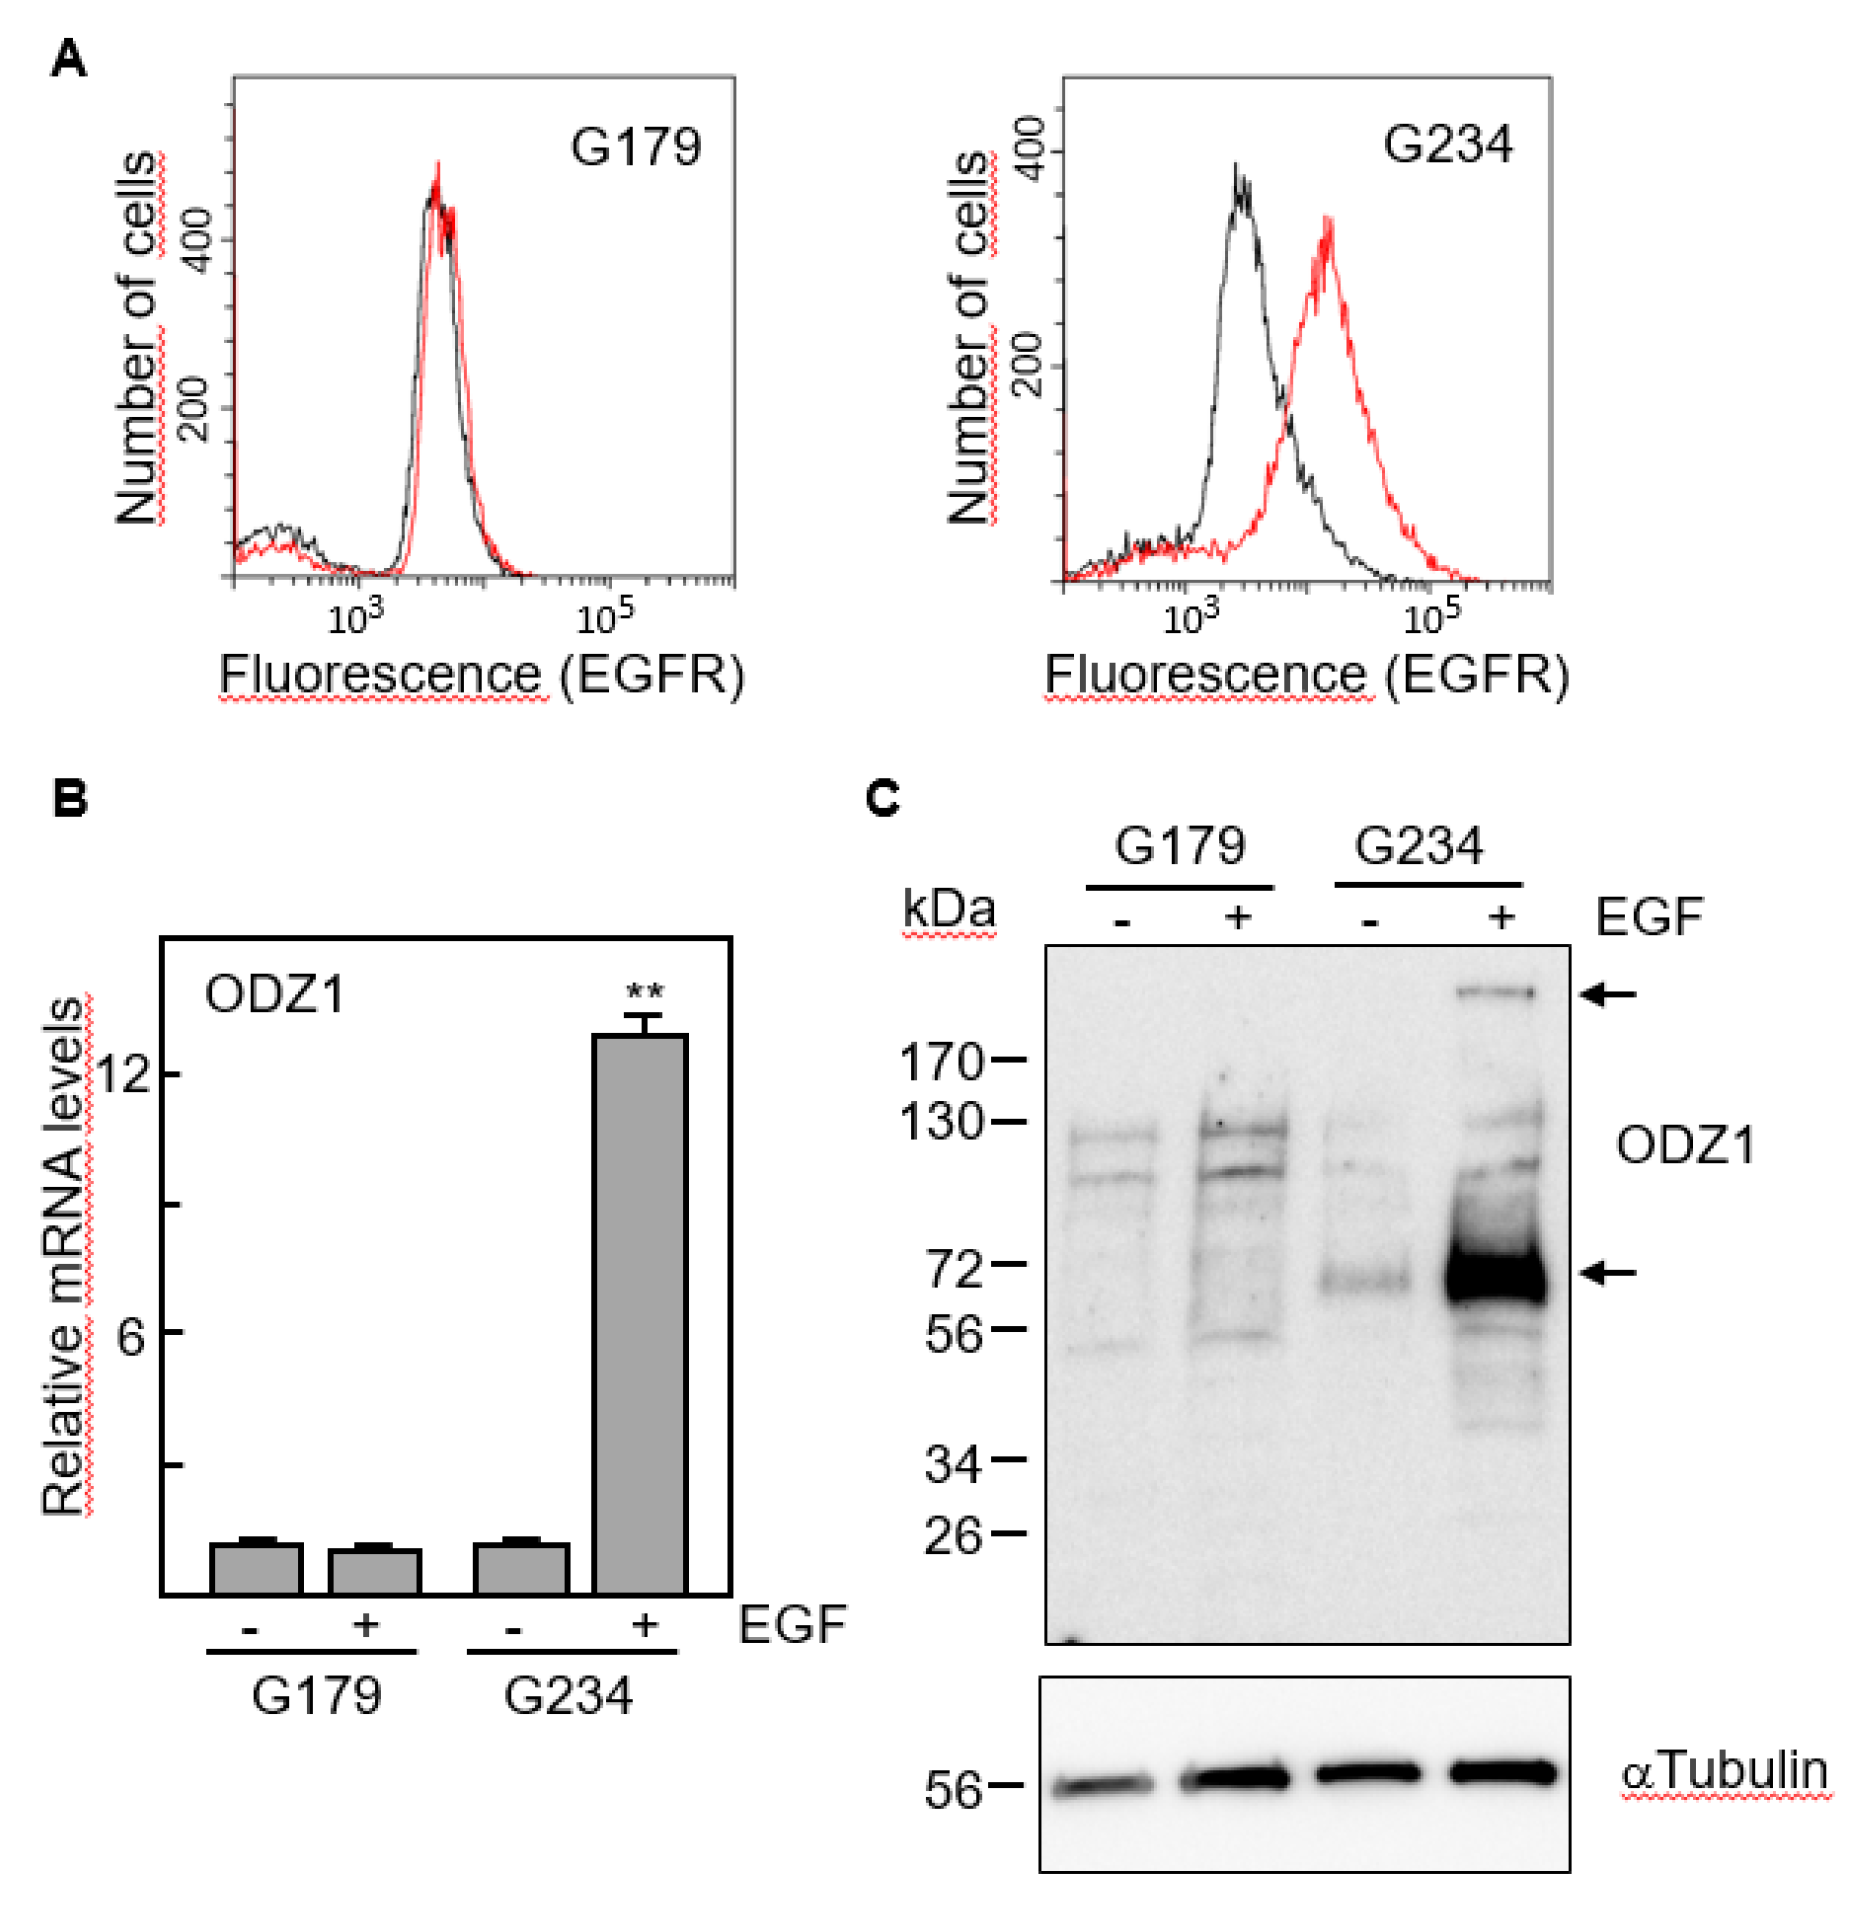
We selected two cell lines with marked differences in the expression of EGFR, G179 and G234 (
Figure 3A). The first one, which has EGFR levels almost undetectable by flow cytometry did not increase the expression of ODZ1 mRNA following culture with EGF. However, EGFR-expressing G234 cells increased about 12-fold the levels of ODZ1 in response to EGF (
Figure 3B).
This result was confirmed when we analysed the ODZ1 protein. Although the native protein is about 300 kDa, smaller fragments, mostly that of 70 kDa, are frequently detected in western blot analyses due to partial proteolysis
3. Consistent with the mRNA data, ODZ1 protein was not elevated in G179 cells following treatment with EGF, but G234 cell line showed a clear upregulation of ODZ1 in response to EGF and both the high molecular weight native protein and the 70 kDa fragment could be detected (
Figure 3C).
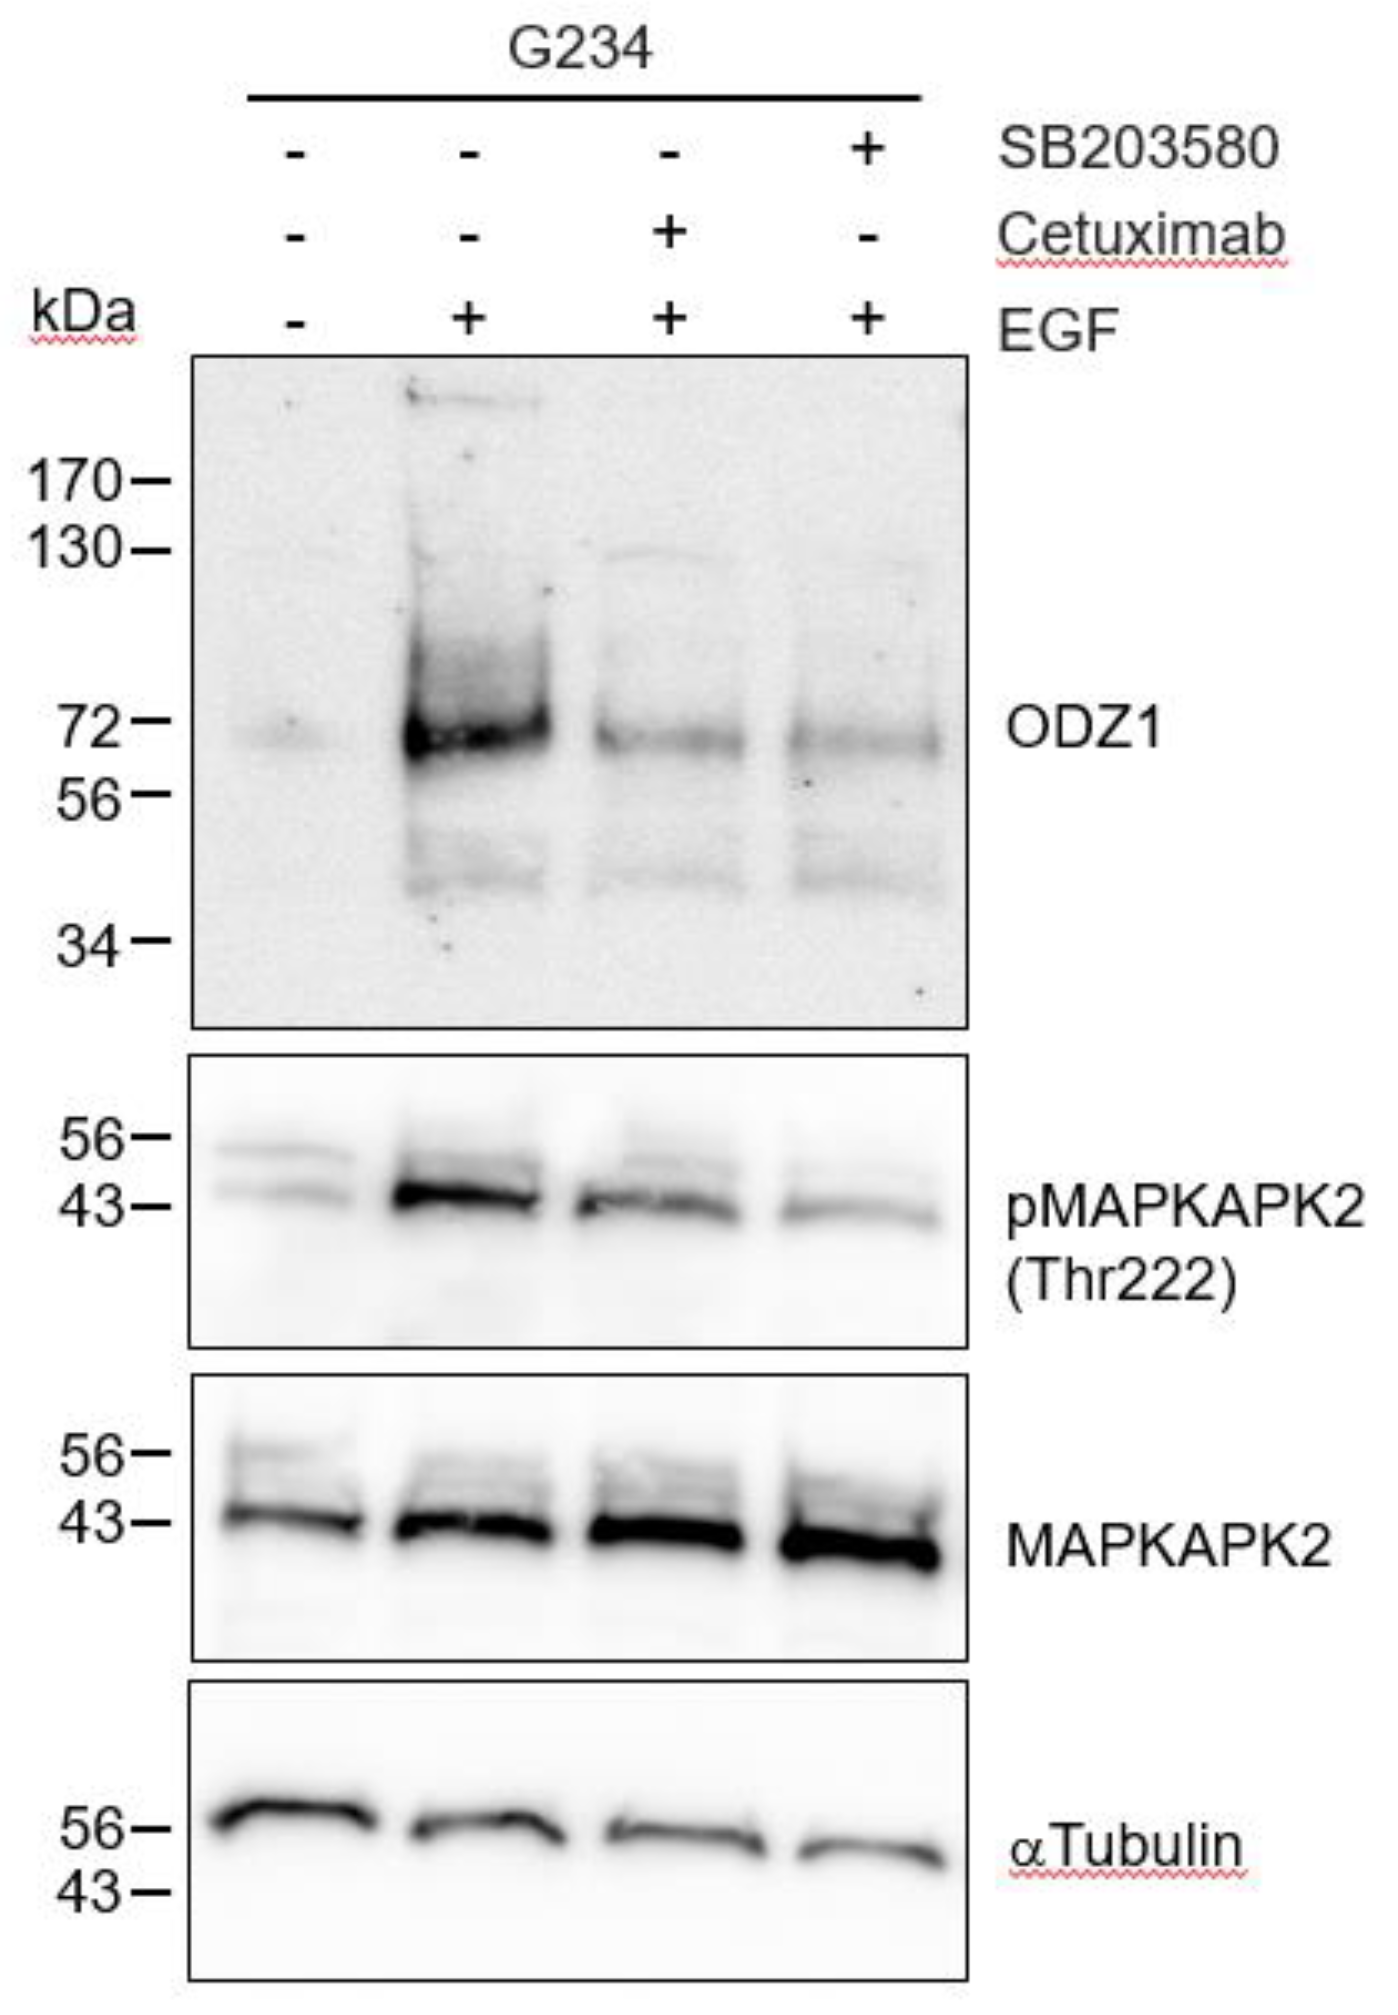
As expected, when G234 cells were treated with EGF in the presence of the EGFR blocking antibody Cetuximab, the EGF-mediated upregulation of ODZ1 was abolished or highly reduced (
Figure 4). EGF binding to its cognate receptor is able to activate different signalling pathways, including p38 MAPK. It has been shown that in glioma cells, activation of p38 contribute to tumor invasion and is correlated to tumor grade, being considered a potential oncogenic factor in brain tumors
16. Thus, we asked whether this pathway could mediate overexpression of ODZ1 induced by the EGF-EGFR binding complex. Incubation of G234 cells with SB203580, a specific p38 MAPK inhibitor that blocks its catalytic activity
17, drastically reduced both the levels of ODZ1 and the phosphorylation of MAPK-activated protein kinase 2 (MAPKAPK2), a direct target substrate of p38. A similar result, although to a lesser extent, was obtained following treatment with Cetuximab (
Figure 4).
The results obtained with chemical and biological inhibitors where confirmed by knocking down gene expression of p38 MAPK with siRNAs. Four p38 isoforms have been described, including p38α (coded by MAPK14 gene) and p38β (coded by MAPK11 gene) which are ubiquitously expressed and share a high sequence identity, whereas the other two isoforms have a more limited tissue-specific expression
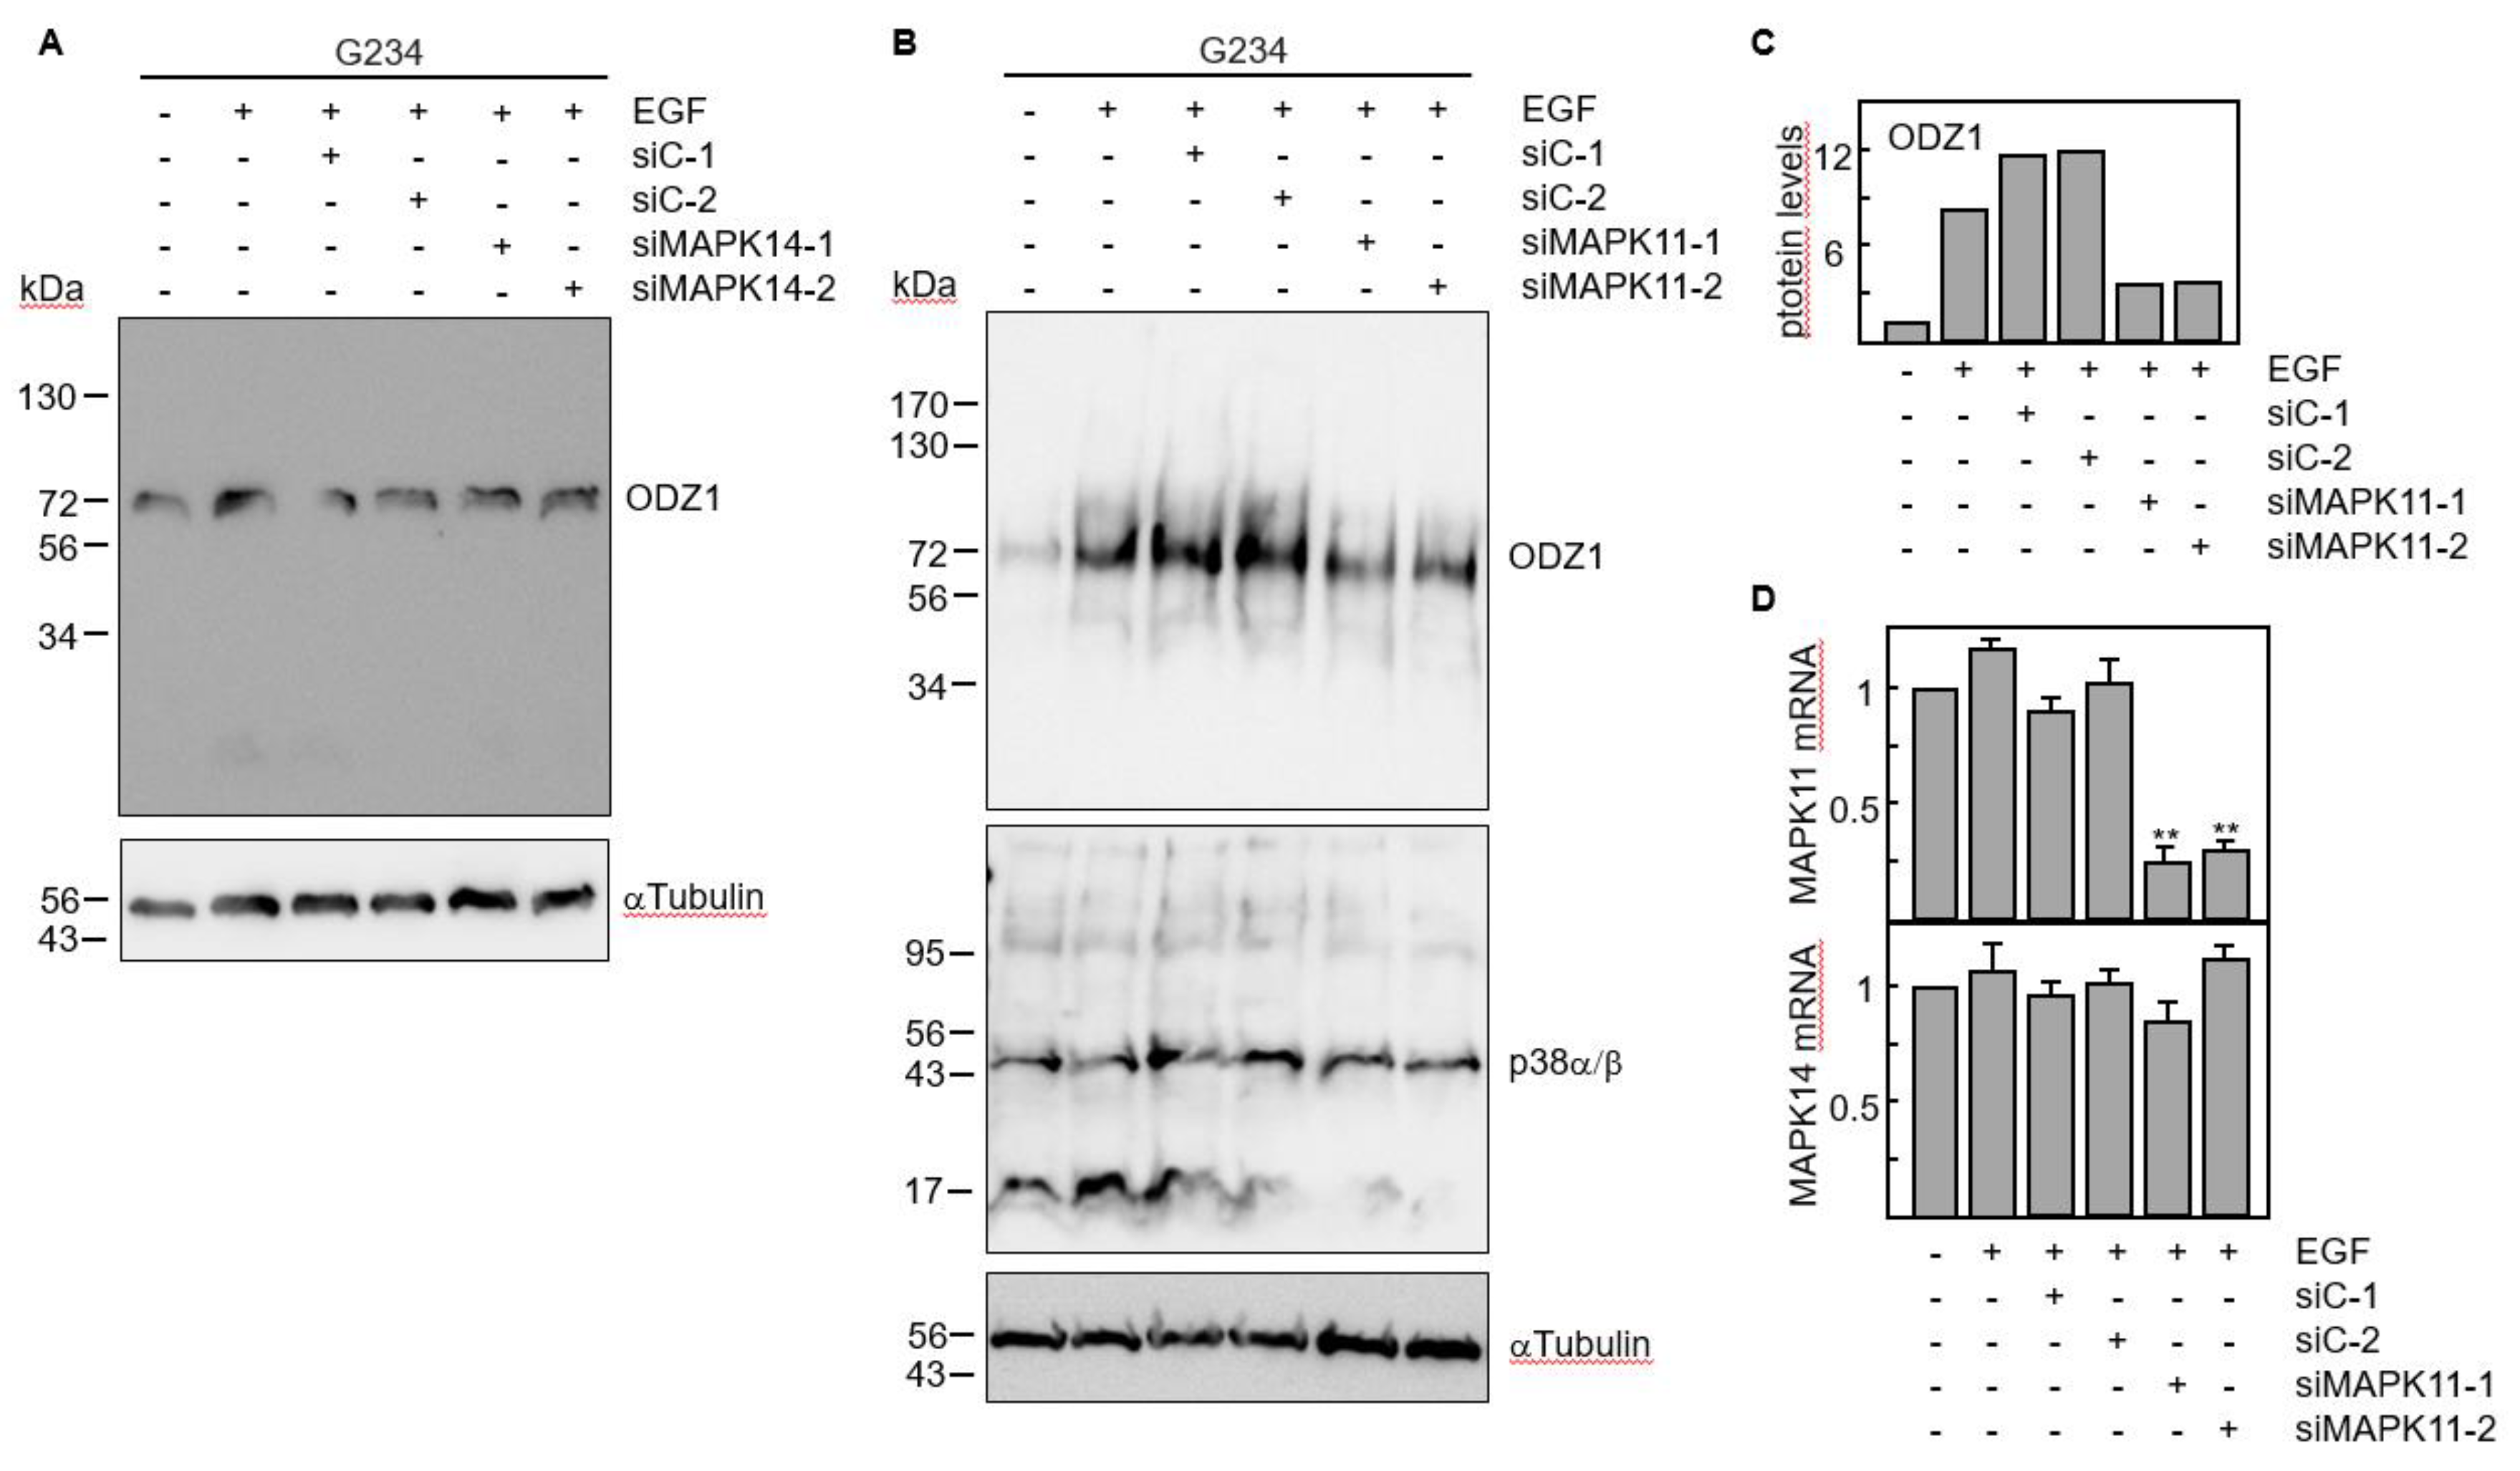
18. We knocked down either MAPK11 or MAPK14 using two specific siRNAs. Downregulation of MAPK14 did not modify the ODZ1 protein levels (
Figure 5A). However, transfection of GBM cells with MAPK11-specific siRNAs significantly reduced (about 4-fold) the ODZ1 protein expression (
Figure 5B,C). As expected, these siRNAs downregulated MAPK11 but not MAPK14 (
Figure 5D). This might be the reason why we do not observe a clear reduction in the protein levels of p38 as the antibody recognizes both α and β isoforms.
ODZ1 has been identified as a migration factor for GBM cells
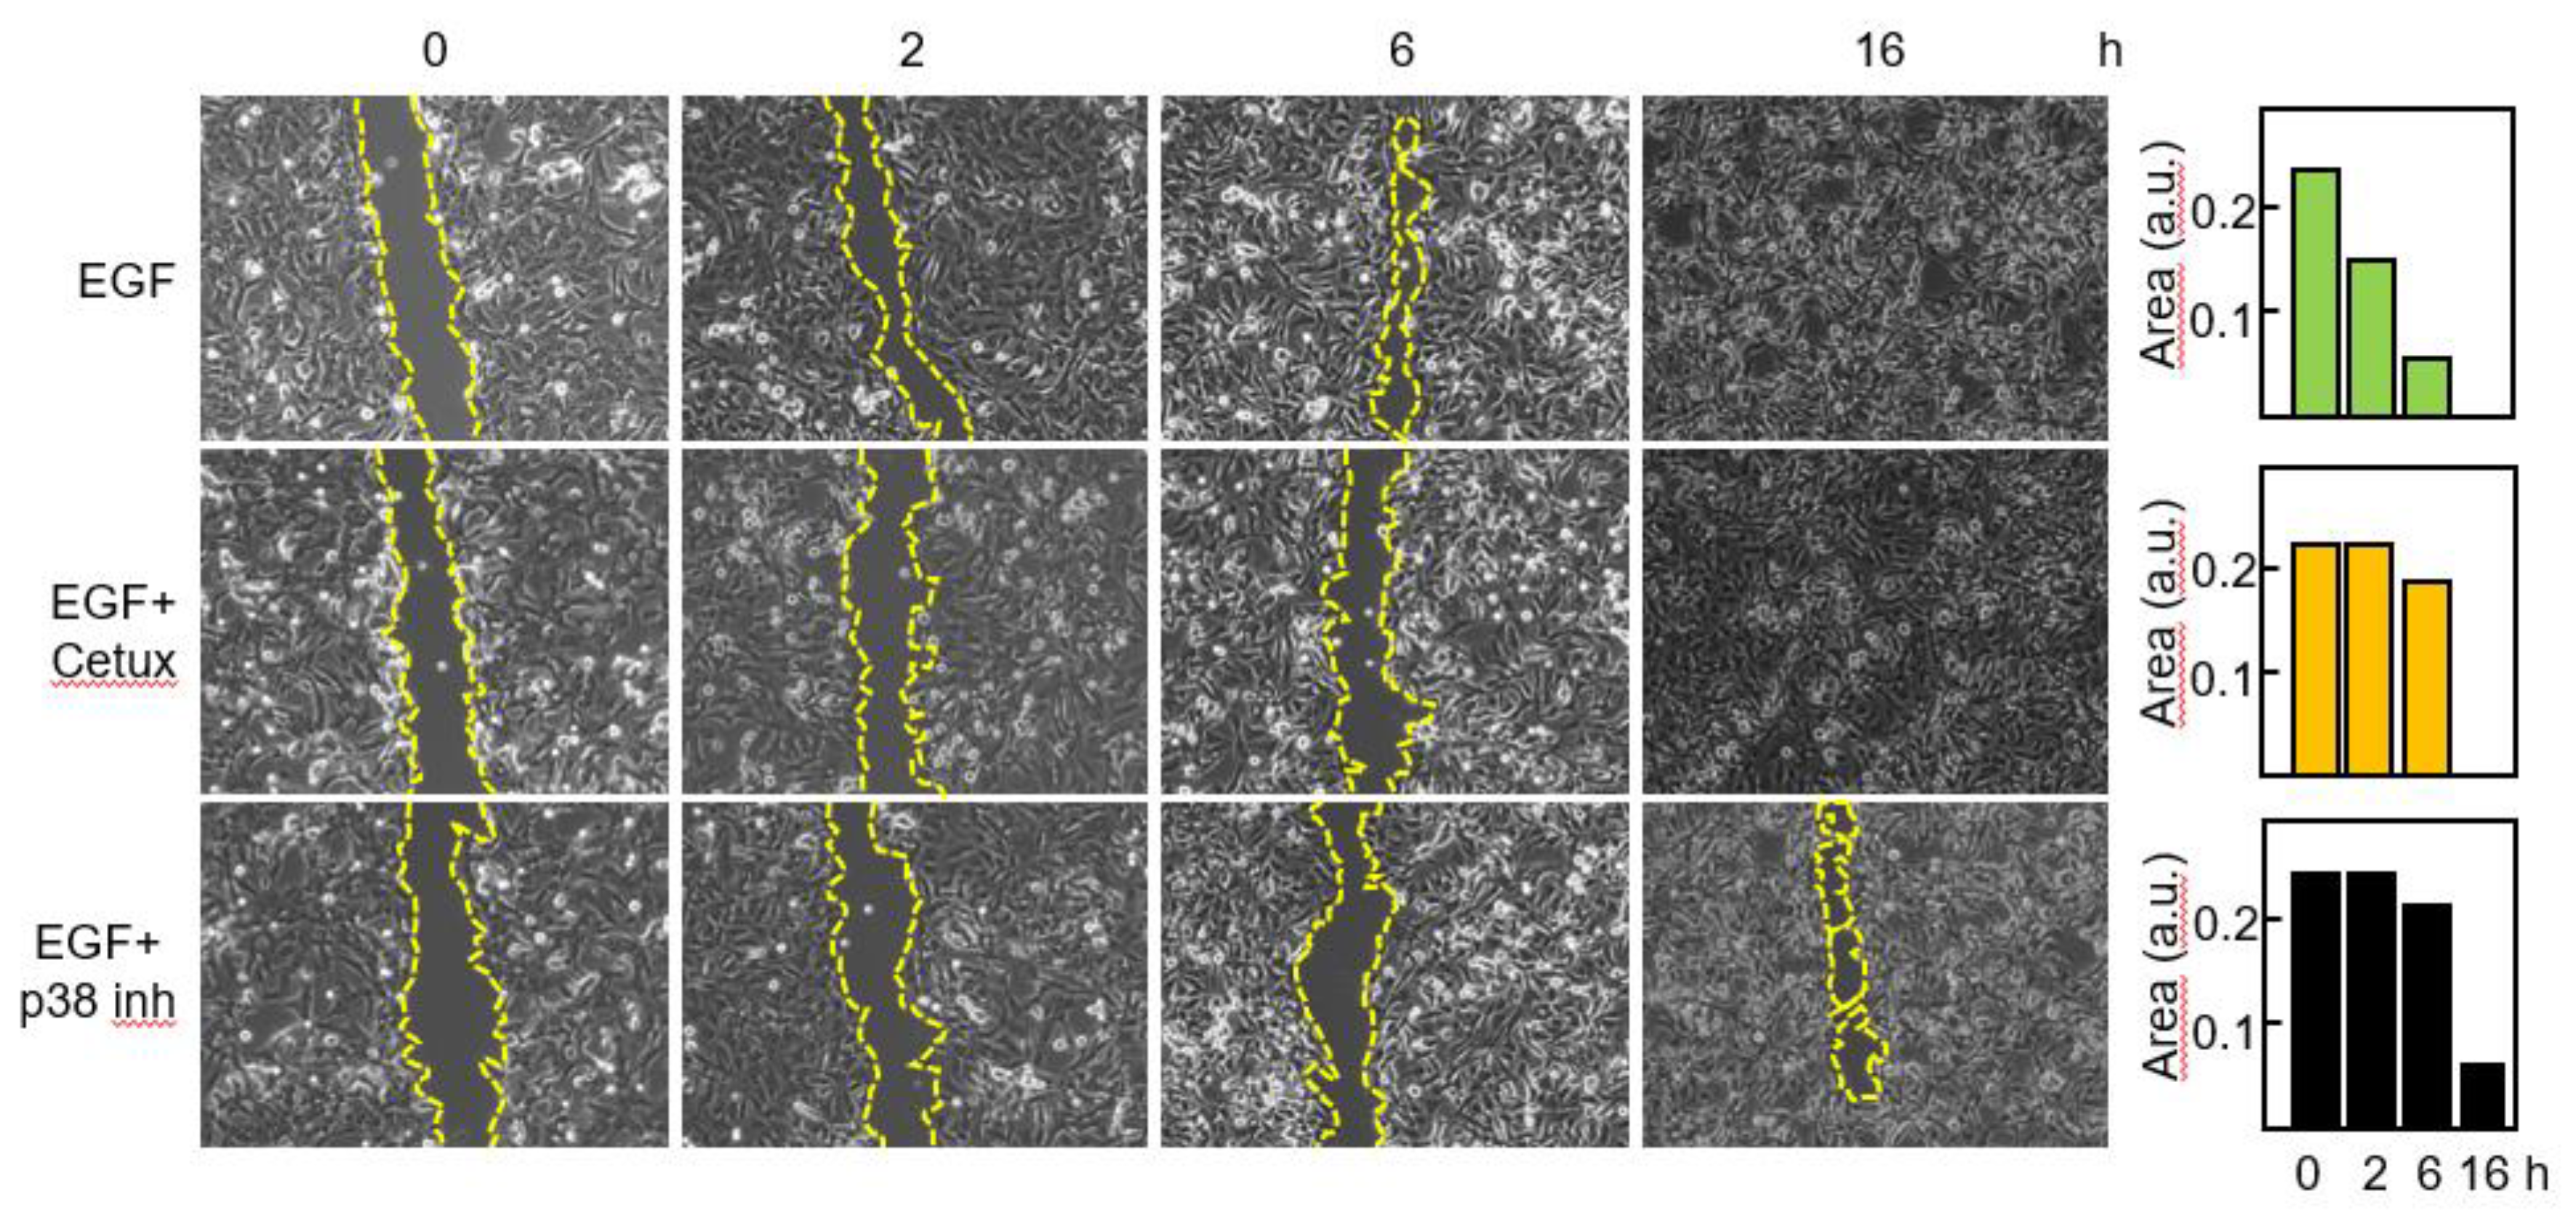
3,7,9. Thus, we wanted to confirm that blockade of the EGFR-p38 axis compromised the migratory capacity of primary GBM cells. Cells were treated with EGF in the presence or in the absence of Cetuximab or the p38 inhibitor and migration was assessed by means of a wound healing assay (
Figure 6).
After 2 h with EGF the gap was closed to 37% of its original area and no significant modification of the scratched area was detected following blockade of EGFR or p38 signaling. By 6h in the presence of EGF, 83% of the scratched area was closed, whereas minor reduction was seen with the blocking agents. Following 16h of treatment only a small area (about 6%) remained in the sample treated with the p38 inhibitor.
4. Discussion
We have previously described that ODZ1 is an important factor for GBM cells to invade the surrounding tissue 3. This invasion factor is upregulated when GBM cells are cultured under hypoxic conditions7 and it also responds to microenvironmental stimuli such as IL-6, which is released by infiltrating macrophages, and fibronectin, a major component of the extracellular matrix 9. Thus, GBM cells have the potential to use different microenvironmental elements to promote the expression of an invasion factor that has been demonstrated to provide a major contribution to the spreading of tumor cells both in vitro and in vivo 3. Ligand-dependent/independent activation of EGFR is present in about 60% of primary GBM 19. Of note, spatial distribution analysis showed that EGFR overexpression was localized in the infiltrating tumor edge 20 providing further evidence of the relevance of EGFR for the invasion capacity of GBM cells. Based on this, we asked whether EGFR could promote the expression of ODZ1. Although none of the 20 primary GBM cell lines tested carried the constitutively active EGFRvIII mutant, EGFR gene amplification, a hallmark genetic aberration in GBMs, occurred in almost all of them, expressing varying levels of EGFR. Aberrant EGFR signalling mechanisms including overexpression of ligands and receptors, EGFR gene amplification and activating mutations have been shown in a number of cancers such as non-small-cell lung cancer, colorectal carcinoma, breast cancer and head and neck squamous cell carcinoma 21. We have shown that GBM cells are able to induce ODZ1 expression at the mRNA and protein level in response to EGF, pointing to the existence of an EGFR-ODZ1 transcriptional pathway. EGFR has been shown to promote tumor cell migration/invasion through different transcriptional mechanisms that include STAT-mediated upregulation of metalloproteinase-1 22, expression of the actin-binding protein Fascin 23 and expression of invasion-associated genes through activation AP-1 transcription factors 24. In GBM cells, the activation of p38 MAPK is associated with tumor invasion and correlates with tumor grade, which indicates that this kinase could be an oncogenic factor that contributes to brain tumor progression 16. In line with this, we found a positive correlation between the levels of ODZ1 and activation of p38 MAPK. p38 MAP kinases are encoded by four genes, MAPK14 (p38α), MAPK11 (p38β), MAPK12 (p38γ) and MAPK13 (p38δ), being MAPK14 and MAPK11 highly homologous and co-located on chromosome 22. p38α and p38β are expressed in most cell types of the brain, including astrocytes and microglia 25,26. Thus, we studied their role in mediating the expression of ODZ1 by using MAPK14/MAPK11-specific siRNAs and found a correlation between ODZ1 and MAPK11 but not MAPK14. As mentioned above, both p38α and p38β, share high sequence homology, about 80% 27 which might explain why MAPK11 siRNAs downregulates the mRNA but the western blot analysis did not show a clear reduction of p38β protein, as the antibody used recognizes both isoforms. MAPK11 (p38β) has been shown to promote the expression of lipocalin 2 which is correlated with increased invasion and metastases in different types of tumors 28. Furthermore, MAPK11 plays a key role in the invasion and migration of cancer cells in breast, endometrial and hepatocellular carcinomas 28,29. The implication of the EGFR-p38 MAPK axis in GBM migration was tested by blocking the EGF receptor or inhibiting the kinase activity of p38 MAPK and the results were consistent with the well stablished invasion capacity of ODZ1 in GBM cells. Both inhibition strategies reduced the ability of EGF to promote wound closure. Interestingly, it has been suggested that p38 MAPK regulates the proliferation/migration balance in response to EGF 30.
5. Conclusions
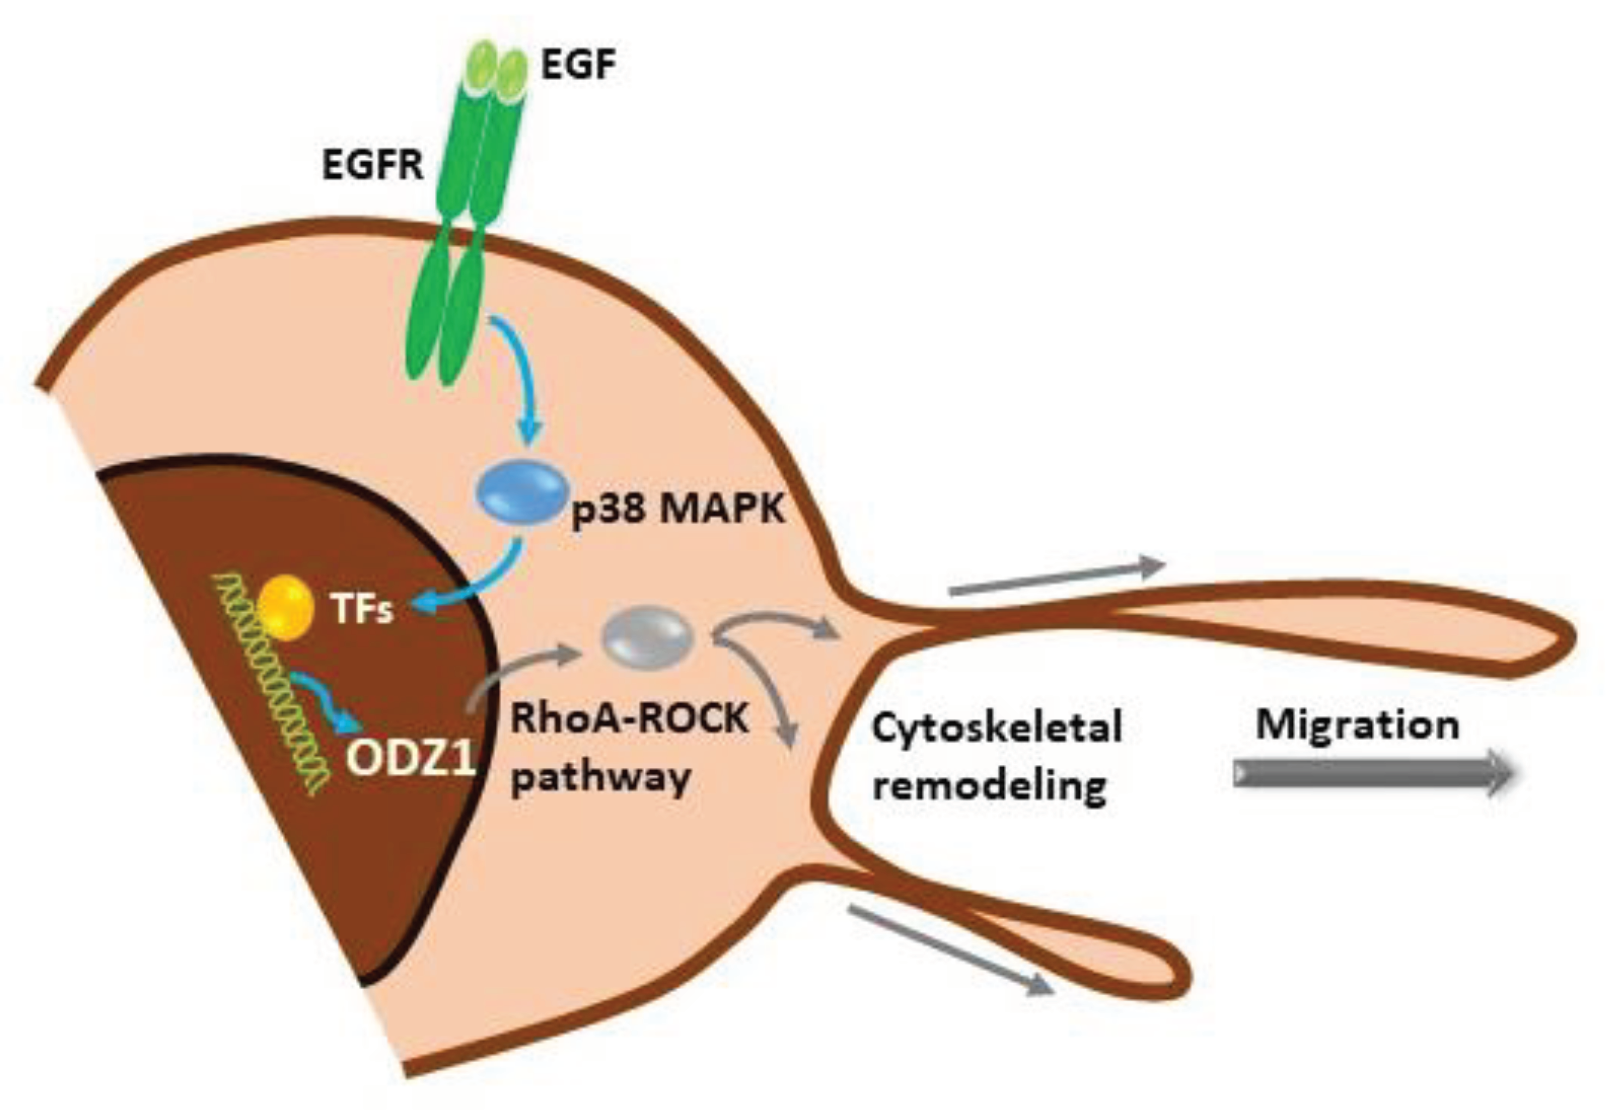
Our data show a novel signalling mechanism, initiated by activation of the EGF receptor in GBM cells which promotes the p38 MAPK-dependent expression of ODZ1, a previously characterized invasion factor for tumor cells. ODZ1 is able to reorganize the cytoskeletal network and promote tumor cell migration (
Figure 7). Overall, we have been able to connect one of the biochemical hallmarks of GBM, overexpression of EGFR, with ODZ1, a key player in promoting the invasion of GBM cells.
Author Contributions
J.F.-L., conceived the study and designed the experimental work, analysed data and wrote the manuscript. M.C., performed experimental work and contributed to data analysis. O.G., performed experimental work. C.V., designed part of the experimental work and contributed to data analysis and manuscript writing. All authors revised and approved the final version of the manuscript.
Funding
This work was supported by the Instituto de Investigación Valdecilla (IDIVAL) (APG/03) to J.F.-L.
Institutional Review Board Statement
The study was conducted according to the guidelines of the Declaration of Helsinki and approved by the ethics committee at the Valdecilla Research Institute (protocol code 2013.158). .
Informed Consent Statement
Not applicable.
Data Availability Statement
Data available on request.
Acknowledgments
Authors thank Dr. Sheila Mansouri for helping with the TCGA analyses.
Conflicts of Interest
The authors declare that no conflict of interest exists.
References
- Paw, I., Carpenter, R. C., Watabe, K., Debinski, W. & Lo, H. W. Mechanisms regulating glioma invasion. Cancer Lett 362, 1-7 (2015). [CrossRef]
- Ostrom, Q. T., Cioffi, G., Waite, K., Kruchko, C. & Barnholtz-Sloan, J. S. CBTRUS Statistical Report: Primary Brain and Other Central Nervous System Tumors Diagnosed in the United States in 2014-2018. Neuro Oncol 23, iii1-iii105 (2021). [CrossRef]
- Talamillo, A. et al. ODZ1 allows glioblastoma to sustain invasiveness through a Myc-dependent transcriptional upregulation of RhoA. Oncogene 36, 1733-1744 (2017). [CrossRef]
- Lefranc, F., Le Rhun, E., Kiss, R. & Weller, M. Glioblastoma quo vadis: Will migration and invasiveness reemerge as therapeutic targets? Cancer Treat Rev 68, 145-154 (2018).
- Petrini, I. et al. Whole genome and transcriptome sequencing of a B3 thymoma. PLoS One 8, e60572 (2013). [CrossRef]
- Drappatz, J., Norden, A. D. & Wen, P. Y. Therapeutic strategies for inhibiting invasion in glioblastoma. Expert Rev Neurother 9, 519-534 (2009). [CrossRef]
- Velasquez, C. et al. Hypoxia Can Induce Migration of Glioblastoma Cells Through a Methylation-Dependent Control of ODZ1 Gene Expression. Front Oncol 9, 1036 (2019). [CrossRef]
- Carcelen, M., Velasquez, C., Vidal, V., Gutierrez, O. & Fernandez-Luna, J. L. HIF2alpha Upregulates the Migration Factor ODZ1 under Hypoxia in Glioblastoma Stem Cells. Int J Mol Sci 23 (2022). [CrossRef]
- Vidal, V., Gutierrez, O., Talamillo, A., Velasquez, C. & Fernandez-Luna, J. L. Glioblastoma invasion factor ODZ1 is induced by microenvironmental signals through activation of a Stat3-dependent transcriptional pathway. Sci Rep 11, 16196 (2021). [CrossRef]
- Ezzati, S., Salib, S., Balasubramaniam, M. & Aboud, O. Epidermal Growth Factor Receptor Inhibitors in Glioblastoma: Current Status and Future Possibilities. Int J Mol Sci 25 (2024). [CrossRef]
- Pan, P. C. & Magge, R. S. Mechanisms of EGFR Resistance in Glioblastoma. Int J Mol Sci 21 (2020). [CrossRef]
- Nogueira, L. et al. Blockade of the NFkappaB pathway drives differentiating glioblastoma-initiating cells into senescence both in vitro and in vivo. Oncogene 30, 3537-3548 (2011).
- Mamatjan, Y. et al. Molecular Signatures for Tumor Classification: An Analysis of The Cancer Genome Atlas Data. J Mol Diagn 19, 881-891 (2017).
- Del Vecchio, C. A. et al. EGFRvIII gene rearrangement is an early event in glioblastoma tumorigenesis and expression defines a hierarchy modulated by epigenetic mechanisms. Oncogene 32, 2670-2681 (2013). [CrossRef]
- Munoz-Hidalgo, L. et al. Somatic copy number alterations are associated with EGFR amplification and shortened survival in patients with primary glioblastoma. Neoplasia 22, 10-21 (2020). [CrossRef]
- Grave, N. et al. The functional role of p38 MAPK pathway in malignant brain tumors. Front Pharmacol 13, 975197 (2022). [CrossRef]
- Kumar, S., Jiang, M. S., Adams, J. L. & Lee, J. C. Pyridinylimidazole compound SB 203580 inhibits the activity but not the activation of p38 mitogen-activated protein kinase. Biochem Biophys Res Commun 263, 825-831 (1999). [CrossRef]
- Kudaravalli, S., den Hollander, P. & Mani, S. A. Role of p38 MAP kinase in cancer stem cells and metastasis. Oncogene 41, 3177-3185 (2022). [CrossRef]
- Brennan, C. W. et al. The somatic genomic landscape of glioblastoma. Cell 155, 462-477 (2013). [CrossRef]
- Snuderl, M. et al. Mosaic amplification of multiple receptor tyrosine kinase genes in glioblastoma. Cancer Cell 20, 810-817 (2011). [CrossRef]
- Ono, M. & Kuwano, M. Molecular mechanisms of epidermal growth factor receptor (EGFR) activation and response to gefitinib and other EGFR-targeting drugs. Clin Cancer Res 12, 7242-7251 (2006). [CrossRef]
- Andl, C. D. et al. EGFR-induced cell migration is mediated predominantly by the JAK-STAT pathway in primary esophageal keratinocytes. Am J Physiol Gastrointest Liver Physiol 287, G1227-1237 (2004). [CrossRef]
- Holsken, A. et al. EGFR signaling regulates tumor cell migration in craniopharyngiomas. Clin Cancer Res 17, 4367-4377 (2011). [CrossRef]
- Sundqvist, A. et al. TGFbeta and EGF signaling orchestrates the AP-1- and p63 transcriptional regulation of breast cancer invasiveness. Oncogene 39, 4436-4449 (2020).
- Da Silva, J., Pierrat, B., Mary, J. L. & Lesslauer, W. Blockade of p38 mitogen-activated protein kinase pathway inhibits inducible nitric-oxide synthase expression in mouse astrocytes. J Biol Chem 272, 28373-28380 (1997). [CrossRef]
- Haines, J. D., Fulton, D. L., Richard, S. & Almazan, G. p38 Mitogen-Activated Protein Kinase Pathway Regulates Genes during Proliferation and Differentiation in Oligodendrocytes. PLoS One 10, e0145843 (2015). [CrossRef]
- Risco, A. & Cuenda, A. New Insights into the p38gamma and p38delta MAPK Pathways. J Signal Transduct 2012, 520289 (2012).
- Roche, O. et al. p38beta and Cancer: The Beginning of the Road. Int J Mol Sci 21 (2020).
- Li, Y. et al. Knocking down of LINC01220 inhibits proliferation and induces apoptosis of endometrial carcinoma through silencing MAPK11. Biosci Rep 39 (2019). [CrossRef]
- Frey, M. R., Golovin, A. & Polk, D. B. Epidermal growth factor-stimulated intestinal epithelial cell migration requires Src family kinase-dependent p38 MAPK signaling. J Biol Chem 279, 44513-44521 (2004). [CrossRef]
Figure 1.
The constitutively active mutant EGFRvIII correlates with higher levels of ODZ1. A, ODZ1 expression was identified from RNA-seq data in the TCGA datasets that provided information of a GBM cohort containing 214 patient samples carrying either wild type EGFR or the mutant variant EGFRvIII. B, Schematic representation of the EGFR gene showing the PCR design to discriminate EGFR from EGFRvIII. C, PCR analysis of 20 primary GBM cell lines using the experimental design described in B.
Figure 2.
Expression of EGFR protein in primary GBM cells. A, EGFR expression was determined by FACS analysis. Red line, anti-EGFR antibody. Black line, isotype-matched control antibody. B, Mean fluorescence intensity of FACS results and the gene amplification status of EGFR in all the cell lines. C, Representative result of a MLPA assay showing amplification of the entire EGFR gene.
Figure 3.
EGF induces the expression of ODZ1. A, FACS analysis of two GBM cell lines expressing or not EGFR. B, GBM cells were incubated with EGF and the mRNA levels of ODZ1 were determined after 24 h by qPCR. Histograms represent the mean of three independent experiments + S.D. Asterisks represent significant differences (**p<0.01). C, Western blot analysis confirmed that exposure of GBM cells to EGF also promoted the expression of ODZ1 at the protein level. αTubulin was used to assure equal loading. Arrows indicate the native high-molecular weight ODZ1 protein and its most frequent proteolytic fragment of 70 kDa.
Figure 4.
Blockade of the EGFR-p38 signalling downregulates the levels of ODZ1. GBM cells were treated with EGF in the absence or in the presence of the EGFR blocking antibody Cetuximab, or the specific p38 MAPK inhibitor SB203580. Western blot analysis confirmed that blockade of EGFR/p38 inhibited phosphorylation of MAPKAPK2 at Thr222, a target of p38, and reduced the expression of ODZ1 protein. MAPKAPK2 and αTubulin were used to assure equal loading. .
Figure 5.
RNA interference by p38-specific siRNAs neutralizes the EGF-promoted upregulation of ODZ1. A, GBM cells were transfected with two MAPK14-specific siRNAs or two control siRNAs. Following incubation with EGF the protein levels of ODZ1 were determined by western blot. B, Same experimental design as in A, but using MAPK11-specific siRNAs. αTubulin was used to assure equal loading. C, Quantification of ODZ1 protein levels of the experiment shown in B by using imageJ software. D, Cells carrying siRNAs specific for MAPK11 were analysed for the expression of either MAPK11 or MAPK14 mRNA by qPCR. Histograms represent the mean of three independent experiments + S.D. **p<0.01.
Figure 6.
Blockade of the EGFR-p38 axis reduces the migratory capacity of GBM cells. Cells were incubated with EGF in the absence or in the presence of Cetuximab or the p38 MAPK inhibitor SB203580 and migration was determined at different time points by using an in vitro wound healing assay. The scratched cell free area was quantitated by the ImageJ software. a.u., arbitrary units.
Figure 7.
Schematic representation of the EGFR-p38-ODZ1 transcriptional pathway. EGF, present in tumor microenvironment, binds to its receptor and triggers the activation of p38 MAPK which induces a transcriptional mechanism to upregulate ODZ1, that is a known migration factor in GBM cells through RhoA-ROCK pathway.
|
Disclaimer/Publisher’s Note: The statements, opinions and data contained in all publications are solely those of the individual author(s) and contributor(s) and not of MDPI and/or the editor(s). MDPI and/or the editor(s) disclaim responsibility for any injury to people or property resulting from any ideas, methods, instructions or products referred to in the content. |
© 2024 by the authors. Licensee MDPI, Basel, Switzerland. This article is an open access article distributed under the terms and conditions of the Creative Commons Attribution (CC BY) license (http://creativecommons.org/licenses/by/4.0/).
