Preprint
Article

ISLS: An Illumination-aware Sauce-packet Leakage Segmentation Method

Altmetrics

Downloads

102

Views

26

Comments

0

A peer-reviewed article of this preprint also exists.

Submitted:

12 March 2024

Posted:

14 March 2024

You are already at the latest version

Alerts
Abstract
The segmentation of abnormal regions is vital in smart manufacturing. However, the existing segmentation system for detecting sauce-packet leakage on intelligent sensors encounters an issue of imaging blurring caused by uneven illumination. This issue adversely affects segmentation performance, thereby impeding the rapid production of industrial assembly lines. To alleviate this issue, we propose the two-stage Illumination-aware Sauce-packet Leakage Segmentation (ISLS) method for intelligent sensors. The ISLS comprises two main stages: Illumination-aware region enhancement and leakage region segmentation. In the first stage, YOLO-Fastestv2 is employed to capture the Region of Interest (ROI), which reduces redundancy computations. Additionally, we propose an image enhancement to relieve the impact of uneven illumination, enhancing the texture details of ROI. In the second stage, we propose a novel feature extraction network. Specifically, we propose the Multi-scale Feature Fusion Module (MFFM) and the Sequential Self-Attention Mechanism (SSAM) to capture discriminative representations of leakage. The multi-level features are fused by MFFM with a small number of parameters, which capture leakage semantics at different scales. The SSAM realizes the enhancement of valid features and the suppression of invalid features by adaptive weighting of spatial and channel dimensions. Furthermore, we generated a self-built dataset of sauce-packets, including 606 images with various leakage areas. Comprehensive experiments demonstrate that our ISLS method shows better results than several state-of-the-art methods, with additional performance analyses deployed on intelligent sensors to affirm the effectiveness of our proposed method. Our code is available at https://github.com/LSJ5106/SauceDetect.
Keywords: 
Subject: Computer Science and Mathematics  -   Computer Vision and Graphics

1. Introduction

With the advancement of computer vision technology, leakage segmentation has become crucial for intelligent industrial production [1,2,3]. Sauce-packet leakage segmentation is to determine whether a sauce-packet has leakage [4]. Unlike other segmentation scenarios, sauce-packet leakage segmentation faces issues of overexposure or insufficient illumination, resulting in blurred images. Moreover, traditional and most deep learning algorithms have insufficient performance in solving illumination imbalance [5,6,7]. The sauce-packet’s leakage results in many adverse outcomes, encompassing compromised product quality and increased material wastage. Hence, to facilitate the industrialization process, researching leakage segmentation for sauce-packet leakage is particularly important.
The leakage segmentation of sauce-packet can be divided into traditional methods and Convolutional Neural Network (CNN) methods [8]. Traditional methods rely on expert experience. Songming et al. [9] developed an improved detector using the Canny operator, which improve the computational efficiency and increase the precision of fibre identification. Sharma et al. [10] used a Histogram of Oriented Gradient (HOG) and Support Vector Machine (SVM) segmentation method, which integrate with a modified ResNet50 model for brain tumor detection to help clinicians. Similarly, Hongbin et al. [11] proposed a segmentation method by HOG and Local Binary Pattern (LBP), which combines both HOG and LBP features to accurately identify crack anomalies. Binwu et al. [12] developed a secondary template matching method, which extracted the Region of Interest (ROI) by using the four-threshold algorithm. However, traditional methods relied on hand-crafted features, and the generalization performance in real scenes is insufficient.
The CNN methods automatically extract discriminative features, and do not rely on expert experience. Wang et al. [13] proposed HRNet, which connected the high-to-low resolution convolution streams in parallel and repeatedly exchanges the information across resolutions. Yu et al. [14] proposed BiseNetv2, which involved a detail branch and a semantic branch. Xie et al. [15] proposed SegFormer, which unified Transformers with lightweight multilayer perception decoders. Cao et al. [16] proposed Swin-Unet, which designed a novel pure transformer-based U-shaped encoder-decoder for medical image segmentation. However, the above methods have not been applied to the field of sauce-packet leakage segmentation.
In this paper, we propose the two stage Illumination-aware Sauce-packet Leakage Segmentation (ISLS) method. Firstly, in the illumination-aware region enhancement stage, an efficient localization algorithm [17] is introduced to reduce the calculation of invalid areas. And we design the Uneven-Light Image Enhancement (ULIE) method to alleviate the problems of blurred images under uneven illumination conditions. Specifically, the ULIE method is built upon the retinex model to enhance image clarity under insufficient illumination condition. And the ULIE method utilizes the contrast limited adaptive histogram equalization to alleviate the leakage details in overexposure image. Secondly, in the leakage region segmentation stage, to effectively relieve the problem of information missing, we propose Multi-scale Feature Fusion Module (MFFM) for capturing multi-scale discriminative representation. Our MFFM fuses a variety of feature maps from top to bottom. And the resulting fused feature map serves as the input to our proposed network decoder, thereby enhancing the decoder’s semantic recovery performance. Finally, the Sequential Self-Attention Mechanism (SSAM) utilizes a sequential structure, which combines the channel and spatial attention mechanisms, thereby achieving effective mining of salience information. In summary, our method effectively relieves the impact of uneven illumination and improves the performance of feature extraction for blurred images.
Our main contributions can be summarized as follows:
1) To alleviate blurred image issues caused by uneven illumination, we propose the ULIE method via illumination-aware mechanism to enhance the texture details of leakage within the ROI.
2) The MFFM is proposed to fuse multi-level features with a small number of parameters, capturing multi-scale features to effectively relieve the issue of missing information.
3) To alleviate the interference of invalid information, we introduce the SSAM by combining spatial and channel attention mechanisms to enhance the discriminability of valid features in the ROI.
4) We generate a sauce-packet dataset to facilitate research. Furthermore, our method Mean Intersection over Union (mIoU) achieves 80.8% and Mean Pixel Accuracy (mPA) reaches 90.1% on the self-built dataset, which are +0.9% and +0.9% higher than the previous CNN method [18].
The rest of this paper is organized as follows. Section 2 describes the proposed method in detail. Section 3 conducts the experiments based on the self-built dataset to verify the effectiveness of the proposed method. Section 4 summarizes this paper.

2. Materials and Methods

We propose Illumination-aware Sauce-packet Leakage Segmentation (ISLS) for the industrial production line, as illustrated in Figure 1. The ISLS method includes a NVIDIA GPU and an intelligent sensor with a hardware accelerated EdgeAI development environment. We train the model on NVIDIA GPU and perform inference on intelligent sensors.
The cameras capture images of sauce-packets and transfer the images to NVIDIA GPU and intelligent sensors, where the images are stored as a raw dataset. The sauce-packet dataset is pre-processed using YOLO-Fastestv2 [17] detection algorithm to focus on the Region of Interest (ROI) and is augmented by our proposed Uneven-Light Image Enhancement (ULIE) method. We split the raw dataset into training and validation sets in a 7:3 ratio.
We train our proposed leakage segmentation network on the NVIDIA GPU. Subsequently, we assess the robustness and generalization of our trained model by cross-validation. The trained model is deployed on the NVIDIA Jetson TX2 intelligent sensors for inference, where it is utilized to identify real-time leakage in images (i.e., highlight the areas of leakage with bounding boxes).
We first introduce our uneven-light image enhancement in our designed ISLS, including the localization and ULIE method. Subsequently, we present the segmentation network, proposing the Multi-scale Feature Fusion Module (MFFM) and the Sequential Self-Attention Mechanisms (SSAM). Detailed explanations of these components will be presented in subsequent sections.

2.1. Uneven-Light Image Enhancement for Illumination-Aware Region Enhancement

The actual leakage segmentation of sauce-packet is often influenced by uneven-light sources, which consist of insufficient illumination and overexposure. To relieve the problem of image blurring caused by uneven illumination, we propose the Uneven-Light Image Enhancement (ULIE) method, employed in the illumination-aware region enhancement stage of ISLS. The ULIE method is inspired by the relevant image enhancement algorithms [19,20,21]. Our ULIE method can enhance the illumination of sauce-packet images under insufficient illumination conditions and improve the image contrast and texture details under overexposure conditions.
The input of ISLS is in a three-channel RGB format, where R, G, and B represent the color space values of red, green, and blue, respectively. We utilize the mean function in OpenCV to calculate the mean value of the RGB three channels in the ROI. Through extensive experimental analysis, we define 115 and 180 as the thresholds for insufficient illumination and overexposure, respectively. The implementation details of our ULIE method are as follows:
In the case of insufficient illumination, the ULIE method is built upon the retinex model [22,23]. The retinex model theory posits that a color image can be decomposed into two primary components: the illumination component (lighting) and the reflection component, as shown in Equation (1).
Li(x) = Tr(x) ◦ Re(x)
where Li(x) and Re(x) represent the input image and the image to be recovered, respectively. Tr(x) represents the illumination mapping image, and the ◦ operator represents the element-wise multiplication.
Firstly, to simplify the computation of ULIE method, it is commonly assumed that the three channels of images share the same illumination map [24]. The ULIE method calculates the maximum value among the RGB channels of the image to independently estimate the illumination of each pixel x, obtaining the initial estimation:
Tr x = max c { R , G , B } Li c x
where x represents individual pixel, c represents channels, and L i c x is the input image of the maximum channel in the RGB.
Secondly, to ensure that the illumination map does not cause the enhanced image to become overly saturated, the ULIE method modifies Re(x):
Re ( x ) = Li x Tr x + ϵ
where ϵ is a very small constant, to avoid denominating to zero.
Thirdly, the ULIE method employs the augmented lagrangian multiplier optimization method [25] to preserve the structural information and smooth texture details of sauce-packet images. The ULIE method introduces the following optimization problem to accelerate the processing speed of sauce-packet images:
min T r T r ^ T r F 2 + α W Tr 1
where | | · | | F and | | · | | 1 represent the F norm and L1 regularization, α is the coefficient balancing the F norm and L1 regularization, respectively. Additionally, W is the weight matrix, and Tr represents a first-order derivative filter, encompassing both horizontal and vertical directions.
Finally, the ULIE method iteratively updates according to the retinex model, solving to obtain the result image Re(x) in Equation (1). The ULIE method applies BM3D [26] for denoising optimization of the result image Re(x). To reduce the computation of the denoising process in ULIE, the method transforms the RGB three channels of the result image Re(x) into YUV three channels [27] and performs denoising only on the Y channel:
Y = 0.299R + 0.587G + 0.114B
U = -0.169R - 0.331G + 0.5B + 128
V = 0.5R - 0.419G - 0.081B + 128
where Y represents luminance, U and V represent blue chrominance and red chrominance, respectively.
In the case of overexposure, the ULIE method divides the image into blocks to obtain overexposure regions (i.e., locally overexposed areas). Firstly, to obtain the illumination information of ROI, we convert the RGB color space into the YUV color space, as shown in Equation (5). The ULIE method divides the input image into several small blocks, and performs Contrast Limited Adaptive Histogram Equalization (CLAHE) [28] on each block, to enhance the clarity of the image. CLAHE clips and redistributes the histograms of each sub-image, thereby limiting the degree of contrast enhancement. CLAHE prevents the amplification of noise and excessive enhancement [29]. The ULIE method initially divides the original image into several non-overlapping sub-images, each denoted as s. We compute the the frequency of pixel values p s i , representing the data distribution of pixel values i within each sub-image. The definition of the p s i is given by Equation (6):
p s i = n i N
where p s i represents the frequency of pixel values equal to i, n i represents the number of pixels with a pixel value of i, and N represents the total number of pixels in the sub-image.
Secondly, the ULIE method computes the Cumulative Distribution Function (CDF) c s i for each sub-image s in Equation (7), representing the cumulative frequency of pixel values less than or equal to i:
c s i = j = 0 i p s j
where c s i represents the CDF for the pixel value i, p s j represents the frequency of pixel values equal to j.
Thirdly, the ULIE method utilizes Equation (8) to compute the transformation function T s i for each sub-image s, representing the function that maps the original pixel value i to a new pixel value:
T s i = c s i
where T s i represents the transformed pixel value for the original pixel value i, L represents the maximum range of pixel values, and · represents the floor function.
The ULIE method clips and redistributes p s i for each sub-image s, limiting the degree of contrast enhancement, which prevents the amplification of noise and excessive enhancement [28]. Finally, the ULIE method consolidates all transformed sub-images T s i into the final image and converts the image from YUV format back to RGB format.
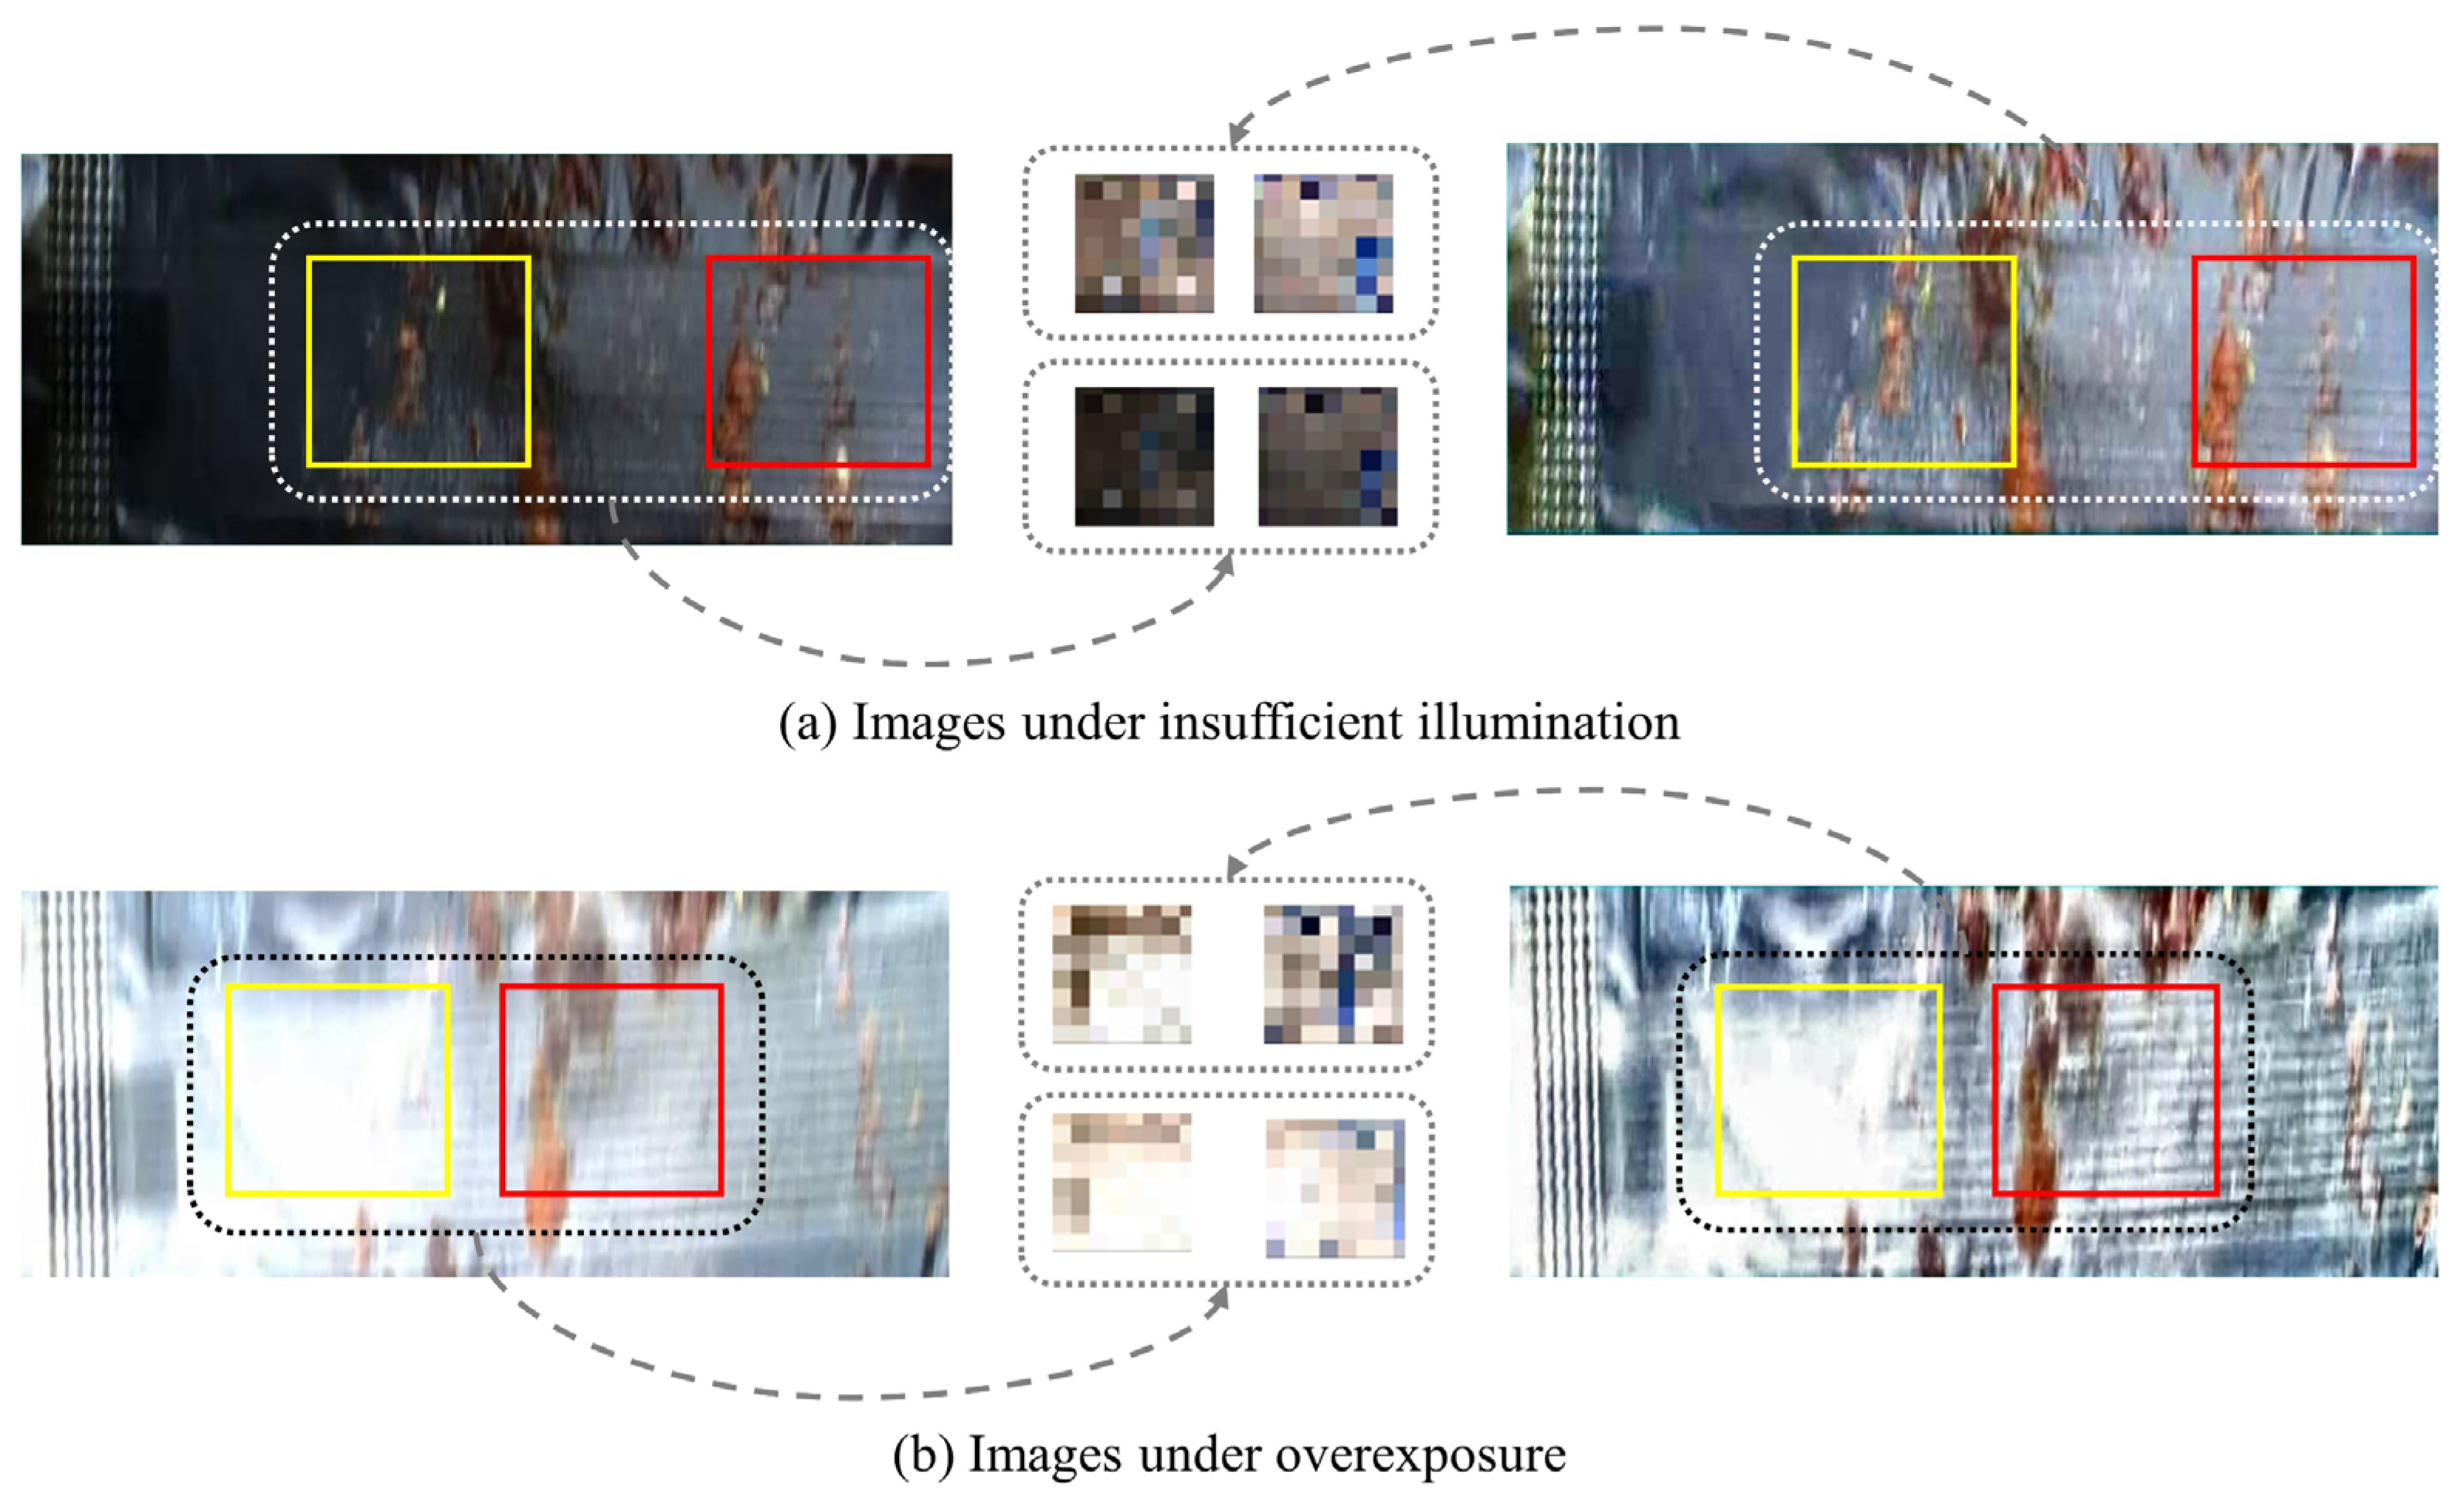
The results of ULIE images are shown in Figure 2, where the left image is the non-optimized image, and the right image is the optimized image. Figure 2a shows that the image has improved overall illumination, with a clearer boundary between the leakage and the background. The ULIE method effectively enhances the image contrast and clarity. Figure 2b reveals that the illumination of the optimized image is more balanced. The ULEIE method alleviates the phenomenon of local overexposure, which further proves that our method effectively avoids gray jump [30]. We perform convolution and downsampling operations on the yellow and red box regions, obtaining the corresponding feature maps between non-optimized and optimized images. It is shown that the details of the optimized feature map are more obvious. In summary, through the above process, our method can effectively enhance the details and textures of sauce-packet images under insufficient illumination and overexposure.

2.2. ISLS Network Details for Leakage Segmentation

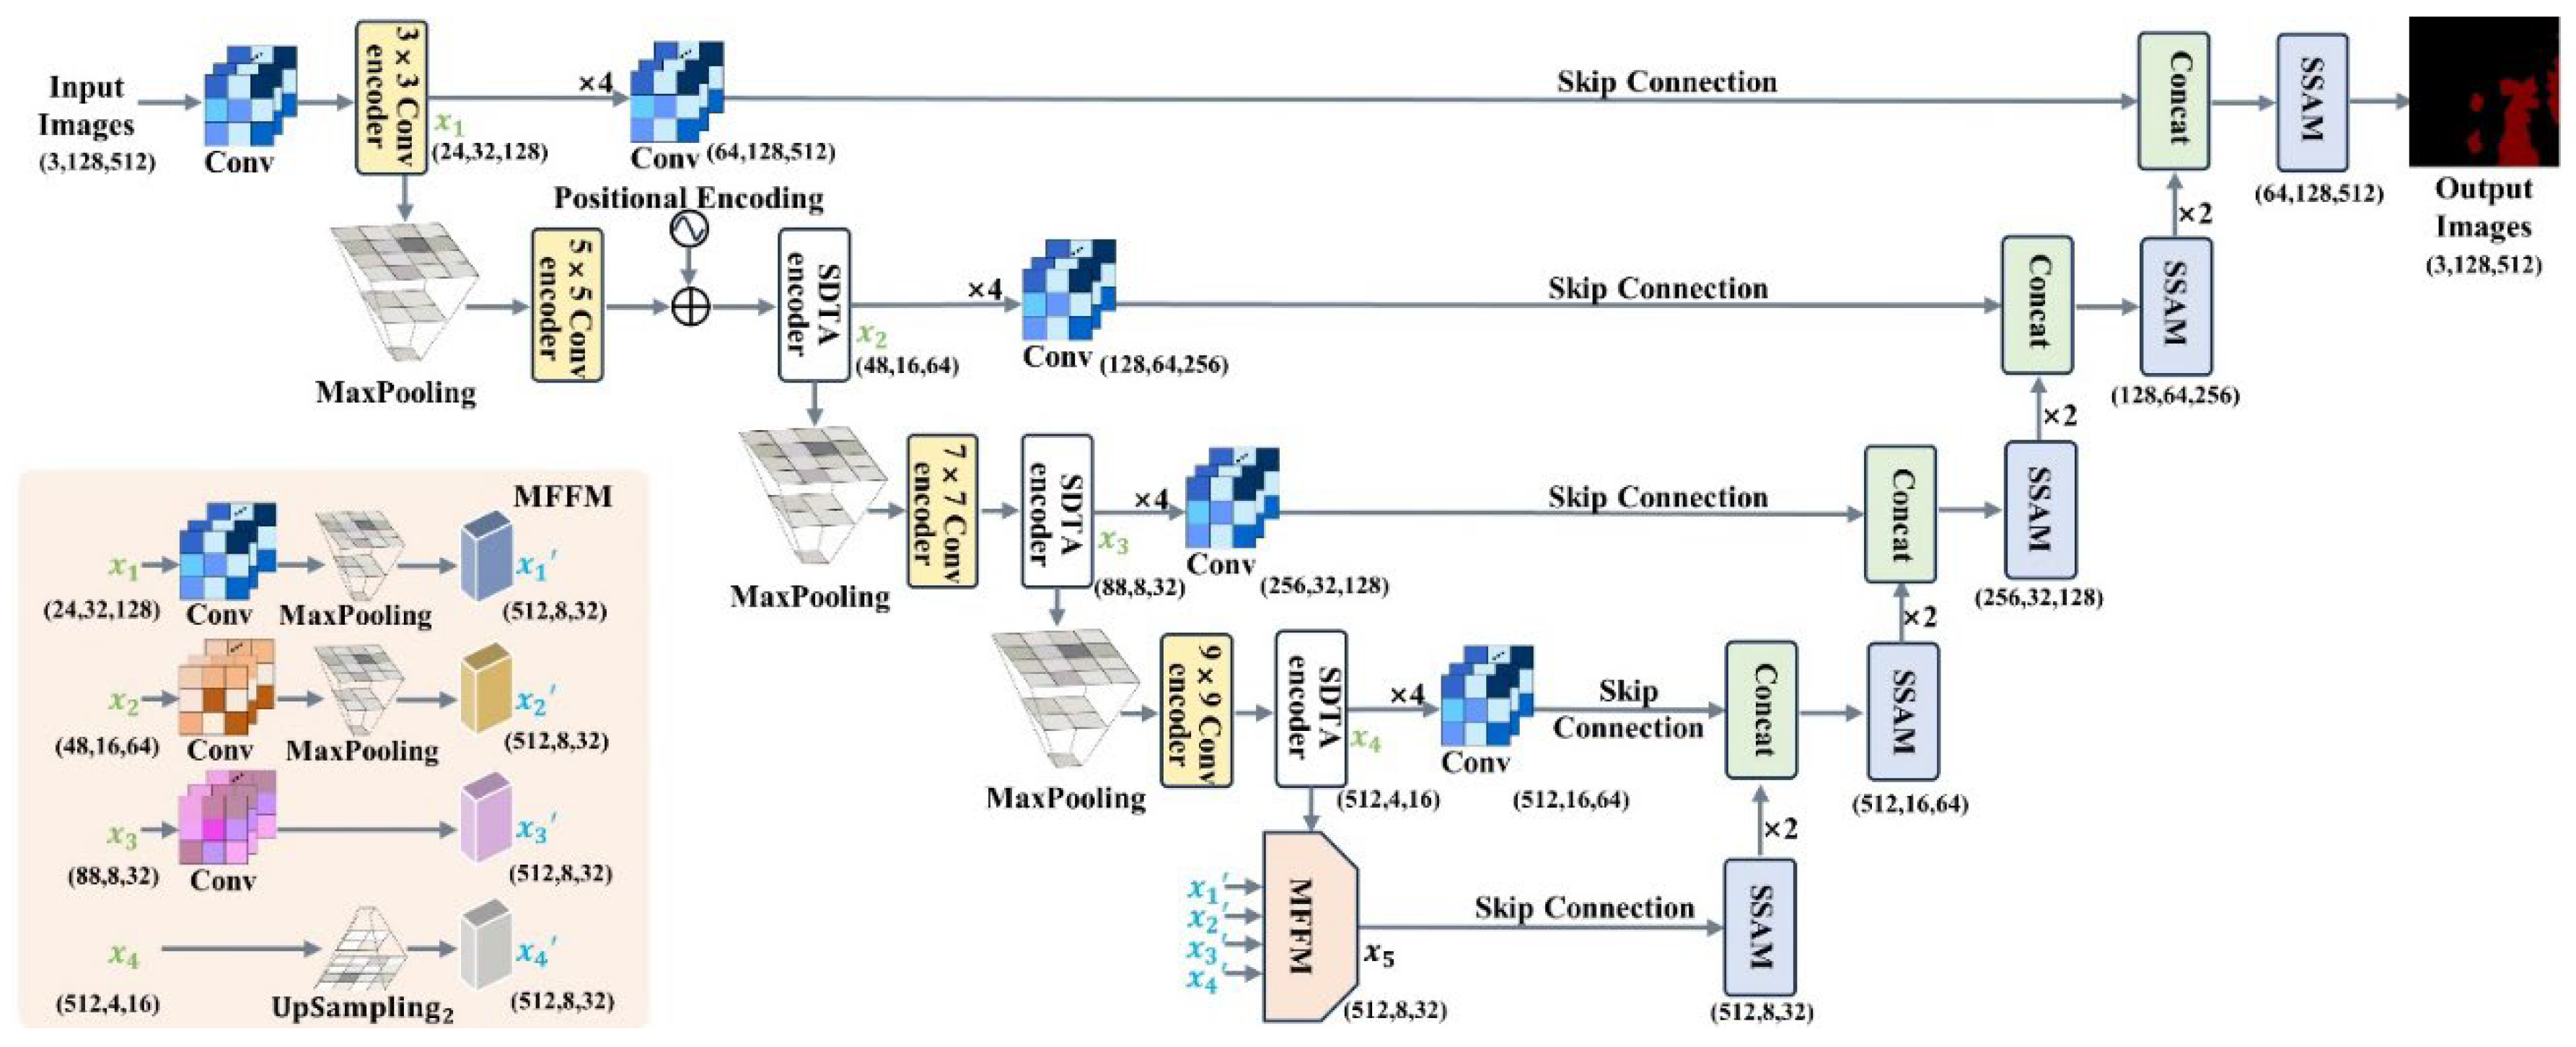
In the leakage region segmentation stage of the ISLS method, we propose our network with the EdgeNext backbone, which comprises only 1.3M parameters [31]. The EdgeNext integrates the advantages of Convolutional Neural Network (CNN) and Vision Transformer (ViT). The CNN extracts local features of images using convolution operation [32], and the ViT [33] captures global contextual information of images. The network is the end-to-end network, where the input channel dimension is 3 (i.e., RGB), and the input image size is 128×512. Our overall network structure is shown in Figure 3, which includes the encoder and decoder.
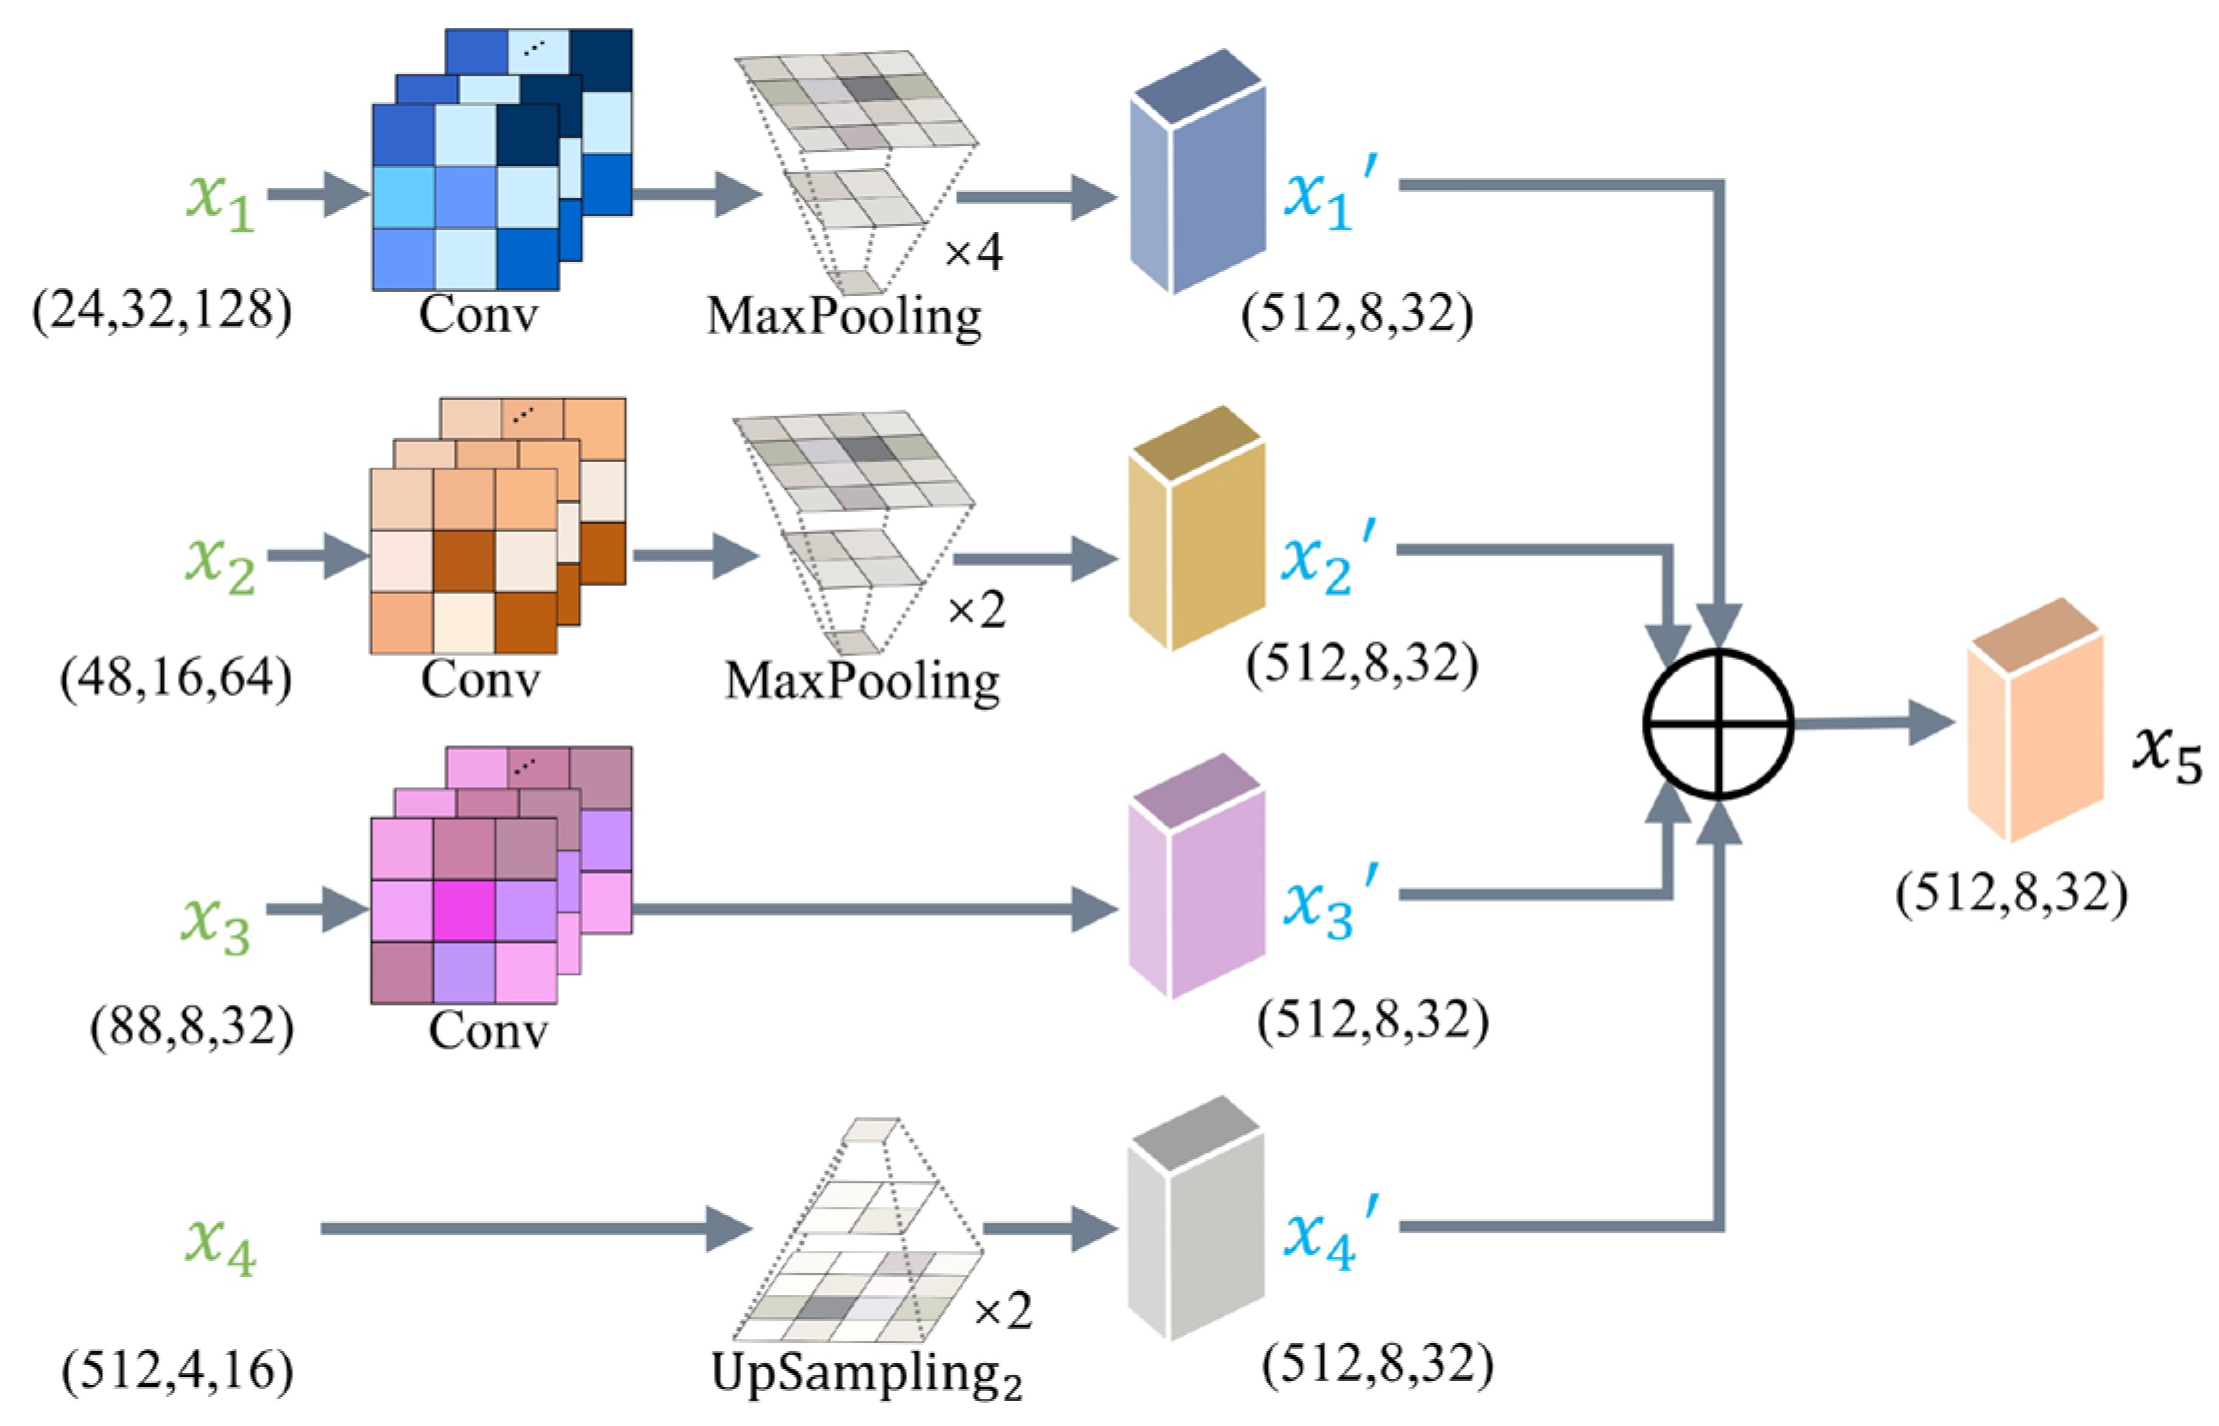
The encoder fuses the local and global representation. Firstly, the n×n Conv encoder consists of three modules. The n×n Conv encoder utilizes adaptive kernels to adjust the size of convolutional kernels based on distinct network layers, which aims to decrease computational complexity and enhance the receptive field [34]. Secondly, the SDTA encoder combines spatial and channel information. The SDTA encoder utilizes deep transposed convolution and adaptive attention mechanisms, which improve the performance of capturing local and global representation. Thirdly, the information of deep and shallow layer feature maps is fused by our MFFM, which improves the performance of encoder feature extraction. Our MFFM structure is as shown in Figure 4.
Specifically, we extract four feature maps of different sizes from the encoder, denoted as x 1 , x 2 , x 3 , x 4 . Firstly, the MFFM adjusts the channel number of the feature map x 1 to 512 through a 1×1 convolution and 4× downsampling. Next, the MFFM applies similar operations with x 1 to the feature map x 2 , with the 2× downsampling, as illustrated in Equation (9):
x i = MaxPooling Conv x i ,   i { 1 ,   2 }
where MaxPooling represents the downsampling process through maximum-pooling operation, Conv represents the convolution operator.
Secondly, x 3 has the same size as the output. Therefore, the MFFM only needs to utilize a 1×1 convolution, to adjust the channel number of the feature map x 3 to 512, as shown in Equation (10):
x 3 = Conv x 3
Thirdly, the channel number of x 4 is same with the output, therefore the MFFM performs only an Upsampling 2 operation on the feature map x 4 The Upsampling 2 is achieved using nearest-neighbor interpolation, as depicted in Equation (11):
x 4 = Upsampling 2 x 4
where Upsampling 2 represents 2× upsampling operation.
Through the above operations, the feature maps x 1 , x 2 , x 3 and x 4 are obtained. Finally, we fuse the feature information of x 1 , x 2 , x 3 and x 4 to output the feature map x 5 , as shown in Equation (12):
x 5 = i = 1 4 x i
The reasons of MFFM small parameter number is that the Conv operator employs a 1×1 convolutional, the Upsampling 2 operation uses nearest-neighbor interpolation, and downsampling is achieved through Maxpooling. 1×1 convolution operation only increases a small number of parameters, upsampling and downsampling operations do not increase the number of parameters. Compared to Feature Pyramid Network (FPN) [35] and AF-FPN [36], the parameter number of our MFFM is relatively small. That is, our MFFM has a parameter number of only 0.23M, with only 3.05% of the FPN and AF-FPN parameter number.
The decoder includes skip-connection and SSAM. The SSAM in the stage 1 of decoder aims to improve the identification of salient features. The SSAM keeps high-resolution in both channel and spatial branches, which enhances the salient features of sauce-packet ROI. Specifically, the SSAM contains two modules, consisting of channel-only module and the spatial-only module, as shown in Figure 5. For the channel-only module of SSAM, the output y in is generated by fusing the feature map x in , obtained from both the skip connection and the channel attention mechanism. The specific computational process for channel attention mechanism is shown in Equation (13).
y ch = S Re Conv x in Re Conv x in y ch = Sig LN Conv y ch
where x in and y ch   represent the input and output of SSAM channel-only module. Conv represents for the convolution operator, Re represents reshape operator, and S represents softmax operator. Additionally, LN represents layer normalization, Sig represents the sigmoid function.
The process of the SSAM spatial-only module is similar, with one part from skip-connection, and the other part from spatial attention mechanism, as shown in Equation (14) for specific operations:
y sp = S Re GP Conv y in Re Conv y in y out = y in Sig LN y sp
where y in and y out represent the input and output of SSAM spatial-only module. GP, S, and LN represent to the global pooling operator, softmax operator, and layer normalization, respectively. and represent the tensor product and multiplication operations, respectively.
The stages 2 to 5 of our proposed network decoder contains SSAM and Concat operator. The Concat operator concatenates feature maps of two branches in the channel dimension, as shown in green box of Figure 3. Specifically, the one branch feature map comes from the SSAM output, which is upsampled 2×. The other branch feature map comes from skip connections, which can avoid gradient vanishing and improve the training speed of the network [37].

3. Experiments and Results

3.1. Dataset and Experiment Setting

Currently, there are almost no publicly available datasets for sauce-packet leakage segmentation. Therefore, we generate a dataset at Nanjing University of Posts and Telecommunications, captured by an industrial high-speed camera namely the MER2-134-90GC, and the Daheng Image industrial lens HN-P-1628-6M-C2/3. Our self-built dataset comprises images with varying degrees of leakage. Specifically, it includes 315 images under normal illumination conditions, 143 images under insufficient illumination, and 148 images with overexposure. Some examples from the self-built dataset are presented in Figure 6.
The backbone of our proposed network is EdgeNext. Our experimental environment is PyTorch 2.0.1. We divide the dataset into training and validation sets, containing 424 and 182 images, respectively. During the training phase, we employed the NVIDIA RTX GPU 4060, while for inference, we deployed it to the NVIDIA Jetson TX2. Meanwhile, we utilize the cross-validation strategy to verify the robustness of the model. During training, we use DiceLoss [38] to measure the degree of similarity between the predicted results and the ground truth. In addition, we employ FocalLoss [39] to relieve class imbalance by emphasizing hard-to-classify examples, which makes the model pay more attention to challenging pixels. During deployment, we utilize pruning technology to accelerate our model.

3.2. Evaluation Indexes

To evaluate the performance of the method, we selected 5 widely used evaluation indices: Mean Intersection over Union (mIoU), Mean Pixel Accuracy (mPA), F1-score, Params, and Frames per Second (FPS). Params is employed as the evaluation index for the model parameters. And FPS is the evaluation index for the inference speed of a model. The definitions are shown in Equation (15)–(17):
mIoU = 1 n i = 1 n TP TP + FP + FN
mPA = 1 n i = 1 n TP TP + FP
F 1 -score = 2 × precision × recall precision + recall
where precision and recall represent TP/(TP+FP) and TP/(TP+FN) respectively.

3.3. Experiment Analysis of ULIE

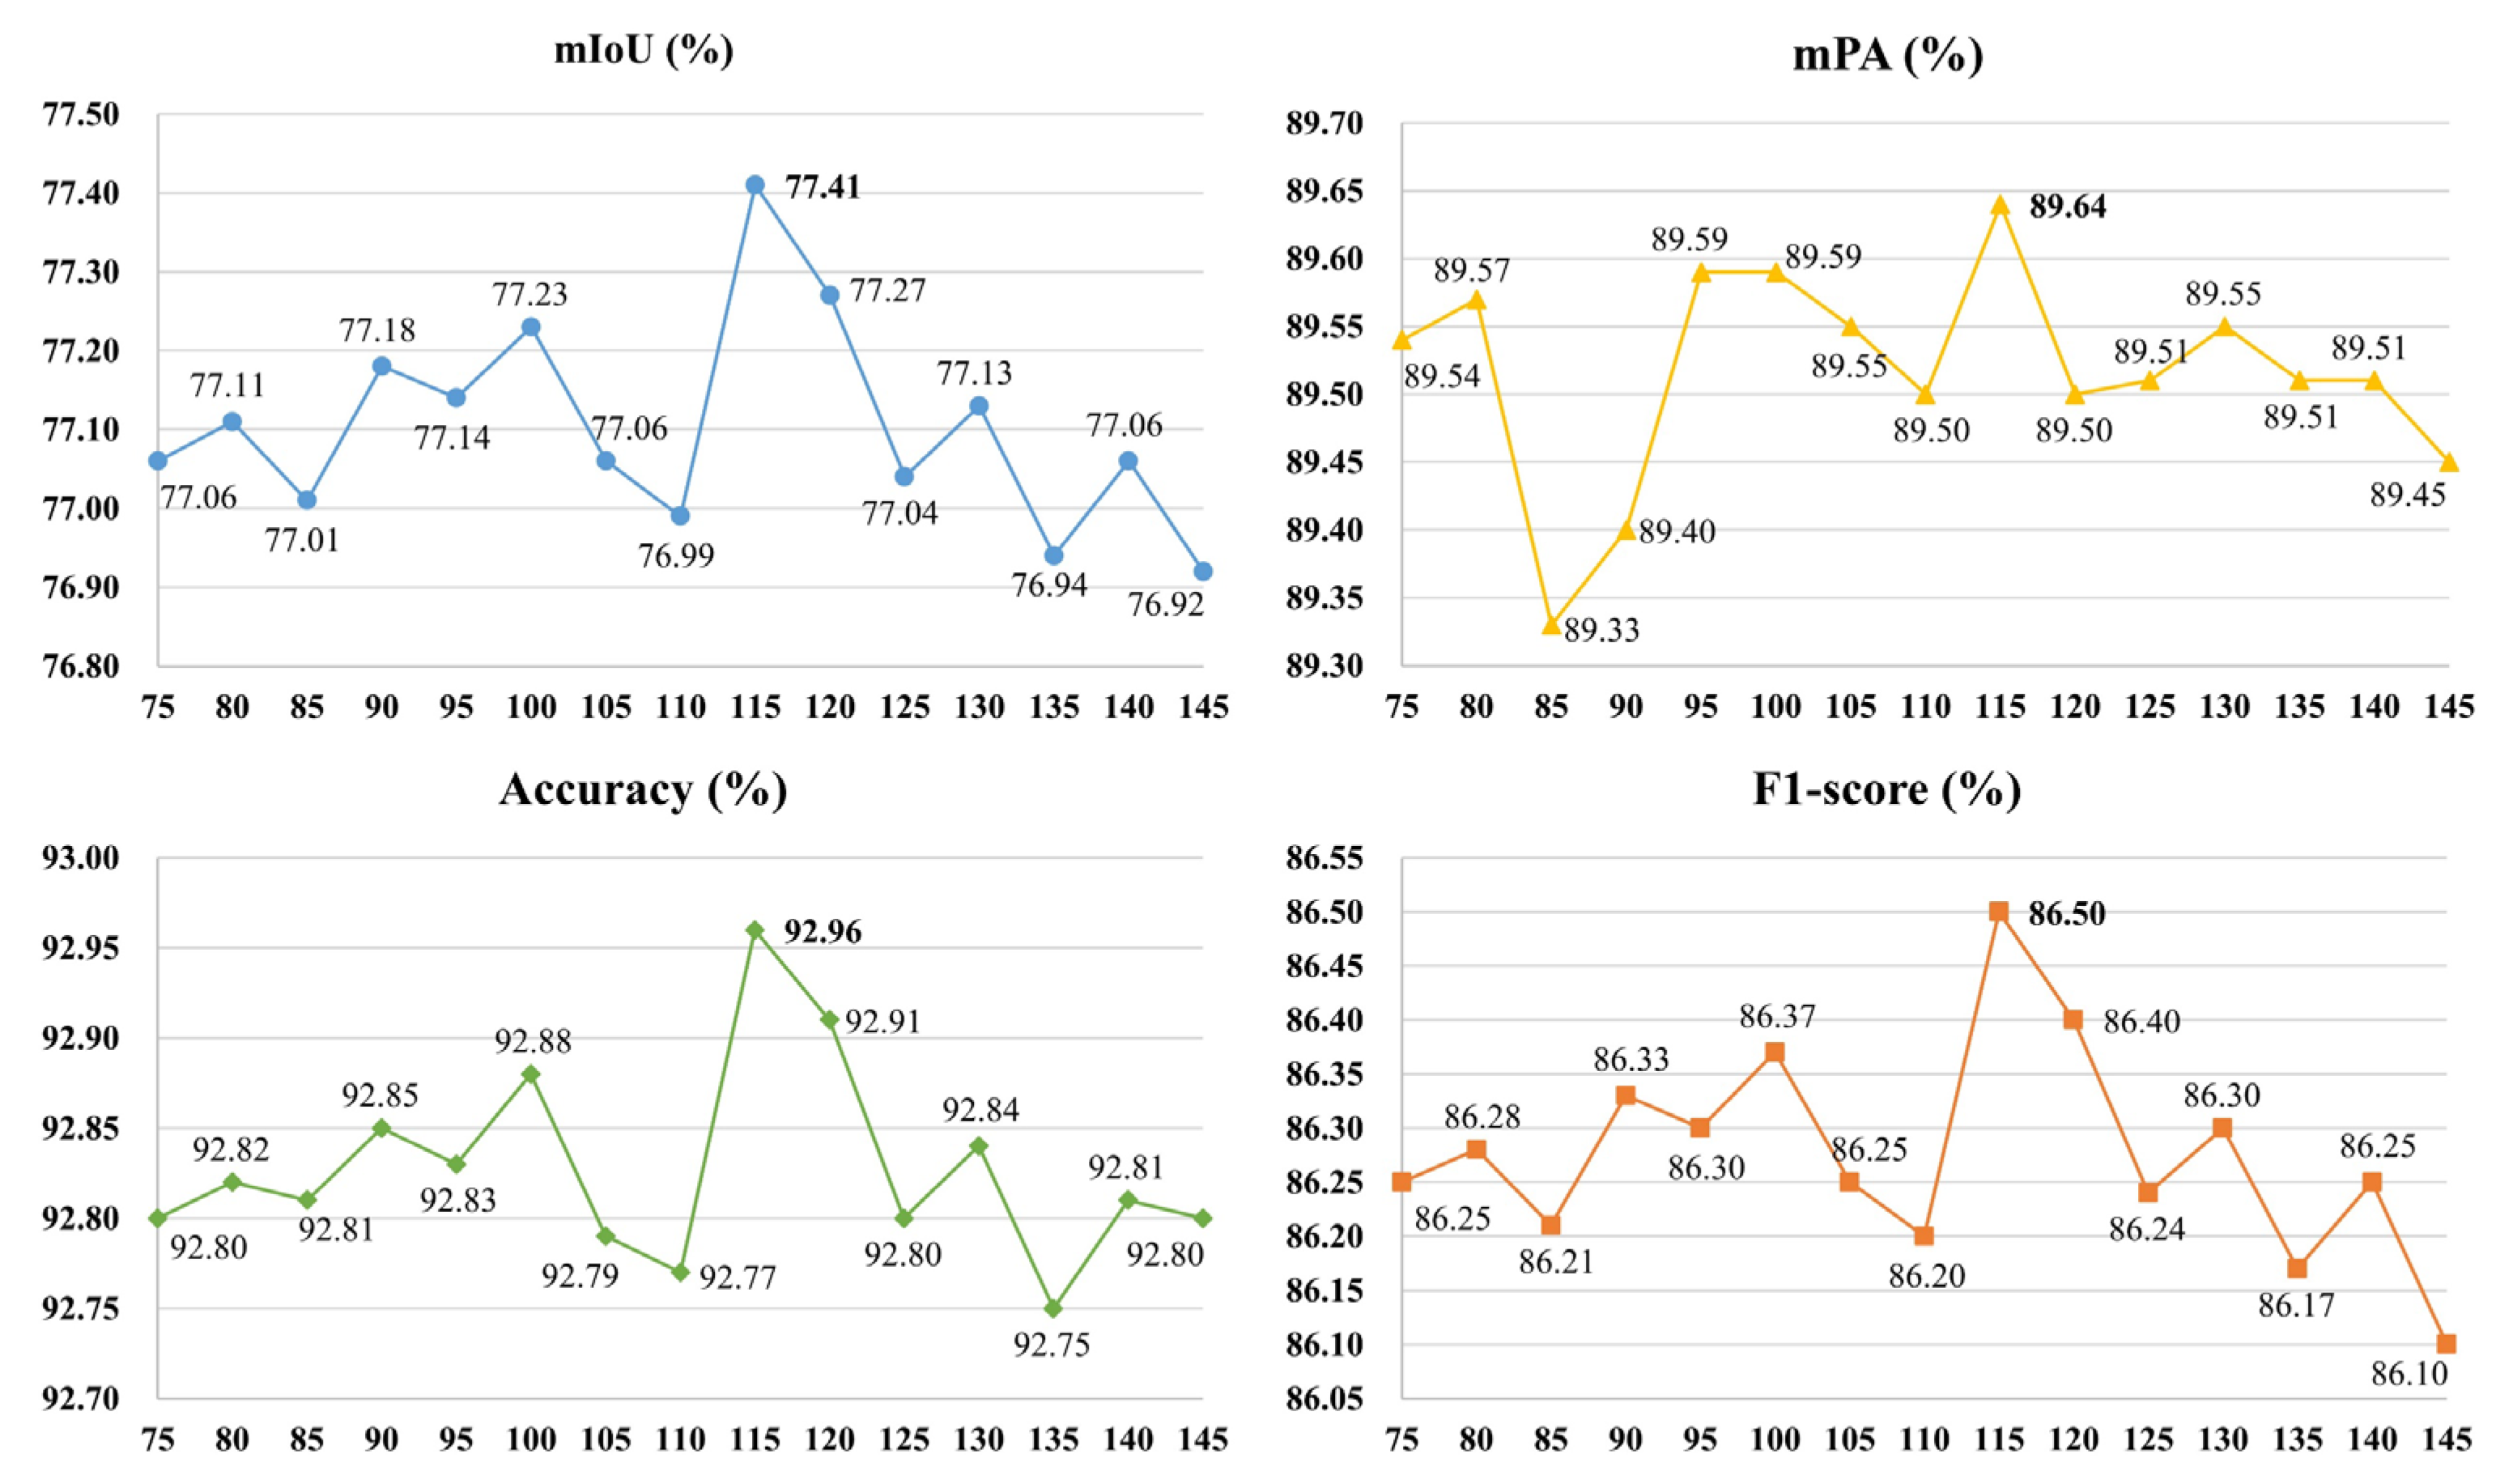
We employ the controlled variable method to explore the optimal thresholds of ULIE for insufficient illumination and overexposure. In the case of insufficient illumination, to validate the optimal threshold as 115, we maintain the overexposure threshold at 180. We adjust the insufficient illumination threshold within the range of 75 to 145. The ISLS evaluation indices (i.e., mIoU, mPA, Accuracy, F1-score) for different thresholds are shown in Figure 7. We observe that the evaluation indices reach optimum when the threshold is set at 115.
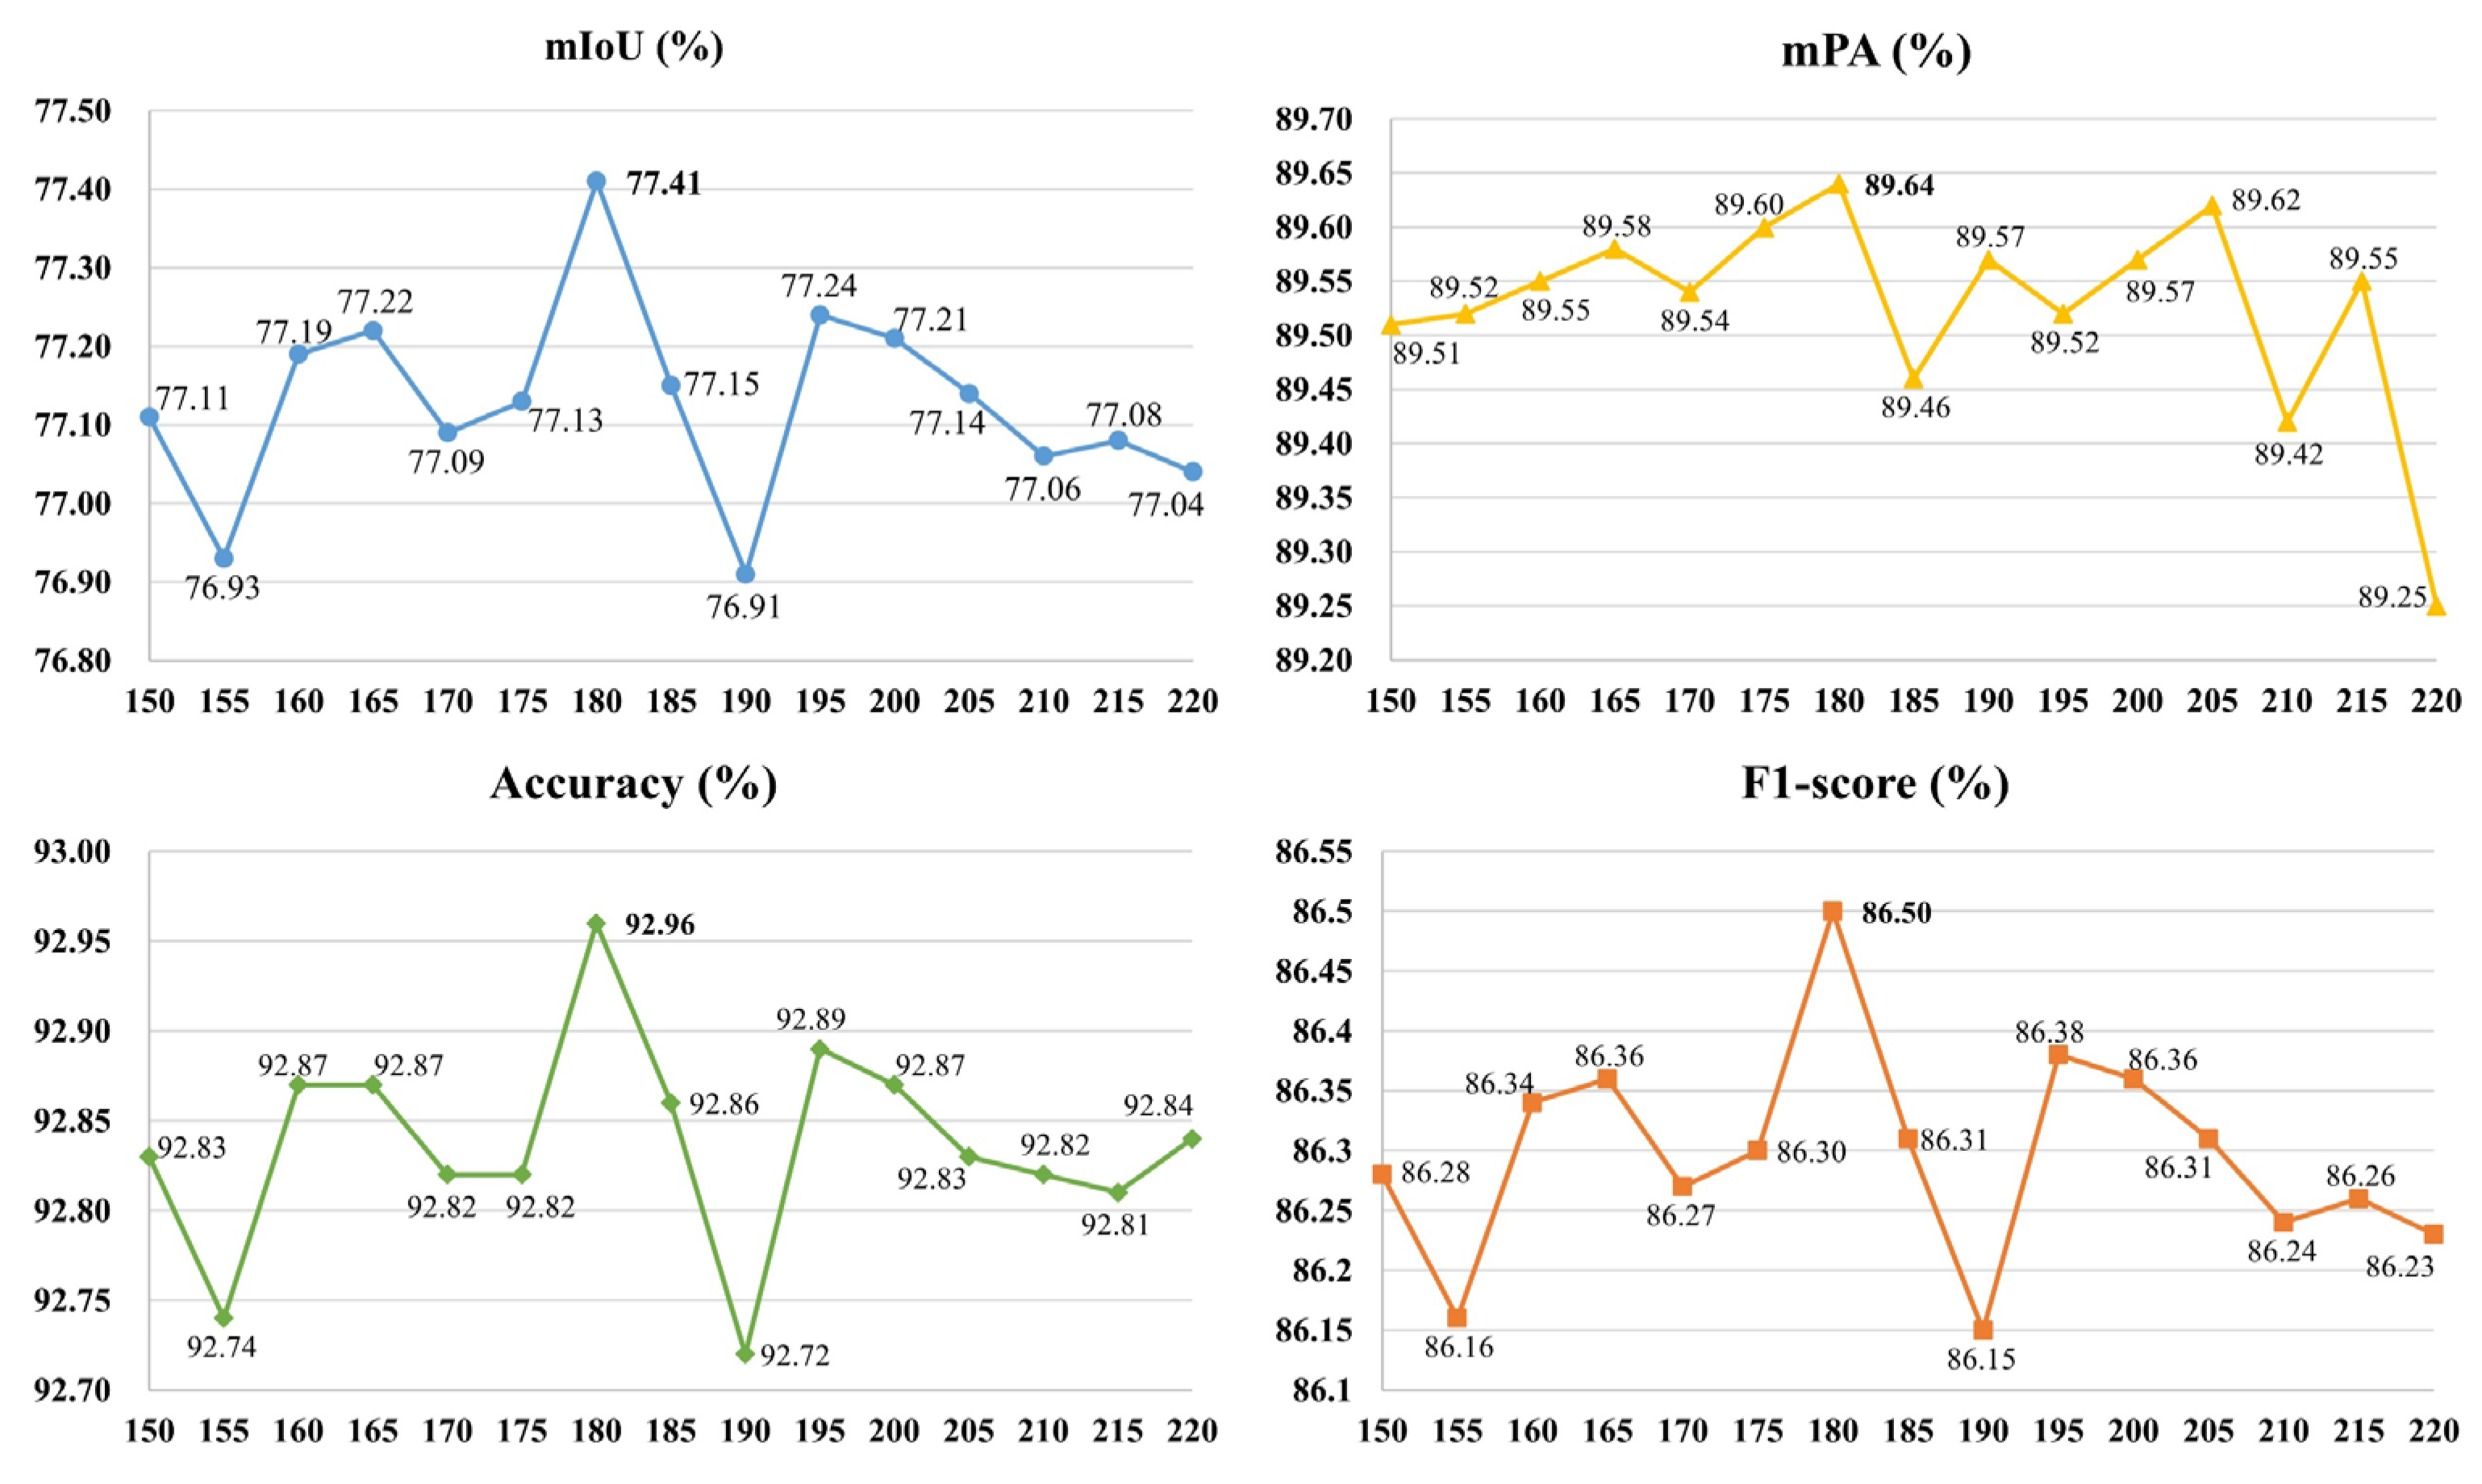
Simultaneously, to verify the optimal threshold for overexposure as 180, we maintain the insufficient illumination threshold at 115. We adjust the overexposure threshold within the range of 150 to 220. The ISLS evaluation indices for various thresholds are presented in Figure 8. It is noted that the evaluation indices achieve their peak performance when the threshold is set at 180.
In summary, we define the thresholds of insufficient illumination and overexposure are 115 and 180, respectively.

3.4. Analysis of Ablation Study

In this paper, we propose the two stage Illumination-aware Sauce-packet Leakage Segmentation (ISLS) method. The ISLS method consists of the Uneven-Light Image Enhancement (ULIE) method, Multi-scale Feature Fusion Module (MFFM), and Sequential Self-Attention Mechanism (SSAM). To assess the performance of ISLS, we conducted ablation studies on each component.
Ablation for ULIE: We propose ULIE to alleviate the problem of blurring images in uneven illumination conditions, which improves the visibility of the images. In Table 1, compared to the baseline, mIoU improves by about 1.5% and mPA by about 3.9% after using ULIE. The ULIE method is not based on deep learning, which relies on the adjustment and optimization of image illumination and contrast. Hence, the ULIE method does not require training any parameters. Through Section 2.1 methods and formulas, the ULIE method adaptively enhances the illumination and contrast of images.
Ablation for MFFM: The mIoU and mPA of the MFFM reach 78.7% and 87.9%, as shown in Table 1. Compared with baseline, the mIoU and mPA of MFFM increase 3.1% and 2.3%. In comparison to other feature fusion modules, MFFM exhibits significantly fewer parameters than both FPN and AF-FPN, with only 3.05% of FPN and AF-FPN. Additionally, the mIoU and mPA of MFFM are 1.4% and 2.7% higher than FPN, and the mIoU and mPA of MFFM are 3.4% and 4.3% higher than AF-FPN. Significantly, FPN and AF-FPN structures are intricate, and the features of leakage are monotonous, rendering the extraction of salient features less effective.
Ablation for SSAM: We add attention mechanism to ISLS to improve the performance of feature extraction and compare with Global Attention Mechanism (GAM) [40] and Simple, Parameter-Free Attention Module (SimAM) [41]. In Table 2, it can be observed that utilizing SSAM results in an improvement of about 2.4% in mIoU compared to GAM and around 3.7% compared to SimAM. Additionally, mPA shows an increase of approximately 0.9% and 3.5%, respectively.
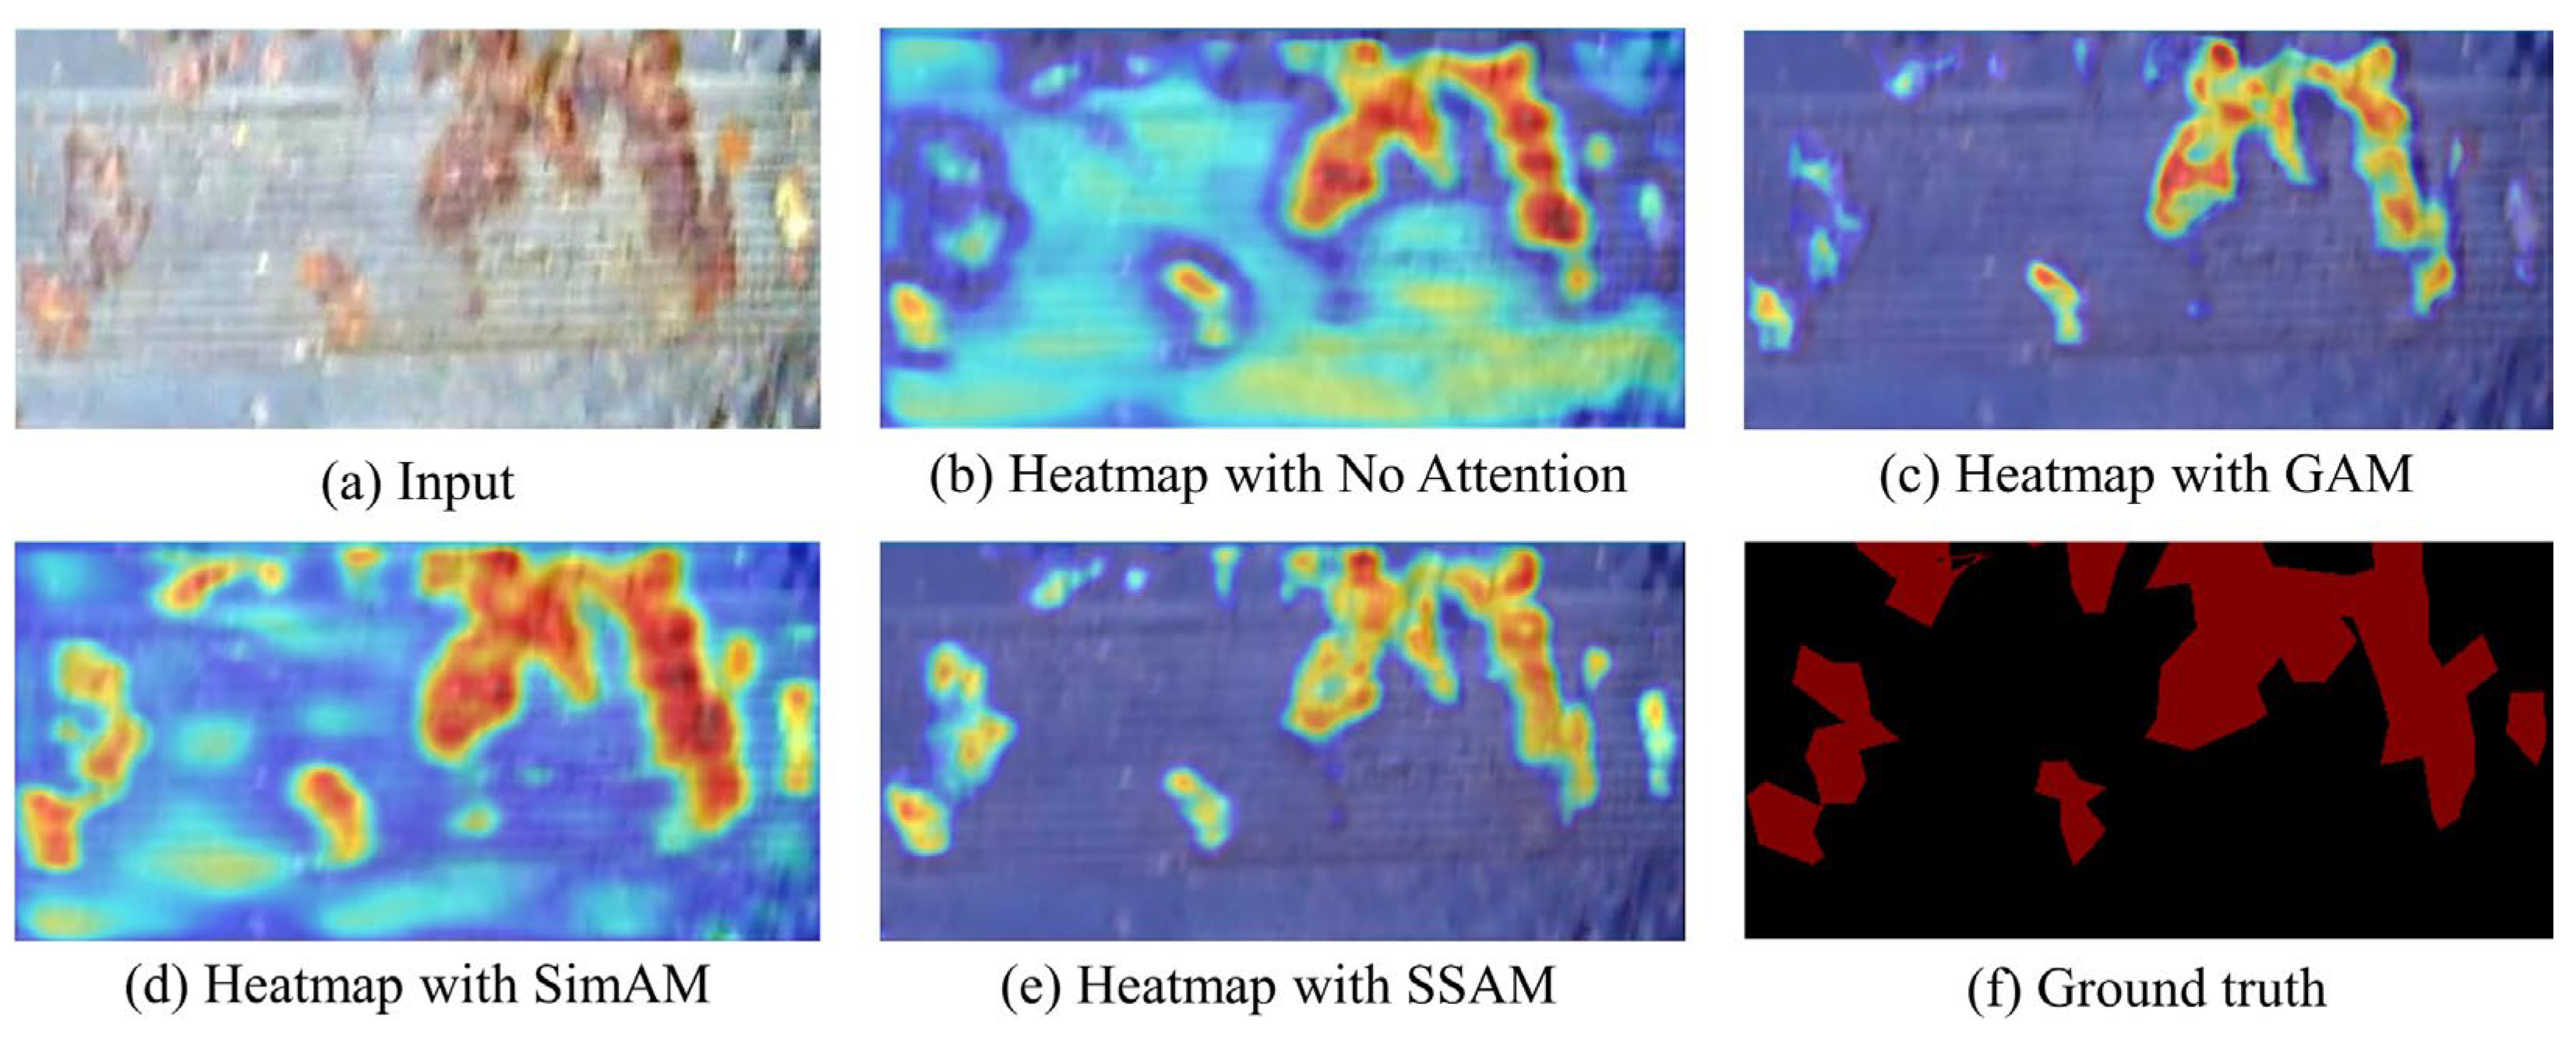
To further analyze the effectiveness of our method, we use the Grad-cam [43] to visualize the attention heatmap. As shown in Figure 9, the redder the heatmap, the more the attention mechanism focuses on the feature. Figure 9c exhibits strong capabilities for global feature extraction but shows insufficient performance in capturing local information. Figure 9b,d does not fully focus on the leakage regions and exists the problem of attention divergence. Our ISLS method with SSAM effectively alleviates interference from invalid information, which results in a more focused on leakage regions, as shown in Figure 9e.
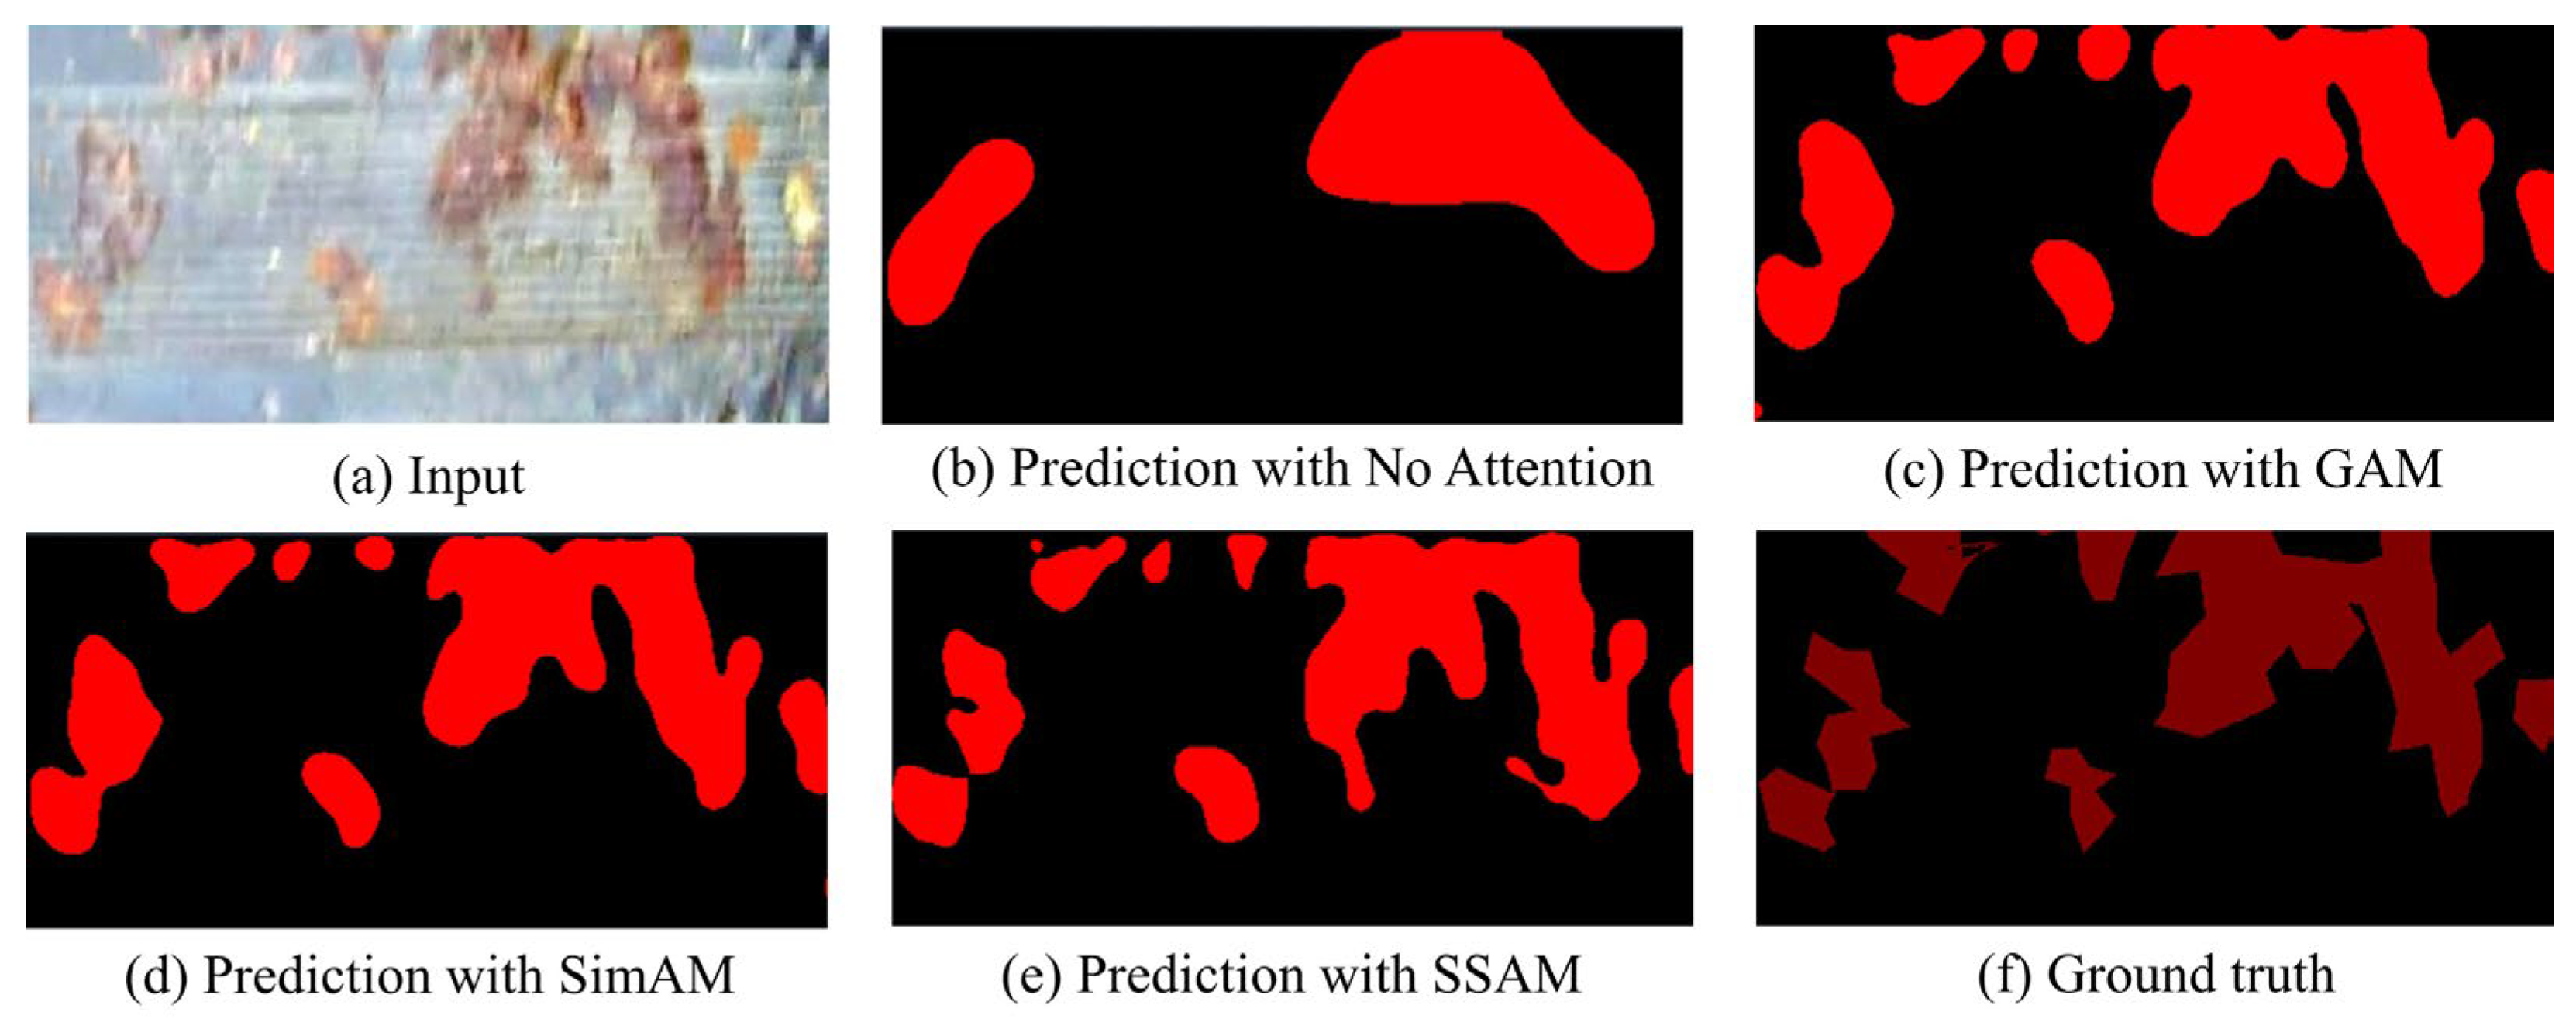
The leakage segmentation results of sauce-packet with different attention mechanisms are shown in Figure 10. Our method with SSAM achieves more refined leakage boundary segmentation for sauce-packets by employing spatial and channel adaptive weighting.
Our proposed ISLS achieves 4 FPS on the NVIDIA Jetson TX2. Our ISLS meets the real-time requirements for industrial applications, which demand a minimum of 3 FPS. Figure 11a illustrates the CPU utilization of the ISLS method. The GPU utilization of the leakage segmentation stage is illustrated in Figure 11b.
Before optimization, the GPU utilization often approached 100% (green line), posing risks of system crashes or failures. To ensure system stability and device reliability, we optimized the ISLS method by integrating L1 unstructured pruning technology [44], with a reduction of 20% in the model’s parameter. Performing fine-tuning training while pruning can effectively mitigate the performance degradation caused by pruning, with almost no decrease in accuracy. The GPU utilization after optimization decreases to a certain extent (red line), accelerating model inference while simultaneously decreasing GPU load and enhancing system stability.
Figure 11c illustrates the comparison between the FPS before optimization (green line) and after optimization (red line). Experimental results demonstrate a significant improvement in the performance of our method after optimization. Compared with the unoptimized method, the optimized method improves FPS by 2.7 times.
Experimental results demonstrate that ISLS performs well under uneven illumination conditions. We deploy the ISLS on intelligent sensors, the system fulfills the real-time requirements of industrial applications.

3.5. Comparison with Other Segmentation Methods

In this section, we compare ISLS with several state-of-the-art (SOTA) semantic segmentation networks, including HRNet [13], BiseNetv2 [14], SegFormer [15], PSPNet [45], DeepLabv3 [46], and LIEPNet [18]. The evaluation results are shown in Table 3. The design advantage of our model alleviates the negative impact of uneven illumination and effectively captures semantic features of multi-level leakage. Consequently, we achieved the highest accuracy, with mIoU, mPA, and F1-score reaching 80.8%, 90.1%, and 88.8%, respectively.
Additionally, we compare ISLS with several classical traditional segmentation methods, including template matching [48], Canny edge segmentation [49], contour segmentation [50], PCA segmentation [51], and iForest segmentation [54]. The evaluation results of traditional leakage segmentation algorithms are shown in Table 4. The performance of traditional methods is insufficient in the sauce-packet leakage segmentation. On the one hand, some traditional algorithms mistakenly identify sealing imprints on the sauce-packet and the black blocks. On the other hand, these algorithms significantly affected by uneven-lighting conditions. These above problems of traditional algorithms result in lower accuracy in sauce-packet leakage segmentation.

4. Conclusions

In this paper, our objective is to address the issue of detecting leakage in blurred images under uneven illumination conditions. We propose the Illumination-aware Sauce-packet Leakage Segmentation (ISLS) method, consisting of illumination-aware region enhancement and leakage region segmentation stages. The first stage of ISLS reduces redundant computations of image enhancement processing and alleviates the image blurring caused by uneven illumination, which effectively enhances image details and textures. In the second stage of ISLS, we design a leakage segmentation network. In our proposed network, the Multi-scale Feature Fusion Module (MFFM) efficiently fuses the shallow and deep layer features with a small number of parameters, which improves the feature extraction performance. Additionally, the Sequential Self-Attention Mechanism (SSAM) achieves feature enhancement in both channel and spatial dimensions, improving the identification of salient features. Extensive experiments on our self-built dataset demonstrate that our method effectively alleviates the blurred sauce-packet imaging issue and outperforms existing algorithms. Furthermore, our method improves the stability and reliability of industrial systems and reduces the waste of production resources. The performance testing of the intelligent sensors also validates the suitability of our ISLS method for the current scenario.
In future work, we will further focus on model parameter compression and precision tuning. Meanwhile, we will contemplate the deployment of the state-of-the-art SAM large model on the edge to augment the quality inspection rate of industrial sauce-packet products, thereby enhancing the efficacy of quality control processes.

Author Contributions

Conceptualization, S.Y. and S.L.(Shijun); methodology, S.Y. and S.L.(Shijun); software, S.Y. and S.L.(Shijun); validation, S.Y., S.L.(Shijun) and Y.F.; formal analysis, S.Y., S.L.(Shijun) and Y.F.; investigation, S.Y., J.F., and Z.Y; resources, Y.F., J.F. and Z.Y.; data curation, Y.F., J.F., and Z.Y; writing—original draft preparation, S.L.(Shijun); writing—review and editing, S.Y.; visualization, S.L.(Shijun); supervision, S.Y.; project administration, S.L.(Shangdong) and Y.J.; funding acquisition, S.L.(Shangdong) and Y.J. All authors have read and agreed to the published version of the manuscript.

Funding

This research was funded by the National Key R&D Program of China (2023YFB2904000), Jiangsu Key Development Planning Project (BE2023004-2), Natural Science Foundation of Jiangsu Province (Higher Education Institutions) (20KJA520001), The 14th Five-Year Plan project of Equipment Development Department (315107402), Jiangsu Hongxin Information Technology Co., Ltd. Project (JSSGS2301022EGN00), Open Research Project of Zhejiang Lab (No.2021KF0AB05), National Natural Science Foundation of China (No.62076139), Future Network Scientific Research Fund Project (No. FNSRFP-2021-YB-15).

Data Availability Statement

The data that support the findings of this study are available from the corresponding author, [Ji, Liu], upon reasonable request.

Conflicts of Interest

The authors declare that there is no confict of interest regarding the publication of the paper.

References

  1. Zhu, Y.; Xu, Z.; Lin, Y.; Chen, D.; Ai, Z.; Zhang, H. A Multi-Source Data Fusion Network for Wood Surface Broken Defect Segmentation. Sensors 2024, 24, 1635. [Google Scholar] [CrossRef] [PubMed]
  2. Liu, S.; Li, Z.; Wang, G.; Qiu, X.; Liu, T.; Cao, J.; Zhang, D. Spectral–Spatial Feature Fusion for Hyperspectral Anomaly Detection. Sensors 2024, 24, 1652. [Google Scholar] [CrossRef] [PubMed]
  3. Wu, Q.; Li, H.; Tian, C.; et al. AEKD: Unsupervised auto-encoder knowledge distillation for industrial anomaly detection[J]. Journal of Manufacturing Systems, 2024, 73, 159–169. [Google Scholar] [CrossRef]
  4. He, X.; Kong, D.; Yang, G.; et al. Hybrid neural network-based surrogate model for fast prediction of hydrogen leak consequences in hydrogen refueling station[J]. International Journal of Hydrogen Energy, 2024, 59, 187–198. [Google Scholar] [CrossRef]
  5. Rai, S.N.; Cermelli, F.; Fontanel, D.; et al. Unmasking anomalies in road-scene segmentation[C]. International Conference on Computer Vision. 2023, 4037–4046. [Google Scholar]
  6. Li, J.; Lu, Y.; Lu, R. Detection of early decay in navel oranges by structured-illumination reflectance imaging combined with image enhancement and segmentation[J]. Postharvest Biology and Technology, 2023, 196, 112162. [Google Scholar] [CrossRef]
  7. Fulir, J.; Bosnar, L.; Hagen, H.; et al. Synthetic Data for Defect Segmentation on Complex Metal Surfaces[C]. Computer Vision and Pattern Recognition. 2023, 4423–4433. [Google Scholar]
  8. Gertsvolf, D.; Horvat, M.; Aslam, D.; et al. A U-net convolutional neural network deep learning model application for identification of energy loss in infrared thermographic images[J]. Applied Energy, 2024, 360, 122696. [Google Scholar] [CrossRef]
  9. Qi, S.; Alajarmeh, O.; Shelley, T.; et al. Fibre waviness characterisation and modelling by Filtered Canny Misalignment Analysis[J]. Composite Structures, 2023, 307, 116666. [Google Scholar] [CrossRef]
  10. Sharma, A.K.; Nandal, A.; Dhaka, A.; et al. HOG transformation based feature extraction framework in modified Resnet50 model for brain tumor detection[J]. Biomedical Signal Processing and Control, 2023, 84, 104737. [Google Scholar] [CrossRef]
  11. Liu, H.; Jia, X.; Su, C.; et al. Tir0e appearance defect detection method via combining HOG and LBP features[J]. Frontiers in Physics, 2023, 10, 1099261. [Google Scholar] [CrossRef]
  12. Ma, B.; Zhu, W.; Wang, Y.; et al. The defect detection of personalized print based on template matching[C]. IEEE International Conference on Unmanned Systems. 2017: 266-271.
  13. Wang, J.; Sun, K.; Cheng, T.; et al. Deep high-resolution representation learning for visual recognition[J]. IEEE Transactions on Pattern Analysis and Machine Intelligence, 2020, 43, 3349–3364. [Google Scholar] [CrossRef] [PubMed]
  14. Yu, C.; Gao, C.; Wang, J.; et al. Bisenet v2: Bilateral network with guided aggregation for real-time semantic segmentation[J]. International Journal of Computer Vision, 2021, 129, 3051–3068. [Google Scholar] [CrossRef]
  15. Xie, E.; Wang, W.; Yu, Z.; et al. SegFormer: Simple and efficient design for semantic segmentation with transformers[J]. Advances in Neural Information Processing Systems, 2021, 34, 12077–12090. [Google Scholar]
  16. Cao, H.; Wang, Y.; Chen, J.; et al. Swin-unet: Unet-like pure transformer for medical image segmentation[C]. European Conference on Computer Vision. 2022, 205–218. [Google Scholar]
  17. Zhang, H.; Xu, D.; Cheng, D.; et al. An Improved Lightweight Yolo-Fastest V2 for Engineering Vehicle Recognition Fusing Location Enhancement and Adaptive Label Assignment[J]. IEEE Journal of Selected Topics in Applied Earth Observations and Remote Sensing, 2023, 16, 2450–2461. [Google Scholar] [CrossRef]
  18. Liu, S.; Mei, C.; You, S.; et al. A Lightweight and Efficient Infrared Pedestrian Semantic Segmentation Method[J]. IEICE Transcations on Information and Systems, 2023, 106, 1564–1571. [Google Scholar] [CrossRef]
  19. Pu, T.; Wang, S.; Peng, Z.; et al. VEDA: Uneven-light image enhancement via a vision-based exploratory data analysis model[J]. arXiv preprint 2023, arXiv:2305.16072. [Google Scholar]
  20. Guo, X.; Li, Y.; Ling, H. LIME: Low-light image enhancement via illumination map estimation[J]. IEEE Transactions on Image Processing, 2016, 26, 982–993. [Google Scholar] [CrossRef]
  21. Sun, Y.; Zhao, Z.; Jiang, D.; et al. Low-illumination image enhancement algorithm based on improved multi-scale Retinex and ABC algorithm optimization[J]. Frontiers in Bioengineering and Biotechnology, 2022, 10, 865820. [Google Scholar] [CrossRef]
  22. Xu, J.; Hou, Y.; Ren, D.; et al. Star: A structure and texture aware retinex model[J]. IEEE Transactions on Image Processing, 2020, 29, 5022–5037. [Google Scholar] [CrossRef] [PubMed]
  23. Hussein, R.R.; Hamodi, Y.I.; Rooa, A.S. Retinex theory for color image enhancement: A systematic review[J]. International Journal of Electrical and Computer Engineering, 2019, 9, 5560. [Google Scholar] [CrossRef]
  24. Wu, W.; Weng, J.; Zhang, P.; et al. Uretinex-net: Retinex-based deep unfolding network for low-light image enhancement[C]. Computer Vision and Pattern Recognition. 2022: 5901-5910.
  25. Yang, J.; Bhattacharya, K. Augmented Lagrangian digital image correlation[J]. Experimental Mechanics, 2019, 59, 187–205. [Google Scholar] [CrossRef]
  26. Yahya, A.A.; Tan, J.; Su, B.; et al. BM3D image denoising algorithm based on an adaptive filtering[J]. Multimedia Tools and Applications, 2020, 79, 20391–20427. [Google Scholar] [CrossRef]
  27. Wen, X.; Pan, Z.; Hu, Y.; et al. Generative adversarial learning in YUV color space for thin cloud removal on satellite imagery[J]. Remote Sensing, 2021, 13, 1079. [Google Scholar] [CrossRef]
  28. Jha, M.; Bhandari, A.K. Camera response based nighttime image enhancement using concurrent reflectance[J]. IEEE Transactions on Instrumentation and Measurement, 2022, 71, 1–11. [Google Scholar] [CrossRef]
  29. Liu, J.; Zhou, X.; Wan, Z.; et al. Multi-Scale FPGA-Based Infrared Image Enhancement by Using RGF and CLAHE[J]. Sensors, 2023, 23, 8101. [Google Scholar] [CrossRef] [PubMed]
  30. Shah, A.; Bangash, J.I.; Khan, A.W.; et al. Comparative analysis of median filter and its variants for removal of impulse noise from gray scale images[J]. Journal of King Saud University-Computer and Information Sciences, 2022, 34, 505–519. [Google Scholar] [CrossRef]
  31. Maaz, M.; Shaker, A.; Cholakkal, H.; et al. Edgenext: Efficiently amalgamated cnn-transformer architecture for mobile vision applications[C]. European Conference on Computer Vision. 2022: 3-20.
  32. Jiang, Z.; Dong, Z.; Wang, L.; et al. Method for diagnosis of acute lymphoblastic leukemia based on ViT-CNN ensemble model[J]. Computational Intelligence and Neuroscience, 2021.
  33. Vaswani, A.; Shazeer, N.; Parmar, N.; et al. Attention is all you need[J]. Advances in Neural Information Processing Systems, 2017, 30.
  34. Zamora Esquivel, J.; Cruz Vargas, A.; Lopez Meyer, P.; et al. Adaptive convolutional kernels[C]. International Conference on Computer Vision Workshop. 2019: 1998-2005.
  35. Lin, T.-Y.; Doll’ar, P.; Girshick, R.; He, K.; Hariharan, B.; Belongie, S. Feature pyramid networks for object detection[C]. Computer Vision and Pattern Recognition. 2117–2125, 2017.
  36. Wang, J.; Chen, Y.; Dong, Z.; et al. Improved YOLOv5 network for real-time multi-scale traffic sign detection[J]. Neural Computing and Applications, 2023, 35, 7853–7865. [Google Scholar] [CrossRef]
  37. He, K.; Zhang, X.; Ren, S.; et al. Deep residual learning for image recognition[C]. Computer Vision and Pattern Recognition. 2016: 770-778.
  38. Jadon, S. A survey of loss functions for semantic segmentation[C]. Computational Intelligence in Bioinformatics and Computational Biolog. 2020: 1-7.
  39. Lin, T.Y.; Goyal, P.; Girshick, R.; et al. Focal loss for dense object detection[C]. International Conference on Computer Vision. 2017: 2980-2988.
  40. Liu, Y.; Shao, Z.; Hoffmann, N. Global attention mechanism: Retain information to enhance channel-spatial interactions[J]. arXiv preprint arXiv:2112.05561, 2021.
  41. Yang, L.; Zhang, R.Y.; Li, L.; et al. Simam: A simple, parameter-free attention module for convolutional neural networks[C]. International Conference on Machine Learning. 2021: 11863-11874.
  42. Liu, H.; Liu, F.; Fan, X.; et al. Polarized self-attention: Towards high-quality pixel-wise regression[J]. arXiv preprint arXiv:2107.00782, 2021.
  43. Selvaraju, R.R.; Cogswell, M.; Das, A.; et al. Grad-cam: Visual explanations from deep networks via gradient-based localization[C]. International Conference on Computer Vision. 2017: 618-626.
  44. Sun, X.; Shi, H. Towards Better Structured Pruning Saliency by Reorganizing Convolution[C]. Winter Conference on Applications of Computer Vision. 2024: 2204-2214.
  45. Zhao, H.; Shi, J.; Qi, X.; et al. Pyramid scene parsing network[C]. Computer Vision and Pattern Recognition. 2017: 2881-2890.
  46. Chen, L.C.; Papandreou, G.; Kokkinos, I.; et al. Deeplab: Semantic image segmentation with deep convolutional nets, atrous convolution, and fully connected crfs[J]. Transactions on Pattern Analysis and Machine Intelligence, 2017, 40, 834–848. [Google Scholar] [CrossRef]
  47. Basulto-Lantsova, A.; Padilla-Medina, J.A.; Perez-Pinal, F.J.; et al. Performance comparative of OpenCV Template Matching method on Jetson TX2 and Jetson Nano developer kits[C]. Annual Computing and Communication Workshop and Conference. 2020: 0812-0816.
  48. Ouyang, Z.; Xue, L.; Ding, F.; et al. An algorithm for extracting similar segments of moving target trajectories based on shape matching[J]. Engineering Applications of Artificial Intelligence, 2024, 127, 107243. [Google Scholar] [CrossRef]
  49. Chen, Y.; Ge, P.; Wang, G.; et al. An overview of intelligent image segmentation using active contour models[J]. Intell. Robot., 2023, 3, 23–55. [Google Scholar] [CrossRef]
  50. Maturkar, P.A.; Gaikwad, M.A. Comparative analysis of texture segmentation using RP, PCA and Live wire for Arial images[M]. Recent Advances in Material, Manufacturing, and Machine Learning. 2023: 590-598.
  51. Cheng, Z.; Zou, C.; Dong, J. Outlier detection using isolation forest and local outlier factor[C]. Research in Adaptive and Convergent Systems. 2019: 161-168.
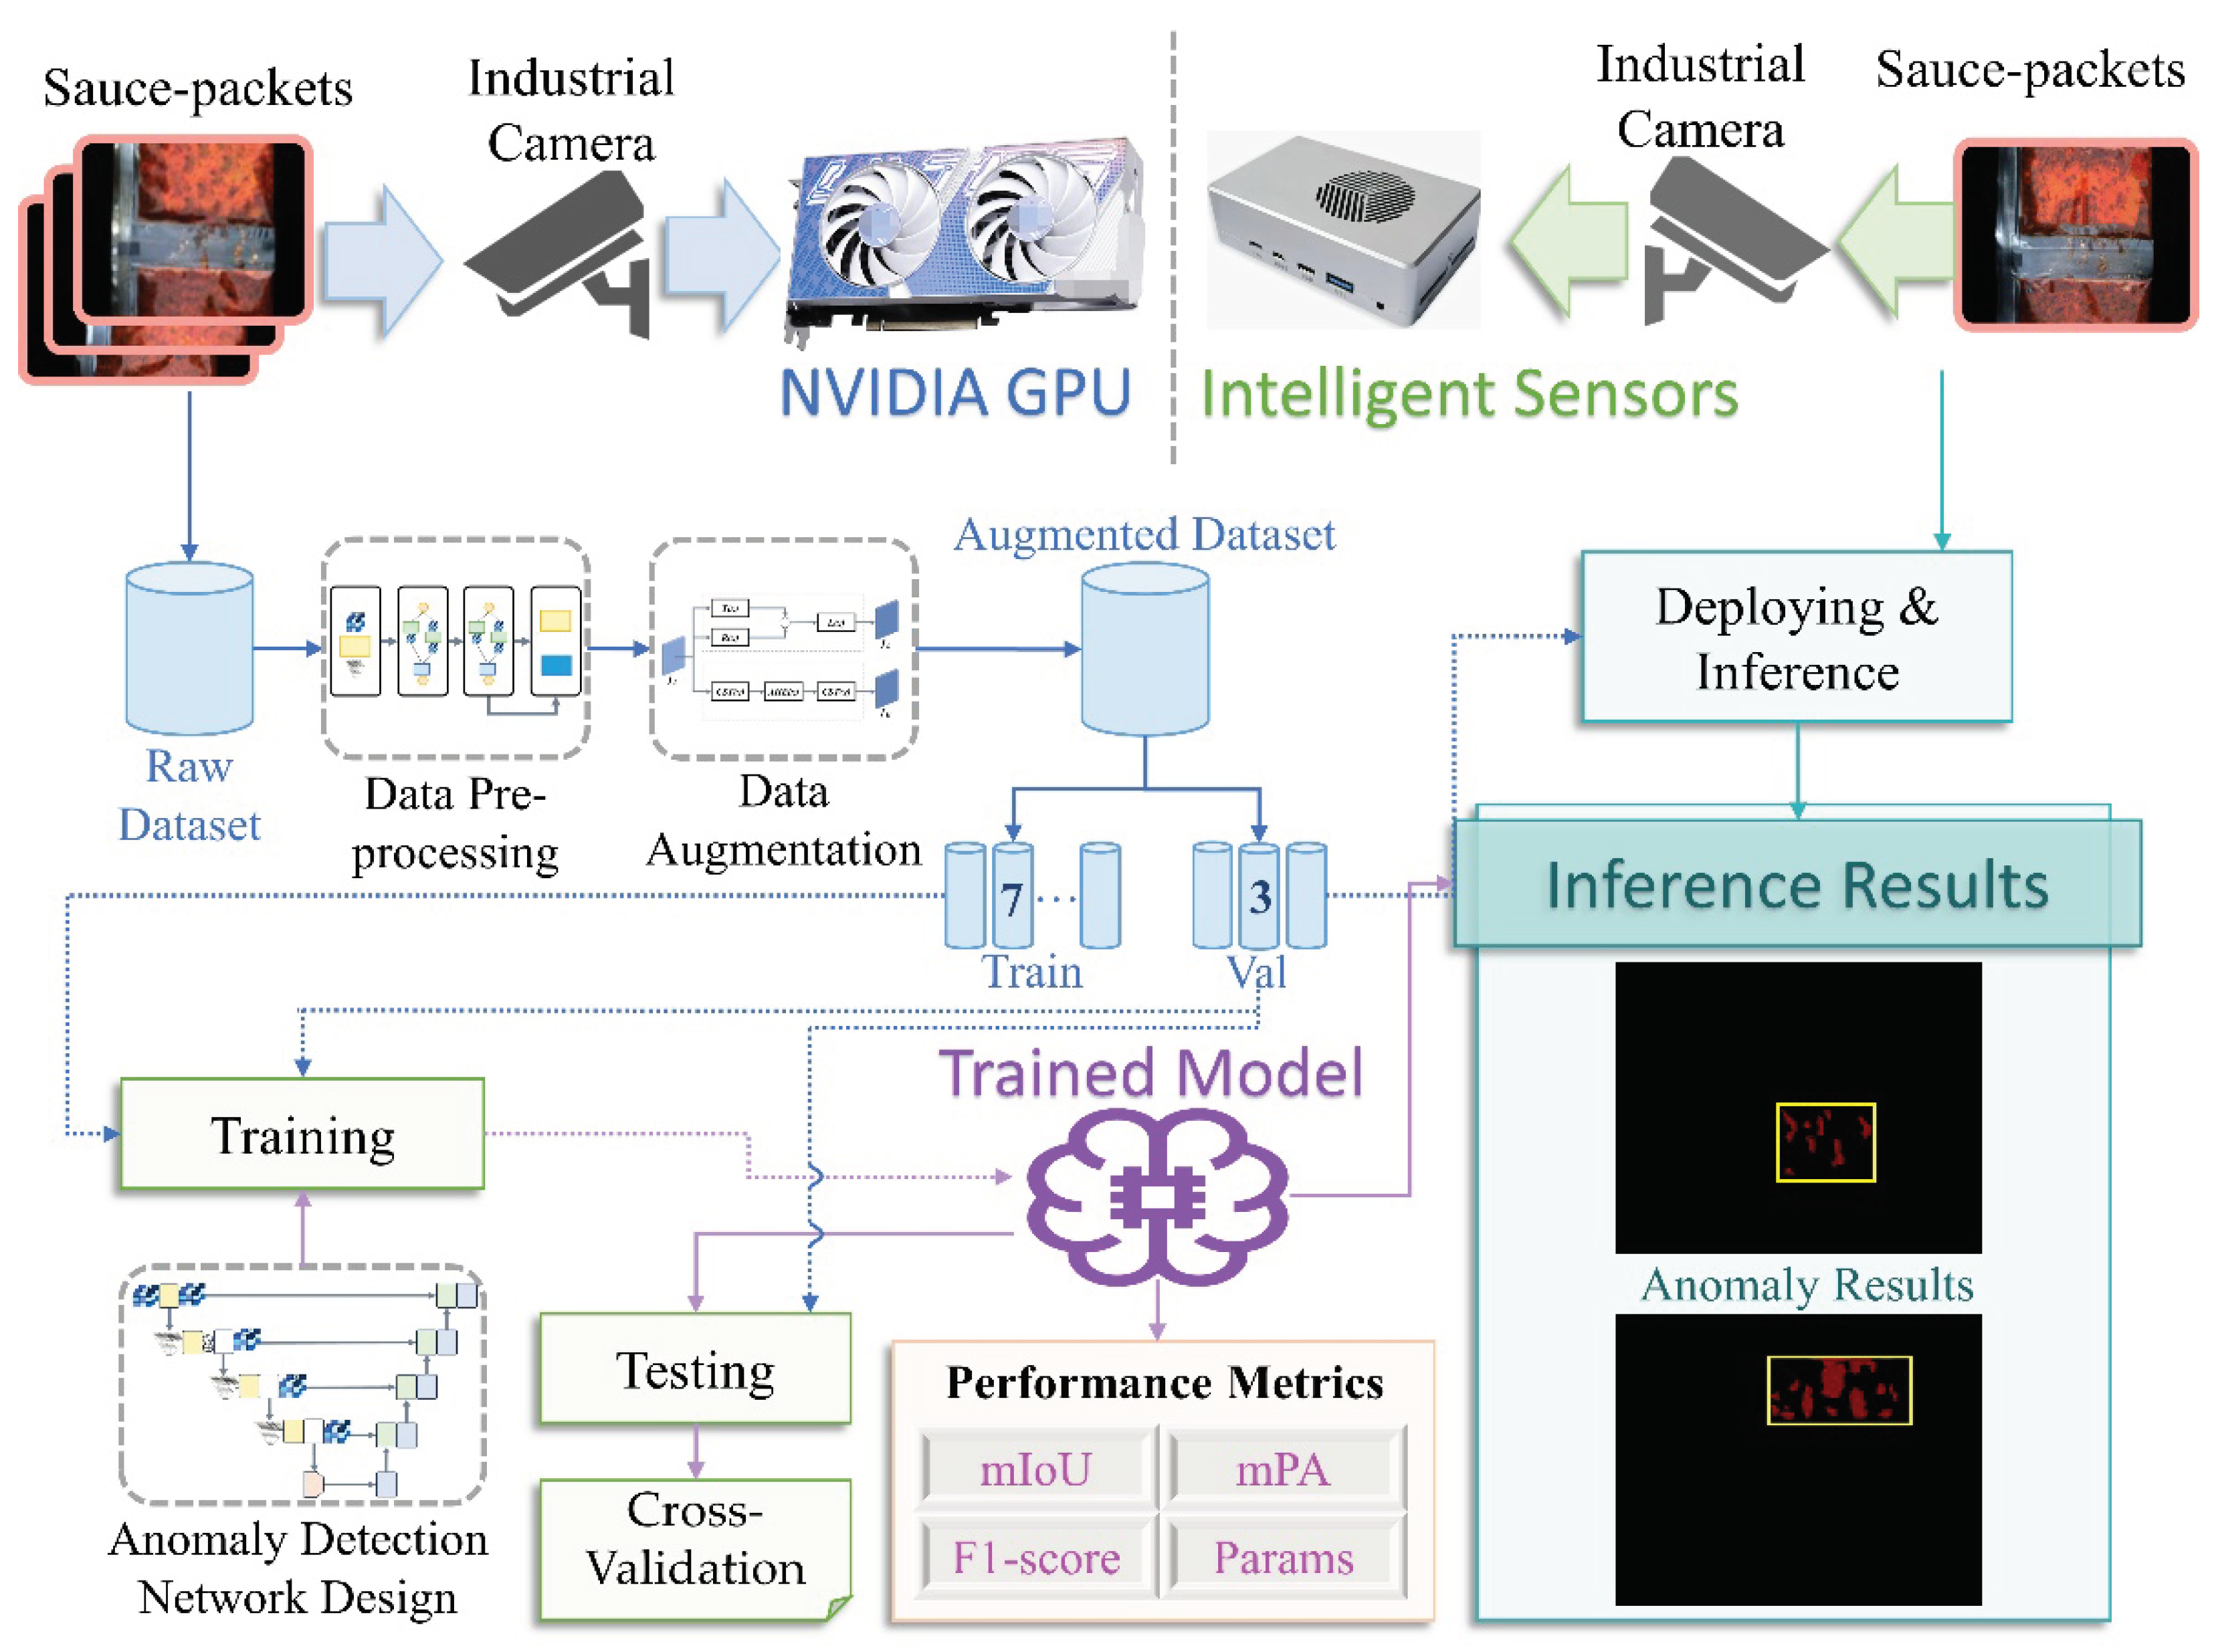
Figure 1. The data processing procedure of ISLS includes training and inference stages.
Preprints 101166 g001
Figure 2. The visual results of sauce-packets under insufficient illumination and overexposure conditions. The left side represents non-optimized images, the right side represents optimized images, and the central part represents feature maps between non-optimized and optimized images.
Preprints 101166 g002
Figure 3. The overall network structure of ISLS, consisting of encoder and decoder. The input image format follows the structure of (channels, height, width).
Preprints 101166 g003
Figure 4. The overall MFFM structure. The MFFM fuses information from four levels, with varying feature sizes for each layer. The size of feature maps is (C, H, W), where C, H, and W represent channel dimension, image height, and image width, respectively.
Preprints 101166 g004
Figure 5. Sequential Self-Attention Mechanism (SSAM), which includes the channel-only branch (left) and the spatial-only branch (right).
Preprints 101166 g005
Figure 6. Partial sample of sauce-packet dataset. The yellow dotted boxes indicate the connection of sauce-packet (i.e., ROI).
Preprints 101166 g006
Figure 7. The performance indices under different insufficient illumination thresholds, with a fixed overexposure threshold of 180.
Preprints 101166 g007
Figure 8. The performance indices under different overexposure thresholds, with a fixed insufficient illumination threshold of 115.
Preprints 101166 g008
Figure 9. Heatmap results using different attention mechanisms.
Preprints 101166 g009
Figure 10. Prediction results using different attention mechanisms.
Preprints 101166 g010
Figure 11. Relevant performance statistics of ISLS method during inference: (a) the CPU utilization of our method after optimization, (b) comparison of GPU utilization before and after optimization, (c) comparison of FPS changes before and after optimization.
Preprints 101166 g011
Table 1. Detailed performance comparison of ablation experiment without attention mechanisms. Baseline: our proposed network without ULIE, MFFM and attention mechanism. ULIE: Uneven-Light Image Enhancement method. MFFM: Multi-scale Feature Fusion Module.
Methods UEIE FPN [35] AF-FPN [36] MFFM mIoU (%) mPA (%) F1-score (%) Params (M)
Baseline 75.6 85.6 85.2 11.333
+ULIE 77.4 89.6 86.5 11.333
+FPN 77.3 85.2 86.3 18.906
+AF-FPN 75.3 83.6 84.8 18.908
+MFFM 78.7 87.9 87.3 11.564
+ULIE +FPN 78.5 86.7 87.2 11.906
+ULIE +AF-FPN 75.9 84.3 85.3 11.908
+ULIE +MFFM 79.2 89.1 87.7 11.564
Table 2. A detailed performance comparison of ablation experiments involving attention mechanisms. BUM represents Baseline with ULIE and MFFM.
Methods GAM [40] SimAM [41] SSAM [42] mIoU (%) mPA (%) F1-score (%) Params (M)
BUM 79.2 89.1 87.7 11.564
+GAM 78.4 89.2 87.7 20.273
+SimAM 77.1 86.6 86.2 11.564
+SSAM 80.8 90.1 88.8 12.266
Table 3. Evaluation results of our ISLS and the SOTA CNN methods.
Methods mIoU (%) mPA (%) F1-score (%) Params (M)
HRNet [13] 77.7 83.0 85.5 9.637
BiseNetv2 [14] 75.5 79.1 85.6 5.191
SegFormer [15] 76.5 80.8 85.1 3.715
PSPNet [45] 63.4 67.6 75.4 46.707
DeepLabv3 [46] 78.4 83.6 86.2 54.709
LIEPNet [18] 79.9 89.2 87.5 3.271
ISLS (Ours) 80.8 90.1 88.8 12.266
Table 4. Evaluation results of our ISLS and the traditional methods.
Methods mIoU (%) mPA (%) F1-score (%)
Template Matching [47] 40.9 59.8 54.0
Canny Edge Segmentation [48] 32.5 44.5 43.6
Contour Segmentation [49] 32.5 44.5 43.6
PCA Segmentation [50] 36.6 58.6 50.4
iForest Segmentation [51] 48.0 59.1 58.8
ISLS (Ours) 80.8 90.1 88.8
Disclaimer/Publisher’s Note: The statements, opinions and data contained in all publications are solely those of the individual author(s) and contributor(s) and not of MDPI and/or the editor(s). MDPI and/or the editor(s) disclaim responsibility for any injury to people or property resulting from any ideas, methods, instructions or products referred to in the content.
Copyright: This open access article is published under a Creative Commons CC BY 4.0 license, which permit the free download, distribution, and reuse, provided that the author and preprint are cited in any reuse.
Prerpints.org logo

Preprints.org is a free preprint server supported by MDPI in Basel, Switzerland.

Subscribe

© 2024 MDPI (Basel, Switzerland) unless otherwise stated