Submitted:
11 March 2024
Posted:
14 March 2024
You are already at the latest version
Abstract
Keywords:
1. Introduction
2. Hydrogeochemical Processes in Coastal Aquifers
2.1. Field Investigations
2.2. Laboratory Experiments
2.3. Numerical Simulations
3. Impact of Fe Precipitation on Pore Structure
3.1. Evolution of Pore Structure at Pore Scale
3.2. Distribution of Precipitation in Pore Matrix
4. Parameterization of Evolving Porous Media
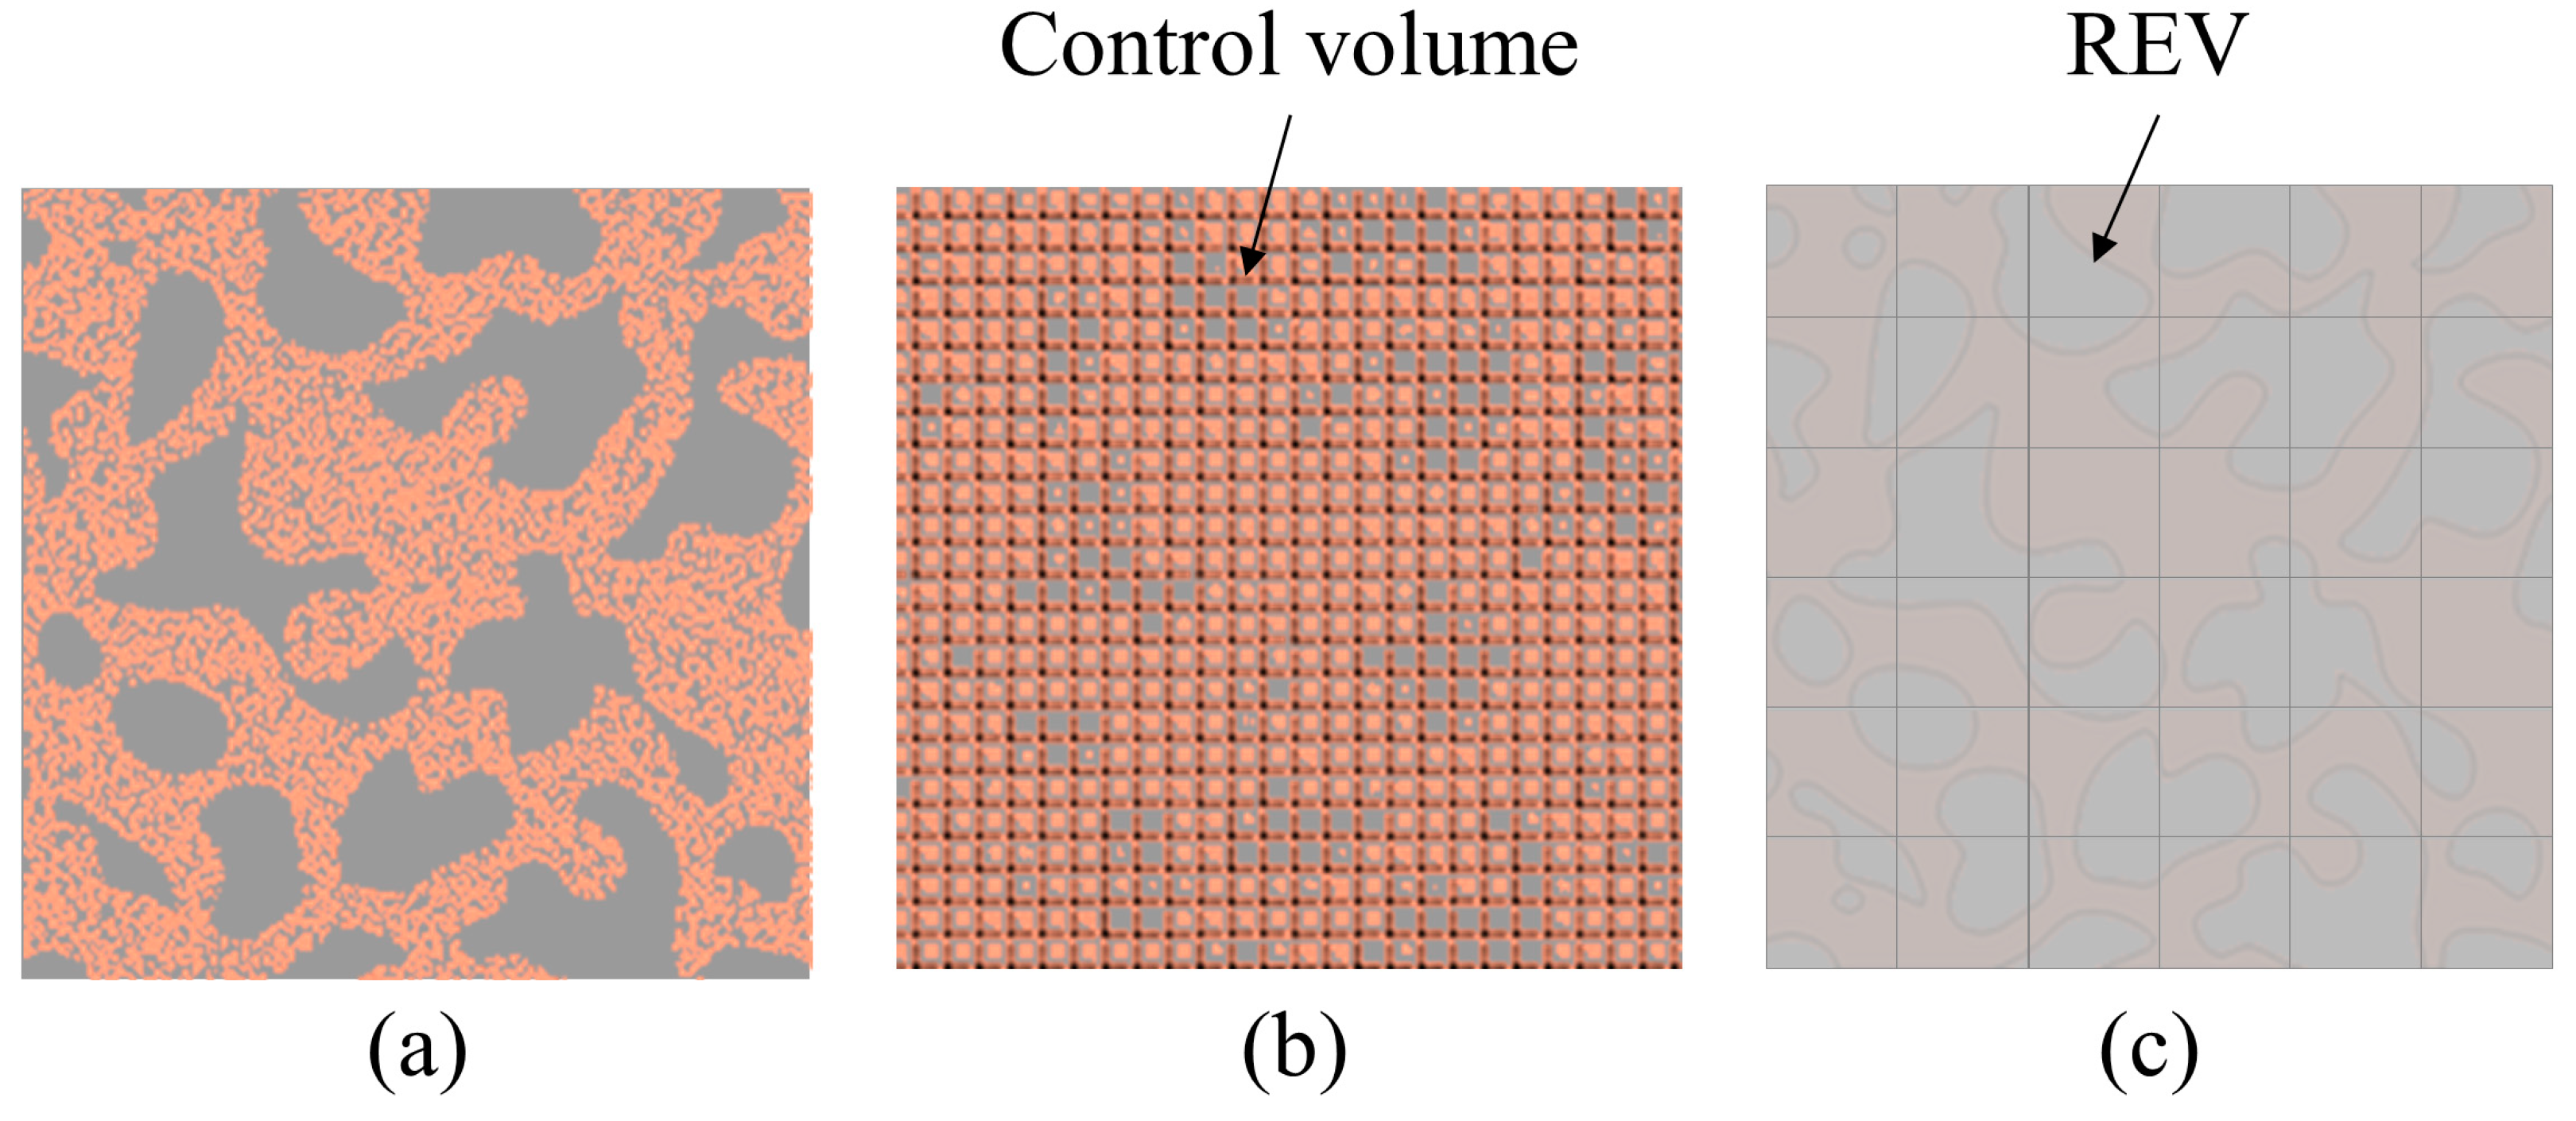
4.1. Evolution of Porosity at REV Scale
4.2. Permeability-Porosity Relationships
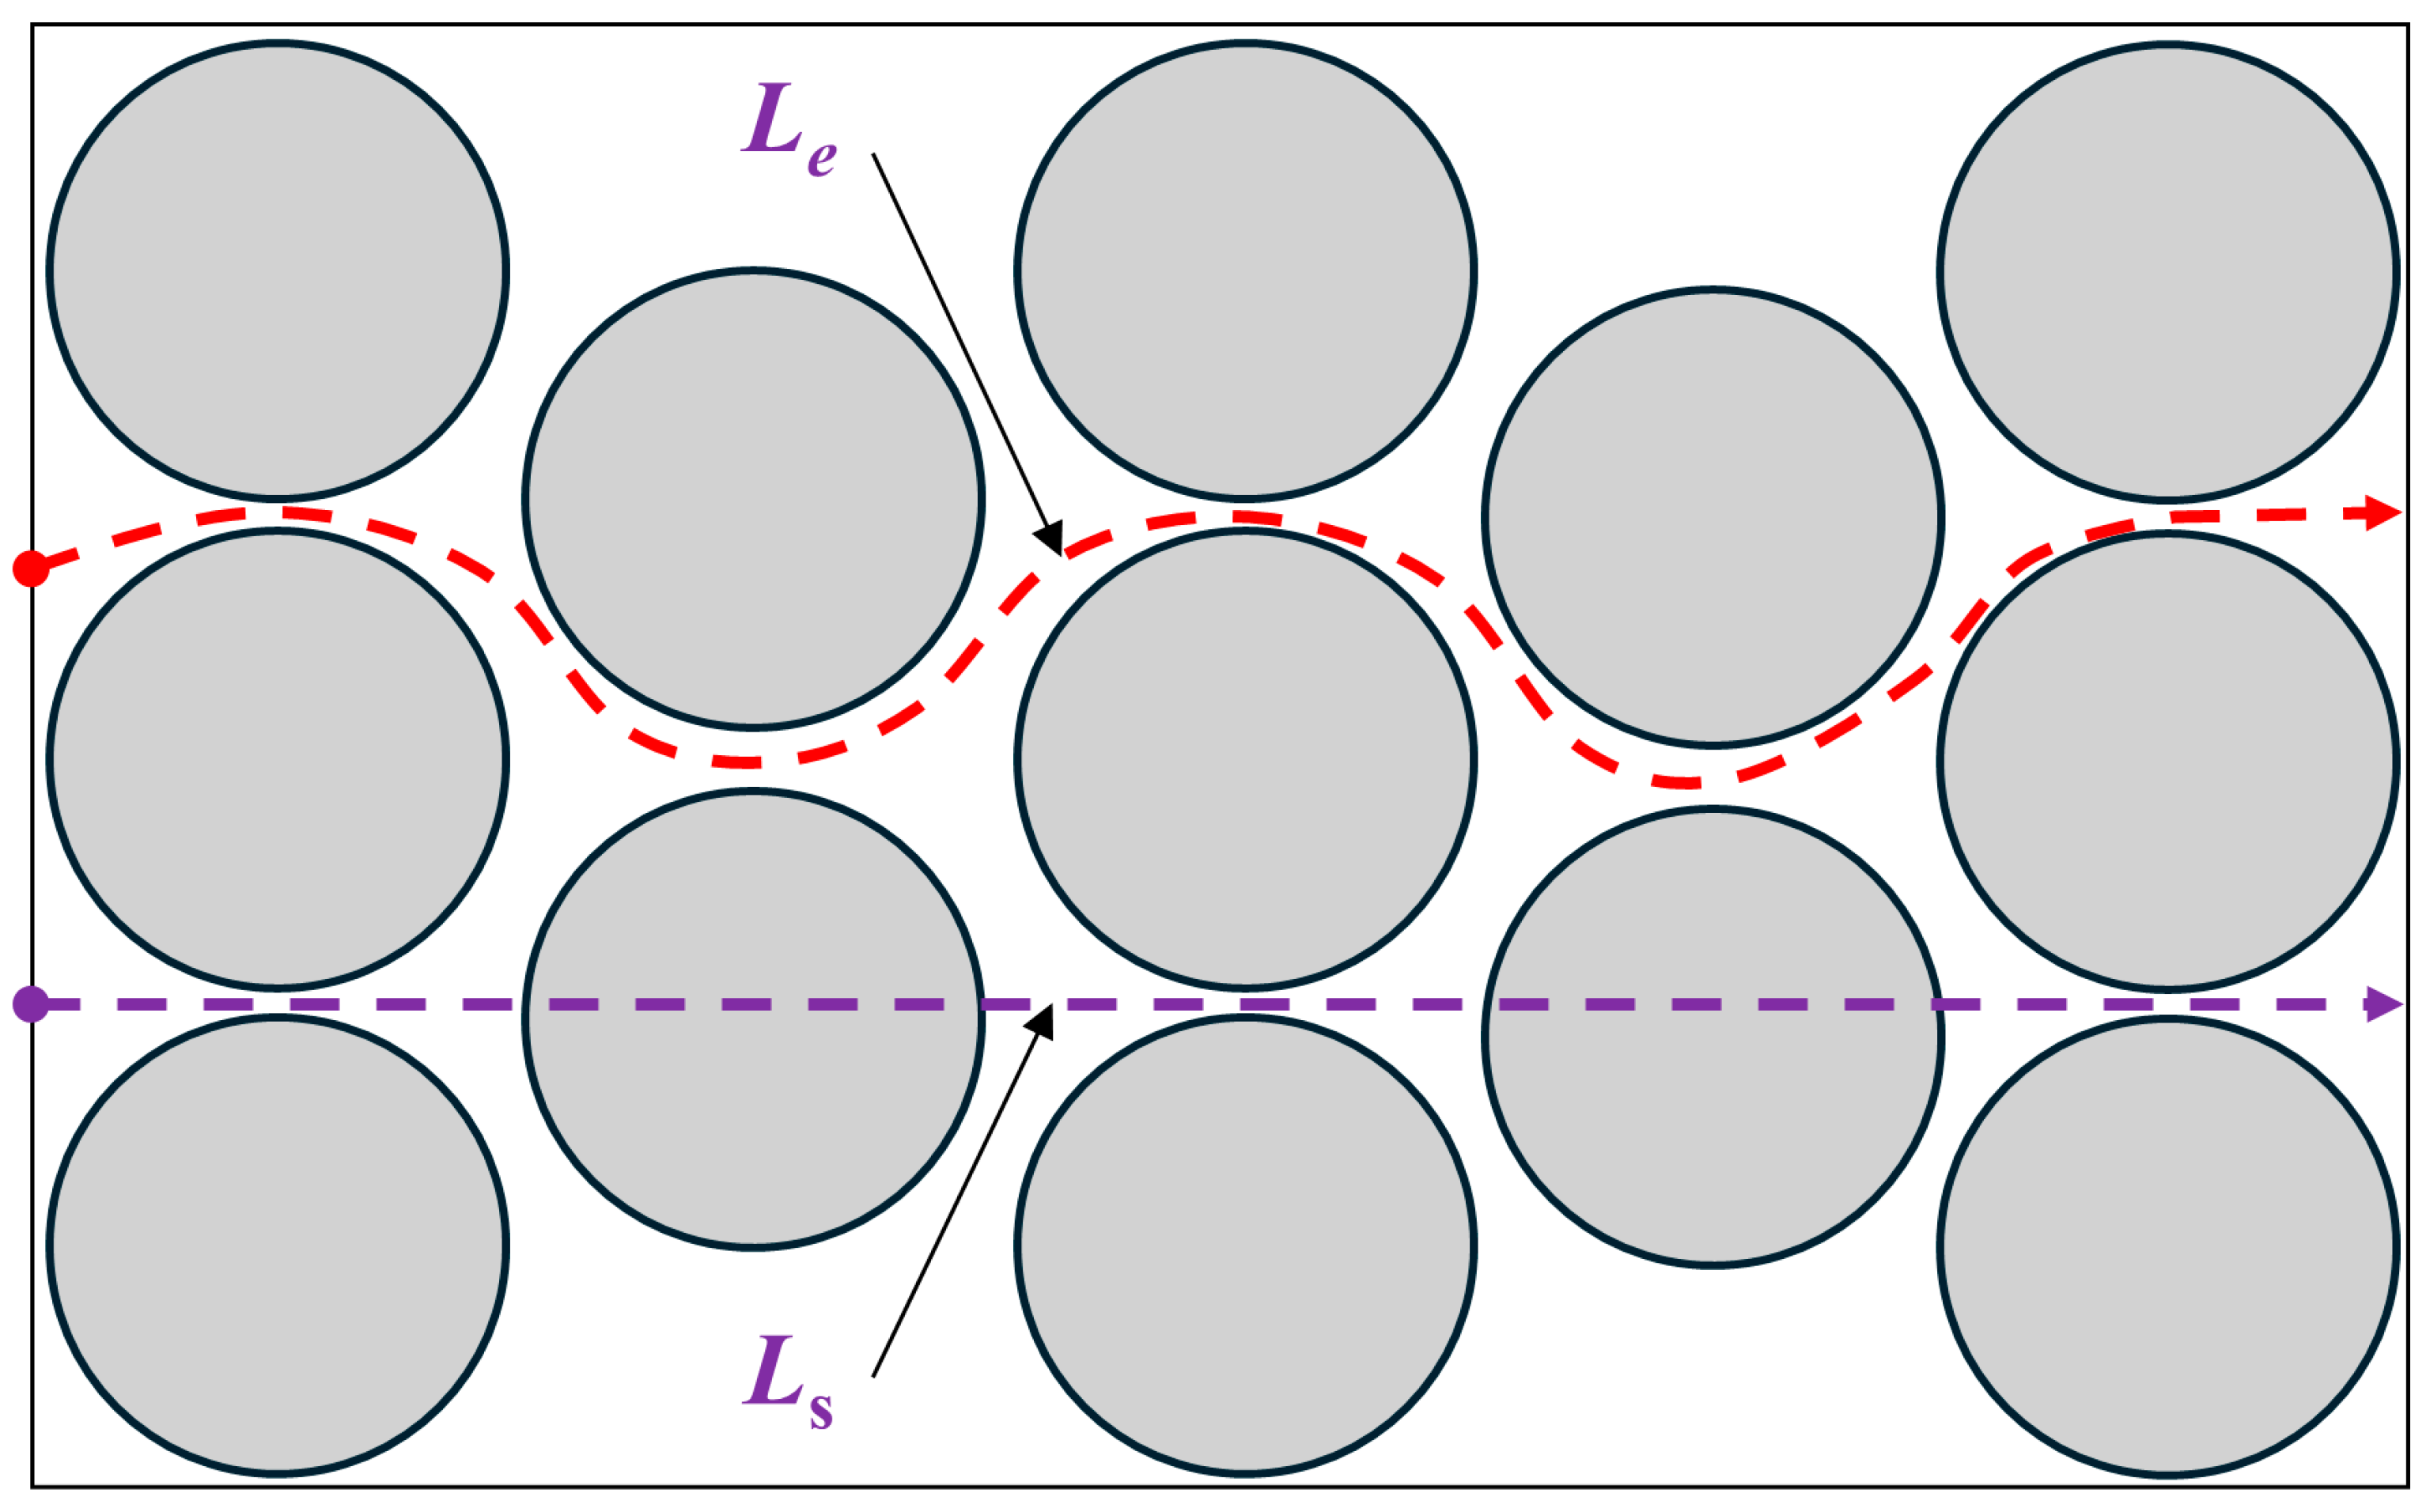
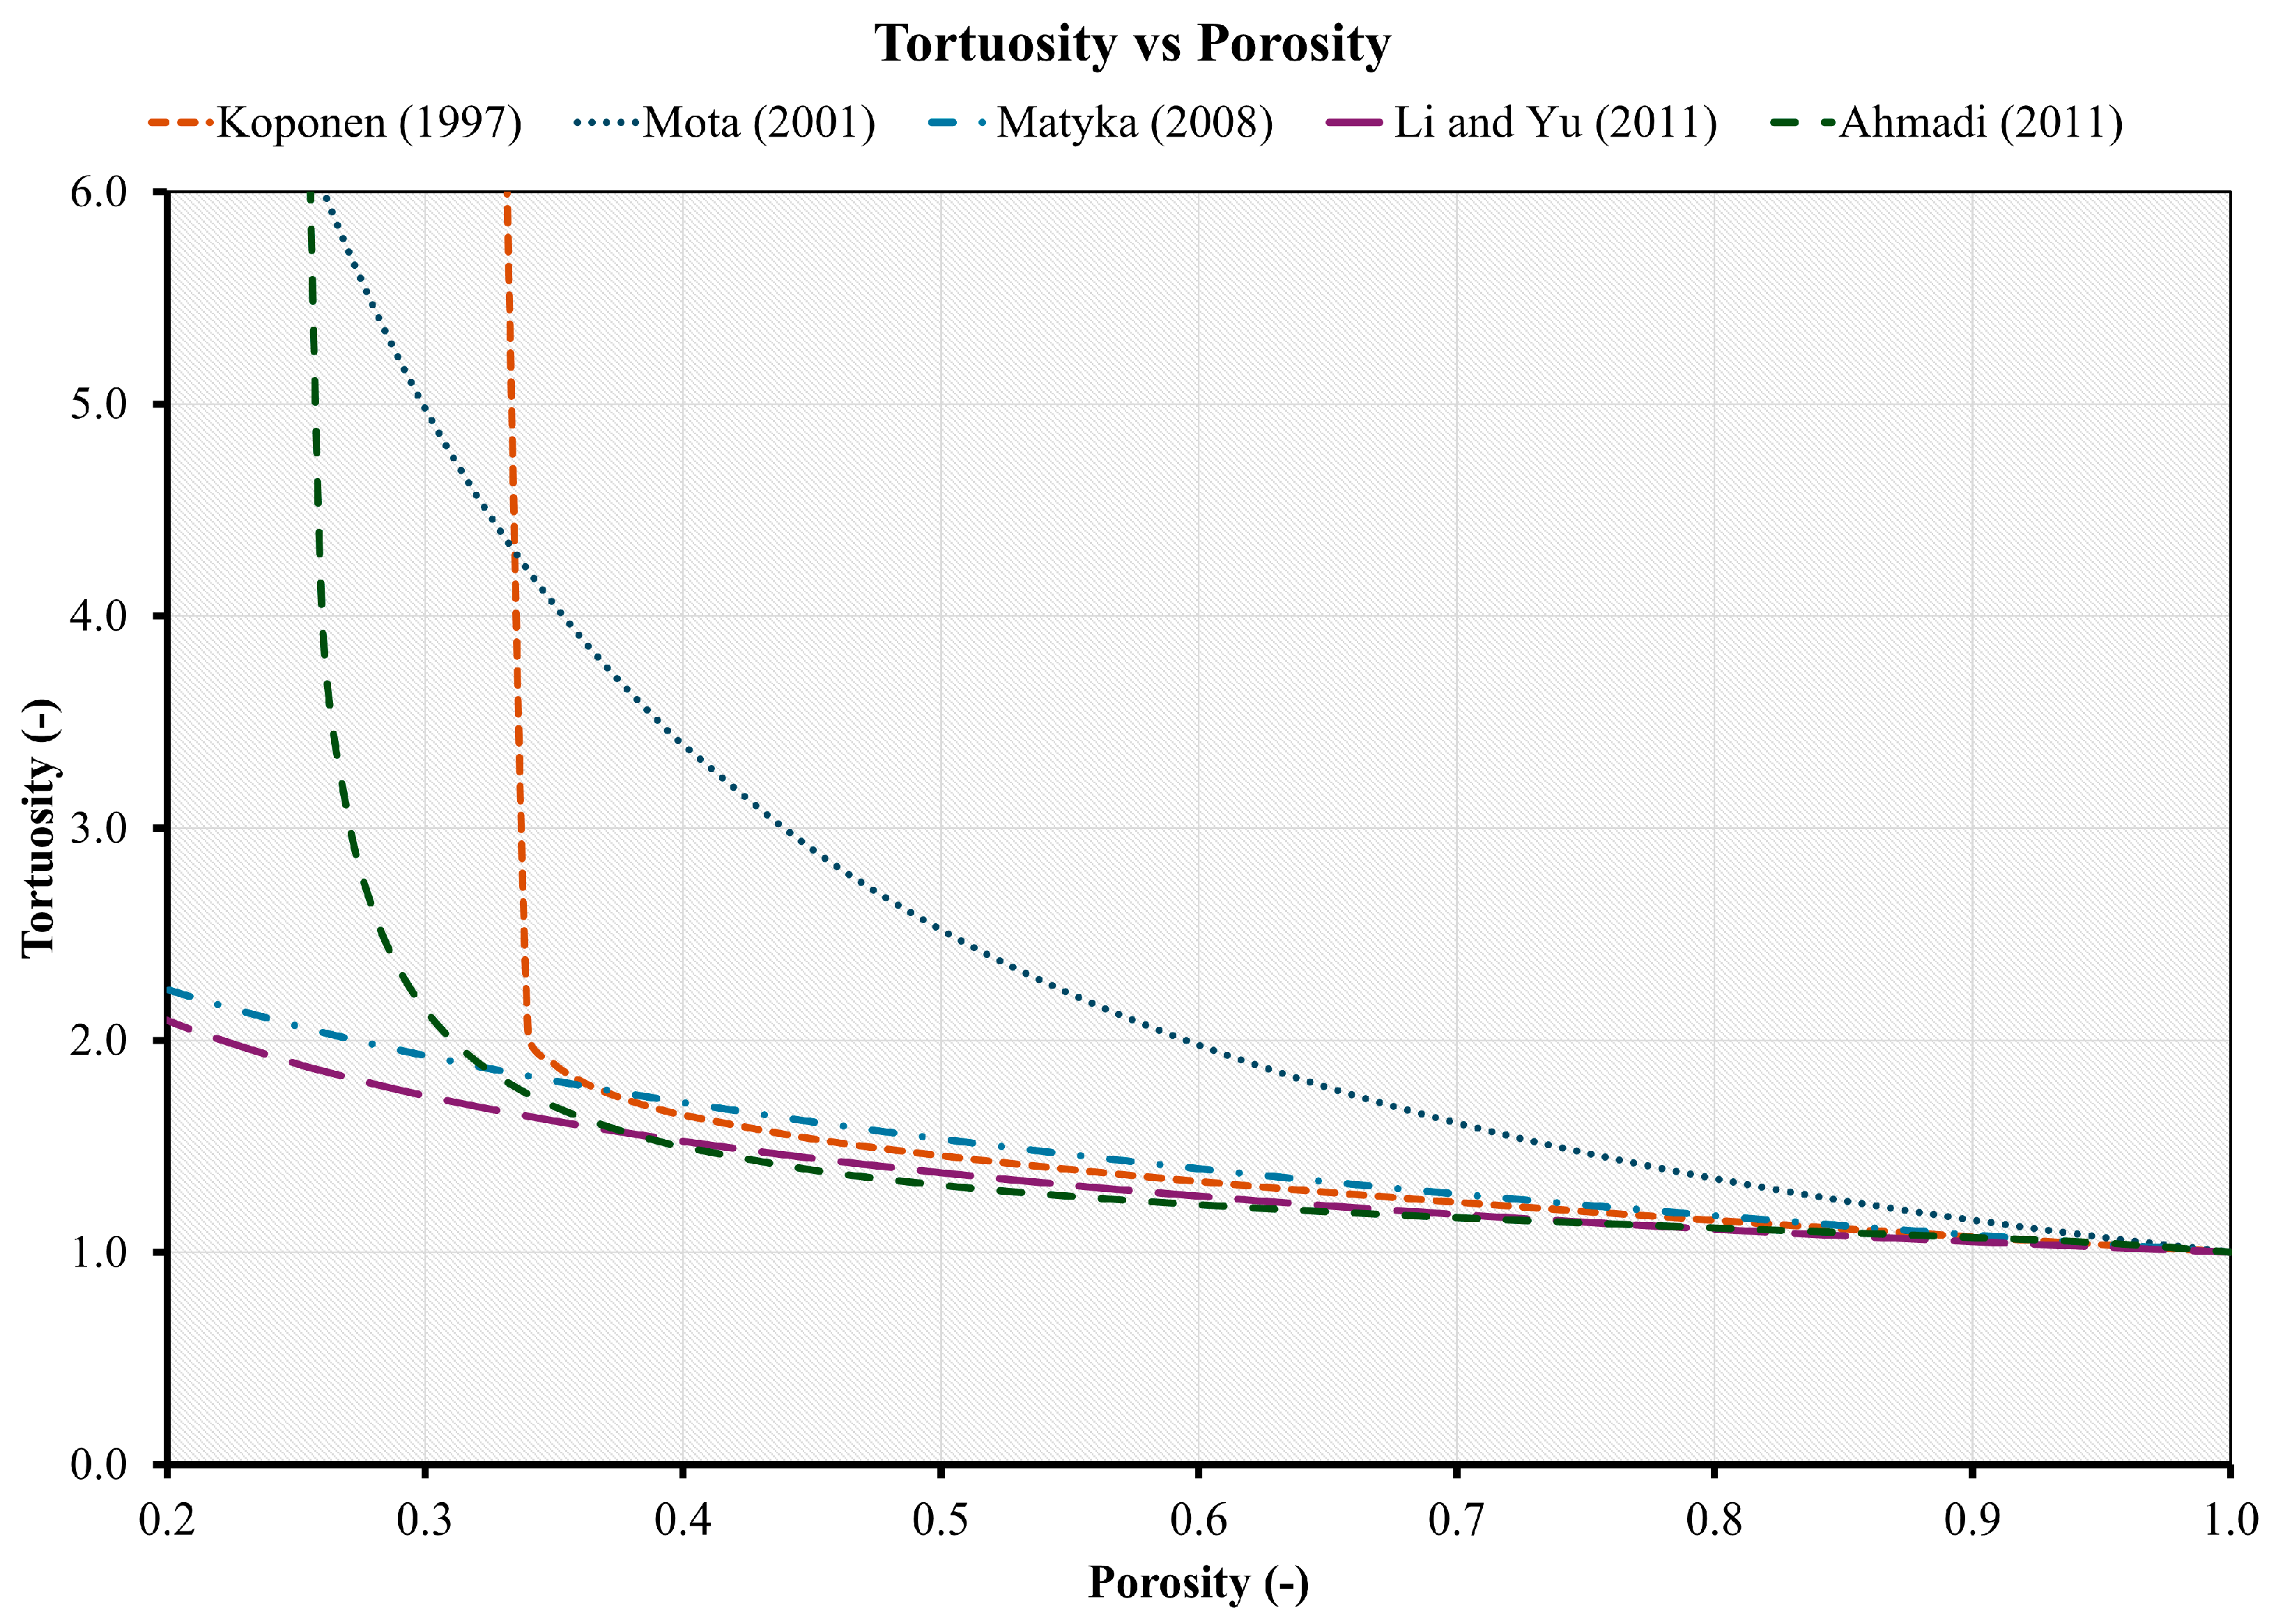
4.3. Tortuosity-Porosity Relationships
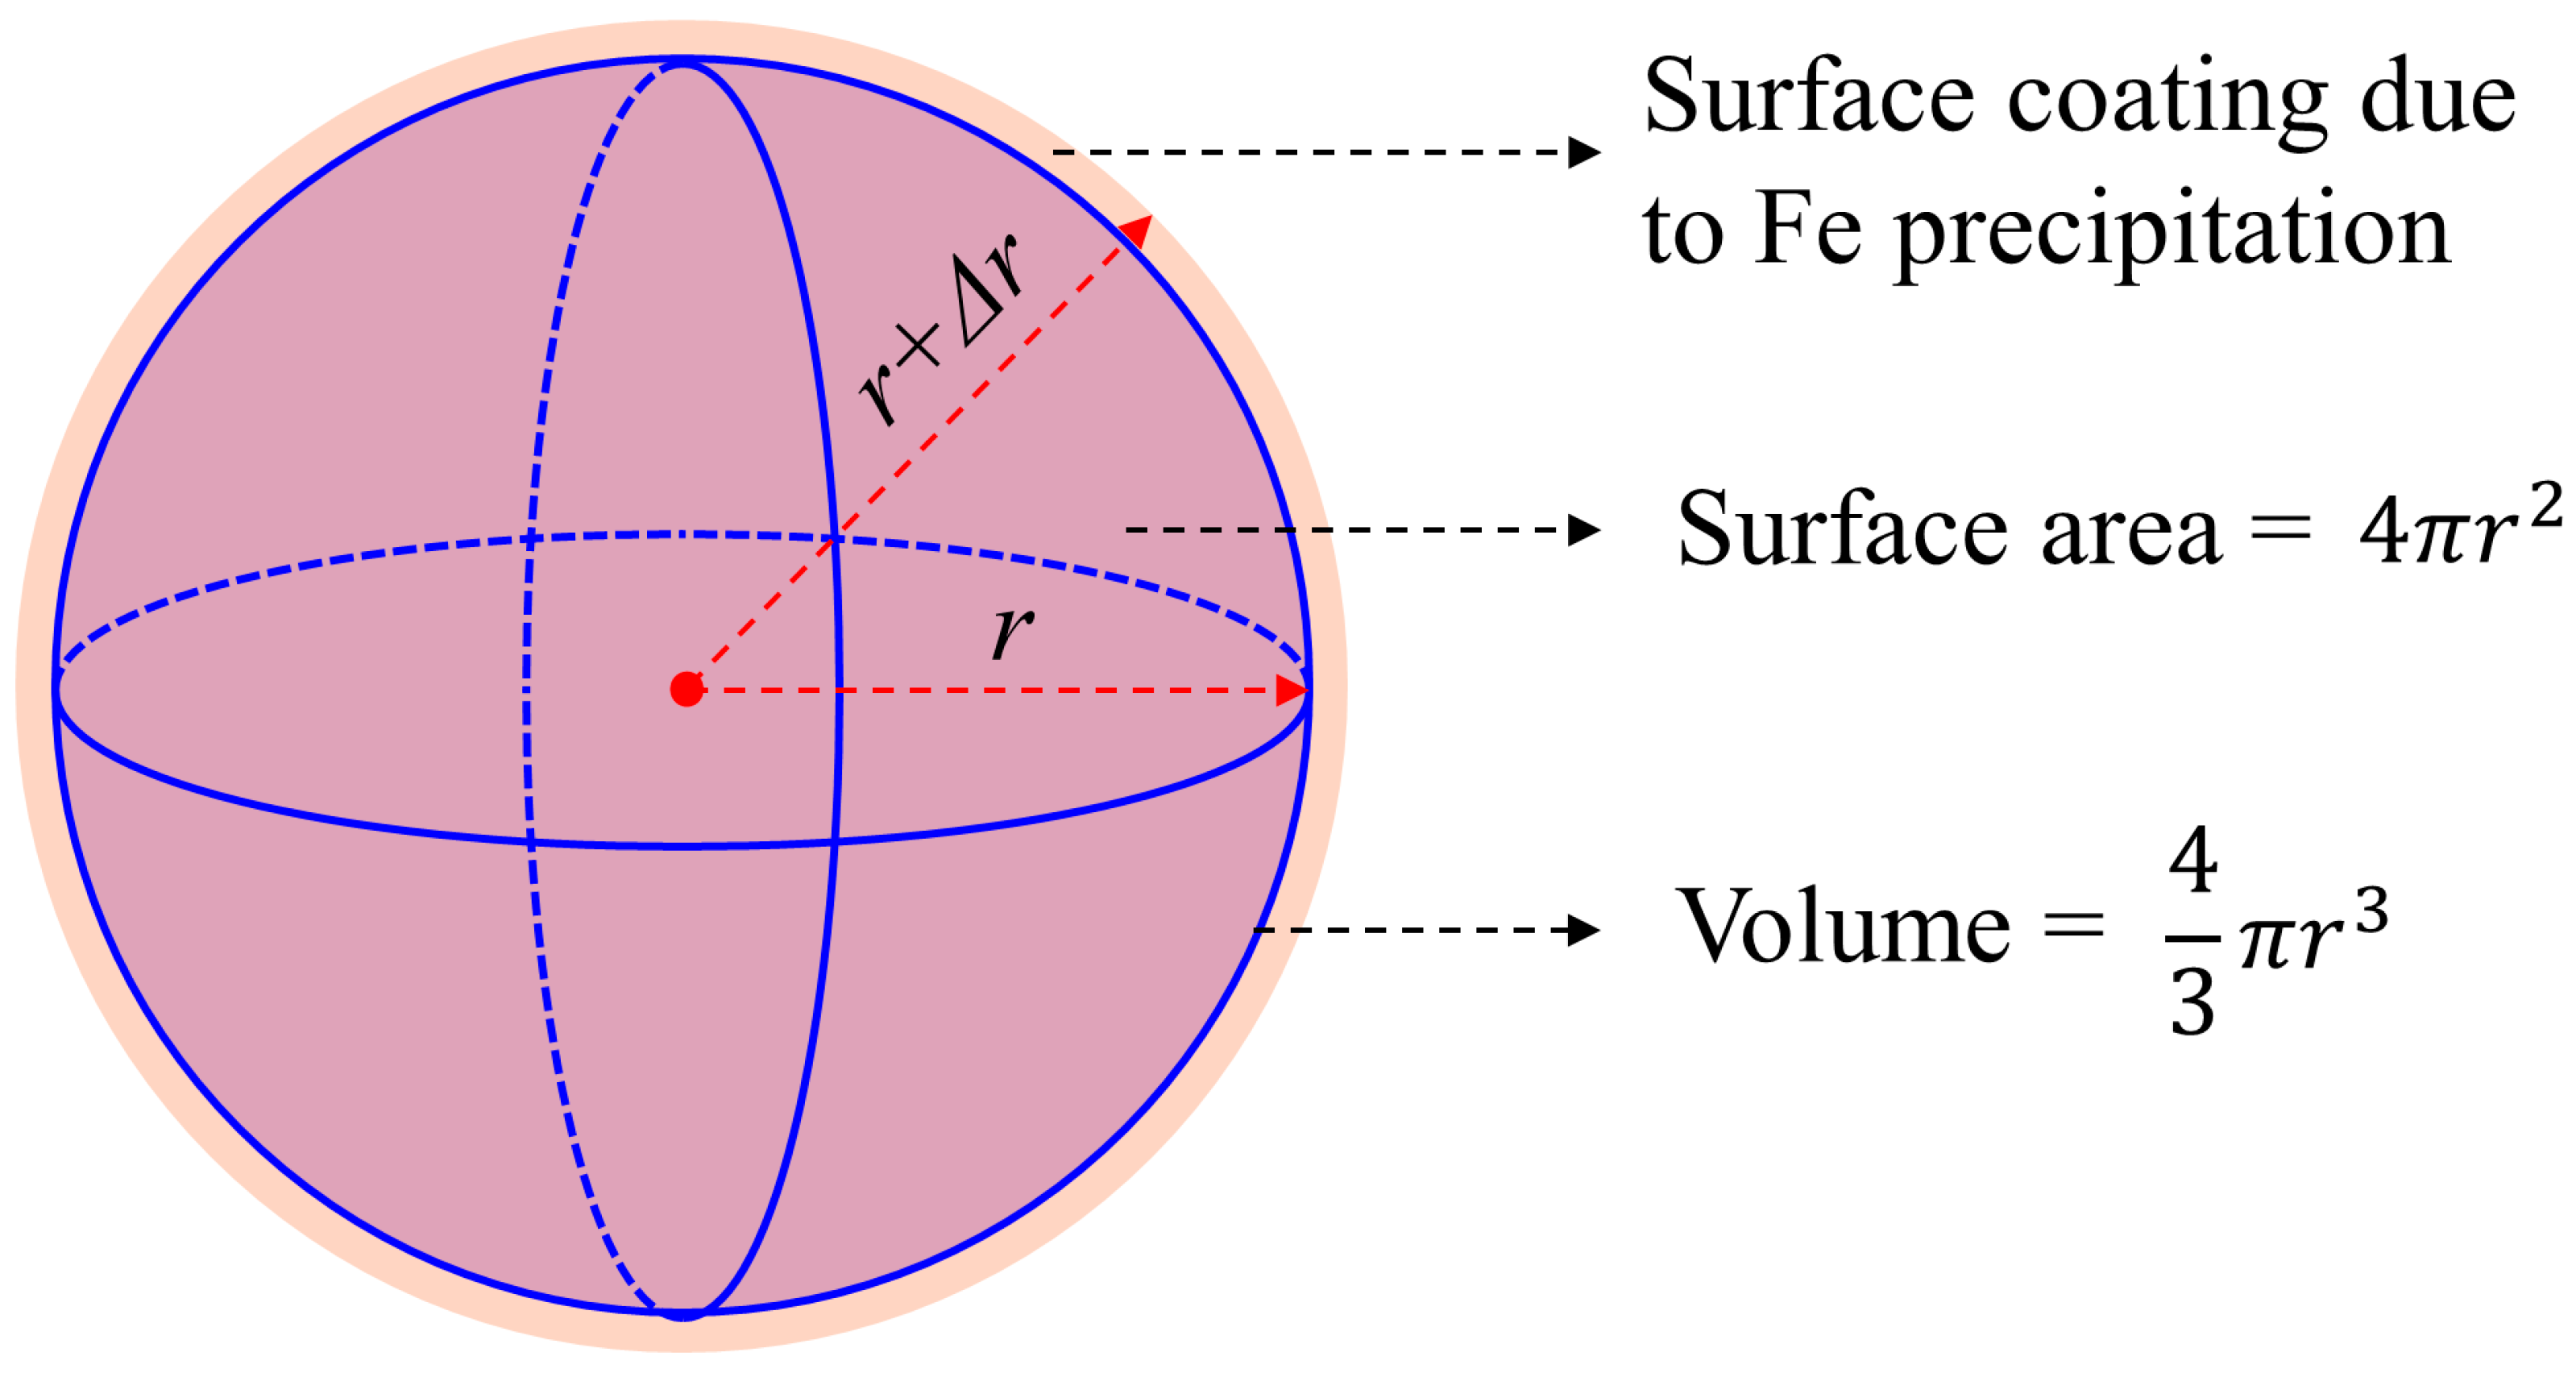
4.4. Evolving Reactivity and Surface Area
5. Approach for Reactive Transport Modelling
6. Knowledge Gaps and Research Needs
Author Contributions
Funding
Institutional Review Board Statement
Informed Consent Statement
Data Availability Statement
Acknowledgments
Conflicts of Interest
References
- LePan, N.; Venditti, B. Visualizing the Abundance of Elements in the Earth’s Crust. World Econ. Forum 2021.
- Cornell, R.; Schwertmann, U. The Iron Oxides: Structure, Properties, Reactions, Occurrences and Uses. In; Wiley VCH, 2003 ISBN 978-3-527-30274-1.
- Banfield, J.F.; Zhang, H. Nanoparticles in the Environment.; 2001; Vol. 44, pp. 1–58.
- Larrahondo, J.M.; Burns, S.E. Laboratory-Prepared Iron Oxide Coatings on Sands: Surface Characterization and Strength Parameters. J. Geotech. Geoenvironmental Eng. 2014, 140, 04013052. [Google Scholar] [CrossRef]
- Viscarra Rossel, R.A.; Bui, E.N.; de Caritat, P.; McKenzie, N.J. Mapping Iron Oxides and the Color of Australian Soil Using Visible–near-Infrared Reflectance Spectra. J. Geophys. Res. 2010, 115, F04031. [Google Scholar] [CrossRef]
- Tenthorey, E.; Fitzgerald, J. Feedbacks between Deformation, Hydrothermal Reaction and Permeability Evolution in the Crust: Experimental Insights. Earth Planet. Sci. Lett. 2006, 247, 117–129. [Google Scholar] [CrossRef]
- Brovelli, A.; Malaguerra, F.; Barry, D.A. Bioclogging in Porous Media: Model Development and Sensitivity to Initial Conditions. Environ. Model. Softw. 2009, 24, 611–626. [Google Scholar] [CrossRef]
- Chagneau, A.; Claret, F.; Enzmann, F.; Kersten, M.; Heck, S.; Madé, B.; Schäfer, T. Mineral Precipitation-Induced Porosity Reduction and Its Effect on Transport Parameters in Diffusion-Controlled Porous Media. Geochem. Trans. 2015, 16, 13. [Google Scholar] [CrossRef] [PubMed]
- Gaucher, E.C.; Blanc, P. Cement/Clay Interactions – A Review: Experiments, Natural Analogues, and Modeling. Waste Manag. 2006, 26, 776–788. [Google Scholar] [CrossRef]
- Seigneur, N.; Lagneau, V.; Corvisier, J.; Dauzères, A. Recoupling Flow and Chemistry in Variably Saturated Reactive Transport Modelling - An Algorithm to Accurately Couple the Feedback of Chemistry on Water Consumption, Variable Porosity and Flow. Adv. Water Resour. 2018, 122, 355–366. [Google Scholar] [CrossRef]
- Robinson, C.E.; Xin, P.; Santos, I.R.; Charette, M.A.; Li, L.; Barry, D.A. Groundwater Dynamics in Subterranean Estuaries of Coastal Unconfined Aquifers: Controls on Submarine Groundwater Discharge and Chemical Inputs to the Ocean. Adv. Water Resour. 2018, 115, 315–331. [Google Scholar] [CrossRef]
- Charette, M.A.; Sholkovitz, E.R. Oxidative Precipitation of Groundwater-Derived Ferrous Iron in the Subterranean Estuary of a Coastal Bay. Geophys. Res. Lett. 2002, 29, 85-1–85-4. [Google Scholar] [CrossRef]
- Spiteri, C.; Regnier, P.; Slomp, C.P.; Charette, M.A. pH-Dependent Iron Oxide Precipitation in a Subterranean Estuary. J. Geochem. Explor. 2006, 88, 399–403. [Google Scholar] [CrossRef]
- Lalonde, K.; Mucci, A.; Ouellet, A.; Gélinas, Y. Preservation of Organic Matter in Sediments Promoted by Iron. Nature 2012, 483, 198–200. [Google Scholar] [CrossRef]
- Linkhorst, A.; Dittmar, T.; Waska, H. Molecular Fractionation of Dissolved Organic Matter in a Shallow Subterranean Estuary: The Role of the Iron Curtain. Environ. Sci. Technol. 2017, 51, 1312–1320. [Google Scholar] [CrossRef]
- Zhang, D.; Guo, H.; Xiu, W.; Ni, P.; Zheng, H.; Wei, C. In-Situ Mobilization and Transformation of Iron Oxides-Adsorbed Arsenate in Natural Groundwater. J. Hazard. Mater. 2017, 321, 228–237. [Google Scholar] [CrossRef]
- Reckhardt, A.; Beck, M.; Seidel, M.; Riedel, T.; Wehrmann, A.; Bartholomä, A.; Schnetger, B.; Dittmar, T.; Brumsack, H.-J. Carbon, Nutrient and Trace Metal Cycling in Sandy Sediments: A Comparison of High-Energy Beaches and Backbarrier Tidal Flats. Estuar. Coast. Shelf Sci. 2015, 159, 1–14. [Google Scholar] [CrossRef]
- Liu, Y.; Jiao, J.J.; Luo, X. Effects of Inland Water Level Oscillation on Groundwater Dynamics and Land-Sourced Solute Transport in a Coastal Aquifer. Coast. Eng. 2016, 114, 347–360. [Google Scholar] [CrossRef]
- Michael, H.A.; Mulligan, A.E.; Harvey, C.F. Seasonal Oscillations in Water Exchange between Aquifers and the Coastal Ocean. Nature 2005, 436, 1145–1148. [Google Scholar] [CrossRef]
- Gonneea, M.E.; Mulligan, A.E.; Charette, M.A. Climate-driven Sea Level Anomalies Modulate Coastal Groundwater Dynamics and Discharge. Geophys. Res. Lett. 2013, 40, 2701–2706. [Google Scholar] [CrossRef]
- Roy, M.; Martin, J.B.; Cherrier, J.; Cable, J.E.; Smith, C.G. Influence of Sea Level Rise on Iron Diagenesis in an East Florida Subterranean Estuary. Geochim. Cosmochim. Acta 2010, 74, 5560–5573. [Google Scholar] [CrossRef]
- Li, L.; Barry, D.A.; Stagnitti, F.; Parlange, J.-Y. Submarine Groundwater Discharge and Associated Chemical Input to a Coastal Sea. Water Resour. Res. 1999, 35, 3253–3259. [Google Scholar] [CrossRef]
- Robinson, C.; Li, L.; Barry, D.A. Effect of Tidal Forcing on a Subterranean Estuary. Adv. Water Resour. 2007, 30, 851–865. [Google Scholar] [CrossRef]
- Xin, P.; Robinson, C.; Li, L.; Barry, D.A.; Bakhtyar, R. Effects of Wave Forcing on a Subterranean Estuary. Water Resour. Res. 2010, 46. [Google Scholar] [CrossRef]
- Shen, C.; Zhang, C.; Xin, P.; Kong, J.; Li, L. Salt Dynamics in Coastal Marshes: Formation of Hypersaline Zones. Water Resour. Res. 2018, 54, 3259–3276. [Google Scholar] [CrossRef]
- Anwar, N.; Robinson, C.; Barry, D.A. Influence of Tides and Waves on the Fate of Nutrients in a Nearshore Aquifer: Numerical Simulations. Adv. Water Resour. 2014, 73, 203–213. [Google Scholar] [CrossRef]
- O’Connor, A.E.; Luek, J.L.; McIntosh, H.; Beck, A.J. Geochemistry of Redox-Sensitive Trace Elements in a Shallow Subterranean Estuary. Mar. Chem. 2015, 172, 70–81. [Google Scholar] [CrossRef]
- Paffrath, R.; Pahnke, K.; Behrens, M.K.; Reckhardt, A.; Ehlert, C.; Schnetger, B.; Brumsack, H.-J. Rare Earth Element Behavior in a Sandy Subterranean Estuary of the Southern North Sea. Front. Mar. Sci. 2020, 7, 424. [Google Scholar] [CrossRef]
- Porubsky, W.P.; Weston, N.B.; Moore, W.S.; Ruppel, C.; Joye, S.B. Dynamics of Submarine Groundwater Discharge and Associated Fluxes of Dissolved Nutrients, Carbon, and Trace Gases to the Coastal Zone (Okatee River Estuary, South Carolina). Geochim. Cosmochim. Acta 2014, 131, 81–97. [Google Scholar] [CrossRef]
- Trezzi, G.; Garcia-Orellana, J.; Rodellas, V.; Santos-Echeandia, J.; Tovar-Sánchez, A.; Garcia-Solsona, E.; Masqué, P. Submarine Groundwater Discharge: A Significant Source of Dissolved Trace Metals to the North Western Mediterranean Sea. Mar. Chem. 2016, 186, 90–100. [Google Scholar] [CrossRef]
- Cao, W.; Hofmann, H.; Yan, G.; Scheuermann, A. Porewater Exchange and Iron Transformation in a Coastal Groundwater System: A Field Investigation, Driving Mechanisms Analysis, and Conceptual Model. Front. Mar. Sci. 2024. [Google Scholar]
- Shokir, E.M.E.-M.; Alsughayer, A.A.; Al-Ateeq, A. Permeability Estimation From Well Log Responses. J. Can. Pet. Technol. 2006, 45. [Google Scholar] [CrossRef]
- Zhao, J.; Kang, Q.; Yao, J.; Viswanathan, H.; Pawar, R.; Zhang, L.; Sun, H. The Effect of Wettability Heterogeneity on Relative Permeability of Two-Phase Flow in Porous Media: A Lattice Boltzmann Study. Water Resour. Res. 2018, 54, 1295–1311. [Google Scholar] [CrossRef]
- Seigneur, N.; Mayer, K.U.; Steefel, C.I. Reactive Transport in Evolving Porous Media. Rev. Mineral. Geochem. 2019, 85, 197–238. [Google Scholar] [CrossRef]
- Noiriel, C.; Luquot, L.; Madé, B.; Raimbault, L.; Gouze, P.; Van Der Lee, J. Changes in Reactive Surface Area during Limestone Dissolution: An Experimental and Modelling Study. Chem. Geol. 2009, 265, 160–170. [Google Scholar] [CrossRef]
- Noiriel, C. Resolving Time-Dependent Evolution of Pore-Scale Structure, Permeability and Reactivity Using X-Ray Microtomography. Rev. Mineral. Geochem. 2015, 80, 247–285. [Google Scholar] [CrossRef]
- Jin, L.; Mathur, R.; Rother, G.; Cole, D.; Bazilevskaya, E.; Williams, J.; Carone, A.; Brantley, S. Evolution of Porosity and Geochemistry in Marcellus Formation Black Shale during Weathering. Chem. Geol. 2013, 356, 50–63. [Google Scholar] [CrossRef]
- Ko, L.T.; Ruppel, S.C.; Loucks, R.G.; Hackley, P.C.; Zhang, T.; Shao, D. Pore-Types and Pore-Network Evolution in Upper Devonian-Lower Mississippian Woodford and Mississippian Barnett Mudstones: Insights from Laboratory Thermal Maturation and Organic Petrology. Int. J. Coal Geol. 2018, 190, 3–28. [Google Scholar] [CrossRef]
- Wang, J.; Sickinger, M.; Ciobota, V.; Herrmann, M.; Rasch, H.; Rösch, P.; Popp, J.; Küsel, K. Revealing the Microbial Community Structure of Clogging Materials in Dewatering Wells Differing in Physico-Chemical Parameters in an Open-Cast Mining Area. Water Res. 2014, 63, 222–233. [Google Scholar] [CrossRef]
- Rose, A.L. ; Waite Effect of Dissolved Natural Organic Matter on the Kinetics of Ferrous Iron Oxygenation in Seawater. Environ. Sci. Technol. 2003, 37, 4877–4886. [Google Scholar] [CrossRef] [PubMed]
- O’Neil, J.M.; Dennison, W.C. Discerning the Causes of Toxic Cyanobacteria (Lyngbya Majuscula) Blooms in Moreton Bay, Australia. In Aquatic Microbial Ecology and Biogeochemistry: A Dual Perspective; Glibert, P.M., Kana, T.M., Eds.; Springer International Publishing: Cham, 2016; pp. 261–272. ISBN 978-3-319-30257-7. [Google Scholar]
- Ahern, K.S.; Udy, J.W.; Pointon, S.M. Investigating the Potential for Groundwater from Different Vegetation, Soil and Landuses to Stimulate Blooms of the Cyanobacterium, Lyngbya Majuscula, in Coastal Waters. Mar. Freshw. Res. 2006, 57, 177. [Google Scholar] [CrossRef]
- Manson, F.J.; Loneragan, N.R.; Phinn, S.R. Spatial and Temporal Variation in Distribution of Mangroves in Moreton Bay, Subtropical Australia: A Comparison of Pattern Metrics and Change Detection Analyses Based on Aerial Photographs. Estuar. Coast. Shelf Sci. 2003, 57, 653–666. [Google Scholar] [CrossRef]
- Albert, S.; O’Neil, J.M.; Udy, J.W.; Ahern, K.S.; O’Sullivan, C.M.; Dennison, W.C. Blooms of the Cyanobacterium Lyngbya Majuscula in Coastal Queensland, Australia: Disparate Sites, Common Factors. Mar. Pollut. Bull. 2005, 51, 428–437. [Google Scholar] [CrossRef]
- Hanington, P.; Rose, A.; Johnstone, R. The Potential of Benthic Iron and Phosphorus Fluxes to Support the Growth of a Bloom Forming Toxic Cyanobacterium Lyngbya Majuscula, Moreton Bay, Australia. Mar. Freshw. Res. 2016, 67, 1918. [Google Scholar] [CrossRef]
- Robinson, C.; Gibbes, B.; Li, L. Driving Mechanisms for Groundwater Flow and Salt Transport in a Subterranean Estuary. Geophys. Res. Lett. 2006, 33, L03402. [Google Scholar] [CrossRef]
- Gibbes, B.; Robinson, C.; Carey, H.; Li, L.; Lockington, D. Tidally Driven Pore Water Exchange in Offshore Intertidal Sandbanks: Part I. Field Measurements. Estuar. Coast. Shelf Sci. 2008, 79, 121–132. [Google Scholar] [CrossRef]
- Kraal, P.; Burton, E.D.; Rose, A.L.; Kocar, B.D.; Lockhart, R.S.; Grice, K.; Bush, R.T.; Tan, E.; Webb, S.M. Sedimentary Iron–Phosphorus Cycling under Contrasting Redox Conditions in a Eutrophic Estuary. Chem. Geol. 2015, 392, 19–31. [Google Scholar] [CrossRef]
- Chambers, RandolphM. ; Odum, WilliamE. Porewater Oxidation, Dissolved Phosphate and the Iron Curtain: Iron-Phosphorus Relations in Tidal Freshwater Marshes. Biogeochemistry 1990, 10. [Google Scholar] [CrossRef]
- Mayer, T.D.; Jarrell, W.M. Formation and Stability of Iron(II) Oxidation Products under Natural Concentrations of Dissolved Silica. Water Res. 1996, 30, 1208–1214. [Google Scholar] [CrossRef]
- Niencheski, L.F.H.; Windom, H.L.; Moore, W.S.; Jahnke, R.A. Submarine Groundwater Discharge of Nutrients to the Ocean along a Coastal Lagoon Barrier, Southern Brazil. Mar. Chem. 2007, 106, 546–561. [Google Scholar] [CrossRef]
- Windom, H.; Niencheski, F. Biogeochemical Processes in a Freshwater–Seawater Mixing Zone in Permeable Sediments along the Coast of Southern Brazil. Mar. Chem. 2003, 83, 121–130. [Google Scholar] [CrossRef]
- McAllister, S.M.; Barnett, J.M.; Heiss, J.W.; Findlay, A.J.; MacDonald, D.J.; Dow, C.L.; Luther, G.W.; Michael, H.A.; Chan, C.S. Dynamic Hydrologic and Biogeochemical Processes Drive Microbially Enhanced Iron and Sulfur Cycling within the Intertidal Mixing Zone of a Beach Aquifer: Fe and S Cycling in a Beach Aquifer. Limnol. Oceanogr. 2015, 60, 329–345. [Google Scholar] [CrossRef]
- Sawyer, A.H.; Michael, H.A.; Schroth, A.W. From Soil to Sea: The Role of Groundwater in Coastal Critical Zone Processes. WIREs Water 2016, 3, 706–726. [Google Scholar] [CrossRef]
- Liu, Y.; Jiao, J.J.; Liang, W.; Kuang, X. Hydrogeochemical Characteristics in Coastal Groundwater Mixing Zone. Appl. Geochem. 2017, 85, 49–60. [Google Scholar] [CrossRef]
- Lipka, M.; Böttcher, M.E.; Wu, Z.; Sültenfuß, J.; Jenner, A.-K.; Westphal, J.; Dellwig, O.; Escher, P.; Schmiedinger, I.; Winde, V.; et al. Ferruginous Groundwaters as a Source of P, Fe, and DIC for Coastal Waters of the Southern Baltic Sea: (Isotope) Hydrobiogeochemistry and the Role of an Iron Curtain. E3S Web Conf. 2018, 54, 00019. [Google Scholar] [CrossRef]
- Emmenegger, L.; King, D.W.; Sigg, L.; Sulzberger, B. Oxidation Kinetics of Fe(II) in a Eutrophic Swiss Lake. Environ. Sci. Technol. 1998, 32, 2990–2996. [Google Scholar] [CrossRef]
- Liang, L.; McNabb, J.A.; Paulk, J.M.; Gu, B.; McCarthy, J.F. Kinetics of Iron(II) Oxygenation at Low Partial Pressure of Oxygen in the Presence of Natural Organic Matter. Environ. Sci. Technol. 1993, 27, 1864–1870. [Google Scholar] [CrossRef]
- Santana-Casiano, J.M.; Gonzalez-Davila, M.; Millero, F.J. The Effect of Organic Compounds in the Oxidation Kinetics of FežII/. 2000.
- Rose, A.L.; Waite, T.D. Kinetic Model for Fe(II) Oxidation in Seawater in the Absence and Presence of Natural Organic Matter. Environ. Sci. Technol. 2002, 36, 433–444. [Google Scholar] [CrossRef] [PubMed]
- Rose, A.L.; Waite, T.D. Kinetics of Hydrolysis and Precipitation of Ferric Iron in Seawater. Environ. Sci. Technol. 2003, 37, 3897–3903. [Google Scholar] [CrossRef]
- Garg, S.; Jiang, C.; Waite, T.D. Impact of pH on Iron Redox Transformations in Simulated Freshwaters Containing Natural Organic Matter. Environ. Sci. Technol. 2018, 52, 13184–13194. [Google Scholar] [CrossRef] [PubMed]
- Zhang, Q.; Volker, R.E.; Lockington, D.A. Experimental Investigation of Contaminant Transport in Coastal Groundwater. Adv. Environ. Res. 2002, 6, 229–237. [Google Scholar] [CrossRef]
- Kuan, W.K.; Xin, P.; Jin, G.; Robinson, C.E.; Gibbes, B.; Li, L. Combined Effect of Tides and Varying Inland Groundwater Input on Flow and Salinity Distribution in Unconfined Coastal Aquifers. Water Resour. Res. 2019, 55, 8864–8880. [Google Scholar] [CrossRef]
- Mo, Y.; Jin, G.; Zhang, C.; Xu, J.; Tang, H.; Shen, C.; Scheuermann, A.; Li, L. Combined Effect of Inland Groundwater Input and Tides on Flow and Salinization in the Coastal Reservoir and Adjacent Aquifer. J. Hydrol. 2021, 600, 126575. [Google Scholar] [CrossRef]
- Banzhaf, S.; Hebig, K.H. Use of Column Experiments to Investigate the Fate of Organic Micropollutants – a Review. Hydrol. Earth Syst. Sci. 2016, 20, 3719–3737. [Google Scholar] [CrossRef]
- Sinke, A.J.C.; Dury, O.; Zobrist, J. Effects of a Fluctuating Water Table: Column Study on Redox Dynamics and Fate of Some Organic Pollutants. J. Contam. Hydrol. 1998, 33, 231–246. [Google Scholar] [CrossRef]
- Schoen, R.; Gaudet, J.P.; Bariac, T. Preferential Flow and Solute Transport in a Large Lysimeter, under Controlled Boundary Conditions. J. Hydrol. 1999, 215, 70–81. [Google Scholar] [CrossRef]
- Scheytt, T.; Mersmann, P.; Leidig, M.; Pekdeger, A.; Heberer, T. Transport of Pharmaceutically Active Compounds in Saturated Laboratory Columns. Ground Water 2004, 42, 767–773. [Google Scholar] [CrossRef]
- López-Blanco, M.C.; Cancho-Grande, B.; Simal-Gándara, J.; López-Periago, E.; Arias-Estévez, M. Transport of Commercial Endosulfan through a Column of Aggregated Vineyard Soil by a Water Flux Simulating Field Conditions. J. Agric. Food Chem. 2005, 53, 6738–6743. [Google Scholar] [CrossRef]
- Amos, R.T.; Mayer, K.U.; Blowes, D.W.; Ptacek, C.J. Reactive Transport Modeling of Column Experiments for the Remediation of Acid Mine Drainage. Environ. Sci. Technol. 2004, 38, 3131–3138. [Google Scholar] [CrossRef]
- Bradford, S.A.; Bettahar, M. Concentration Dependent Transport of Colloids in Saturated Porous Media. J. Contam. Hydrol. 2006, 82, 99–117. [Google Scholar] [CrossRef]
- Siemens, J.; Huschek, G.; Walshe, G.; Siebe, C.; Kasteel, R.; Wulf, S.; Clemens, J.; Kaupenjohann, M. Transport of Pharmaceuticals in Columns of a Wastewater-Irrigated Mexican Clay Soil. J. Environ. Qual. 2010, 39, 1201–1210. [Google Scholar] [CrossRef]
- Nay, M.; Snozzi, M.; Zehnder, A.J.B. Fate and Behavior of Organic Compounds in an Artificial Saturated Subsoil under Controlled Redox Conditions: The Sequential Soil Column System. Biodegradation 1999, 10, 75–82. [Google Scholar] [CrossRef]
- Alotaibi, M.D.; Patterson, B.M.; McKinley, A.J.; Reeder, A.Y.; Furness, A.J.; Donn, M.J. Fate of Benzotriazole and 5-Methylbenzotriazole in Recycled Water Recharged into an Anaerobic Aquifer: Column Studies. Water Res. 2015, 70, 184–195. [Google Scholar] [CrossRef] [PubMed]
- Banzhaf, S.; Nödler, K.; Licha, T.; Krein, A.; Scheytt, T. Redox-Sensitivity and Mobility of Selected Pharmaceutical Compounds in a Low Flow Column Experiment. Sci. Total Environ. 2012, 438, 113–121. [Google Scholar] [CrossRef] [PubMed]
- Unold, M.; Kasteel, R.; Groeneweg, J.; Vereecken, H. Transport and Transformation of Sulfadiazine in Soil Columns Packed with a Silty Loam and a Loamy Sand. J. Contam. Hydrol. 2009, 103, 38–47. [Google Scholar] [CrossRef]
- Gruenheid, S.; Huebner, U.; Jekel, M. Impact of Temperature on Biodegradation of Bulk and Trace Organics during Soil Passage in an Indirect Reuse System. Water Sci. Technol. 2008, 57, 987–994. [Google Scholar] [CrossRef] [PubMed]
- Hebig, K.H.; Groza, L.G.; Sabourin, M.J.; Scheytt, T.J.; Ptacek, C.J. Transport Behavior of the Pharmaceutical Compounds Carbamazepine, Sulfamethoxazole, Gemfibrozil, Ibuprofen, and Naproxen, and the Lifestyle Drug Caffeine, in Saturated Laboratory Columns. Sci. Total Environ. 2017, 590–591, 708–719. [Google Scholar] [CrossRef] [PubMed]
- Yao, Y.; Gao, B.; Chen, H.; Jiang, L.; Inyang, M.; Zimmerman, A.R.; Cao, X.; Yang, L.; Xue, Y.; Li, H. Adsorption of Sulfamethoxazole on Biochar and Its Impact on Reclaimed Water Irrigation. J. Hazard. Mater. 2012, 209–210, 408–413. [Google Scholar] [CrossRef]
- Burke, V.; Greskowiak, J.; Asmuß, T.; Bremermann, R.; Taute, T.; Massmann, G. Temperature Dependent Redox Zonation and Attenuation of Wastewater-Derived Organic Micropollutants in the Hyporheic Zone. Sci. Total Environ. 2014, 482–483, 53–61. [Google Scholar] [CrossRef]
- Fan, Z.; Casey, F.X.M.; Hakk, H.; Larsen, G.L.; Khan, E. Sorption, Fate, and Mobility of Sulfonamides in Soils. Water. Air. Soil Pollut. 2011, 218, 49–61. [Google Scholar] [CrossRef]
- Salvia, M.-V.; Experton, J.; Geandel, C.; Cren-Olivé, C.; Vulliet, E. Fate of Pharmaceutical Compounds and Steroid Hormones in Soil: Study of Transfer and Degradation in Soil Columns. Environ. Sci. Pollut. Res. 2014, 21, 10525–10535. [Google Scholar] [CrossRef]
- Bertelkamp, C.; Reungoat, J.; Cornelissen, E.R.; Singhal, N.; Reynisson, J.; Cabo, A.J.; van der Hoek, J.P.; Verliefde, A.R.D. Sorption and Biodegradation of Organic Micropollutants during River Bank Filtration: A Laboratory Column Study. Water Res. 2014, 52, 231–241. [Google Scholar] [CrossRef]
- Teijón, G.; Candela, L.; Šimůnek, J.; Tamoh, K.; Valdes-Abellán, J. Fate and Transport of Naproxen in a Sandy Aquifer Material: Saturated Column Studies and Model Evaluation. Soil Sediment Contam. Int. J. 2014, 23, 736–750. [Google Scholar] [CrossRef]
- Cordy, G.E.; Duran, N.L.; Bouwer, H.; Rice, R.C.; Furlong, E.T.; Zaugg, S.D.; Meyer, M.T.; Barber, L.B.; Kolpin, D.W. Do Pharmaceuticals, Pathogens, and Other Organic Waste Water Compounds Persist When Waste Water Is Used for Recharge? Groundw. Monit. Remediat. 2004, 24, 58–69. [Google Scholar] [CrossRef]
- Lewis, J.; Sjöstrom, J. Optimizing the Experimental Design of Soil Columns in Saturated and Unsaturated Transport Experiments. J. Contam. Hydrol. 2010, 115, 1–13. [Google Scholar] [CrossRef] [PubMed]
- De Wilde, T.; Mertens, J.; Šimunek, J.; Sniegowksi, K.; Ryckeboer, J.; Jaeken, P.; Springael, D.; Spanoghe, P. Characterizing Pesticide Sorption and Degradation in Microscale Biopurification Systems Using Column Displacement Experiments. Environ. Pollut. 2009, 157, 463–473. [Google Scholar] [CrossRef] [PubMed]
- Müller, B.; Scheytt, T.; Grützmacher, G. Transport of Primidone, Carbamazepine, and Sulfamethoxazole in Thermally Treated Sediments—Laboratory Column Experiments. J. Soils Sediments 2013, 13, 953–965. [Google Scholar] [CrossRef]
- Rodríguez-Cruz, M.S.; Sánchez-Martín, M.J.; Andrades, M.S.; Sánchez-Camazano, M. Retention of Pesticides in Soil Columns Modified in Situ and Ex Situ with a Cationic Surfactant. Sci. Total Environ. 2007, 378, 104–108. [Google Scholar] [CrossRef] [PubMed]
- Allred; Brown; Brandvold ENHANCED ANIMAL WASTE MANAGEMENT THROUGH APPLICATION OF SURFACTANTS TO SOIL MATERIAL: LABORATORY FEASIBILITY TESTING. Trans. ASAE 2001, 44. [CrossRef]
- Massmann, G.; Dünnbier, U.; Heberer, T.; Taute, T. Behaviour and Redox Sensitivity of Pharmaceutical Residues during Bank Filtration – Investigation of Residues of Phenazone-Type Analgesics. Chemosphere 2008, 71, 1476–1485. [Google Scholar] [CrossRef]
- Persson, Y.; Hemström, K.; Öberg, L.; Tysklind, M.; Enell, A. Use of a Column Leaching Test to Study the Mobility of Chlorinated HOCs from a Contaminated Soil and the Distribution of Compounds between Soluble and Colloid Phases. Chemosphere 2008, 71, 1035–1042. [Google Scholar] [CrossRef]
- Salem Attia, T.M.; Hu, X.L.; Yin, D.Q. Synthesized Magnetic Nanoparticles Coated Zeolite for the Adsorption of Pharmaceutical Compounds from Aqueous Solution Using Batch and Column Studies. Chemosphere 2013, 93, 2076–2085. [Google Scholar] [CrossRef]
- Murillo-Torres, R.; Durán-Álvarez, J.C.; Prado, B.; Jiménez-Cisneros, B.E. Sorption and Mobility of Two Micropollutants in Three Agricultural Soils: A Comparative Analysis of Their Behavior in Batch and Column Experiments. Geoderma 2012, 189–190, 462–468. [Google Scholar] [CrossRef]
- Greenhagen, A.M.; Lenczewski, M.E.; Carroll, M. Natural Attenuation of Pharmaceuticals and an Illicit Drug in a Laboratory Column Experiment. Chemosphere 2014, 115, 13–19. [Google Scholar] [CrossRef] [PubMed]
- Spiteri, C.; Slomp, C.P.; Tuncay, K.; Meile, C. Modeling Biogeochemical Processes in Subterranean Estuaries: Effect of Flow Dynamics and Redox Conditions on Submarine Groundwater Discharge of Nutrients: BIOCHEMISTRY OF SUBTERRANEAN ESTUARIES. Water Resour. Res. 2008, 44. [Google Scholar] [CrossRef]
- Pham, A.N.; Rose, A.L.; Feitz, A.J.; Waite, T.D. Kinetics of Fe(III) Precipitation in Aqueous Solutions at pH 6.0–9.5 and 25°C. Geochim. Cosmochim. Acta 2006, 70, 640–650. [Google Scholar] [CrossRef]
- Zhang, Y.; Li, L.; Erler, D.V.; Santos, I.; Lockington, D. Effects of Alongshore Morphology on Groundwater Flow and Solute Transport in a Nearshore Aquifer. Water Resour. Res. 2016, 52, 990–1008. [Google Scholar] [CrossRef]
- Wang, T.; Zhang, C.; Ma, Y.; Hofmann, H.; Li, C.; Zhao, Z. Numerical Analysis of the Abiotic Formation and Distribution of the “Iron Curtain” in Subterranean Estuaries. Environ. Model. Softw. 2024, 171, 105894. [Google Scholar] [CrossRef]
- Werth, C.J.; Zhang, C.; Brusseau, M.L.; Oostrom, M.; Baumann, T. A Review of Non-Invasive Imaging Methods and Applications in Contaminant Hydrogeology Research. J. Contam. Hydrol. 2010, 113, 1–24. [Google Scholar] [CrossRef] [PubMed]
- Blunt, M.J.; Bijeljic, B.; Dong, H.; Gharbi, O.; Iglauer, S.; Mostaghimi, P.; Paluszny, A.; Pentland, C. Pore-Scale Imaging and Modelling. Adv. Water Resour. 2013, 51, 197–216. [Google Scholar] [CrossRef]
- Zhao, Z.; Zhang, C.; Cao, W.; Hofmann, H.; Wang, T.; Li, L. Oxidative Precipitation of Fe(II) in Porous Media: Laboratory Experiment and Numerical Simulation. ACS EST Water 2023, 3, 963–973. [Google Scholar] [CrossRef]
- Liu, J.; Aruguete, D.M.; Jinschek, J.R.; Donald Rimstidt, J.; Hochella, M.F. The Non-Oxidative Dissolution of Galena Nanocrystals: Insights into Mineral Dissolution Rates as a Function of Grain Size, Shape, and Aggregation State. Geochim. Cosmochim. Acta 2008, 72, 5984–5996. [Google Scholar] [CrossRef]
- Deng, H.; Molins, S.; Trebotich, D.; Steefel, C.; DePaolo, D. Pore-Scale Numerical Investigation of the Impacts of Surface Roughness: Upscaling of Reaction Rates in Rough Fractures. Geochim. Cosmochim. Acta 2018, 239, 374–389. [Google Scholar] [CrossRef]
- Jung, H.; Navarre-Sitchler, A. Physical Heterogeneity Control on Effective Mineral Dissolution Rates. Geochim. Cosmochim. Acta 2018, 227, 246–263. [Google Scholar] [CrossRef]
- Algive, L.; Bekri, S.; Vizika, O. Pore-Network Modeling Dedicated to the Determination of the Petrophysical-Property Changes in the Presence of Reactive Fluid. SPE J. 2010, 15, 618–633. [Google Scholar] [CrossRef]
- Min, T.; Gao, Y.; Chen, L.; Kang, Q.; Tao, W. Changes in Porosity, Permeability and Surface Area during Rock Dissolution: Effects of Mineralogical Heterogeneity. Int. J. Heat Mass Transf. 2016, 103, 900–913. [Google Scholar] [CrossRef]
- Kang, Q.; Tsimpanogiannis, I.N.; Zhang, D.; Lichtner, P.C. Numerical Modeling of Pore-Scale Phenomena during CO2 Sequestration in Oceanic Sediments. Fuel Process. Technol. 2005, 86, 1647–1665. [Google Scholar] [CrossRef]
- Tartakovsky, A.M.; Meakin, P.; Scheibe, T.D.; Wood, B.D. A Smoothed Particle Hydrodynamics Model for Reactive Transport and Mineral Precipitation in Porous and Fractured Porous Media. Water Resour. Res. 2007, 43, 2005WR004770. [Google Scholar] [CrossRef]
- Tartakovsky, A.M.; Redden, G.; Lichtner, P.C.; Scheibe, T.D.; Meakin, P. Mixing-induced Precipitation: Experimental Study and Multiscale Numerical Analysis. Water Resour. Res. 2008, 44, 2006WR005725. [Google Scholar] [CrossRef]
- Fox, D.T.; Guo, L.; Fujita, Y.; Huang, H.; Redden, G. Experimental and Numerical Analysis of Parallel Reactant Flow and Transverse Mixing with Mineral Precipitation in Homogeneous and Heterogeneous Porous Media. Transp. Porous Media 2016, 111, 605–626. [Google Scholar] [CrossRef]
- Garcia-Rios, M.; Luquot, L.; Soler, J.M.; Cama, J. The Role of Mineral Heterogeneity on the Hydrogeochemical Response of Two Fractured Reservoir Rocks in Contact with Dissolved CO2. Appl. Geochem. 2017, 84, 202–217. [Google Scholar] [CrossRef]
- Rajyaguru, A.; L’Hôpital, E.; Savoye, S.; Wittebroodt, C.; Bildstein, O.; Arnoux, P.; Detilleux, V.; Fatnassi, I.; Gouze, P.; Lagneau, V. Experimental Characterization of Coupled Diffusion Reaction Mechanisms in Low Permeability Chalk. Chem. Geol. 2019, 503, 29–39. [Google Scholar] [CrossRef]
- Missimer, T.; Lopez, O. Laboratory Measurement of Total Porosity in Unconsolidated Quartz Sand by Two Integrated Methods. J. Geol. Geophys. 2018, 07. [Google Scholar] [CrossRef]
- Steefel, C.I.; Appelo, C.A.J.; Arora, B.; Jacques, D.; Kalbacher, T.; Kolditz, O.; Lagneau, V.; Lichtner, P.C.; Mayer, K.U.; Meeussen, J.C.L.; et al. Reactive Transport Codes for Subsurface Environmental Simulation. Comput. Geosci. 2015, 19, 445–478. [Google Scholar] [CrossRef]
- Billen, M. Darcy’s Law-Flow in a Porous Medium; 2021.
- Mitchell, J.K.; Soga, K. Fundamentals of Soil Behavior; John Wiley & Sons, Inc.: Hoboken, New Jersey, 2005; ISBN 978-0-471-46302-7. [Google Scholar]
- Yan, G.; Ma, Y.; Scheuermann, A.; Li, L. The Hydraulic Properties of Aquabeads Considering Forchheimer Flow and Local Heterogeneity. Geotech. Test. J. 2022, 45, 20210234. [Google Scholar] [CrossRef]
- Sandoval, G.F.B.; Galobardes, I.; Teixeira, R.S.; Toralles, B.M. Comparison between the Falling Head and the Constant Head Permeability Tests to Assess the Permeability Coefficient of Sustainable Pervious Concretes. Case Stud. Constr. Mater. 2017, 7, 317–328. [Google Scholar] [CrossRef]
- Chandrappa, A.K.; Biligiri, K.P. Comprehensive Investigation of Permeability Characteristics of Pervious Concrete: A Hydrodynamic Approach. Constr. Build. Mater. 2016, 123, 627–637. [Google Scholar] [CrossRef]
- Neithalath, N.; Sumanasooriya, M.S.; Deo, O. Characterizing Pore Volume, Sizes, and Connectivity in Pervious Concretes for Permeability Prediction. Mater. Charact. 2010, 61, 802–813. [Google Scholar] [CrossRef]
- Odong, J. Evaluation of Empirical Formulae for Determination of Hydraulic Conductivity Based on Grain-Size Analysis. 2008.
- Liou, C.P. Limitations and Proper Use of the Hazen-Williams Equation. J. Hydraul. Eng. 1998, 124, 951–954. [Google Scholar] [CrossRef]
- Carrier, W.D. Goodbye, Hazen; Hello, Kozeny-Carman. J. Geotech. Geoenvironmental Eng. 2003, 129, 1054–1056. [Google Scholar] [CrossRef]
- Rahman, M.M.; Alim, M.A.; Shahjalal, M. Permeability Measurement of Granular Materials and Development of an Equation. 2017.
- Zheng, W.; Tannant, D.D. Improved Estimate of the Effective Diameter for Use in the Kozeny–Carman Equation for Permeability Prediction. Géotechnique Lett. 2017, 7, 1–5. [Google Scholar] [CrossRef]
- Ren, X.; Zhao, Y.; Deng, Q.; Kang, J.; Li, D.; Wang, D. A Relation of Hydraulic Conductivity — Void Ratio for Soils Based on Kozeny-Carman Equation. Eng. Geol. 2016, 213, 89–97. [Google Scholar] [CrossRef]
- Pomès, V.; Bazin, B.; Golfier, F.; Zarcone, C.; Lenormand, R.; Quintard, M. On The Use of Upscaling Methods to Describe Acid Injection in Carbonates.; New Orleans, Louisiana, 2001.
- Mostaghimi, P.; Blunt, M.J.; Bijeljic, B. Computations of Absolute Permeability on Micro-CT Images. Math. Geosci. 2013, 45, 103–125. [Google Scholar] [CrossRef]
- Ground Characterization and Foundations: Proceedings of Indian Geotechnical Conference 2020 Volume 1; Satyanarayana Reddy, C. N.V., Muthukkumaran, K., Satyam, N., Vaidya, R., Eds.; Lecture Notes in Civil Engineering; Springer Singapore: Singapore, 2022; p. Vol. 167. ISBN 9789811633829. [Google Scholar]
- Marschalko, M.; Zięba, Z.; Niemiec, D.; Neuman, D.; Mońka, J.; Dąbrowska, J. Suitability of Engineering-Geological Environment on the Basis of Its Permeability Coefficient: Four Case Studies of Fine-Grained Soils. Materials 2021, 14, 6411. [Google Scholar] [CrossRef] [PubMed]
- Jose, F. Determination of Hydraulic Conductivities through Grain-Size Analysis. Boston Coll. Electron. Thesis Diss. 2016, 1–112. [Google Scholar]
- Hommel, J.; Coltman, E.; Class, H. Porosity–Permeability Relations for Evolving Pore Space: A Review with a Focus on (Bio-)Geochemically Altered Porous Media. Transp. Porous Media 2018, 124, 589–629. [Google Scholar] [CrossRef]
- Ehsan Samaei, S.; Berardi, U.; Taban, E.; Soltani, P.; Mohammad Mousavi, S. Natural Fibro-Granular Composite as a Novel Sustainable Sound-Absorbing Material. Appl. Acoust. 2021, 181, 108157. [Google Scholar] [CrossRef]
- Carman, P.C. Fluid Flow through Granular Beds. Chem. Eng. Res. Des. 1937, 75, S32–S48. [Google Scholar] [CrossRef]
- Ghanbarian, B.; Hunt, A.G.; Ewing, R.P.; Sahimi, M. Tortuosity in Porous Media: A Critical Review. Soil Sci. Soc. Am. J. 2013, 77, 1461–1477. [Google Scholar] [CrossRef]
- Hillel, D. Introduction to Environmental Soil Physics; 2003; ISBN 978-0-12-348655-4.
- Bear, J. Dynamics of Fluids in Porous Media; American Elsevier Publishing Company: New Yor, 1972. [Google Scholar]
- Holzer, L.; Marmet, P.; Fingerle, M.; Wiegmann, A.; Neumann, M.; Schmidt, V. Tortuosity and Microstructure Effects in Porous Media: Classical Theories, Empirical Data and Modern Methods; Springer Series in Materials Science; Springer International Publishing: Cham, 2023; Vol. 333; ISBN 978-3-031-30476-7.
- Koponen, A.; Kataja, M.; Timonen, J. Permeability and Effective Porosity of Porous Media. Phys. Rev. E 1997, 56, 3319–3325. [Google Scholar] [CrossRef]
- Mota, M.; Teixeira, J.A.; Bowen, W.R.; Yelshin, A. Binary Spherical Particle Mixed Beds Porosity and Permeability Relationship Measurement.Pdf. Trans. Filtr. Soc. 2001, 1, 101–106. [Google Scholar]
- Millington, R.J.; Quirk, J.P. Permeability of Porous Solids. Trans. Faraday Soc. 1961, 57, 1200. [Google Scholar] [CrossRef]
- Mauret, E.; Renaud, M. Transport Phenomena in Multi-Particle Systems--l. Limits of Applicability of Capillary Model in High Voidage Beds- Application to Fixed Beds of Fibers and Fluidized Beds of Spheres. Chem. Eng. Sci. 1997, 52, 1807–1817. [Google Scholar] [CrossRef]
- Comiti, J.; Renaud, M. A New Model for Determining Mean Structure Parameters of Fixed Beds from Pressure Drop Measurements: Application to Beds Packed with Parallelepipedal Particles. Chem. Eng. Sci. 1989, 44, 1539–1545. [Google Scholar] [CrossRef]
- Matyka, M.; Khalili, A.; Koza, Z. Tortuosity-Porosity Relation in Porous Media Flow. Phys. Rev. E 2008, 78, 026306. [Google Scholar] [CrossRef]
- Li, J.-H.; Yu, B.-M. Tortuosity of Flow Paths through a Sierpinski Carpet. Chin. Phys. Lett. 2011, 28, 034701. [Google Scholar] [CrossRef]
- Ahmadi, M.M.; Mohammadi, S.; Hayati, A.N. Analytical Derivation of Tortuosity and Permeability of Monosized Spheres: A Volume Averaging Approach. Phys. Rev. E 2011, 83, 026312. [Google Scholar] [CrossRef] [PubMed]
- Pavuluri, S.; Tournassat, C.; Claret, F.; Soulaine, C. Reactive Transport Modeling with a Coupled OpenFOAM®-PHREEQC Platform. Transp. Porous Media 2022, 145, 475–504. [Google Scholar] [CrossRef]
- Soulaine, C.; Pavuluri, S.; Claret, F.; Tournassat, C. porousMedia4Foam: Multi-Scale Open-Source Platform for Hydro-Geochemical Simulations with OpenFOAM®. Environ. Model. Softw. 2021, 145, 105199. [Google Scholar] [CrossRef]
- Steefel, C.I.; Lichtner, P.C. Multicomponent Reactive Transport in Discrete Fractures II: Infiltration of Hyperalkaline Groundwater at Maqarin, Jordan, a Natural Analogue Site. J. Hydrol. 1998. [Google Scholar]
- Xie, M.; Mayer, K.U.; Claret, F.; Alt-Epping, P.; Jacques, D.; Steefel, C.; Chiaberge, C.; Simunek, J. Implementation and Evaluation of Permeability-Porosity and Tortuosity-Porosity Relationships Linked to Mineral Dissolution-Precipitation. Comput. Geosci. 2015, 19, 655–671. [Google Scholar] [CrossRef]
- Andreani, M.; Luquot, L.; Gouze, P.; Godard, M.; Hoisé, E.; Gibert, B. Experimental Study of Carbon Sequestration Reactions Controlled by the Percolation of CO 2 -Rich Brine through Peridotites. Environ. Sci. Technol. 2009, 43, 1226–1231. [Google Scholar] [CrossRef]
- Luhmann, A.J.; Kong, X.-Z.; Tutolo, B.M.; Garapati, N.; Bagley, B.C.; Saar, M.O.; Seyfried, W.E. Experimental Dissolution of Dolomite by CO2-Charged Brine at 100°C and 150bar: Evolution of Porosity, Permeability, and Reactive Surface Area. Chem. Geol. 2014, 380, 145–160. [Google Scholar] [CrossRef]
- Harrison, A.L.; Dipple, G.M.; Power, I.M.; Mayer, K.U. The Impact of Evolving Mineral–Water–Gas Interfacial Areas on Mineral–Fluid Reaction Rates in Unsaturated Porous Media. Chem. Geol. 2016, 421, 65–80. [Google Scholar] [CrossRef]
- Jeen, S.-W.; Mayer, K.U.; Gillham, R.W.; Blowes, D.W. Reactive Transport Modeling of Trichloroethene Treatment with Declining Reactivity of Iron. Environ. Sci. Technol. 2007, 41, 1432–1438. [Google Scholar] [CrossRef]
- Beckingham, L.E.; Steefel, C.I.; Swift, A.M.; Voltolini, M.; Yang, L.; Anovitz, L.M.; Sheets, J.M.; Cole, D.R.; Kneafsey, T.J.; Mitnick, E.H.; et al. Evaluation of Accessible Mineral Surface Areas for Improved Prediction of Mineral Reaction Rates in Porous Media. Geochim. Cosmochim. Acta 2017, 205, 31–49. [Google Scholar] [CrossRef]
- Sabo, M.S.; Beckingham, L.E. Porosity-Permeability Evolution During Simultaneous Mineral Dissolution and Precipitation. Water Resour. Res. 2021, 57. [Google Scholar] [CrossRef]
- Li, L.; Maher, K.; Navarre-Sitchler, A.; Druhan, J.; Meile, C.; Lawrence, C.; Moore, J.; Perdrial, J.; Sullivan, P.; Thompson, A.; et al. Expanding the Role of Reactive Transport Models in Critical Zone Processes. Earth-Sci. Rev. 2017, 165, 280–301. [Google Scholar] [CrossRef]
- Lichtner, P.C. Continuum Model for Simultaneous Chemical Reactions and Mass Transport in Hydrothermal Systems. Geochim. Cosmochim. Acta 1985, 49, 779–800. [Google Scholar] [CrossRef]
- Mayer, K.U.; Frind, E.O.; Blowes, D.W. Multicomponent Reactive Transport Modeling in Variably Saturated Porous Media Using a Generalized Formulation for Kinetically Controlled Reactions: REACTIVE TRANSPORT MODELING IN VARIABLY SATURATED MEDIA. Water Resour. Res. 2002, 38, 13-1–13-21. [Google Scholar] [CrossRef]
- Xu, T.; Sonnenthal, E.; Spycher, N.; Pruess, K. TOUGHREACT—A Simulation Program for Non-Isothermal Multiphase Reactive Geochemical Transport in Variably Saturated Geologic Media: Applications to Geothermal Injectivity and CO2 Geological Sequestration. Comput. Geosci. 2006, 32, 145–165. [Google Scholar] [CrossRef]
- Jacques, D.; Šimůnek, J.; Mallants, D.; Genuchten, M.Th. Modeling Coupled Hydrologic and Chemical Processes: Long-Term Uranium Transport Following Phosphorus Fertilization. Vadose Zone J. 2008, 7, 698–711. [Google Scholar] [CrossRef]
- Lichtner, P.C.; Hammond, G.E.; Lu, C.; Karra, S.; Bisht, G.; Andre, B.; Mills, R.; Kumar, J. PFLOTRAN User Manual: A Massively Parallel Reactive Flow and Transport Model for Describing Surface and Subsurface Processes; 2015; p. LA-UR--15-20403, 1168703.
- Poonoosamy, J.; Soulaine, C.; Burmeister, A.; Deissmann, G.; Bosbach, D.; Roman, S. Microfluidic Flow-through Reactor and 3D Raman Imaging for in Situ Assessment of Mineral Reactivity in Porous and Fractured Porous Media. Lab. Chip 2020, 20, 2562–2571. [Google Scholar] [CrossRef]
- Garing, C.; Gouze, P.; Kassab, M.; Riva, M.; Guadagnini, A. Anti-Correlated Porosity–Permeability Changes During the Dissolution of Carbonate Rocks: Experimental Evidences and Modeling. Transp. Porous Media 2015, 107, 595–621. [Google Scholar] [CrossRef]
- Baqer, Y.; Chen, X. A Review on Reactive Transport Model and Porosity Evolution in the Porous Media. Environ. Sci. Pollut. Res. 2022, 29, 47873–47901. [Google Scholar] [CrossRef]
- Xie, C.; Raeini, A.Q.; Wang, Y.; Blunt, M.J.; Wang, M. An Improved Pore-Network Model Including Viscous Coupling Effects Using Direct Simulation by the Lattice Boltzmann Method. Adv. Water Resour. 2017, 100, 26–34. [Google Scholar] [CrossRef]
- Dashtian, H.; Bakhshian, S.; Hajirezaie, S.; Nicot, J.-P.; Hosseini, S.A. Convection-Diffusion-Reaction of CO2-Enriched Brine in Porous Media: A Pore-Scale Study. Comput. Geosci. 2019, 125, 19–29. [Google Scholar] [CrossRef]
- Molins, S.; Trebotich, D.; Miller, G.H.; Steefel, C.I. Mineralogical and Transport Controls on the Evolution of Porous Media Texture Using Direct Numerical Simulation: CONTROLS ON TEXTURE EVOLUTION. Water Resour. Res. 2017, 53, 3645–3661. [Google Scholar] [CrossRef]
- Noiriel, C.; Soulaine, C. Pore-Scale Imaging and Modelling of Reactive Flow in Evolving Porous Media: Tracking the Dynamics of the Fluid–Rock Interface. Transp. Porous Media 2021, 140, 181–213. [Google Scholar] [CrossRef]
- Deng, H.; Gharasoo, M.; Zhang, L.; Dai, Z.; Hajizadeh, A.; Peters, C.A.; Soulaine, C.; Thullner, M.; Van Cappellen, P. A Perspective on Applied Geochemistry in Porous Media: Reactive Transport Modeling of Geochemical Dynamics and the Interplay with Flow Phenomena and Physical Alteration. Appl. Geochem. 2022, 146, 105445. [Google Scholar] [CrossRef]
- Liu, H.; Zhang, Y.; Valocchi, A.J. Lattice Boltzmann Simulation of Immiscible Fluid Displacement in Porous Media: Homogeneous versus Heterogeneous Pore Network. Phys. Fluids 2015, 27, 052103. [Google Scholar] [CrossRef]
- Yan, G.; Li, Z.; Bore, T.; Galindo Torres, S.A.; Scheuermann, A.; Li, L. A Lattice Boltzmann Exploration of Two-Phase Displacement in 2D Porous Media under Various Pressure Boundary Conditions. J. Rock Mech. Geotech. Eng. 2022, 14, 1782–1798. [Google Scholar] [CrossRef]
- Molins, S.; Soulaine, C.; Prasianakis, N.I.; Abbasi, A.; Poncet, P.; Ladd, A.J.C.; Starchenko, V.; Roman, S.; Trebotich, D.; Tchelepi, H.A.; et al. Simulation of Mineral Dissolution at the Pore Scale with Evolving Fluid-Solid Interfaces: Review of Approaches and Benchmark Problem Set. Comput. Geosci. 2021, 25, 1285–1318. [Google Scholar] [CrossRef]
- Soulaine, C.; Davit, Y.; Quintard, M. A Two-Pressure Model for Slightly Compressible Single Phase Flow in Bi-Structured Porous Media. Chem. Eng. Sci. 2013, 96, 55–70. [Google Scholar] [CrossRef]
- Pavuluri, S.; Maes, J.; Yang, J.; Regaieg, M.; Moncorgé, A.; Doster, F. Towards Pore Network Modelling of Spontaneous Imbibition: Contact Angle Dependent Invasion Patterns and the Occurrence of Dynamic Capillary Barriers. Comput. Geosci. 2020, 24, 951–969. [Google Scholar] [CrossRef]
- Soulaine, C.; Tchelepi, H.A. Micro-Continuum Approach for Pore-Scale Simulation of Subsurface Processes. Transp. Porous Media 2016, 113, 431–456. [Google Scholar] [CrossRef]
- Battiato, I.; Tartakovsky, D.M.; Tartakovsky, A.M.; Scheibe, T.D. Hybrid Models of Reactive Transport in Porous and Fractured Media. Adv. Water Resour. 2011, 34, 1140–1150. [Google Scholar] [CrossRef]
- Scheibe, T.D.; Perkins, W.A.; Richmond, M.C.; McKinley, M.I.; Romero-Gomez, P.D.J.; Oostrom, M.; Wietsma, T.W.; Serkowski, J.A.; Zachara, J.M. Pore-Scale and Multiscale Numerical Simulation of Flow and Transport in a Laboratory-Scale Column. Water Resour. Res. 2015, 51, 1023–1035. [Google Scholar] [CrossRef]
- Soulaine, C.; Creux, P.; Tchelepi, H.A. Micro-Continuum Framework for Pore-Scale Multiphase Fluid Transport in Shale Formations. Transp. Porous Media 2019, 127, 85–112. [Google Scholar] [CrossRef]
- Lai, P.; Krevor, S. Pore Scale Heterogeneity in the Mineral Distribution and Surface Area of Berea Sandstone. Energy Procedia 2014, 63, 3582–3588. [Google Scholar] [CrossRef]
- Saripalli, K.P.; Serne, R.J.; Meyer, P.D.; McGrail, B.P. Prediction of Diffusion Coefficients in Porous Media Using Tortuosity Factors Based on Interfacial Areas. Groundwater 2002, 40, 346–352. [Google Scholar] [CrossRef]
- Pereira Nunes, J.P.; Blunt, M.J.; Bijeljic, B. Pore-scale Simulation of Carbonate Dissolution in micro-CT Images. J. Geophys. Res. Solid Earth 2016, 121, 558–576. [Google Scholar] [CrossRef]
- Roslin, A.; Pokrajac, D.; Zhou, Y. Cleat Structure Analysis and Permeability Simulation of Coal Samples Based on Micro-Computed Tomography (Micro-CT) and Scan Electron Microscopy (SEM) Technology. Fuel 2019, 254, 115579. [Google Scholar] [CrossRef]
- Wang, S.; Spurin, C.; Bultreys, T. Pore-Scale Imaging of Multiphase Flow Fluctuations in Continuum-Scale Samples. Water Resour. Res. 2023, 59, e2023WR034720. [Google Scholar] [CrossRef]


Disclaimer/Publisher’s Note: The statements, opinions and data contained in all publications are solely those of the individual author(s) and contributor(s) and not of MDPI and/or the editor(s). MDPI and/or the editor(s) disclaim responsibility for any injury to people or property resulting from any ideas, methods, instructions or products referred to in the content. |
© 2024 by the authors. Licensee MDPI, Basel, Switzerland. This article is an open access article distributed under the terms and conditions of the Creative Commons Attribution (CC BY) license (http://creativecommons.org/licenses/by/4.0/).


