3.1. Change in Surface Temperature with Change (Increase) of O3 Amount
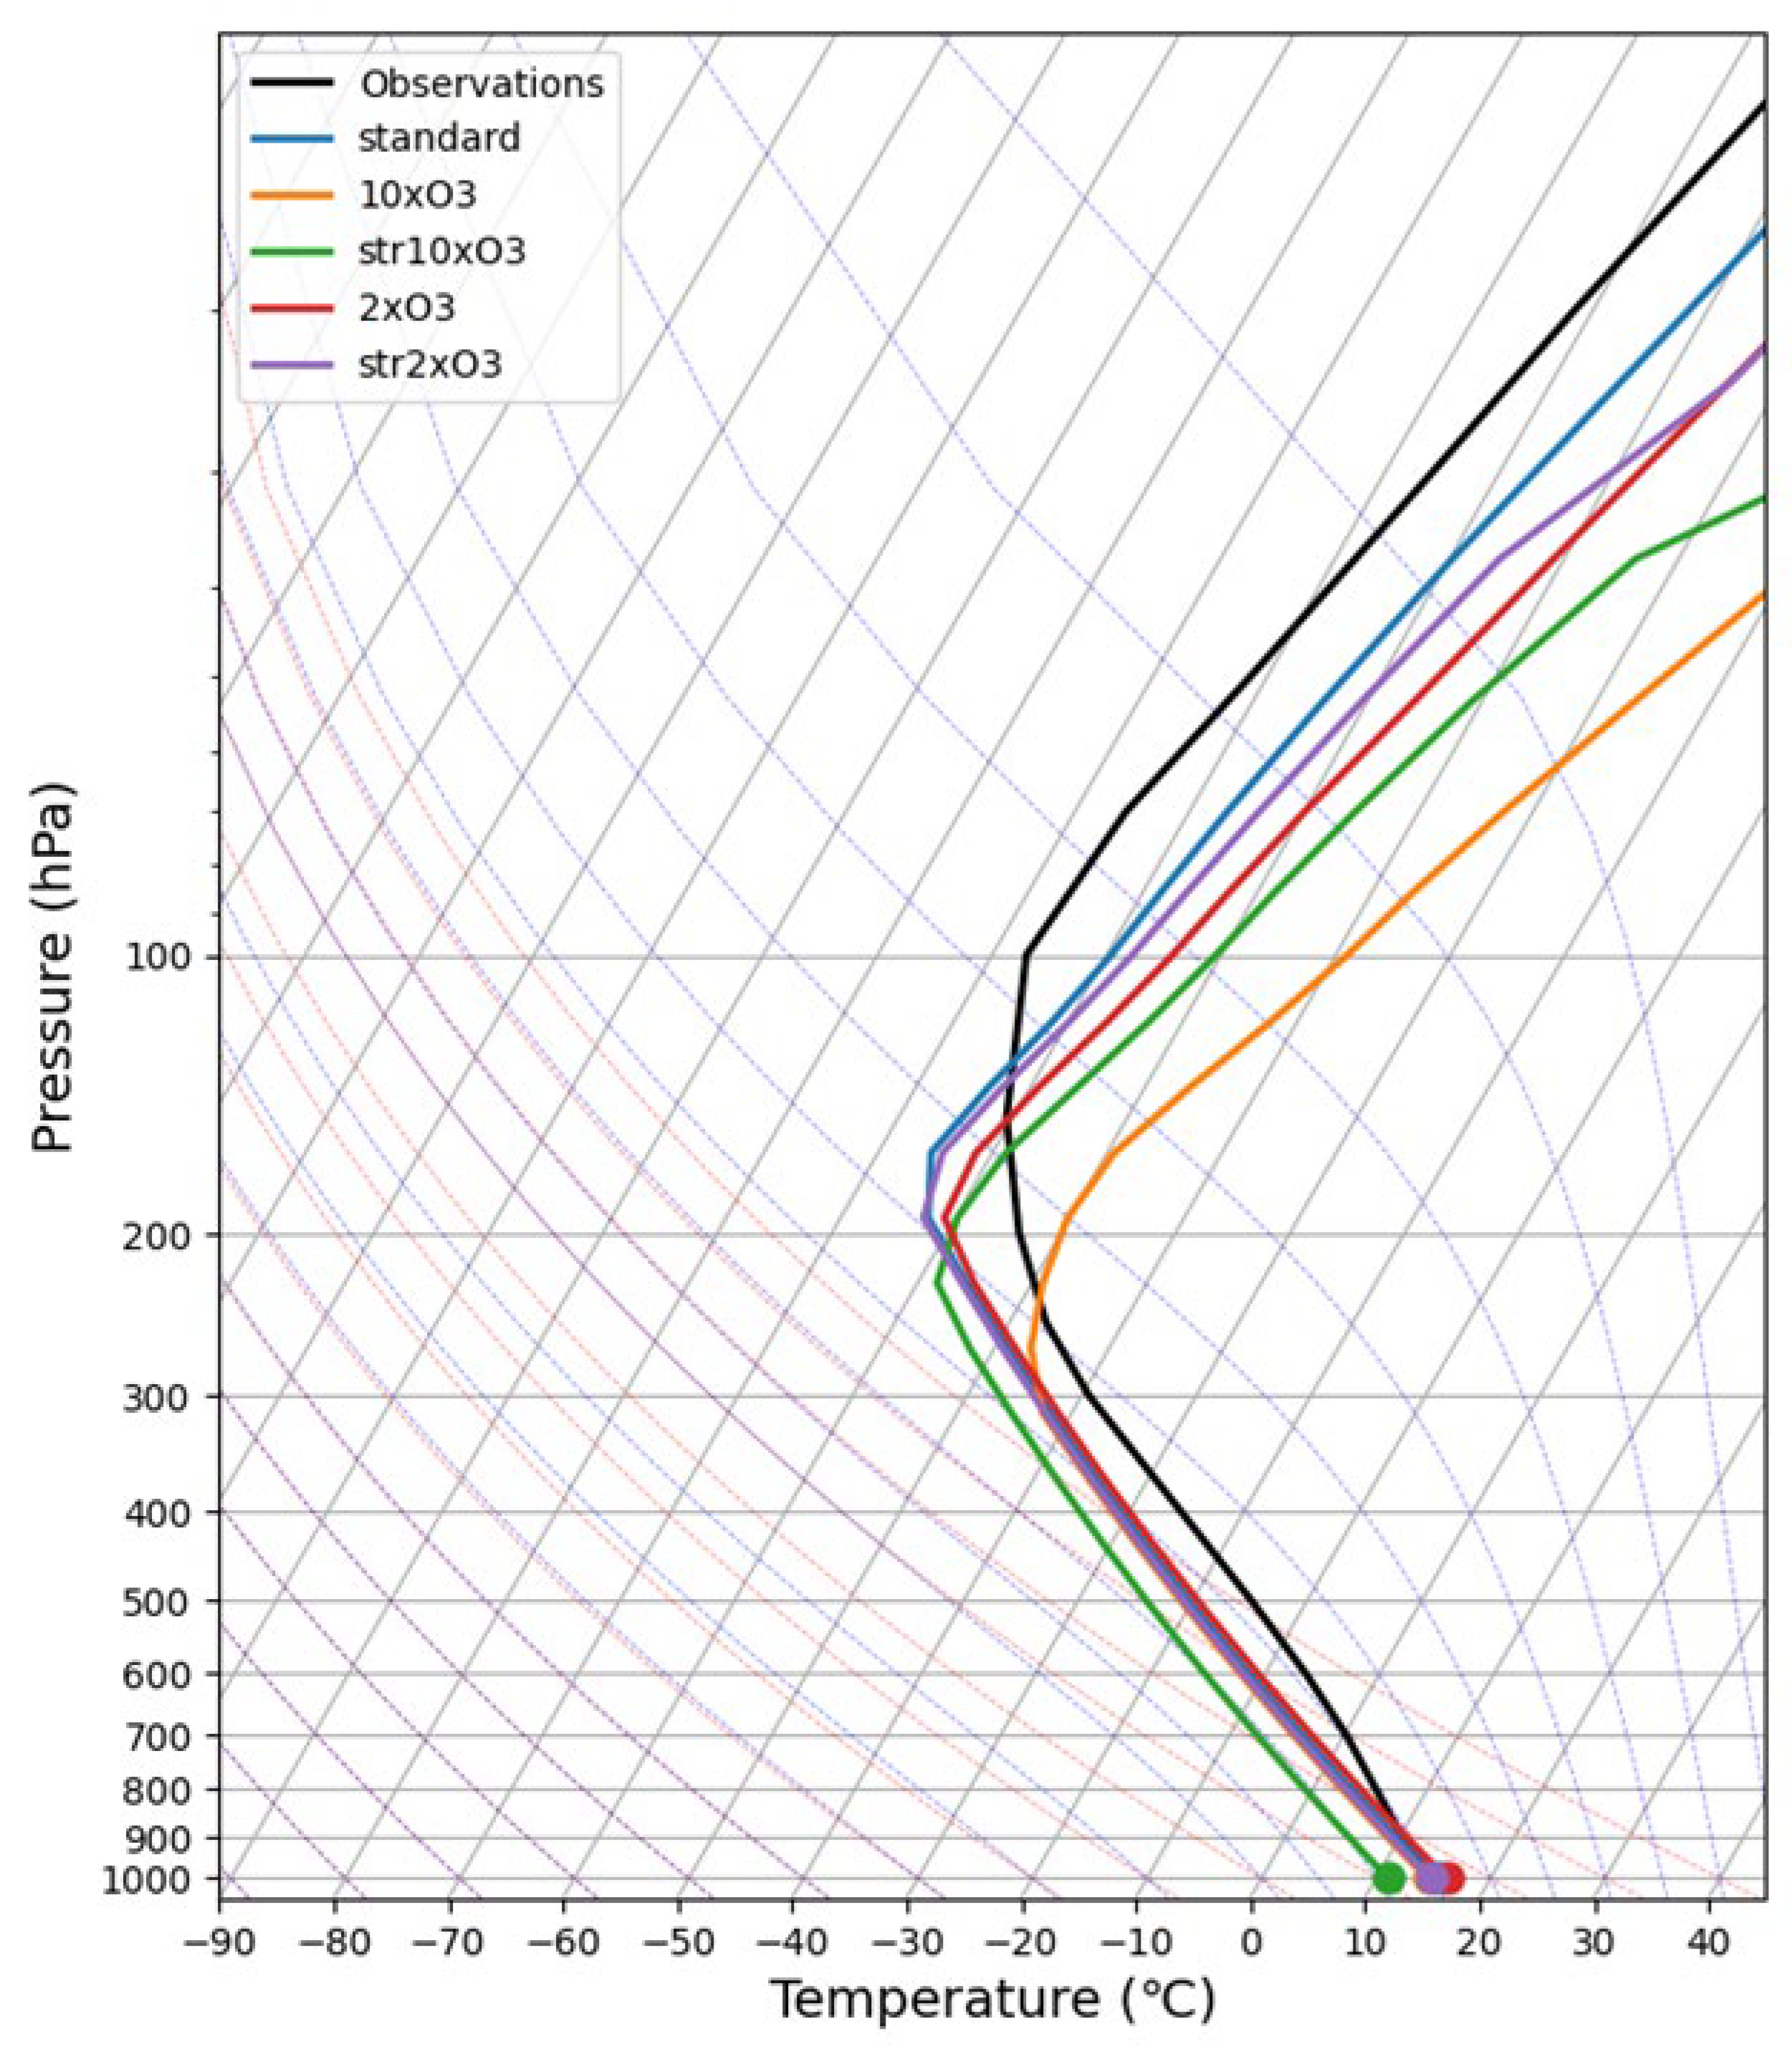
One-dimensional (vertical) radiative-convective equilibrium temperature calculations were performed by changing (increasing) the amount of O
3 with respect to vertical distribution. (albedo = 0.25, adj_lapse_rate = 6.5 (°C/km)) The calculations were made keeping constant relative humidity for the amount of H
2O. The results obtained are shown in
Figure 1 and
Table 1 and
Table 2.
Table 1 and
Table 2 show the amounts of temperature change from the standard condition.
Altitude level:
[3.54, 7.39, 13.97, 23.94, 37.23, 53.11, 70.06, 85.44, 100.51, 118.25, 139.11, 163.66, 192.54, 226.51, 266.48, 313.50, 368.82, 433.90, 510.46, 600.52, 696.80, 787.70, 867.16, 929.65, 970.56, 992.56 (hPa)]
O3 amount in standard condition:
[7.53e-6, 8.52e-6, 7.87e-6, 5.60e-6, 3.46e-6, 2.03e-6, 1.13e-6, 7.30e-7, 5.27e-7, 3.84e-7, 2.82e-7, 2.12e-7, 1.63e-7, 1.18e-7, 8.24e-8, 6.26e-8, 5.34e-8, 4.73e-8, 4.24e-8, 3.91e-8, 3.56e-8, 3.12e-8, 2.73e-8, 2.47e-8, 2.30e-8, 2.22e-8]
H2O amount in standard condition:
[2.16e-06, 2.15e-06, 2.15e-06, 2.13e-06, 2.12e-06, 2.11e-06, 2.09e-06, 2.11e-06, 2.42e-06,
3.13e-06, 5.01e-06, 9.61e-06, 2.09e-05, 4.79e-05, 1.05e-04, 2.12e-04, 3.94e-04, 7.11e-04,
1.34e-03, 2.05e-03, 3.17e-03, 4.97e-03, 6.62e-03, 8.38e-03, 9.39e-03, 9.65e-03]
Other absorbing species amounts:
CO2 0.000348, CH4 1.65e-06, N2O 3.06e-07, O2 0.21, CFC11 0.0, CFC12 0.0, CFC22 0.0, CCL4 0.0
When stratospheric O
3 is increased, the increase in stratospheric O
3 acts to absorb shortwave radiation better, increasing stratospheric temperatures and decreasing surface temperatures. On the other hand, an increase in tropospheric O
3 increases surface temperatures. These degrees are greater by a factor of 10 than by a factor of 2.
Table 2 shows the case where the amount of O
3 is increased by a factor of 10 for each altitude level only. The altitude boundary at which an increase in O
3 lowers or raises surface temperatures is about 25 km. The calculations performed for three different ozone distributions (26 km, 22 km, and 19 km maximum altitudes) reported that surface temperatures increased with decreasing maximum altitude [
7]. The results presented here are consistent with this report. It was found from these data that an increase in O
3 in the stratosphere (above 25 km altitude) decreases surface temperatures.
3.2. As for Stratospheric O3 Increase
Next, concerning the method to increase the amount of O3 in the stratosphere, a typical method is to inject O3 directly into the stratosphere. After injection, O3 diffuses/transports and its concentration changes/decreases. Since the O3 concentration exceeds the natural (steady-state) O3 concentration, the O3 concentration will decrease also due to photochemical reactions. First, without considering diffusion/transport, the O3 concentration change due to photochemical reactions will be discussed.
Ozone production and destruction in the stratosphere can be explained by the Chapman model.
O2 + hν(240nm以下) → O + O (J1) -- ①
O + O2 + M → O3 + M (k1) -- ②
O3 + hν(320nm以下) → O + O2 (J2) -- ③
O + O3 → 2O2 (k2) -- ④
Thus, the rate of change of each quantity is as follows.
d nO = 2*J1*nO2 + J2*nO3 – k1*nO*nO2*nair - k2*nO*nO3 -- ⑤
d n02 = J2*nO3 + 2*k2*nO*nO3 - J1*nO2 - k1*nO*nO2*nair -- ⑥
d n03 = k1*nO*nO2*nair - J2*nO3 - k2*nO*nO3 -- ⑦
(nO: oxygen atom density, nO2: oxygen molecule density, nO3: ozone molecule density, nair: air density)
For example, I consider an injection of O
3 (10 times the amount of the natural state) into a region at an altitude of 30 km. There are literature reports on the calculation of stratospheric ozone with the values shown in
Table 3 [
8,
9]. Let me consider this as an example.
Assuming that the oxygen atom density nO is in a steady state, using equation ⑤ = 0 and the values in
Table 3, nO is about 1e7. Using 10 times the value in
Table 3 (3.610e13) as the initial value for nO
3, values in
Table 3 for nO
2 and n
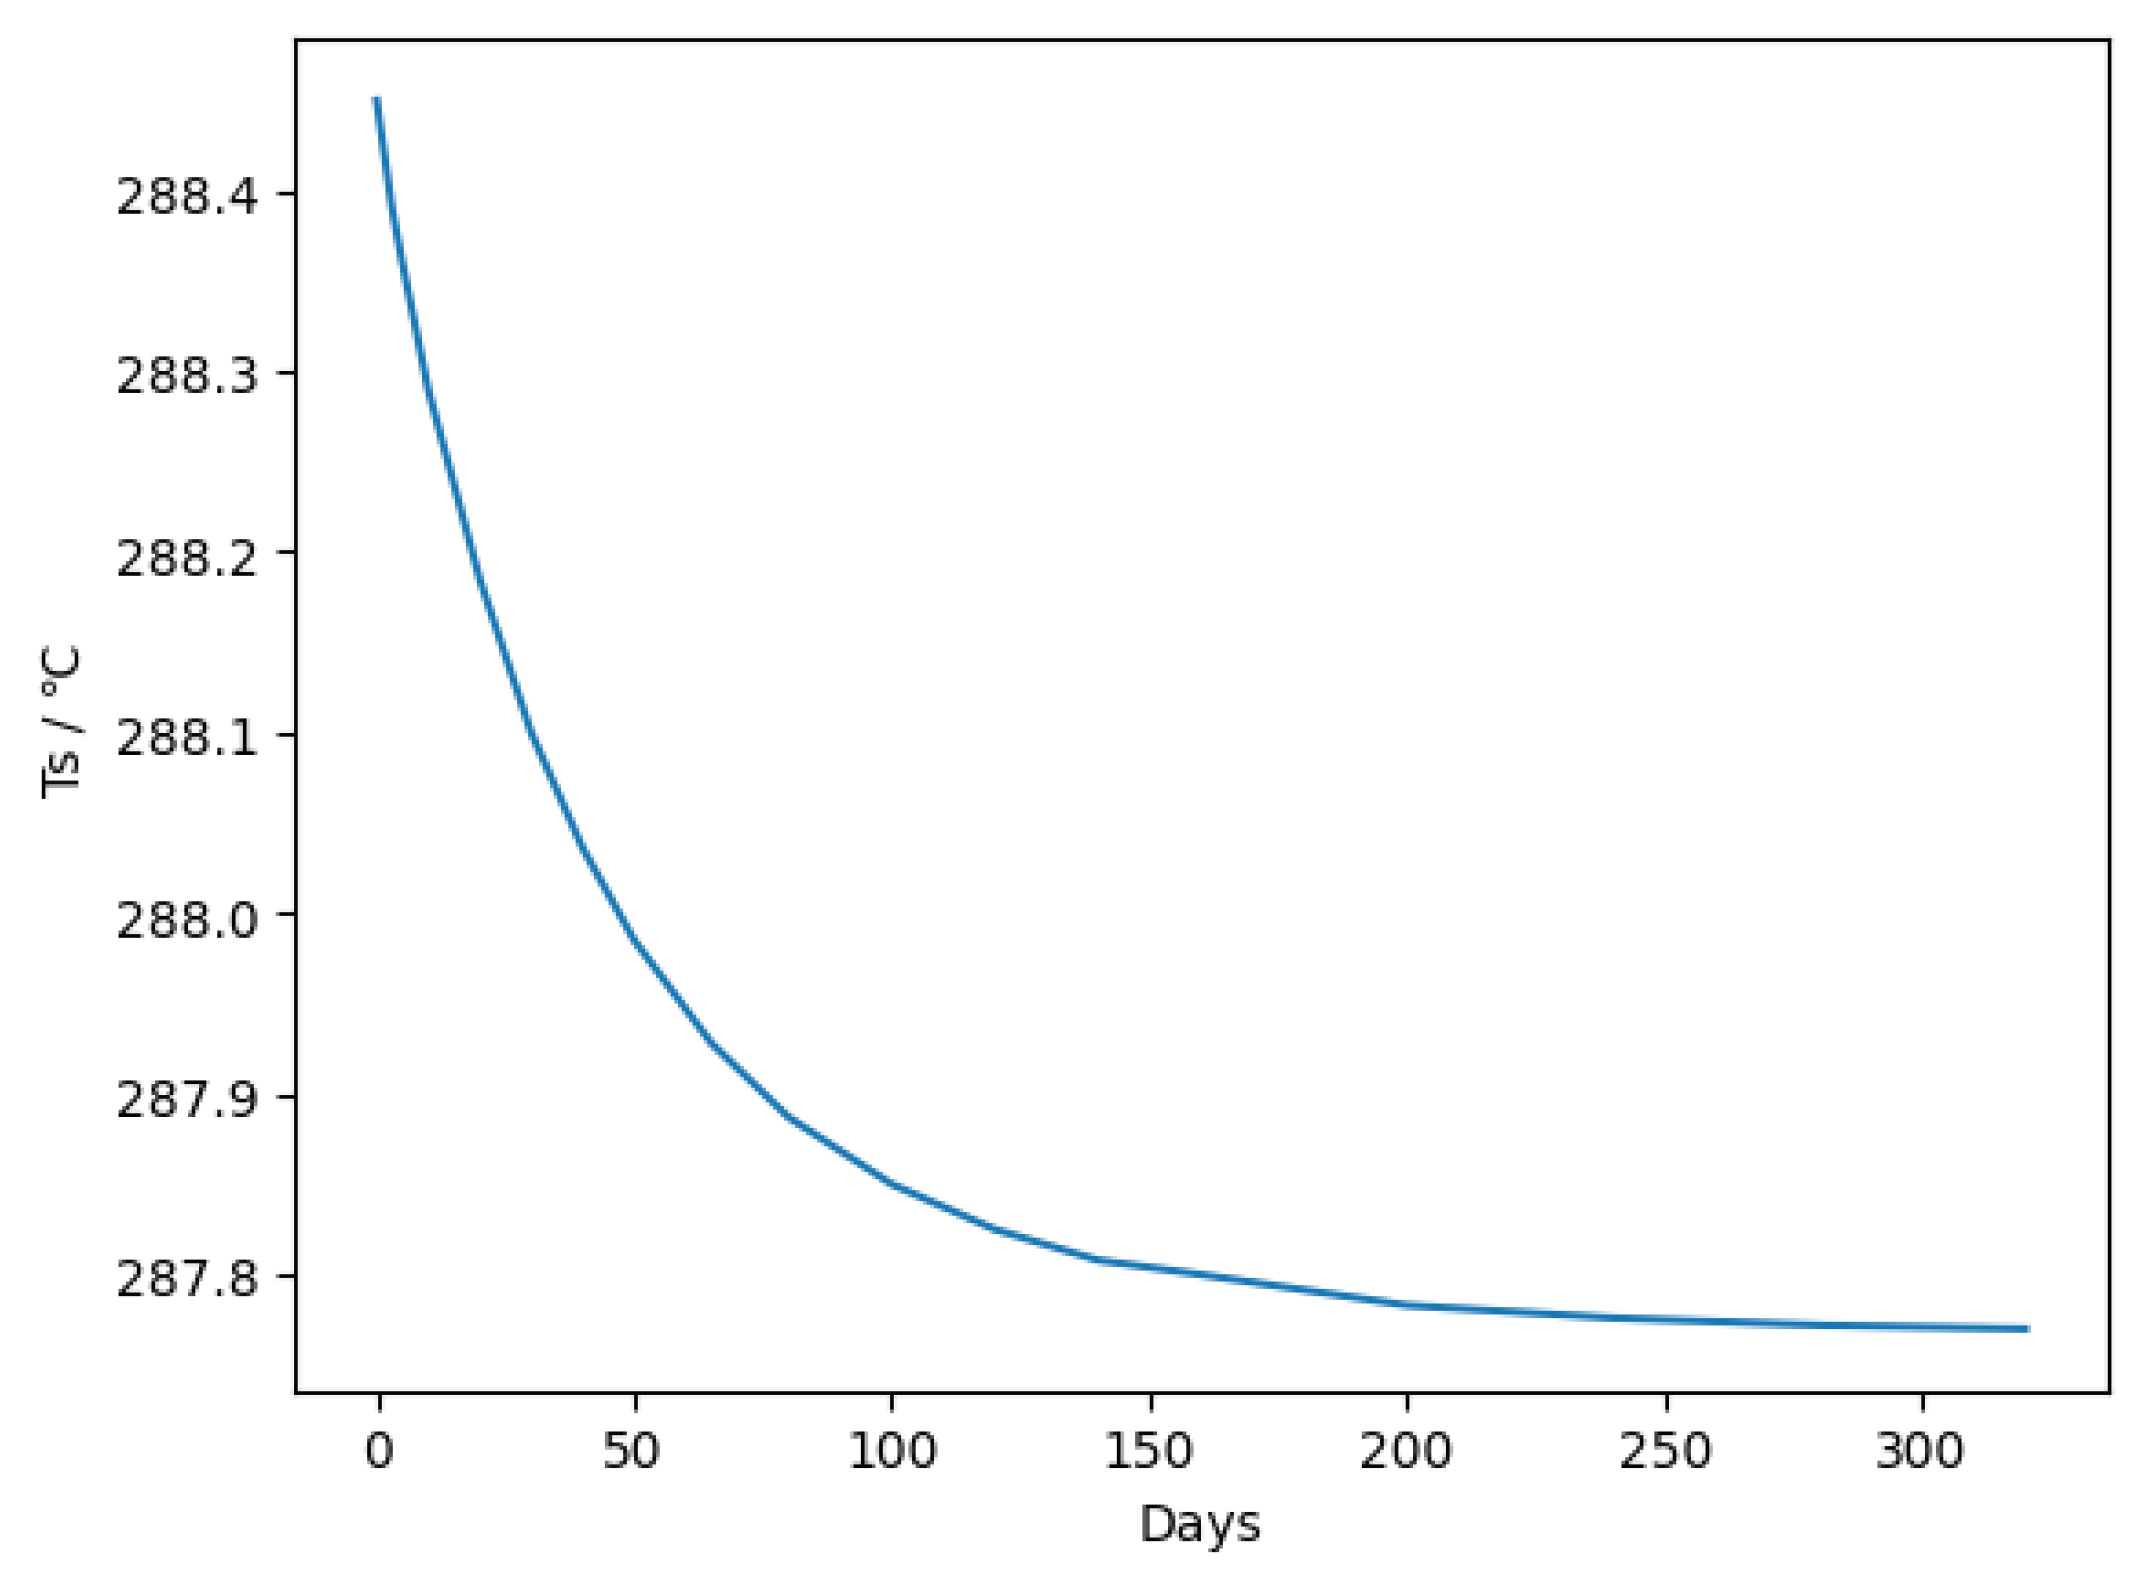
air, and 1e7 as the initial value for nO, and evolving (5) through (7) in time, the respective densities were calculated. The result obtained is shown in
Figure 2.
The O
3 level remained almost unchanged until about 10
4 s, at which point it began to decrease, reaching 2.00e13 at 10
6 s (≈10
1 days). The O concentration changed with the O
3 one. It is considered that it takes about 10
2 days for the O
3 concentration to reach around the original O
3 concentration (3.610e12). This calculation assumes constant solar radiation and other weather conditions. If the time without solar radiation is taken into account, the rate of decrease of O
3 becomes smaller. It is suggested here that in terms of the photochemical reaction factor, the concentration of injected O
3 remains high for about 10
1 to 10
2 days. The data is consistent with the general fact that O
3 produced in the low-latitude stratosphere is transported to the mid- and high-latitudes. In reality, the rate of decrease is larger than in
Figure 2 because the increase in O
3 causes stratospheric temperature to rise.
3.4. Injected O3 Diffusion/Transport and Remarks
I discuss the diffusion/transport of O
3 which is injected. The way of spread/concentration change of O
3 after injection will depend on the location, the season/time, etc. of injection. For example, considering 30 km above Japan, the main driving force for transport is considered to be the east-west wind (typically several m/s to a dozen of m/s) [
10], and it is inferred that the transport is mainly in the east-west direction. The winds in the north-south direction are typically < a few m/s [
11] and are smaller than those in the east-west direction. Certainly, the vertical diffusion/transport has only a small influence, as the eddy diffusion coefficient is about 10
4 cm
2/s. Considering that the easterly wind speed is several m/s to a dozen of m/s, i.e., ~1000 km/day, the factor of concentration change due to diffusion/transport is presumed to be dominant rather than concentration change (decrease) due to (photo)chemical reaction as described in the previous chapter.
If the O3 transport speed (wind speed of the east-west wind) is large, such as 1000 km/day, it may be difficult to perform the intended O3 application. However, there are periods having < a few m/s among a year, for example, it is small in May every year. Considering the fact that it takes about one month for the surface temperature to decrease after an increase in O3, it may be possible to plan for injection during this period to suppress high temperatures in summer.
Finally, I describe some of the issues involved in the application of the present method. The surface temperature calculations in this report are one-dimensional (vertical) radiative-convective equilibrium temperature calculations, i.e., they are simulation results for a single (average) location on the earth. More sophisticated computational (climate) models are needed. Based on detailed meteorological data for each region of the earth, advanced computational (climate) models must be engaged on a region-by-region and global basis. Although I employed a simple Chapman model above, it is also necessary to consider more detailed atmospheric chemical reaction processes; how the injected O3 traces reaction paths with the atmosphere. In addition, stratospheric temperatures will increase, and the influences of this on the climate must also be investigated. The injected O3 will decrease in concentration and return to its natural concentration through chemical reactions and diffusion/transport, but depending on the scale and method of application, it may enter the troposphere. The O3 reaching the troposphere will cause an increase in surface temperature. Countermeasures need to be taken to address this issue. It is known that there are natural ozone exchange processes between the troposphere and the stratosphere such as stratosphere-troposphere exchange (STE) and deep convective storms. Although these are processes which occur at specific regions of the earth, close investigations about these processes will be required and instructive for the present study.
The O3 injection location/area and amount/method should be determined after considering and predicting O3 diffusion/transport according to the degree of surface temperature reduction, timing and duration, and size of the surface area which are designed. This may be very difficult with the current forecasting and observation technology. In all aspects, predicting the diffusion/transport process of O3 to be injected is an essential primary task. Consideration of the cost of implementation is also necessary.


