
Preprint
Article
Analysis of Deterioration Characteristics of Service Aged XLPE Cables according to Installation Location of Combined Heat and Power Plant
This version is not peer-reviewed.


Submitted:
14 March 2024
Posted:
14 March 2024
You are already at the latest version
A peer-reviewed article of this preprint also exists.
Abstract
The number of XLPE cables being used near or beyond their designed lifespan is increasing. The importance of timely cable replacement is increasing. Therefore, research is actively being conducted using VLF Tan δ diagnostic technology to assess the insulation condition of cables. There is a lack of studies measuring and analyzing VLF Tan δ of service aged XLPE cables. Additionally, there is a lack of research considering the operating environment. Therefore, research is needed to diagnose and analyze the insulation condition of the same serviced aged cable when it is operated in a different environment. This paper evaluates and analyzes the insulation condition of cables installed in the BFP, cooling tower, and deaerator booster pump of a combined heat and power plant. Each cable was analyzed by measuring VLF Tan δ, dielectric breakdown test of the cable, and tensile strength, elongation at break, crystallinity, and dielectric strength of XLPE specimens. Additionally, the correlation between VLF Tan δ and other characteristics was also analyzed. It was found that degradation progressed in the order of BFP, cooling tower, and deaerator booster pump. Therefore, it was confirmed that even for the same cable, deterioration varies depending on the installation location.
Keywords:
service aged XLPE cable
; VLF Tan δ
; dielectric breakdown
; insulation diagnosis
; BFP
; cooling tower
; deaerator booster pump
1. Introduction
Oil-filled (OF) cables, once widely utilized, have been gradually replaced by Cross-Linked Polyethylene (XLPE) cables due to the fire risks and environmental pollution problems associated with the use of insulating oil. XLPE cables offer superior insulation properties, less environmental impact, and easier installation and maintenance. Though designed to last more than 30 years, XLPE cables frequently operate near or past their expected lifespan. This indicates the high durability and reliability of XLPE cables, but it also emphasizes the increasing importance of diagnosing the insulation condition of aged cables and determining the appropriate time for their replacement [1,2,3,4].
As the importance of XLPE cables for transmission and distribution grows, active research is being pursued to dielectric diagnose and estimate their lifespan. In particular, research is underway to develop lifespan estimation models, such as the Health Index, aimed at quantitatively assessing the remaining lifespan of cables [5,6]. While significant progress has been made in the research of transmission cables, studies on distribution cables face challenges due to the lack of data related to their operational history [7].
Cable degradation is caused by electrical, thermal, chemical, and environmental stresses on the insulation [2,8,9]. Therefore, diagnostic techniques are required to accurately diagnose changes in the insulation condition and estimate the remaining life of the cable. According to IEEE Std. 400, VLF (Very Low Frequency) tan δ diagnostic technique is a useful non-destructive method for assessing the insulation condition of cables [10]. By measuring the loss factor of the cable insulation using low frequencies, it is possible to diagnose the insulation condition [11]. Moreover, diagnostics can be performed online monitoring, allowing for the evaluation of insulation condition without interrupting the operation of the cable [12]. Therefore, research is being conducted to measure and analyze VLF tan δ for the insulation diagnosis of cables. A high tan δ indicates a deterioration in insulation performance or the possibility of moisture intrusion within the insulator. Thus, research is also underway to identify the degradation of mechanical, chemical, and electrical properties according to VLF tan δ, thereby associating these findings with the properties of XLPE insulators [13,14,15].
Due to the difficulty in obtaining operation cables, VLF tan δ analysis studies with accelerated degradation are being performed [16,17,18]. Since these experiments are conducted in a laboratory environment, it is challenging to reflect the actual operating conditions. Additionally, predicting long-term performance from short-term experiments faces significant limitations. Therefore, it is difficult for the experimental results to accurately forecast the lifespan of cables in actual application environments. Research is also underway to analyze the changes in VLF tan δ according to the operating period. However, insulation diagnostic research through VLF tan δ measurements is insufficient in cases where XLPE cables are near the end of their lifespan or when the same cables are operated in different environmental conditions. Therefore, research considering the operating environment and operating period of the cable is necessary.
In this paper, XLPE cables manufactured in 1991 and operated in a combined heat and power plant were analyzed for changes in insulation condition depending on the installation location. The installation locations of the XLPE cables are the boiler feedwater pump (BFP), deaerator booster pump, and cooling tower. The evaluation of insulation condition involves the analysis of Tan δ, breakdown voltage of XLPE cables, as well as the tensile strength, degree of crystallinity, and breakdown voltage of the specimens. By comparing the correlation between Tan δ and property evaluation according to the installation location, changes in insulation characteristics of the same cable were analyzed depending on the operating environment. In order to perform a reliable insulation diagnosis, even old cables must be diagnosed taking into account the operating environment.
2. Cable and Specimen Preparation
Approximately 110 meters of 6.6 kV XLPE cable, manufactured by Taihan in 1991 and operated in a combined heat and power plant, was secured. The XLPE cable had been in service for about 31 years, and the installation locations were the BFP, deaerator booster pump, and cooling tower. Table 1 shows sample names of cables.
The combined heat and power plant is shown in Figure 1. The BFP is one of the important auxiliary devices because it supplies feedwater to the boiler [19]. Fundamentally, it transports hot water from the BFP to the boiler, creating steam that then powers the turbine. Consequently, it is exposed to environments of high temperature, high pressure, and steam. The deaerator booster pump ensures the quality of feedwater by removing oxygen and other non-condensable gases before supplying it to the boiler [20]. If the supplied feedwater contains oxygen or other gases, it can cause corrosion of the metals in the boiler and turbine. Cooling tower cools the steam used to rotate the steam turbines, condensing it back into water, and then recirculates it to the boiler. During the process of condensing high-temperature steam into water, a significant amount of water vapor is released, exposing the cooling tower to a continuous steam environment [21].
After measuring Tan δ and conducting dielectric breakdown evaluations of XLPE cables, specimens were processed into ribbon-shaped tape samples from the XLPE insulation layer for the measurement of mechanical, chemical, and electrical evaluations, as illustrated in Figure 2. The size of the specimen is 100mm x 100mm, and the thickness is 80±10 [㎛].
3. Experiment Setup
3.1. VLF Tan δ Measurement
The VLF tan δ measurement system consists of a measurement controller, PD Filter, divider, corona ball, and 6m XLPE cable. A 0.1 Hz AC power source was used, and the applied voltage levels were selected as 0.5 U0, 1.0 U0, and 1.5 U0 based on IEEE Std. 400. U0 is phase to ground. The laboratory temperature was maintained at room temperature, and the XLPE cable to be measured was also stored in the laboratory.
The selected voltages were applied to conduct Tan δ measurements on the XLPE cable. After measuring 10 times at 0.5 U0, the voltage was increased to 1.0 U0, and measurements were taken another 10 times. Subsequently, measurements were conducted using the same method at 1.5 U0. Upon completion of the measurements, the 10 data obtained at each voltage level were averaged to derive mean values.
3.2. Dielectric Breakdown Test of XLPE Cable
After the VLF Tan δ measurement was completed, dielectric breakdown test of the XLPE cable was performed. The experimental setup consists of a 150 kV AC voltage source and 6m XLPE cable as shown in Figure 3. The voltage was gradually increased to 50% of the anticipated breakdown voltage and then applied for 10 minutes. If dielectric breakdown did not occur, the voltage was raised to 10 kV and continued for 10 minutes. This process was repeated until dielectric breakdown occurred. When dielectric breakdown occurred, the location of the XLPE cable breakdown was confirmed as shown in Figure 4. If dielectric breakdown occurred in the XLPE insulation as depicted in Figure 4a, the cable was replaced with another XLPE cable. Cutting the section with dielectric breakdown and terminating the XLPE cable results in a shortened length, preventing further experimentation. However, if dielectric breakdown occurred at the semi-conductor layer-XLPE interface, as shown in Figure 4b, the cable was cut and terminations were made to facilitate additional re-experimentation.
3.3. Mechanical Evaluation
Upon completion of the dielectric breakdown experiment on the XLPE cable, the cable was cut and processed into ribbon-shaped tape samples. According to IEC 60811-1, the thickness of the specimens must be selected between 0.8 mm and 2.0 mm. Therefore, after verifying the thickness of the prepared specimens, dumbbell-shaped samples were fabricated as illustrated in Figure 5. Before measuring mechanical evaluations, it is necessary to measure the average thickness of the prepared dumbbell specimens to ensure reliable analysis results. The thickness at both ends and the center of the 4mm wide section was measured, and the average of these measurements was defined as the thickness of the dumbbell specimen. Afterwards, the tensile strength and elongation at break were measured using a tensile tester. The tests were conducted at room temperature with an elongation rate of 250mm/min. Tensile strength and elongation at break were determined based on the average of three tests conducted using the same method.
3.4. XRD Evaluation
X-ray diffraction (XRD) is a technique used to analyzing crystal structures. Measurements were conducted by irradiating X-rays onto XLPE specimens to analyze the crystal structure based on the installation location of XLPE cable. The specimen was manufactured with a size of 10 mm x 10 mm, and a D8 ADVANCE XRD was used. The X-rays are Cu-Ka, and the Bragg angle interval is scanned from 15° to 35° at a rate of 1°/min.
3.5. Dielectric Breakdown Test of XLPE Specimens
When performing a dielectric breakdown test on a 6m XLPE cable, it is possible to measure only one breakdown voltage. Therefore, a specimen was produced to reduce deviation through repeated experiments. The experimental setup consists of a 150 kV AC voltage source, a water tank, mineral oil, XLPE specimen, jigs, and epoxy molding electrodes, as shown in Figure 6. Mineral oil was used to prevent surface discharge of the XLPE specimen. Mineral oil was used to prevent surface discharge of the XLPE specimen. The jigs and epoxy molding electrodes are as shown in Figure 7. The applied electrode was made of a 10mm diameter sphere electrode molded with epoxy. This design minimizes surface discharge and ensures that dielectric breakdown occurs at the shortest distance between electrodes, enhancing the reliability of the dielectric breakdown test.
The specimen’s dimensions were 50mm x 50mm, and its thickness was determined by averaging four measurements taken around the point where dielectric breakdown occurred. Voltage was applied up to 50% of the expected breakdown voltage. Afterwards, the voltage was increased to 1 kV and applied for 10 seconds. If dielectric breakdown did not occur, the process of applying voltage was repeated by increasing 1 kV and holding for 10 seconds each time. The dielectric breakdown test was measured a total of 10 times, and the average value of 8 tests excluding the maximum and minimum values was selected as the breakdown voltage.
4. Results and Discussion
4.1. VLF Tan δ
The VLF Tan δ of the XLPE cables installed in the combined heat and power plant was measured, as shown in Table 2 and Figure 8. When comparing the BFP, deaerator booster pump, and cooling tower, it was observed that the Tan δ deviation of the BFP was significantly large. The cooling tower also showed deviation, and the deviation of the deaerator booster pump was the smallest. It was observed that the Tan δ of the XLPE cable installed in the BFP increases linearly as U0 increases. The rise in Tan δ with the increment in U0 signifies an increase in losses within the insulator. The DTD (1.5 U0 – 0.5 U0) was also calculated to determine whether the high Tan δ is due to insulation degradation. If DTD is low while both 0.5 U0 and 1.5 U0 are high, it is due to environmental effects. Upon comparing the 1.0 U0 and DTD values, it appears that insulation degradation is more likely than environmental effects. The Tan δ of the XLPE cable installed in the deaerator booster pump is as shown in Figure 8b. Unlike the BFP, the graph for the deaerator booster pump showed a larger increase in Tan δ when the voltage was raised from 1.0U0 to 1.5U0. Since the DTD value was also high, it is confirmed that the cable is undergoing degradation. Deaerator-6 was identified as the XLPE cable installed in the deaerator booster pump that has experienced the most significant degradation. However, it is similar to the Tan δ of the cable with the best insulation condition in the BFP. Figure 8c shows the Tan δ of the XLPE cable installed in the cooling tower. Unlike the cables installed in the BFP and deaerator booster pump, the Tan δ is distributed with a consistent deviation. For the cooling tower cable as well, the increase in Tan δ was larger when the voltage was raised from 1.0U0 to 1.5U0. Since the DTD value is also high, it indicates that the cable has undergone degradation.
4.2. Dielectric Breakdown Test of XLPE Cable
Table 3 is the breakdown voltage of XLPE cable according to installation location. If dielectric breakdown occurred at the semi-conductor layer-XLPE interface or flashover in the cable, additional experiments were conducted. Because dielectric breakdown occurred at the interface of BFP-3, the measurement was performed again after the cable was terminated. The lowest breakdown voltage of the XLPE cable installed in the BFP is 62.8 kV, and the highest voltage is 74.4 kV. There is approximately a 16% deviation in breakdown voltage. For Deaerator-1 and Deaerator-2, dielectric breakdown measurements could not be taken due to the occurrence of flashovers. Deaerator-5 was retested to measure the breakdown voltage after experiencing dielectric breakdown at the interface. When comparing the breakdown voltages measured from Deaerator-3 to Deaerator-6 excluding flashovers, there is approximately a 10% difference. It was confirmed that the breakdown voltage was higher and the deviation was smaller than that of the BFP. C/T-3 experienced dielectric breakdown at the interface twice, so further experiments could not be conducted. This means the cable became too short for additional testing. Comparing the breakdown voltages of the remaining cooling tower cables, there is approximately a 15% deviation. The deviation is similar to that of the BFP. Through this, the breakdown voltage of BFP was the lowest, followed by C/T, and deaerator booster pump was the best.
4.3. Mechanical Evaluation
Figure 9 shows the graph of tensile strength and elongation at break according to installation location. The tensile strength is highest in the cooling tower and lowest in the deaerator booster pump, with approximately a 15% deviation. Excluding the highest and lowest values for comparison, it becomes difficult to distinguish differences in tensile strength according to the installation location. The deviation between the maximum and minimum values of elongation at break is around 4%. Therefore, similar to tensile strength, it is challenging to compare differences in elongation at break according to the installation location.
4.4. Chemical Evaluation
The XRD measurement data of XLPE specimens according to the installation location is as shown in Figure 10. The XRD analysis identified peaks at 21.3° and 23.4°. There was no difference in the peak angles of Intensity according to the installation location. For further analysis, each area is calculated through normal distribution as shown in Figure 10. Afterwards, the crystallinity was calculated using Equation 1.
In equation 1, χ(%) is the crystallinity, Area 1 is amorphous area, Area 2 is the area of first peak and Area 3 is the area of the second peak.
The derived crystallinity is shown in Figure 11. When analyzing the crystallinity according to the installation location, the BFP and cooling tower were similar. The difference between the highest and lowest values of crystallinity at each installation location was the largest for the cooling tower and BFP. However, excluding the highest and lowest values, the greatest deviation was observed in the BFP. This confirms that there is a significant variation in degradation. The crystallinity was highest for the XLPE cable installed in the deaerator booster pump. Additionally, the variation in data was relatively low. This means that the deterioration progressed less than in other locations.
4.5. Dielectric Breakdown Test of Specimens
The dielectric strength of the specimens is as shown in Figure 12. The dielectric strength distribution of the XLPE cable specimens installed in the BFP is the lowest. However, it was confirmed that the variation in dielectric strength was the largest. The dielectric strength of the specimens in the cooling tower was similar to that of the BFP, but slightly higher. The variation in dielectric strength was also similar to that of the BFP, but the deviation in the data, excluding the highest and lowest voltages, was the smallest. Deaerator booster pump shows the highest dielectric strength distribution, with about 10% higher insulation performance.
4.6. Correlation with VLF Tan δ
The correlation between VLF Tan δ and the dielectric breakdown of the cable is shown in Figure 13a, and the correlation between VLF Tan δ and the characteristic evaluation of the specimen is shown in Figure 13b–e. In Figure 13a, data for Deaerator-1, Deaerator-2, and C/T-3 were excluded. The Tan δ values for the excluded data are 0.23, 0.31, and 0.7 based on 1.0 U0. The reason for exclusion is that during the cable dielectric breakdown test, flashovers occurred, or dielectric breakdown happened at the interface between the semi-conductor layer and the XLPE insulator. It was observed that as Tan δ increases, the breakdown voltage of the cable decreases. The highest breakdown voltage was 79.2 kV, and the lowest voltage was 62.8, a decrease of about 20%. Tan δ at each voltage is 0.18 and 14.5. If the Tan δ data are distributed between 0.183 and 1.74, the breakdown voltages range from 72.8 to 79.2 [kV]. For Tan δ values within the range of 2.75 to 5.7, the breakdown voltages were measured between 67.8 and 72.8 [kV]. The remaining Tan δ is 14.5~18.2, and the breakdown voltage is 62.8~69.5 [kV]. Although repeated dielectric breakdown tests could not be performed due to the insufficient number of cables with high Tan δ, it was possible to observe the distribution of dielectric breakdown voltage according to Tan δ. This confirmed that there is a correlation between Tan δ and the breakdown voltage of the cable.
The tensile strength and elongation at break according to Tan δ are as shown in Figures 13b,c. Even as Tan δ increases, the tensile strength and elongation at break show a consistent distribution. The tensile strength was mostly measured around 3.0 to 3.2 [kgf/mm2]. The elongation at break is also distributed between approximately 568% to 580%, but unlike tensile strength, it ranges from about 568 to 572% as Tan δ increases. Therefore, the elongation at break showed a tendency to decrease as Tan δ increased. However, it was found that Tan δ has a minor correlation with both tensile strength and elongation at break.
The crystallinity according to Tan δ is as shown in Figure 13d. When Tan δ is below 2, the crystallinity is distributed around 31 to 33%. However, a crystallinity of approximately 31 to 32% was derived when Tan δ ranges from 2 to 6. If Tan δ was 14 to 18, the crystallinity was calculated to be around 30 to 31%. Among the 18 Tan δ values, 11 are distributed within values below 2. Although the number of crystallinity measurements at higher Tan δ values is limited, it was observed that as Tan δ increases, there is a trend of decreasing crystallinity.
The dielectric strength graph of the specimens is as shown in Figure 13e. As Tan δ increased, the dielectric strength of the specimen decreased. When Tan δ is low, the dielectric strength of the specimens was distributed between approximately 63 to 73 [kV/mm], but as Tan δ increases, it was measured between 59 to 62 [kV/mm]. When Tan δ is 0.23 and 18.21, the dielectric strengths are 72.9 and 59.6 [kV/mm], respectively, showing a difference in dielectric strength of approximately 19%. Through this, it was confirmed that there is a correlation between Tan δ and the dielectric strength of the specimen.
4.7. Discussion
The VLF Tan δ measurements, dielectric breakdown tests, and mechanical and chemical analyses of XLPE cables installed in the BFP, deaerator booster pump and Cooling tower of a combined heat and power plant demonstrated that even identical cables can exhibit different outcomes depending on their installation location. The VLF Tan δ measurements and the dielectric breakdown tests of the cables and specimens showed differences in insulation performance depending on the installation location. As a result, BFP had the largest variation in insulation performance and contained the highest number of degraded cables. Next, the cooling tower deteriorated significantly, and finally, deaerator booster pump had excellent insulation performance. Comparing the installation environments and measurement results, it is inferred that the BFP had more extensive degradation due to a higher number of cables exposed to high temperature, high pressure, and steam environments. The cooling tower, involved in condensing high-temperature steam into water, releases a large amount of steam, leading to the inference that long-term exposure to a steam environment has contributed to its degradation. Unlike the BFP and cooling tower, the deaerator booster pump is not an environment that accelerates cable degradation, hence it is expected to have the least deterioration among the cables. When analyzing VLF Tan δ and the characteristic evaluation of cables and specimens, it was confirmed that there is a correlation between the breakdown voltage of the cable and the dielectric strength of the specimen, and that the crystallinity also decreases. This analysis indicates that electrical and chemical performance begin to deteriorate when Tan δ exceeds 2, based on a 1.0U0. Subsequently, when exceeding 14 of Tan δ, the electrical performance decreased by up to approximately 20% compared to the best values observed. However, several improvements are necessary for reliable diagnostics. BFP and cooling tower have large differences in data, so 6 cables are not enough to evaluate deterioration depending on installation location. More than half of the Tan δ data are below 2, and there are only seven ranging from 2.75 to 18.21. Therefore, the amount of data is insufficient to accurately determine trends when degradation is occurring. Additionally, It was not possible to determine how close the cable was installed to the BFP, cooling tower and deaerator booster pump. Therefore, accurate analysis was difficult due to the existence of deviations in experimental values. It is considered that obtaining more cables and accurately identifying their locations could increase the reliability of the experimental results.
In conclusion, this study has confirmed that even identical cables, when installed and operated in different locations and environments, undergo varying degrees of degradation. This insight can be utilized in diagnosing the insulation of cables that are nearing the end of their designed lifespan.
5. Conclusions
This study evaluated and analyzed the insulation performance of XLPE cables manufactured in 1991, based on their installation locations. The VLF Tan δ, breakdown voltage, tensile strength, elongation at break, and crystallinity of the cable were measured. Through the measured results, the insulation performance according to the installation location was analyzed. Additionally, the correlation between Tan δ and other characteristics was also analyzed. The results of this study are as follows.
- Analyzing the VLF Tan δ of XLPE cables revealed that degradation occurred in the order of BFP, cooling tower and then deaerator booster pump.
- The dielectric breakdown tests of the cables also showed the lowest breakdown in the following order: BFP, cooling tower and then deaerator booster pump.
- It is difficult to analyze the tensile strength and elongation at break characteristics depending on the installation location.
- The crystallinity and the dielectric strength of XLPE specimens make it challenging to analyze differences between the BFP and cooling tower but distinguishing them from the deaerator booster pump is feasible.
- It was found that the cable’s breakdown voltage, the specimen’s crystallinity and the specimen’s dielectric strength decrease as Tan δ increases. However, tensile strength and elongation at break showed less association with Tan δ.
The study confirmed that identical cables can degrade differently depending on their installation location. This indicates that even cables nearing the end of their designed lifespan can represent differences in insulation performance depending on their installation location and environment. Furthermore, by identifying the relationship between Tan δ and breakdown voltage, it’s possible to assess how degradation affects insulation performance. As a result, it can be suggested that comparing electrical properties is more effective for evaluating cable degradation.
Author Contributions
Conceptualization, H.-S.K.; investigation, H.-S.K.; methodology, Jiho.J.; resources, H.-S.K.; formal analysis, Jiho.J.; visualization, Jiho.J.; writing—original draft preparation, H.-S.K.; supervision, B.-W.L.; writing—review and editing, B.-W.L. All authors have read and agreed to the published version of the manuscript.
Funding
This research received no external funding.
Data Availability Statement
Not applicable
Acknowledgments
This work was supported in part by the Korean Institute of Energy Technology Evaluation and Planning (KETEP) and in part by the Ministry of Trade, Industry and Energy (MOTIE) of the Republic of Korea (No. 20217610100050)
This work was supported by Korea Institute of Energy Technology Evaluation and Planning (KETEP) grant funded by the Korea Government (MOTIE) (20224000000160, DC Grid Energy Innovation Research Center).
Conflicts of Interest
The authors declare no conflicts of interest.
References
- Liu, F.; X. Huang.; J. Wang and P. Jiang, Insulation ageing diagnosis of XLPE power cables under service conditions,” 2012 IEEE International Conference on Condition Monitoring and Diagnosis. Indonesia, 2012, pp. 647-650.
- Li, G.; Wang, Z.; Lan, R.; Wei, Y.; Nie, Y.; Li, S.; Lei, Q. The Lifetime Prediction and Insulation Failure Mechanism of XLPE for High-Voltage Cable. IEEE Trans. Dielectr. Electr. Insul. 2023, 30, 761–768, . [CrossRef]
- Morsalin, S.; Phung, B.T. Dielectric response study of service-aged XLPE cable based on polarisation and depolarisation current method. IEEE Trans. Dielectr. Electr. Insul. 2020, 27, 58–66, . [CrossRef]
- Li, C.; Chu, Z.; Zhang, L.; Zhang, J.; Tao, J. Insulation aging diagnosis and defect location of crosslinked polyethylene cable in the distribution network based on radio frequency identification. Mater. Express 2023, 13, 1772–1781, . [CrossRef]
- Zainuddin, N.M.; Kadir, M.Z.A.A.; Ali, N.H.N.; Ali, Z.; Osman, M.; Mansor, M.; Ariffin, A.M.; Rahman, M.S.A.; Nor, S.F.M.; Nasir, N.A.F.M. Review of Thermal Stress and Condition Monitoring Technologies for Overhead Transmission Lines: Issues and Challenges. IEEE Access 2020, 8, 120053–120081, . [CrossRef]
- Somsak, T.; Suwanasri, T.; Suwanasri, C. Lifetime Estimation Based Health Index and Conditional Factor for Underground Cable System. Energies 2021, 14, 8113, . [CrossRef]
- Hamad, A.A.; Ghunem, R.A. A Techno-Economic Framework for Replacing Aged XLPE Cables in the Distribution Network. IEEE Trans. Power Deliv. 2020, 35, 2387–2393, . [CrossRef]
- German-Sobek, M.; R. Cimbala.; J. Király. Change of dielectric parameters of XLPE cable due to thermal aging. Electrotehnica, Electronica, Automatica, 2014, vol. 62.
- Q. Wang et al. Insulation Properties and Degradation Mechanism for XLPE Subjected to Different Aging Periods. in CSEE Journal of Power and Energy Systems, 2023, vol. 9, no. 5, pp. 1959-1967. [CrossRef]
- Bolliger, D. Simultaneous Partial Discharge and Tan Delta Measurements: New Technology in Cable Diagnostics. 2018 IEEE/PES Transmission and Distribution Conference and Exposition (T&D), 2018, USA, pp. 1-5.
- Liu, Y.; Cao, X. Insulation performance evaluation of HV AC/DC XLPE cables by 0.1 Hz tan δ test on circumferentially peeled samples. IEEE Trans. Dielectr. Electr. Insul. 2017, 24, 3941–3950, . [CrossRef]
- Zhu, G.; Zhou, K.; Lu, L.; Li, Y.; Xi, H.; Zeng, Q. Online Monitoring of Power Cables Tangent Delta Based on Low-Frequency Signal Injection Method. IEEE Trans. Instrum. Meas. 2021, 70, 1–8, . [CrossRef]
- Hernandez-Mejia, J.C.; Perkel, J.; Harley, R.; Hampton, N.; Hartlein, R. Correlation between tan δ diagnostic measurements and breakdown performance at VLF for MV XLPE cables. IEEE Trans. Dielectr. Electr. Insul. 2009, 16, 162–170, . [CrossRef]
- Kim, D.; Y. Cho.; S. -m. Kim. A study on three dimensional assessment of the aging condition of polymeric medium voltage cables applying very low frequency (VLF) tan δ diagnostic. in IEEE Transactions on Dielectrics and Electrical Insulation, 2014, vol. 21, no. 3, pp. 940-947. [CrossRef]
- Chakrabarty, C.K.; Avinash, A.; Basri, A.G.A. Development of high frequency Tan Delta measurement method for 132kV transmission underground cables. 2014 IEEE 2nd International Symposium on Telecommunication Technologies (ISTT), 2014, Malaysia, pp. 436-441.
- Arikan, O.; Uydur, C.C.; Kumru, C.F. Prediction of dielectric parameters of an aged mv cable: A comparison of curve fitting, decision tree and artificial neural network methods. Electr. Power Syst. Res. 2022, 208, . [CrossRef]
- Liu, Z.; Hao, J.; Liao, R.; Li, J.; Gao, Z.; Liang, Z. Morphological, Structural, and Dielectric Properties of Thermally Aged AC 500 kV XLPE Submarine Cable Insulation Material and Its Deterioration Condition Assessment. IEEE Access 2019, 7, 165065–165075, . [CrossRef]
- Adeniyi, A. O.; J. J. Walker.; C. Nyamupangedengu. Influence of temperature on tan-delta of XLPE cables. 2019 Southern African Universities Power Engineering Conference/Robotics and Mechatronics/Pattern Recognition Association of South Africa (SAUPEC/RobMech/PRASA), 2019, South Africa, pp. 544-547.
- N. Abraham.; S. Chacko.; S. Sathyan.; K. C. Sreenath.; P. Venugopal. An Assessment of Design parameters and Vibration Characteristics of Boiler feed pump for Auxiliary power consumption. IJIRST–International Journal for Innovative Research in Science & Technology, 2015, vol. 1, no. 11.
- Sharapov, V. I.; Kudryavtseva, E.V. Hydrodynamics and mass transfer deaeration of water on thermal power plants when used natural gas as a desorbing agent. J. Physics: Conf. Ser. 2017, 891, 012102, . [CrossRef]
- Holmberg, H.; Ahtila, P. The thermal analysis of a combined heat and power plant undergoing Clausius–Rankine cycle based on the theory of effective heat-absorbing and heat-emitting temperatures. Appl. Therm. Eng. 2014, 70, 977–987, . [CrossRef]
Figure 1.
Location of cables installed in combined heat and power plant.
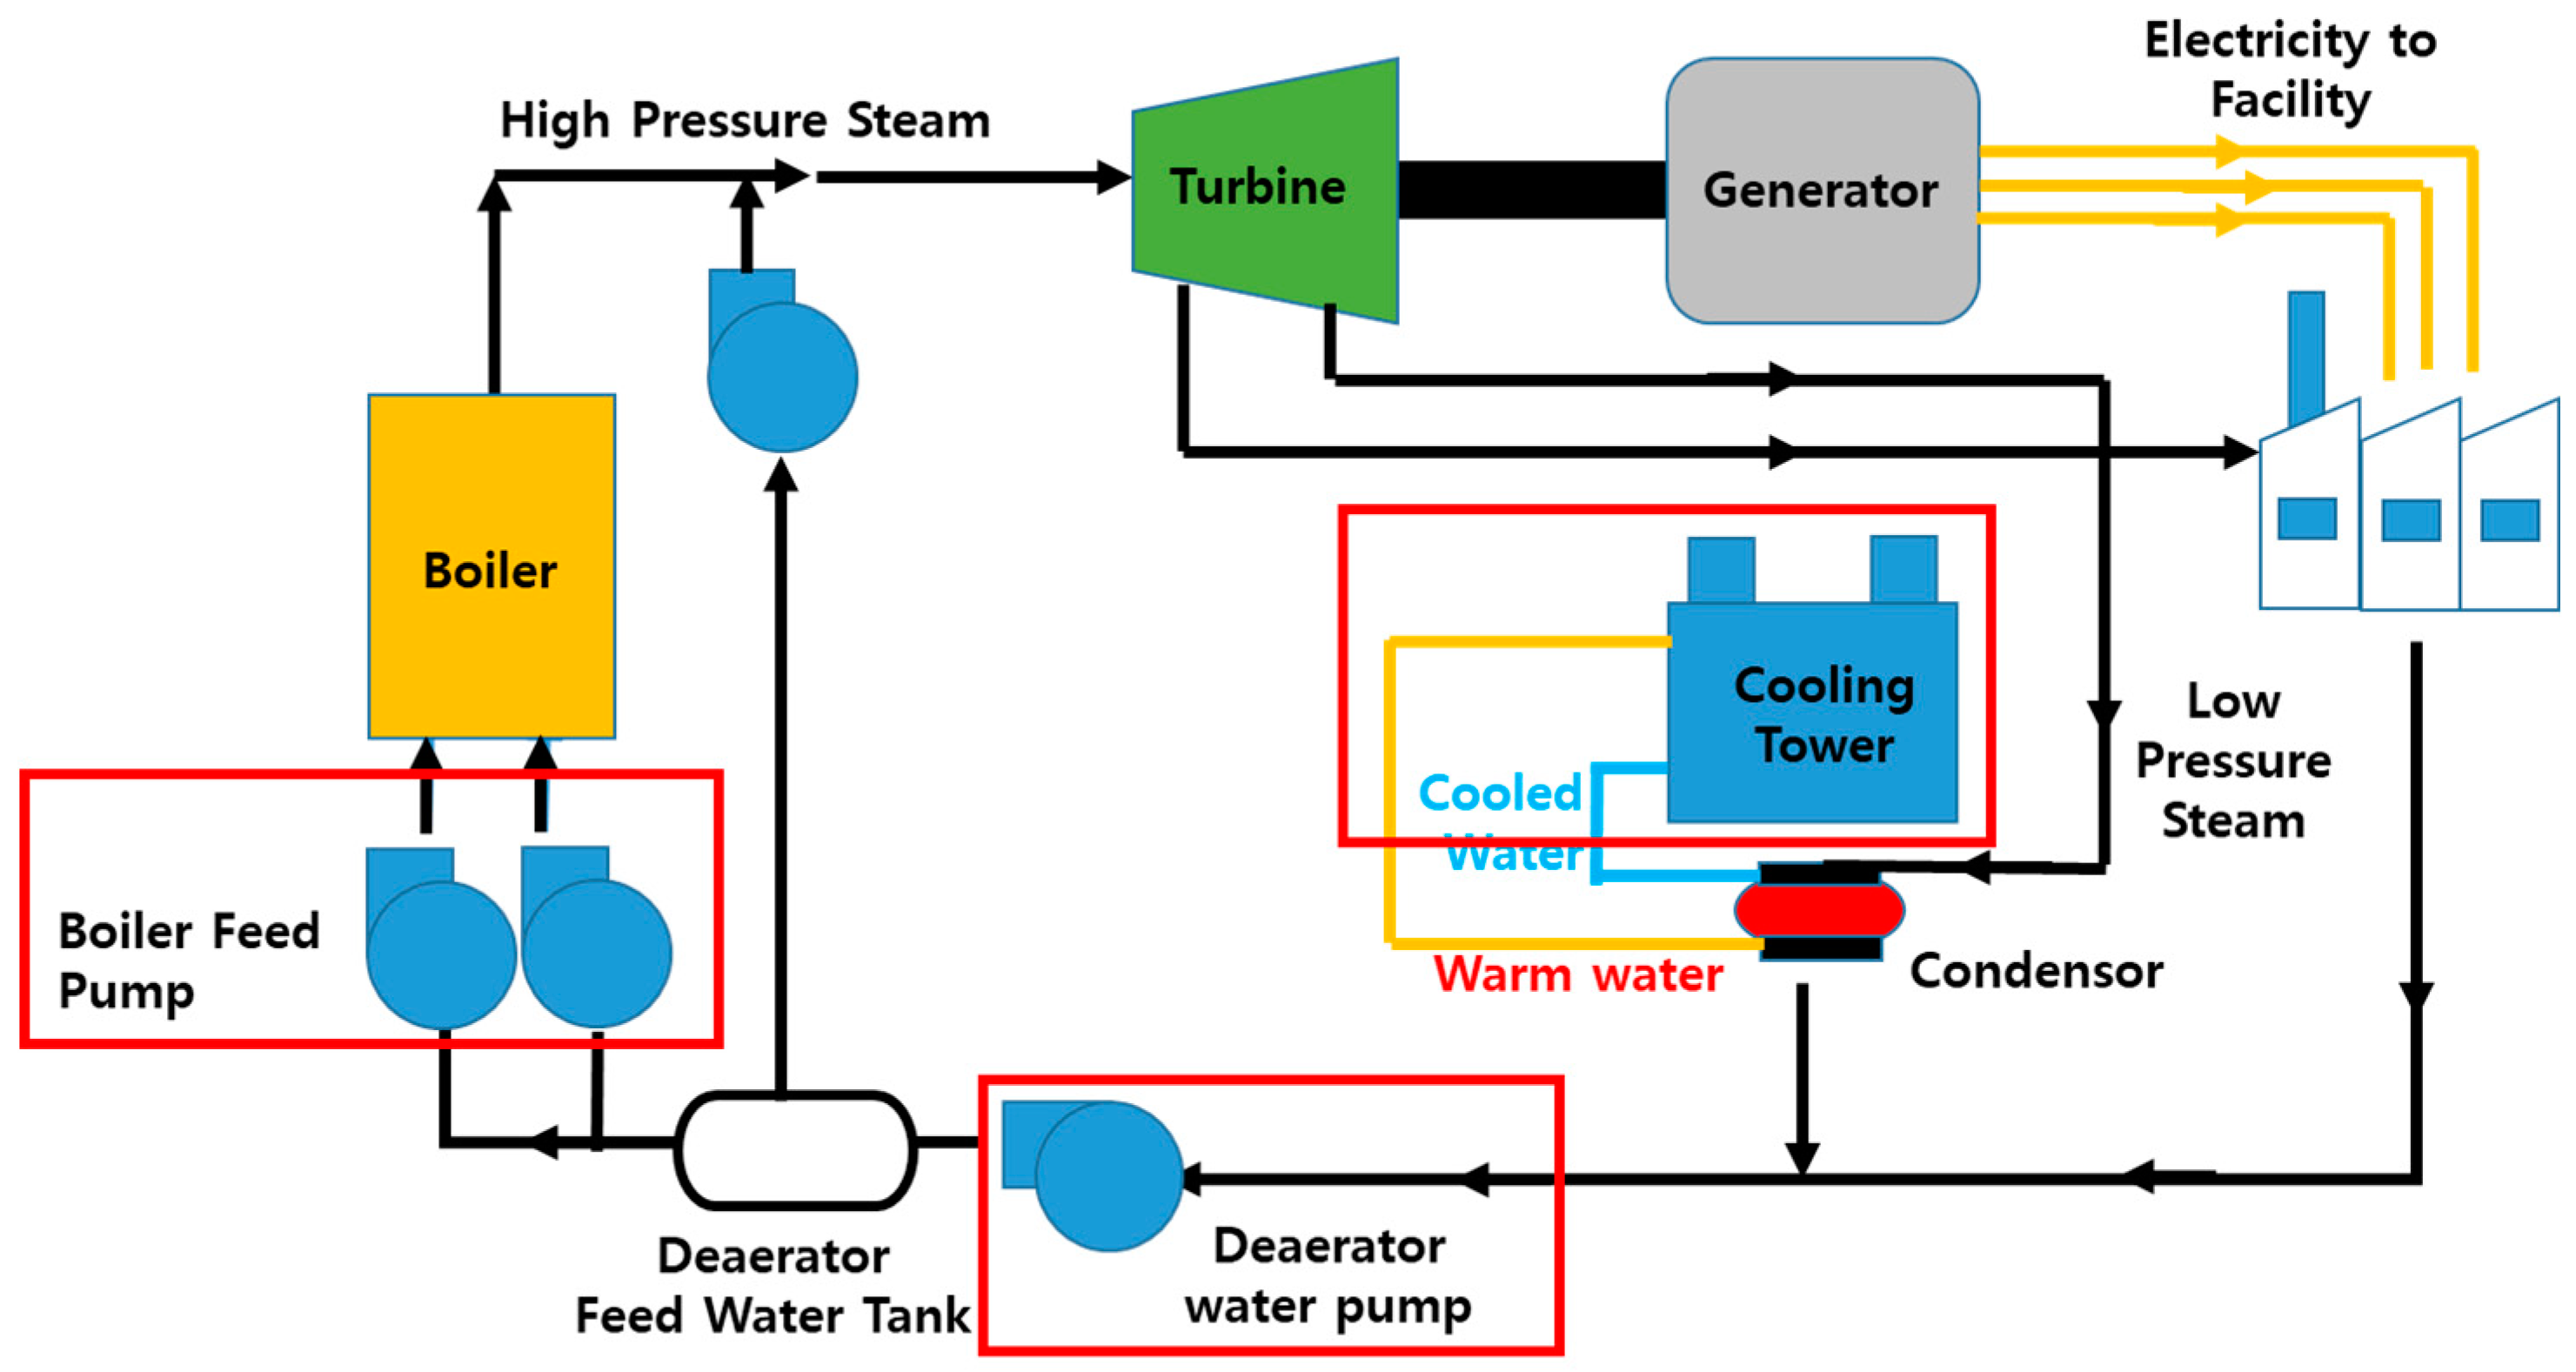
Figure 2.
Peeling of 10 cm wide XLPE specimens.
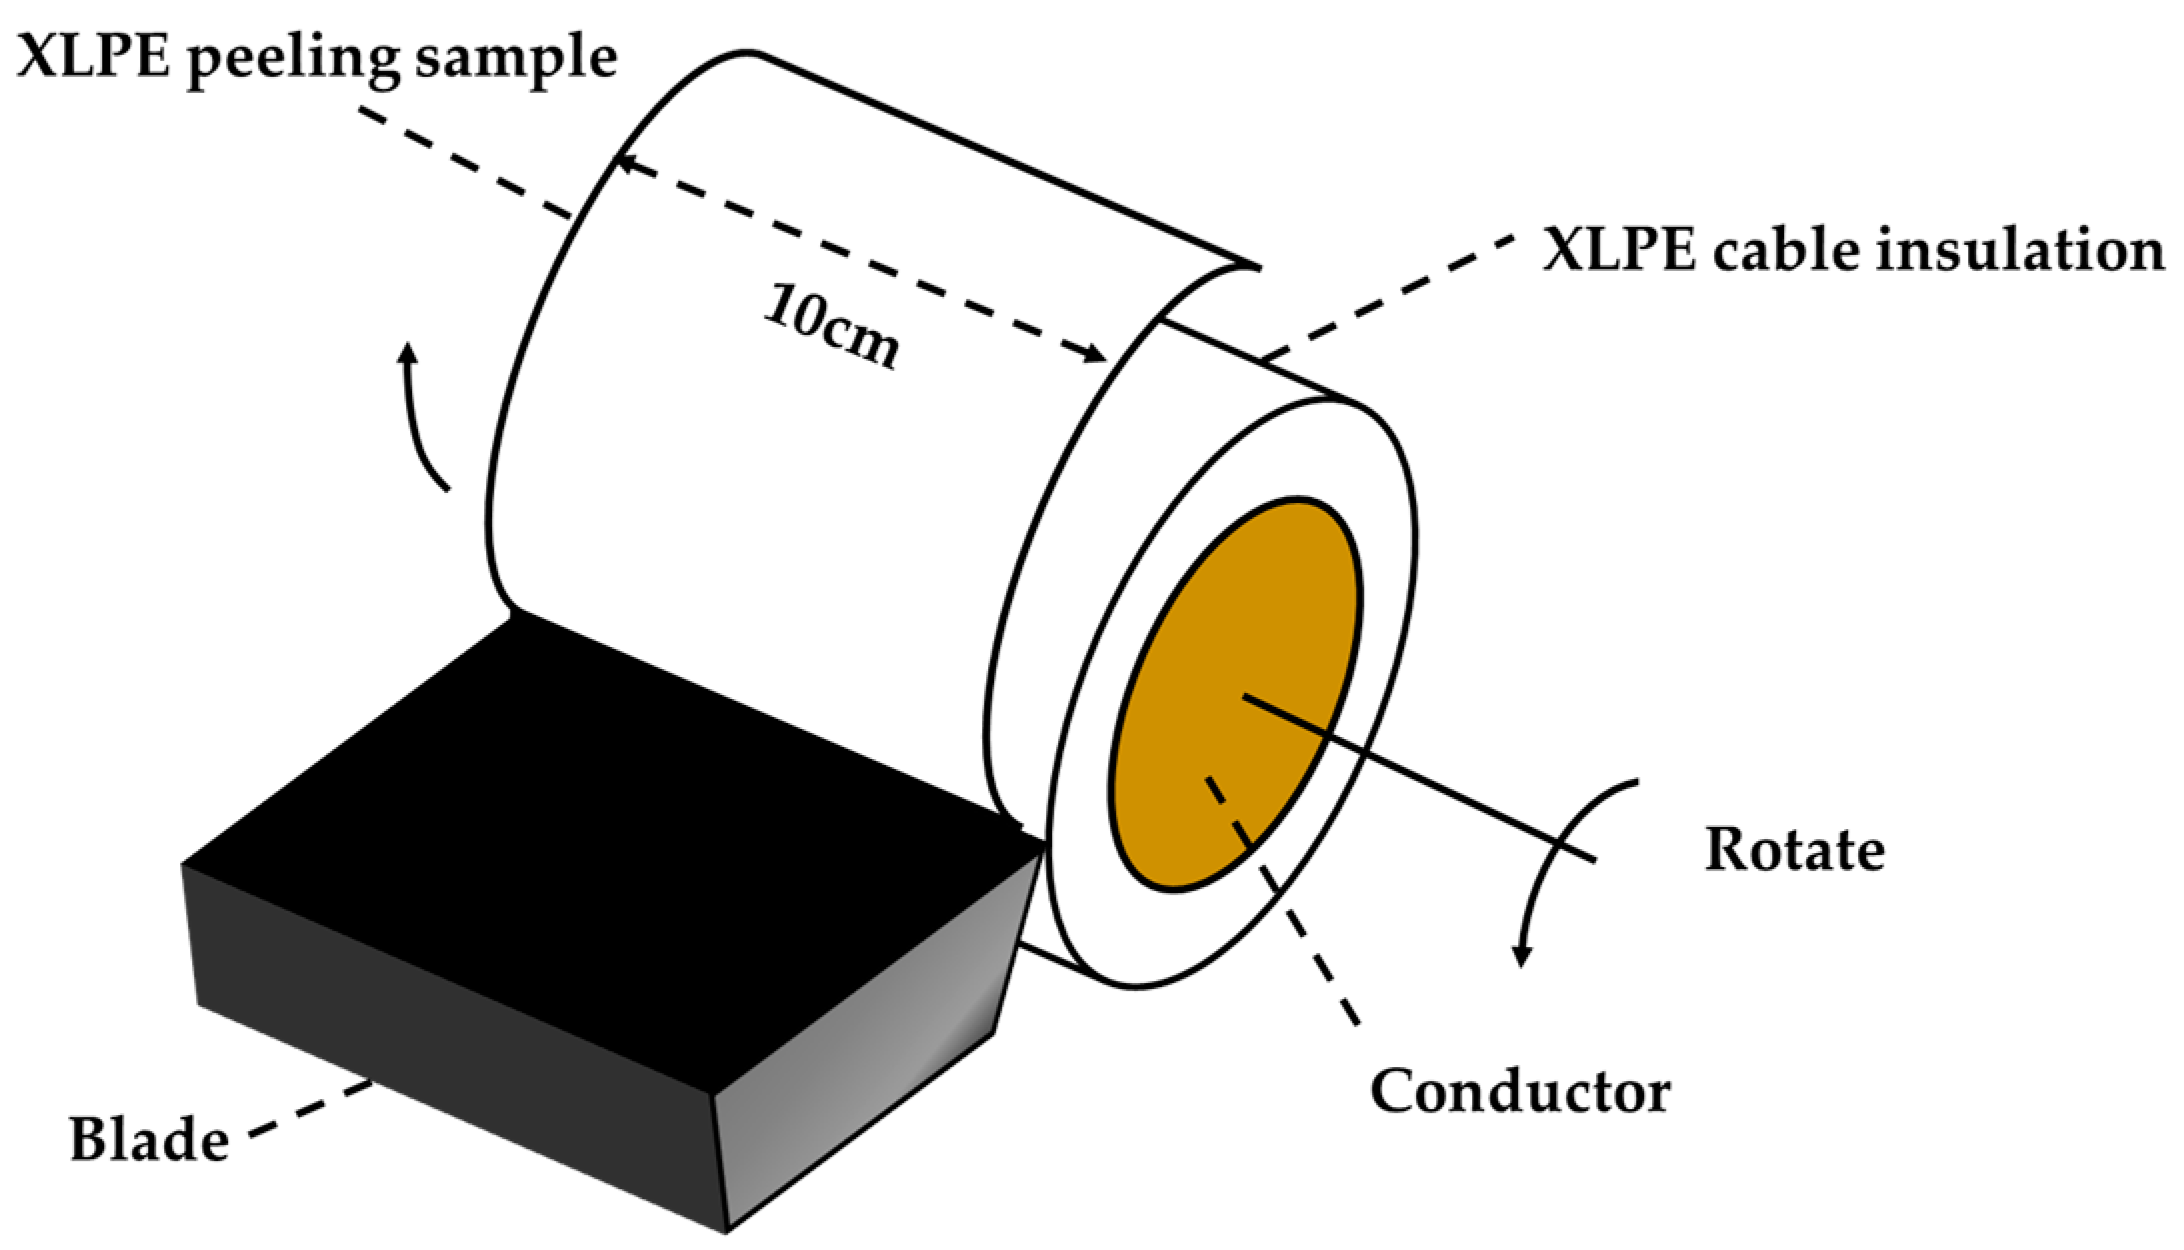
Figure 3.
Schematic diagram of cable dielectric breakdown.
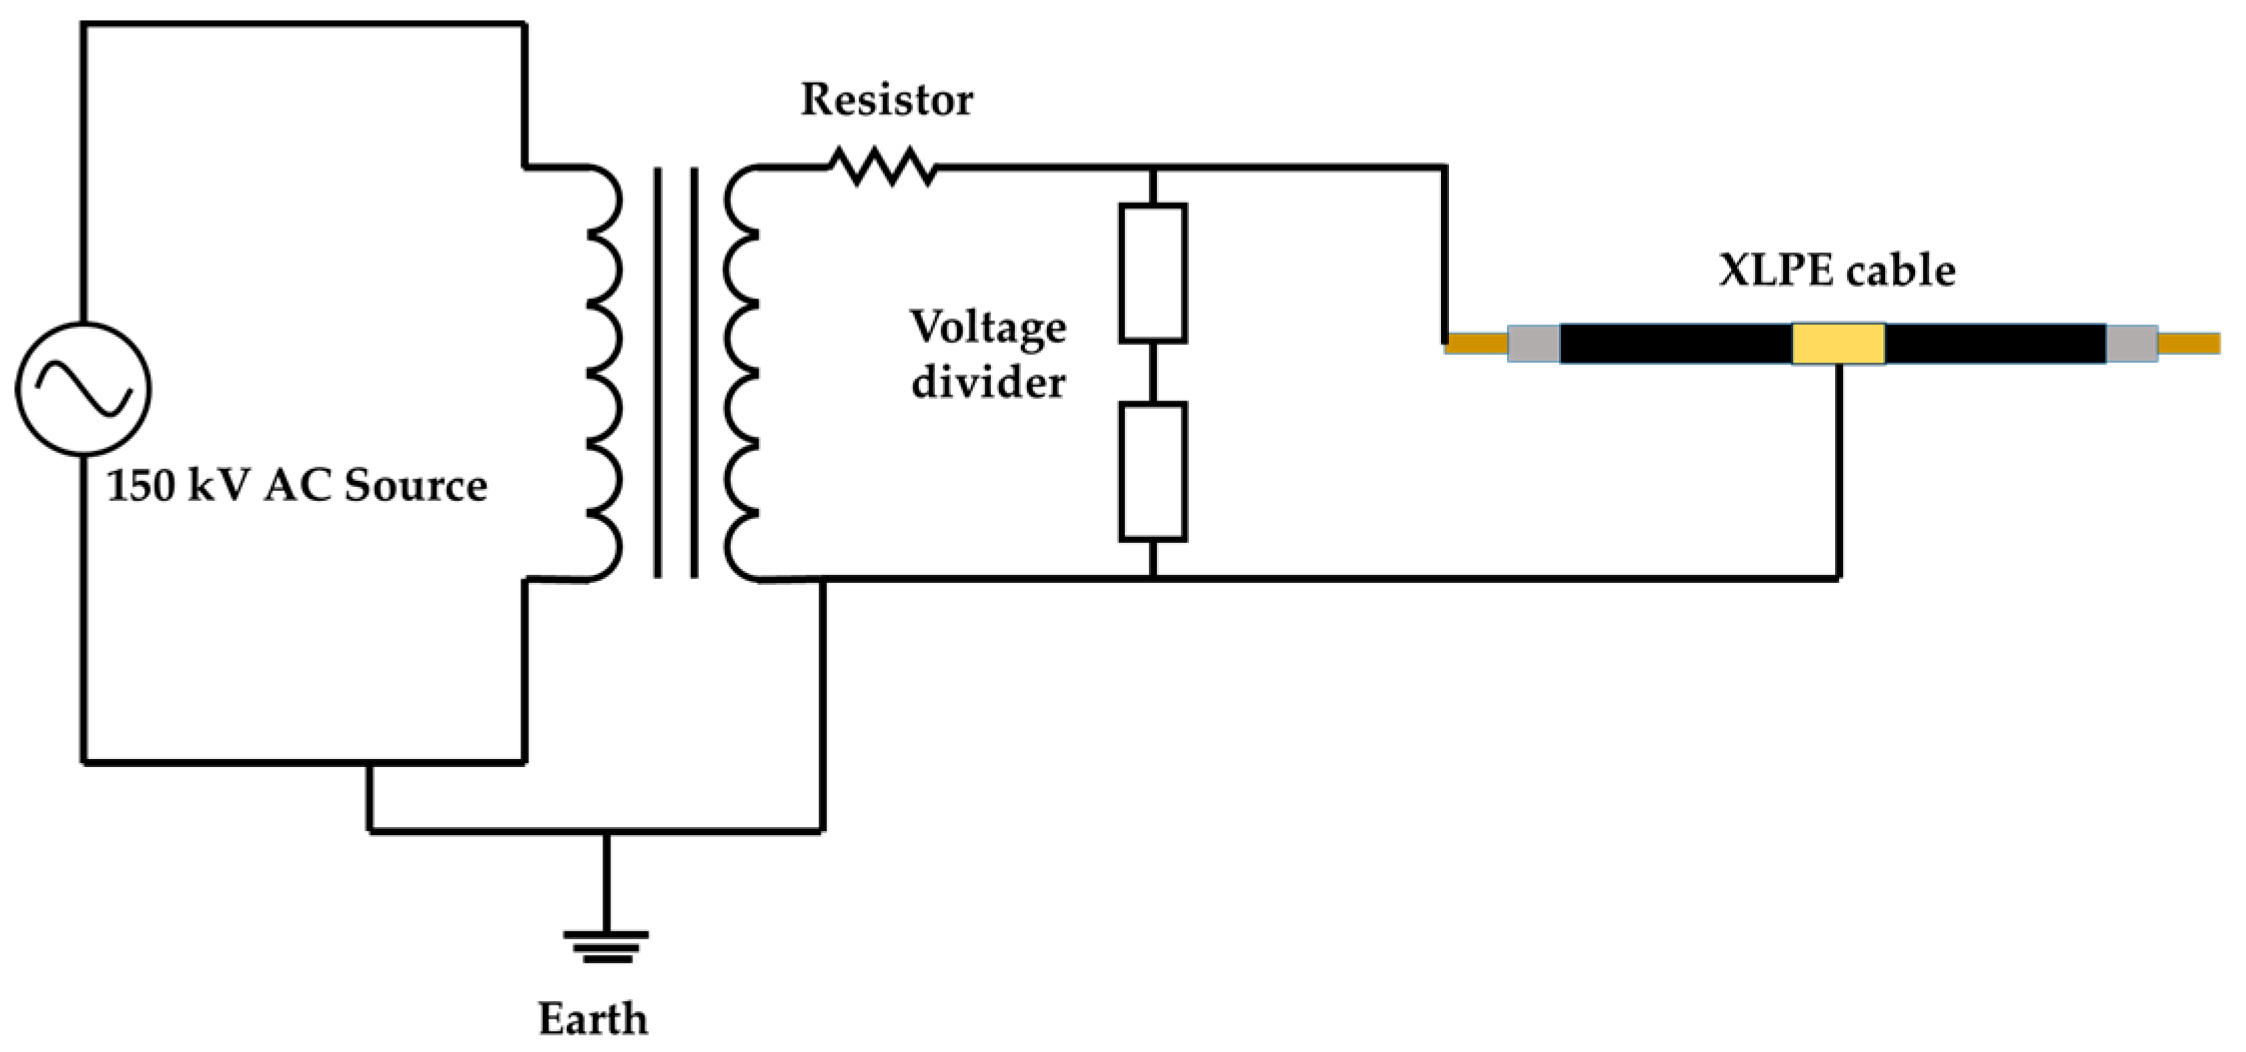
Figure 4.
Location of dielectric breakdown occurred: (a) dielectric breakdown in XLPE insulation; (b) dielectric breakdown occurs at the semi-conductor layer-XLPE interface.
Figure 4.
Location of dielectric breakdown occurred: (a) dielectric breakdown in XLPE insulation; (b) dielectric breakdown occurs at the semi-conductor layer-XLPE interface.
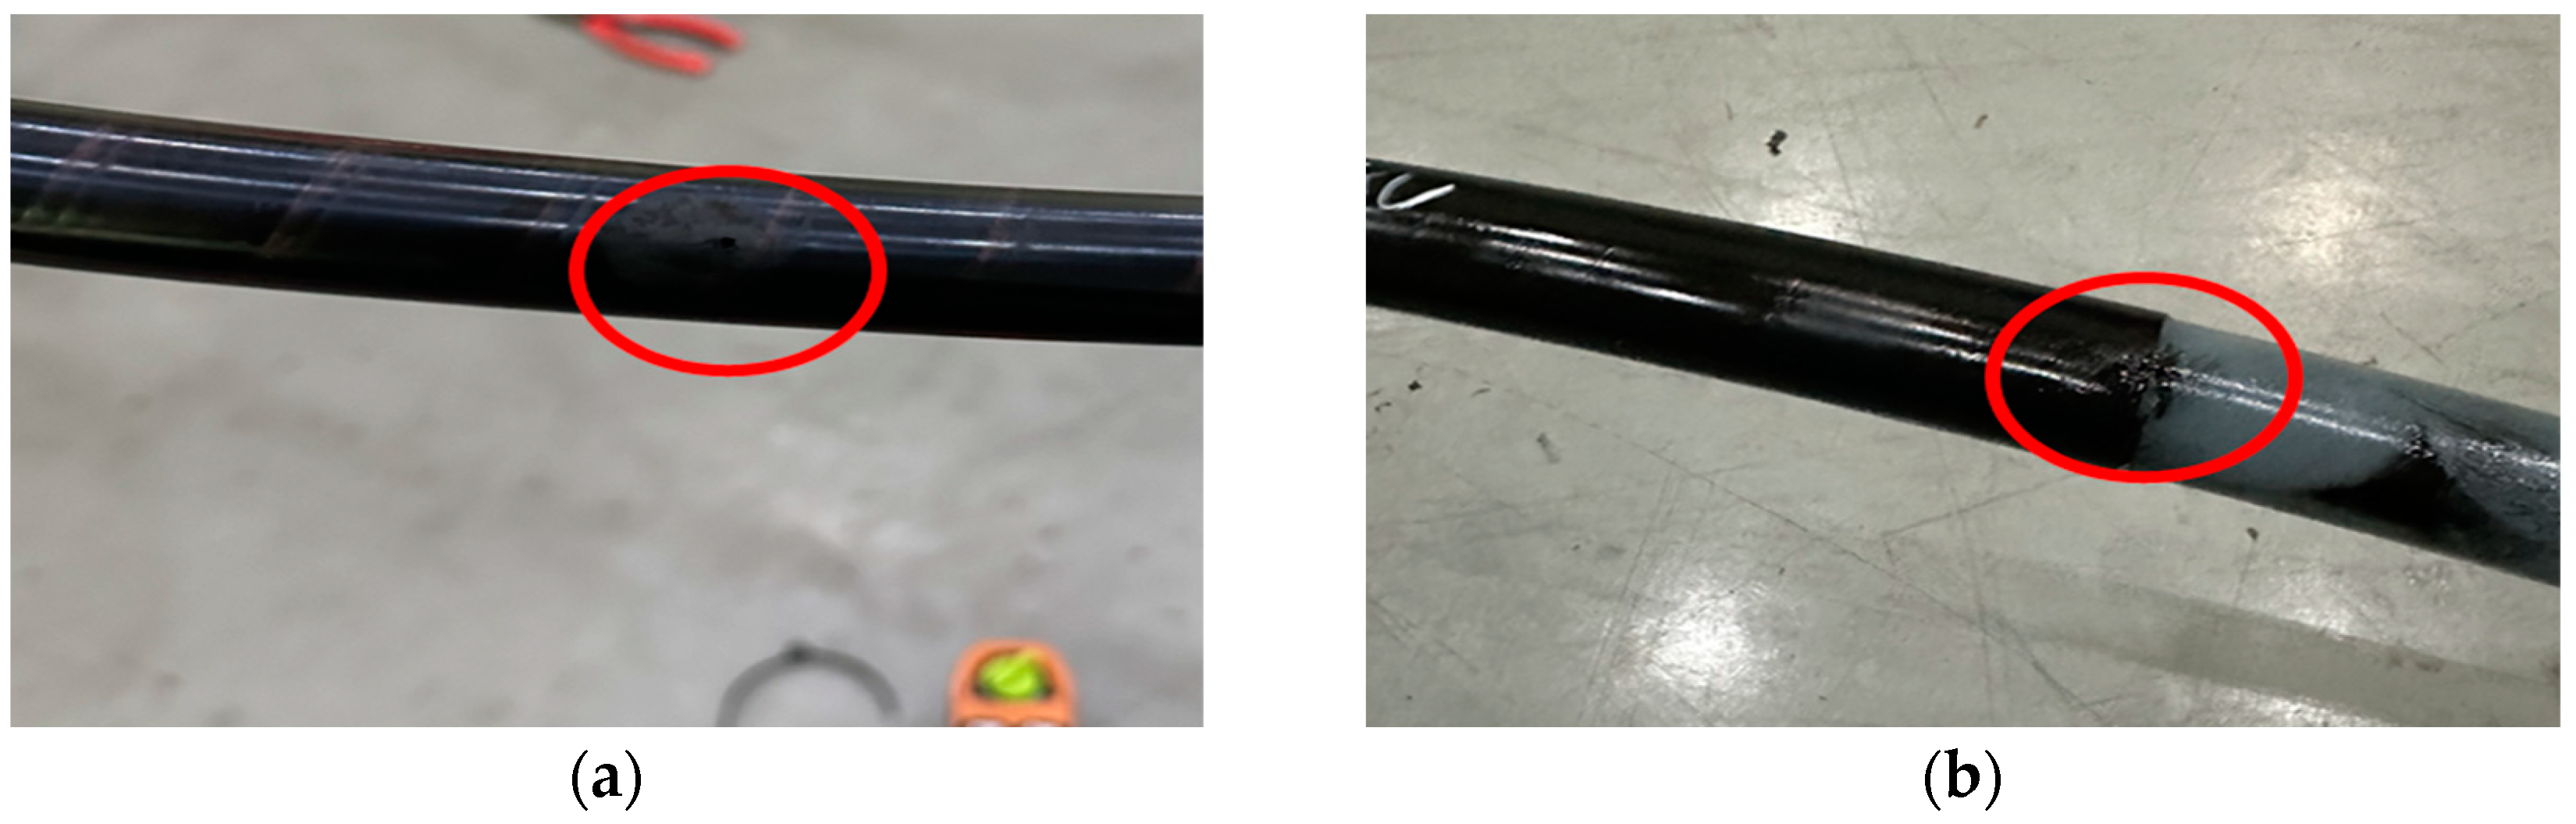
Figure 5.
Dumbbell shaped specimen.
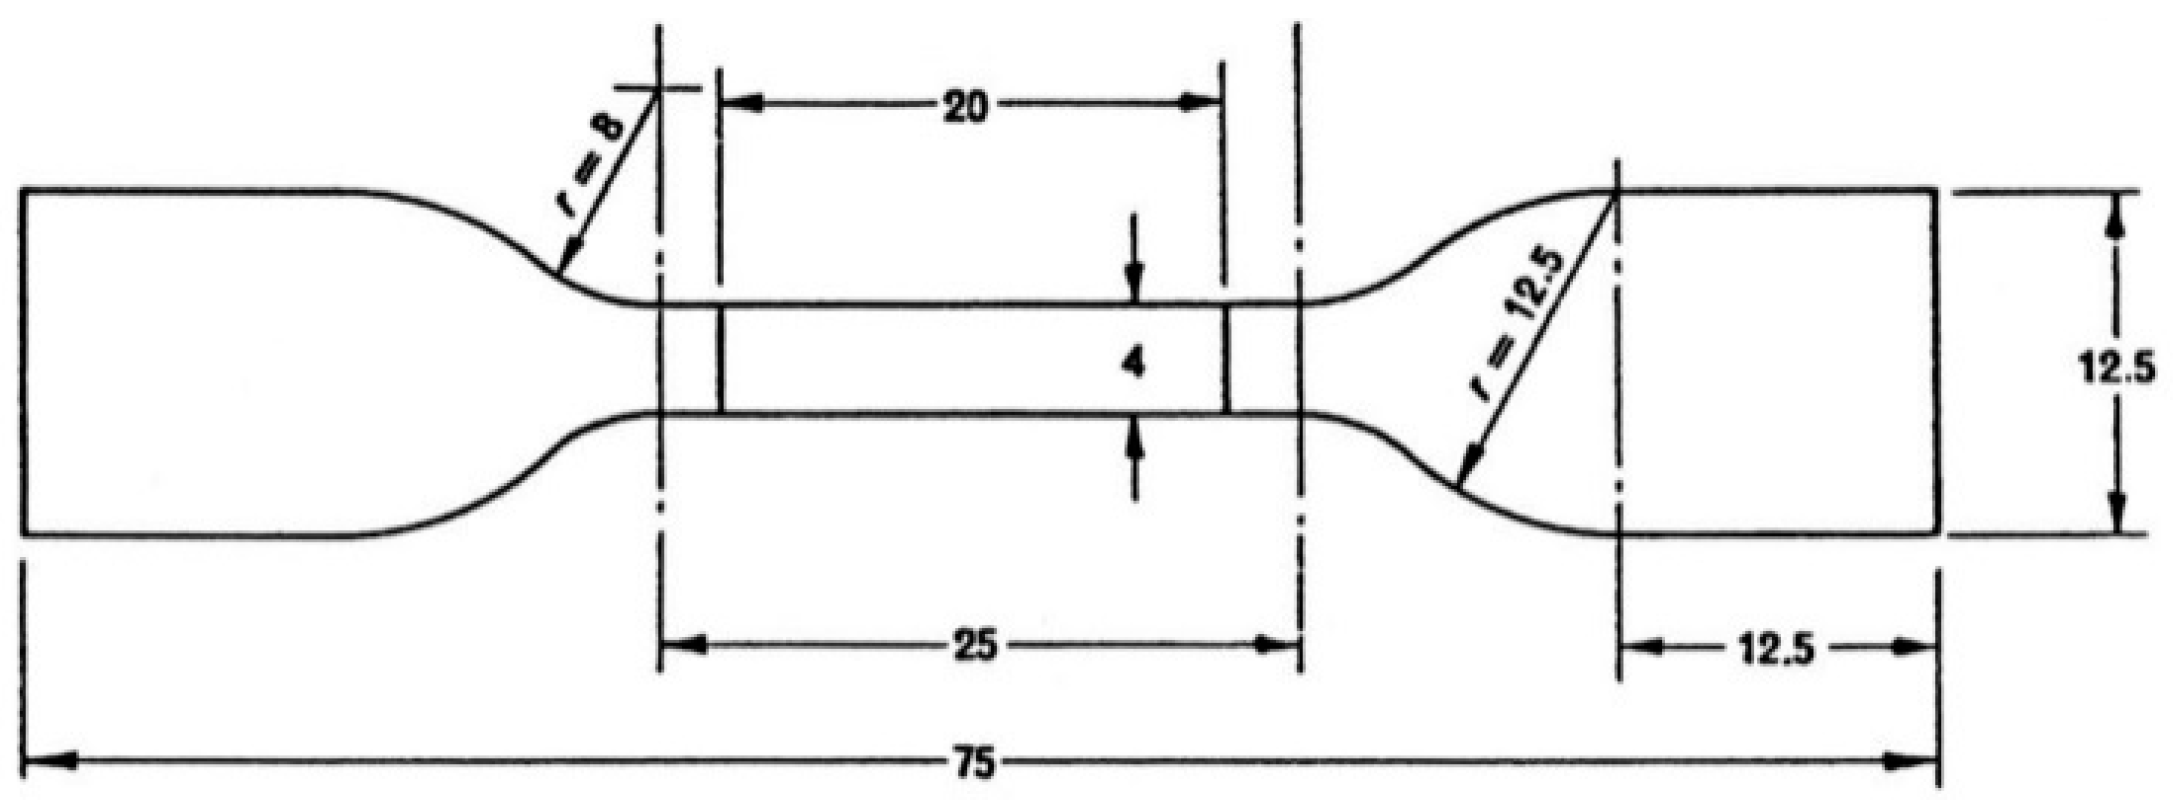
Figure 6.
Schematic diagram of dielectric breakdown of XLPE specimen.
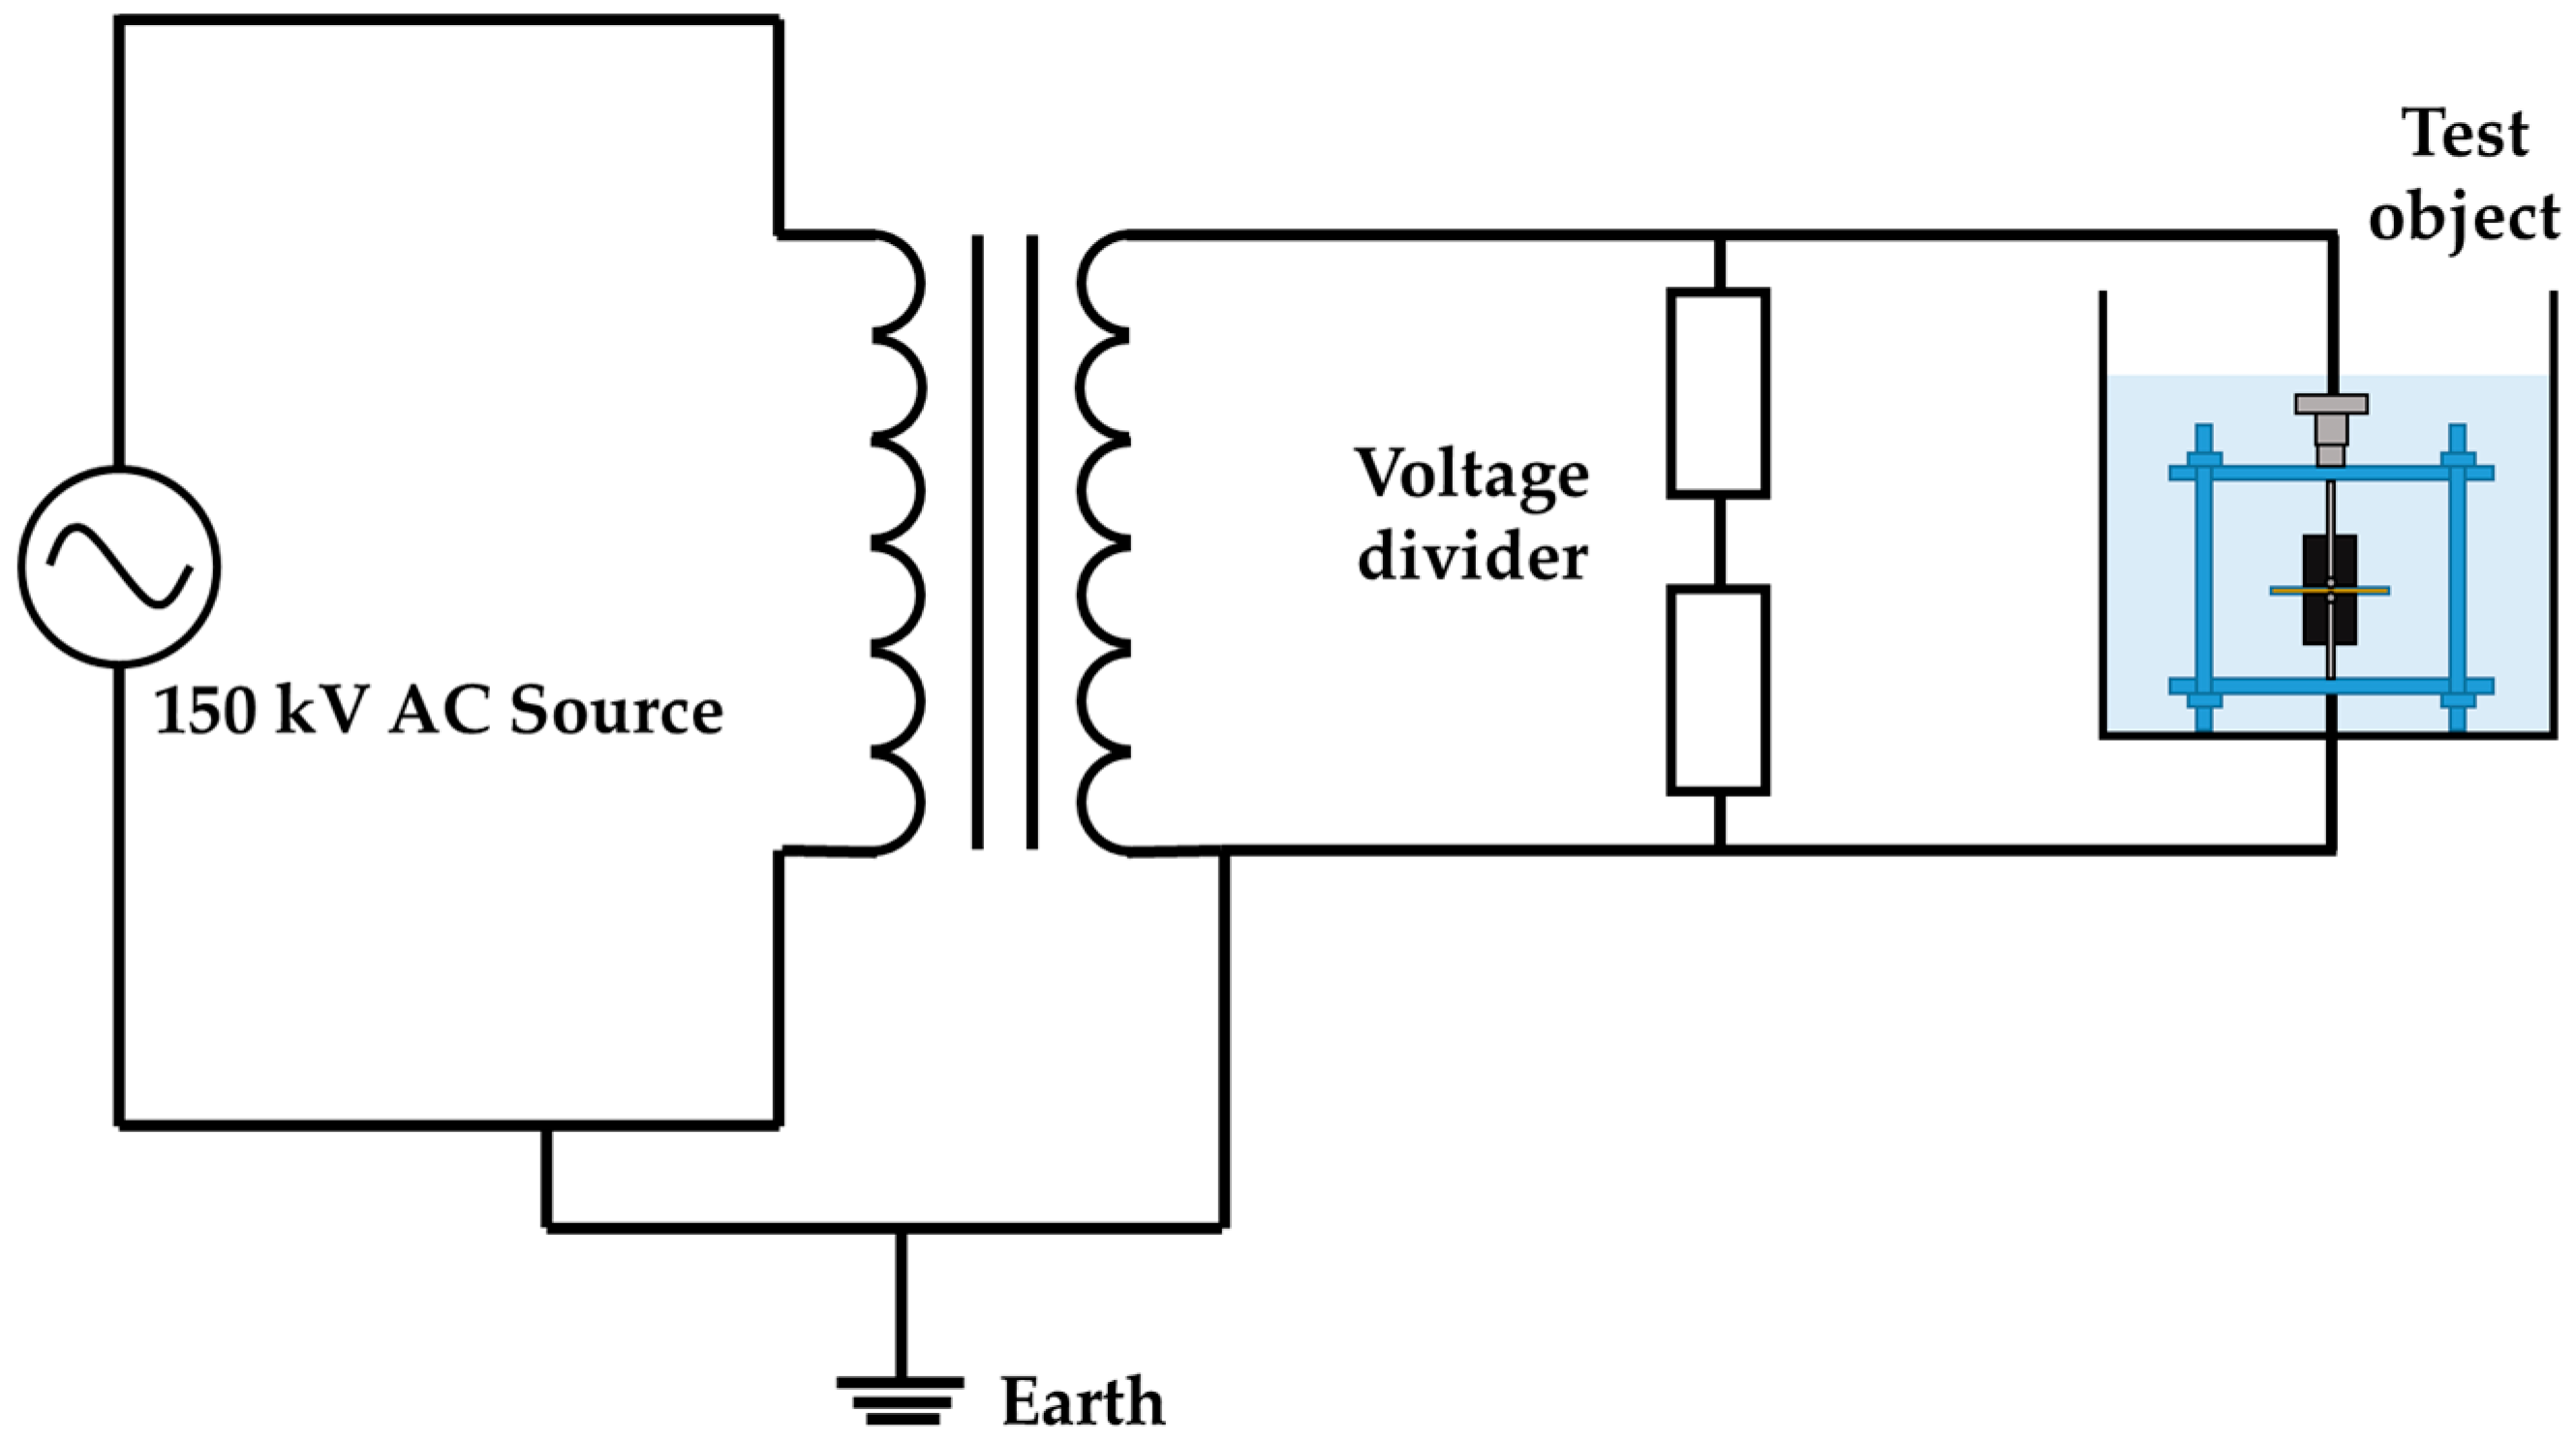
Figure 7.
Jigs and Electrodes.
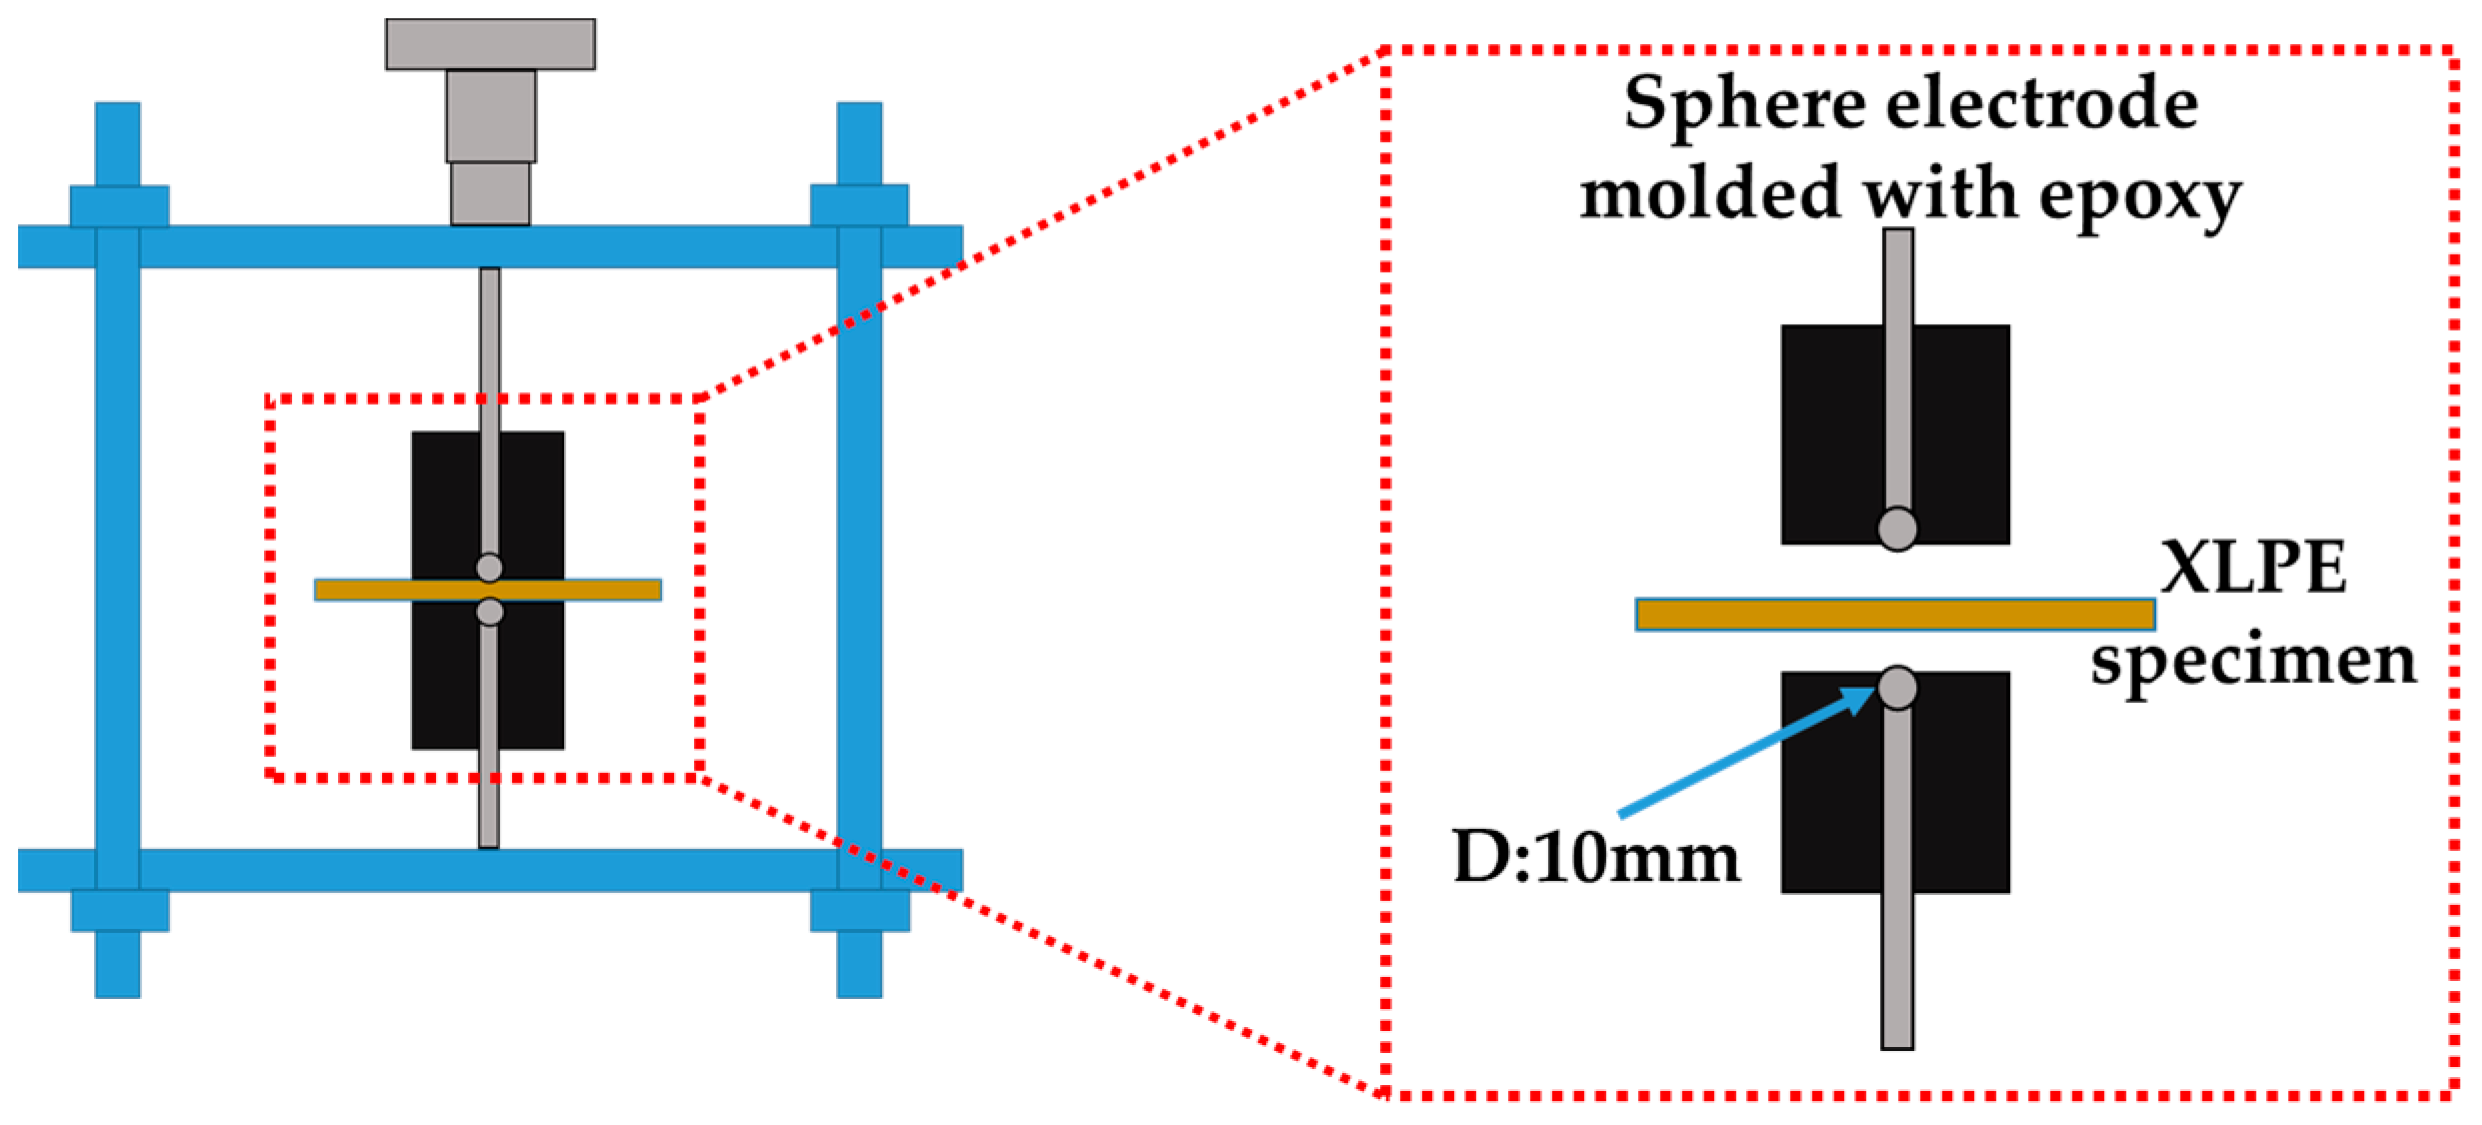
Figure 8.
VLF Tan δ depending on installation location: (a) BFP; (b) deaerator booster pump; (c) cooling tower.
Figure 8.
VLF Tan δ depending on installation location: (a) BFP; (b) deaerator booster pump; (c) cooling tower.
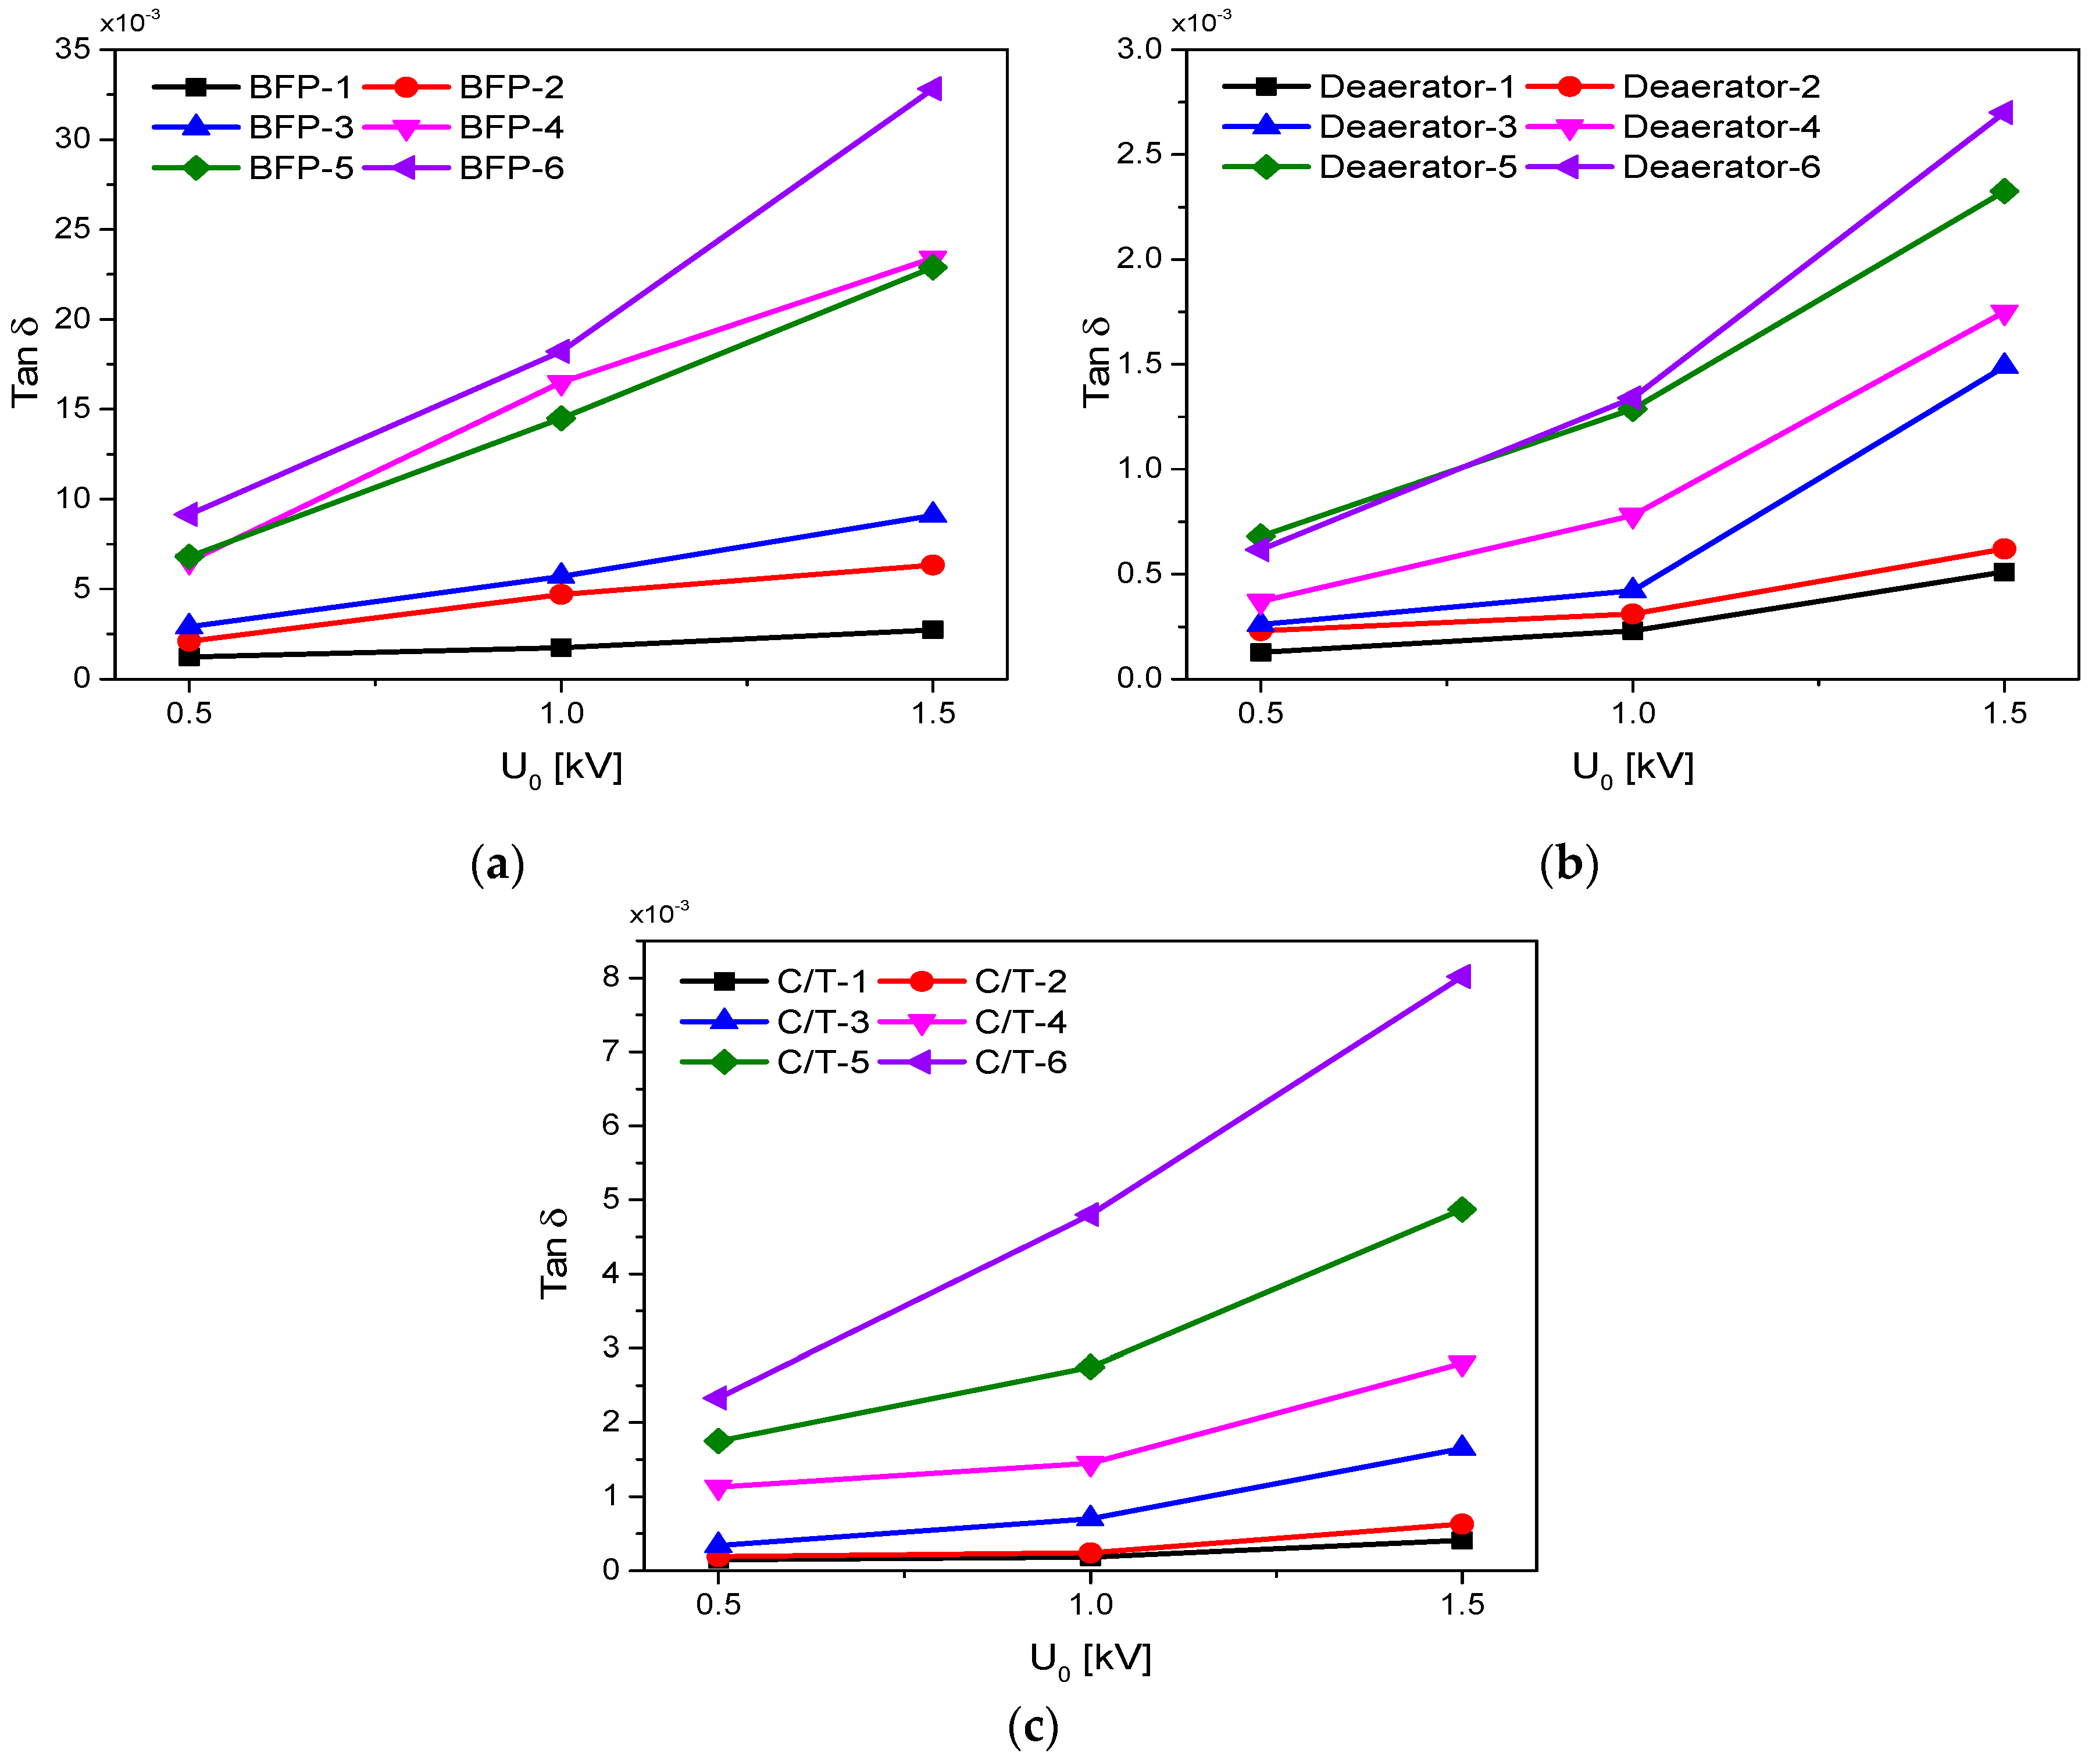
Figure 9.
Mechanical evaluation according to installation location: (a) tensile strength; (b) Elongation at break.
Figure 9.
Mechanical evaluation according to installation location: (a) tensile strength; (b) Elongation at break.
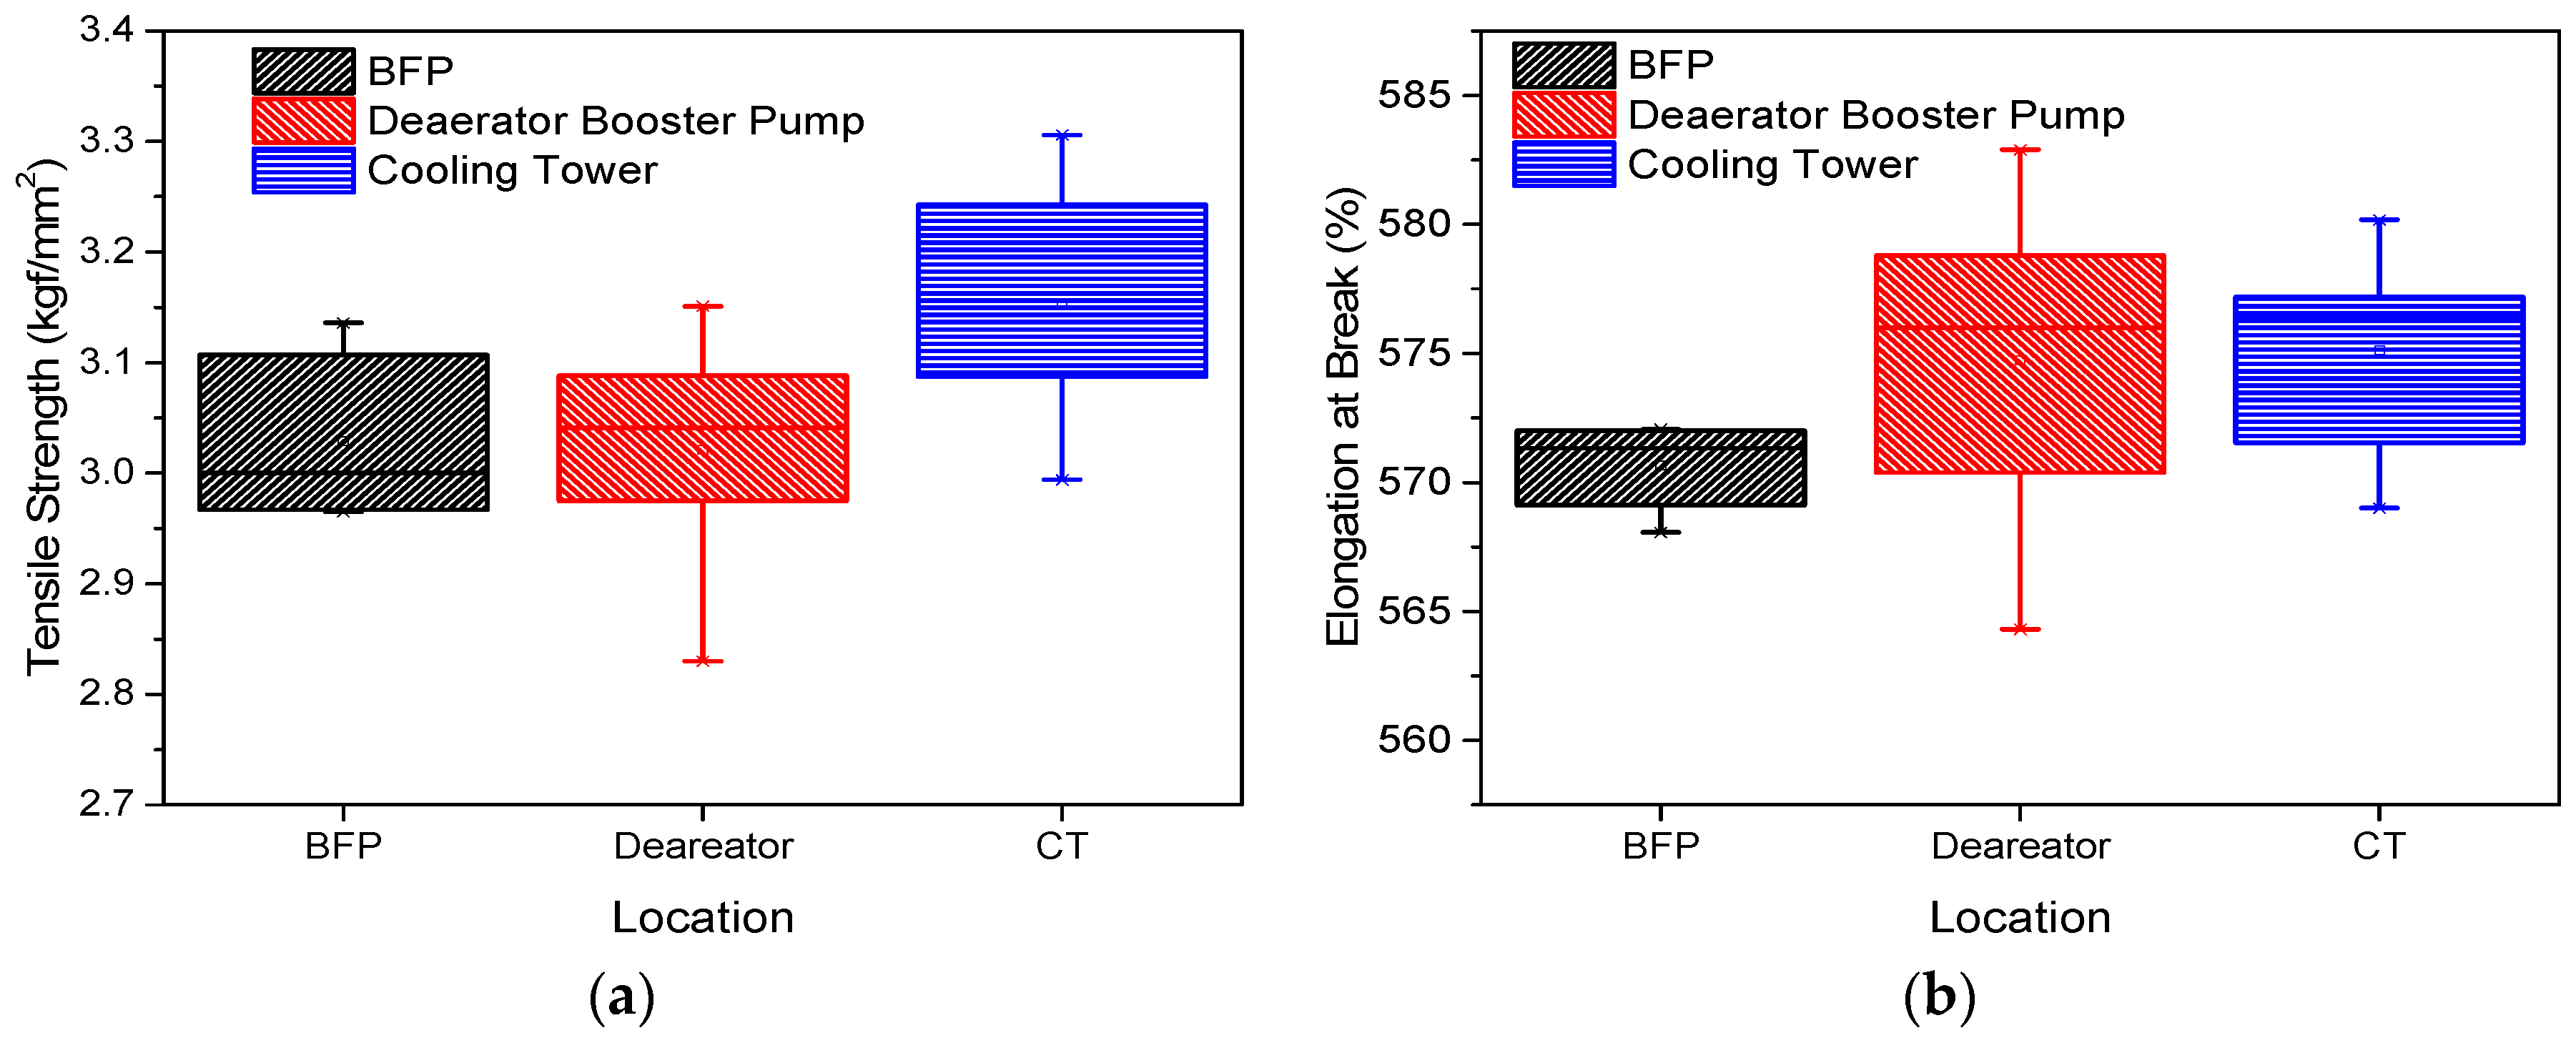
Figure 10.
XRD depending on installation location.
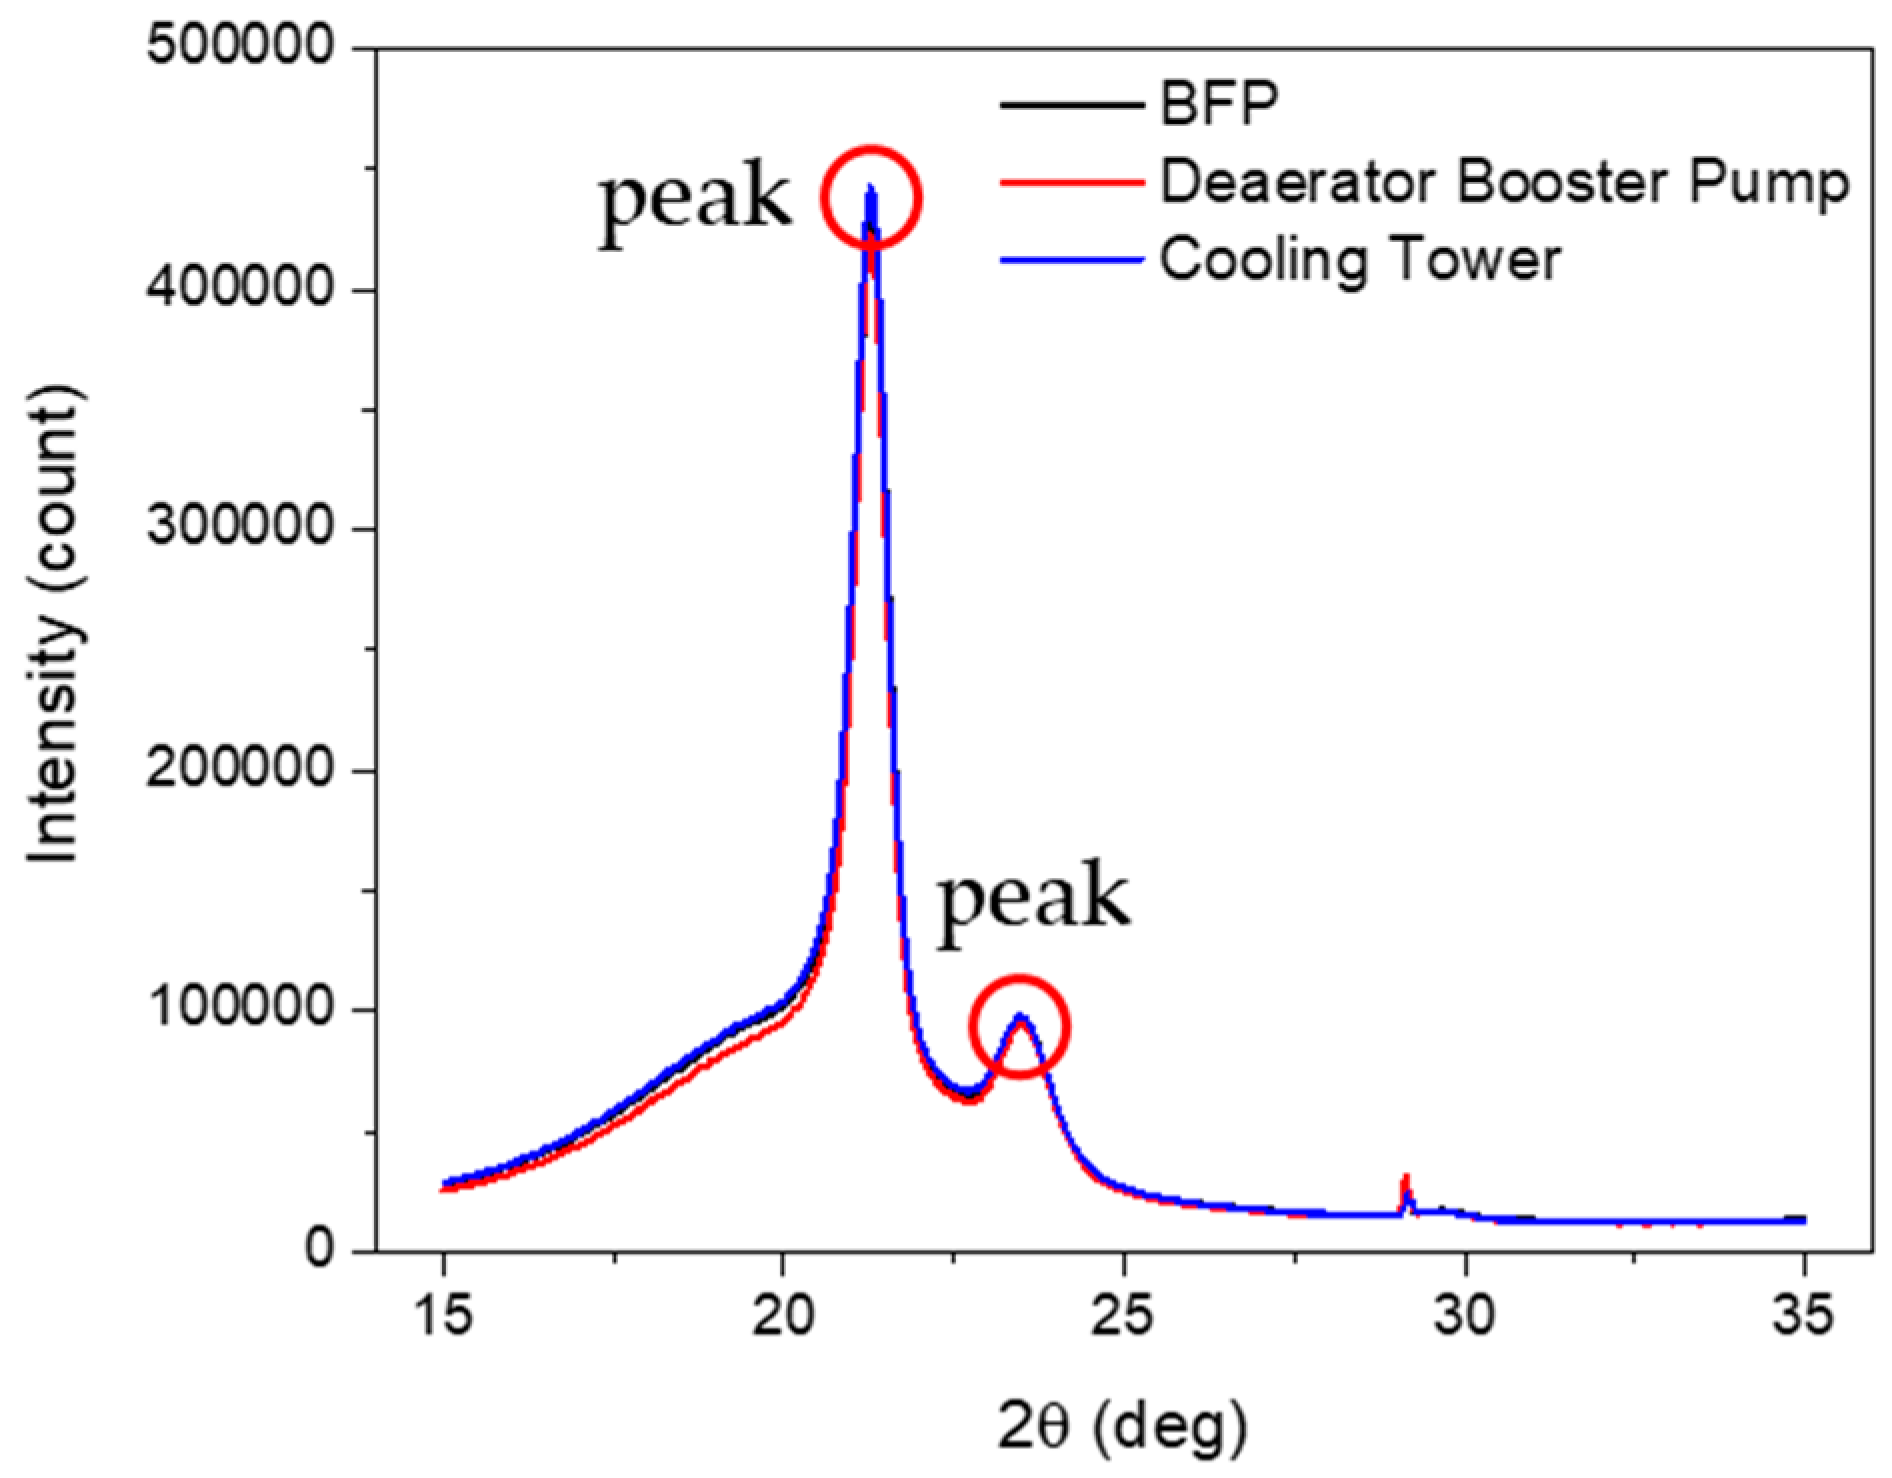
Figure 11.
Crystallinity of XLPE specimens depending on installation location.
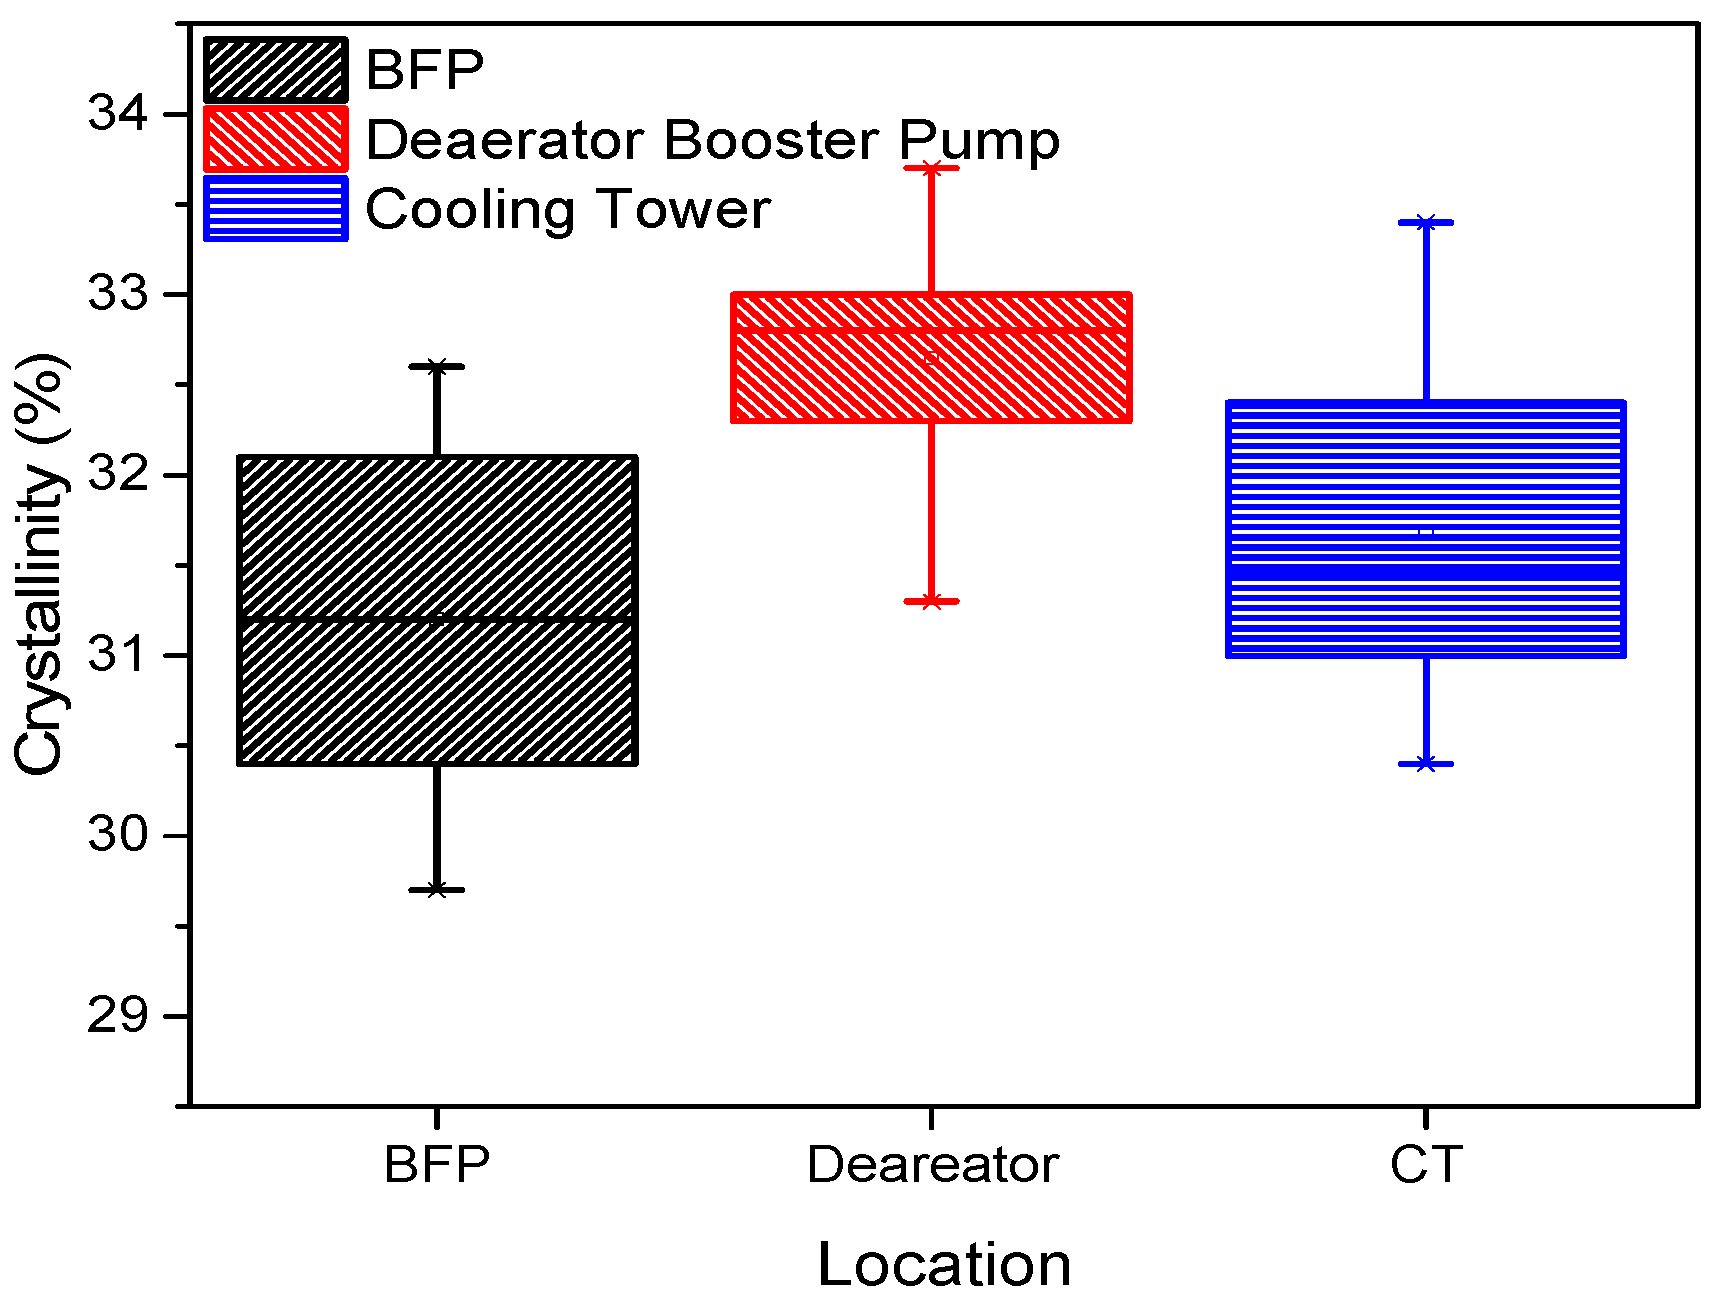
Figure 12.
Dielectric strength of XLPE specimens depending on installation location.
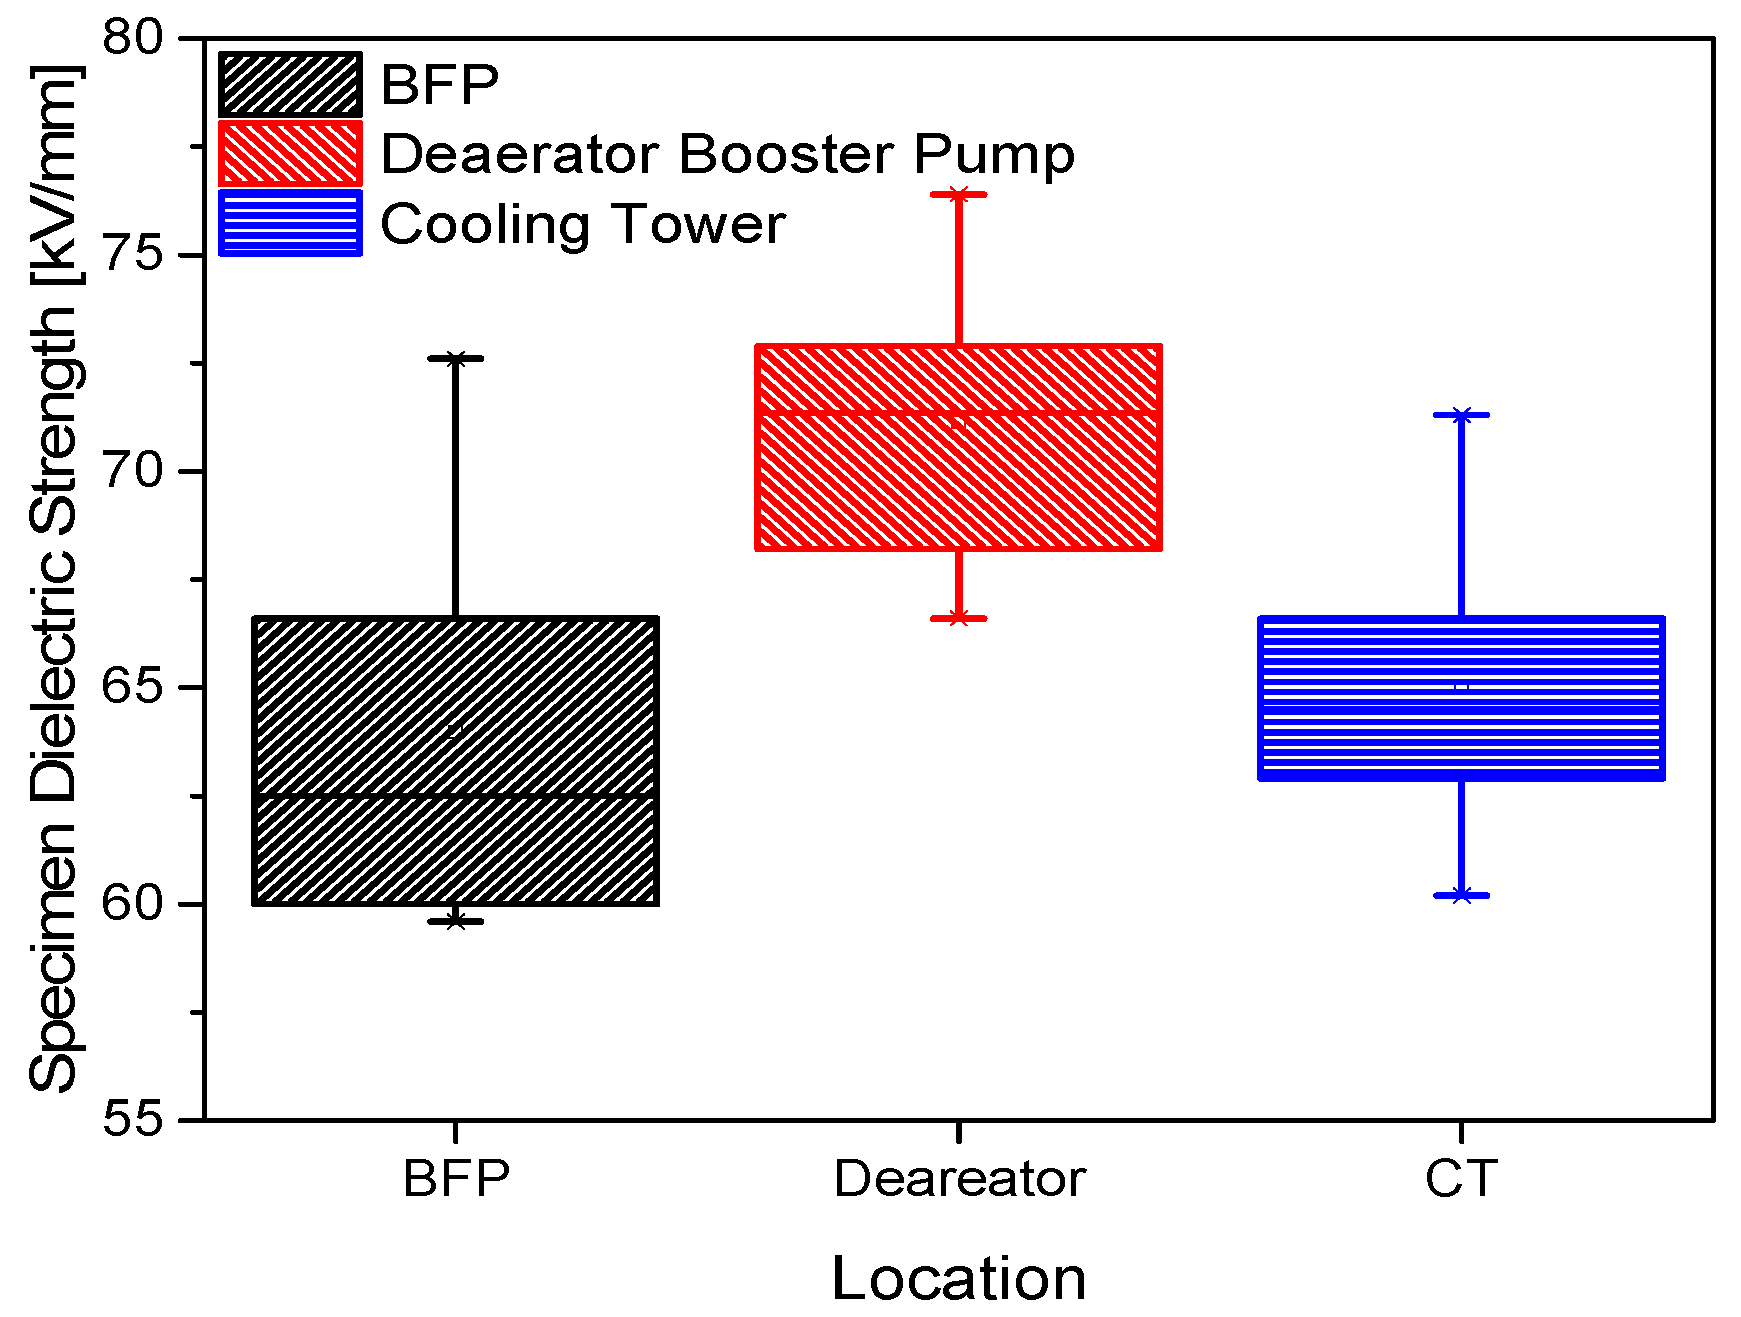
Figure 13.
Correlation with Tan δ: (a) Tan δ and cable insulation breakdown; (b) Tan δ and tensile strength; (c) Tan δ and elongation at break; (d) Tan δ and crystallinity; (e) Tan δ and specimen dielectric strength.
Figure 13.
Correlation with Tan δ: (a) Tan δ and cable insulation breakdown; (b) Tan δ and tensile strength; (c) Tan δ and elongation at break; (d) Tan δ and crystallinity; (e) Tan δ and specimen dielectric strength.
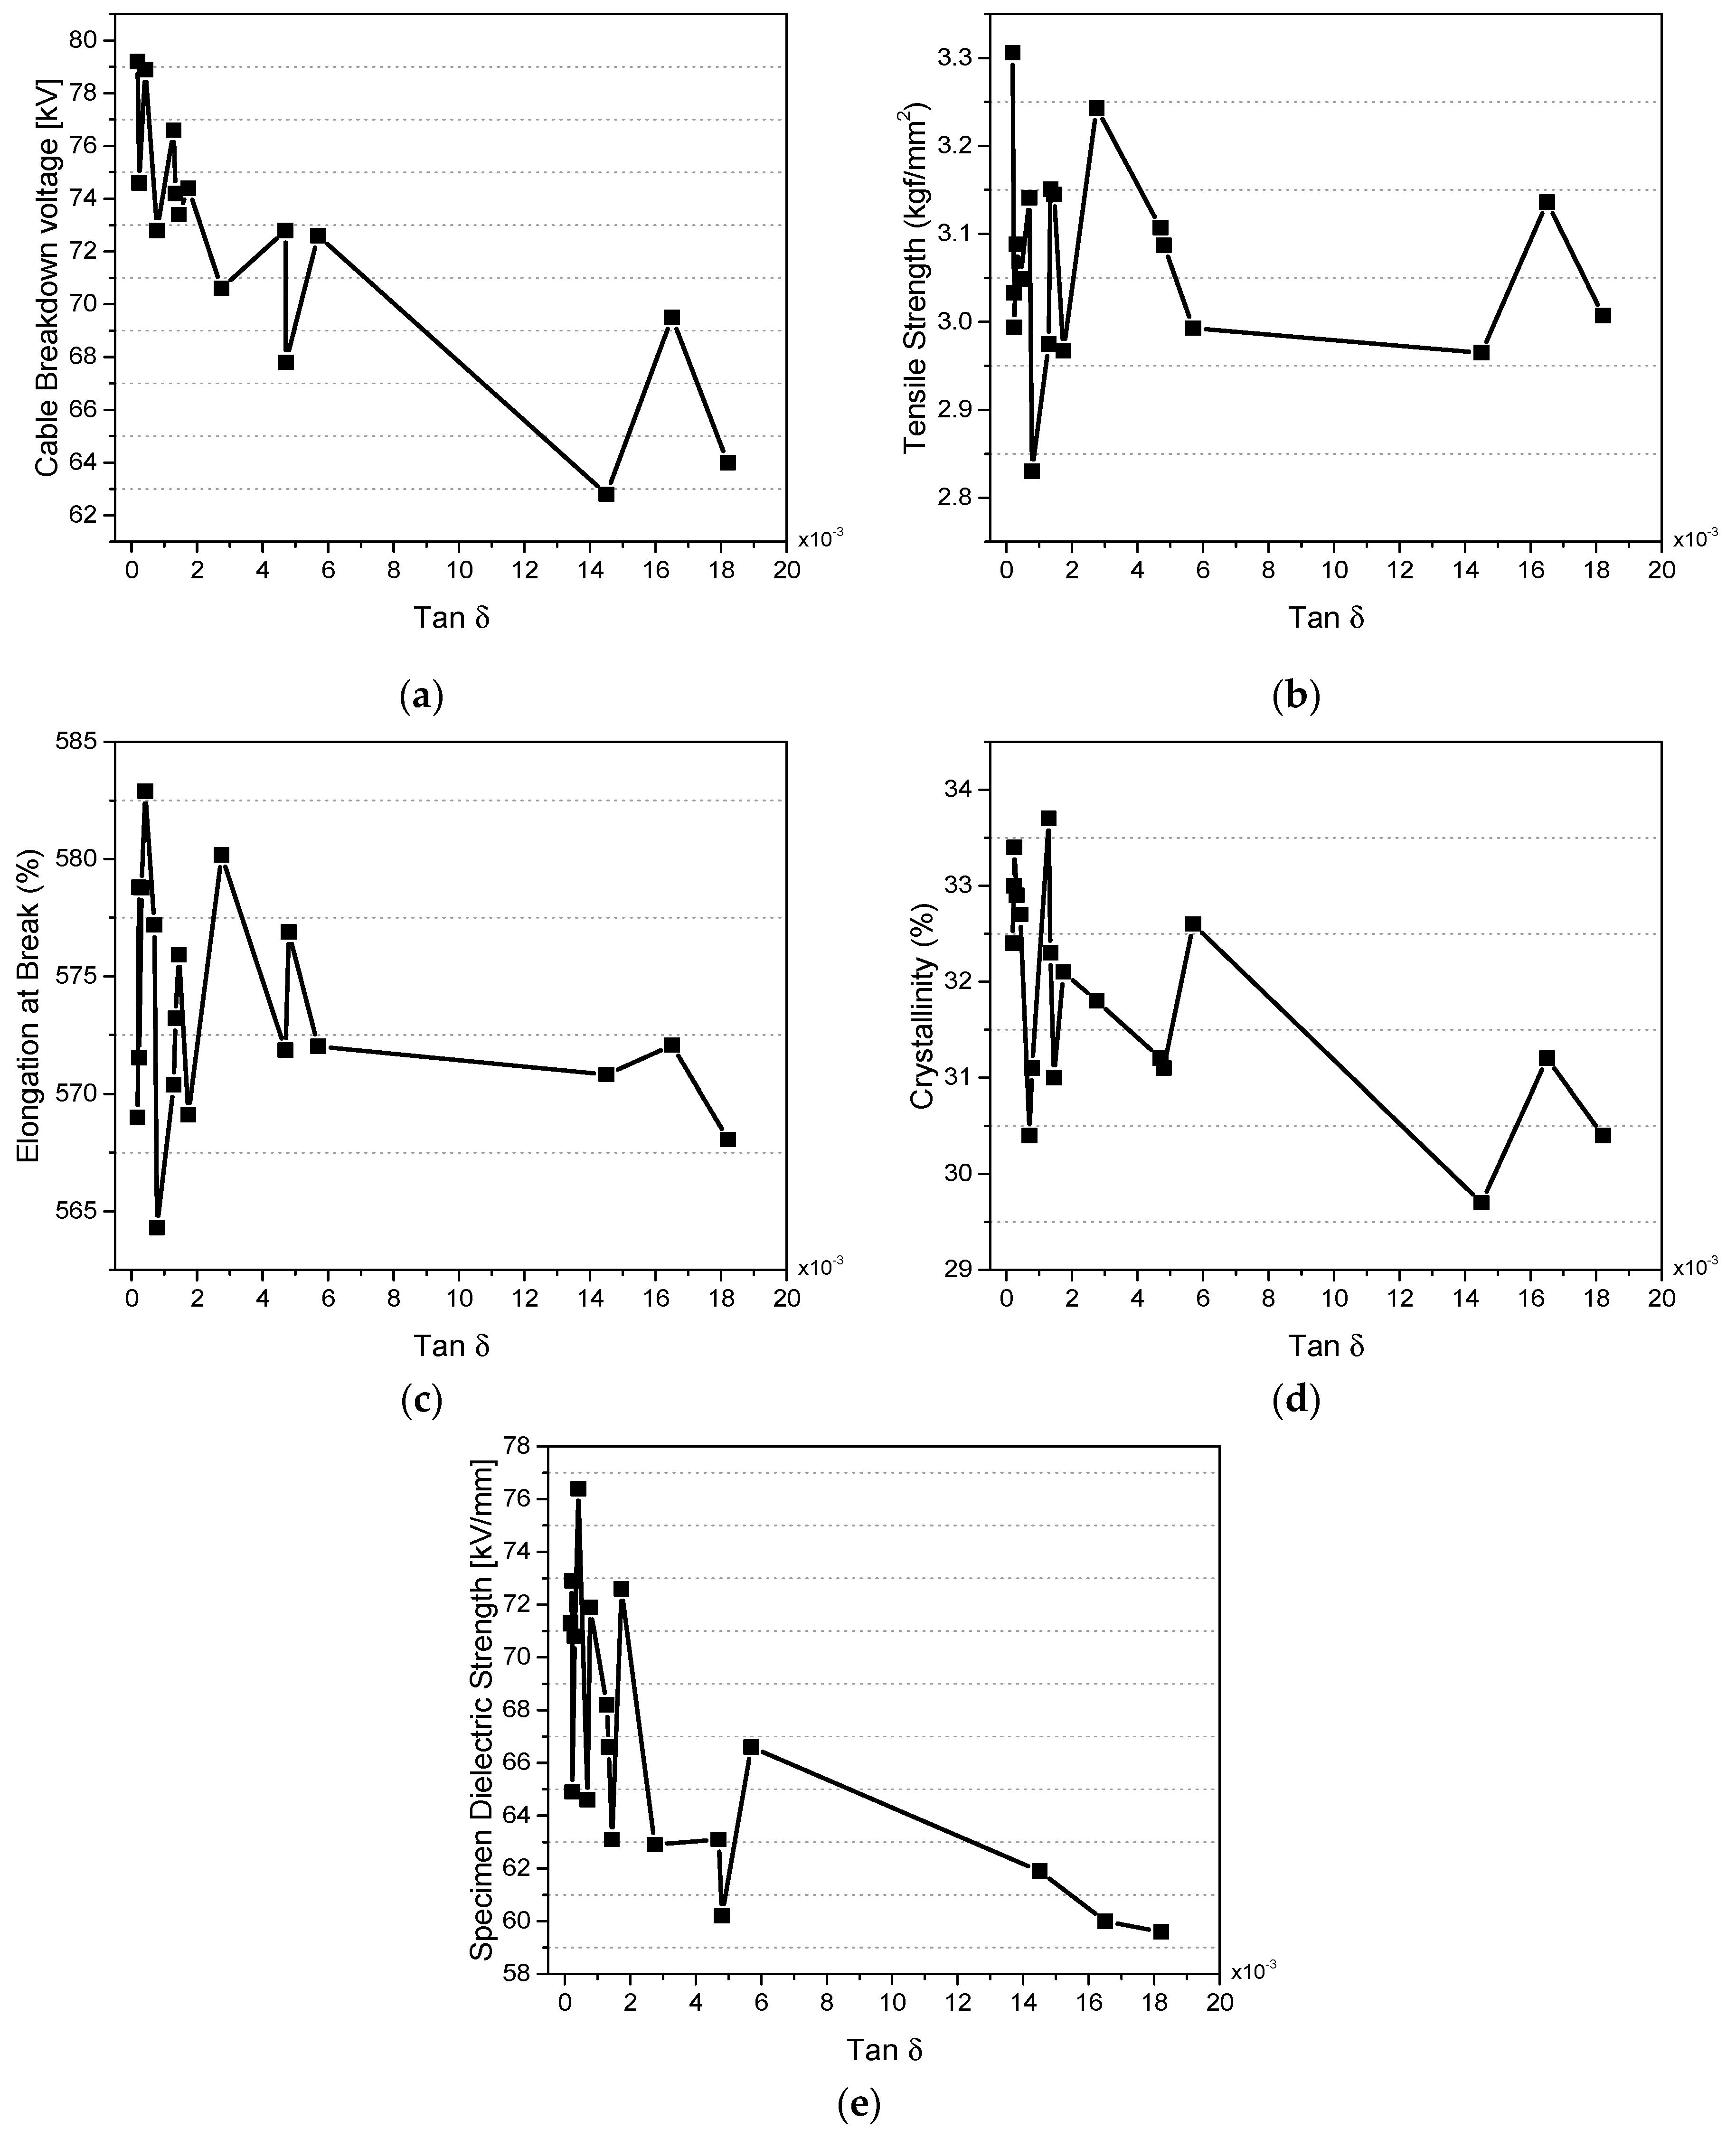

Table 1.
Cable installation location and sample name.
| Installation location | Sample name | Condition | Year | Length [m] |
|---|---|---|---|---|
| Boiler feedwater pump | BFP-1 | Field-aged | 1991 | 6 |
| BFP-2 | ||||
| BFP-3 | ||||
| BFP-4 | ||||
| BFP-5 | ||||
| BFP-6 | ||||
| Deaerator booster pump | Deaerator-1 | Field-aged | 1991 | 6 |
| Deaerator-2 | ||||
| Deaerator-3 | ||||
| Deaerator-4 | ||||
| Deaerator-5 | ||||
| Deaerator-6 | ||||
| Cooling tower | C/T-1 | Field-aged | 1991 | 6 |
| C/T-2 | ||||
| C/T-3 | ||||
| C/T-4 | ||||
| C/T-5 | ||||
| C/T-6 |
Table 2.
VLF Tan δ depending on installation location.
| Sample name | 0.5U0 | 1.0U U0 | 1.5 U0 | DTD (1.5 U0-0.5 U0) |
|---|---|---|---|---|
| BFP-1 | 1.22 | 1.74 | 2.72 | 1.5 |
| BFP -2 | 2.15 | 4.76 | 6.34 | 4.19 |
| BFP -3 | 2.91 | 5.78 | 9.1 | 6.19 |
| BFP -4 | 6.55 | 16.51 | 23.4 | 16.85 |
| BFP -5 | 6.8 | 16.55 | 22.9 | 16.1 |
| BFP -6 | 9.15 | 18.21 | 32.82 | 23.67 |
| Deaerator-1 | 0.12 | 0.23 | 0.51 | 0.39 |
| Deaerator -2 | 0.23 | 0.31 | 0.62 | 0.39 |
| Deaerator -3 | 0.26 | 0.42 | 1.5 | 1.24 |
| Deaerator -4 | 0.37 | 0.78 | 1.75 | 1.38 |
| Deaerator -5 | 0.68 | 1.29 | 3.26 | 2.58 |
| Deaerator -6 | 0.62 | 1.34 | 2.7 | 2.08 |
| C/T-1 | 0.15 | 0.18 | 0.41 | 0.26 |
| C/T -2 | 0.19 | 0.24 | 0.63 | 0.44 |
| C/T -3 | 0.34 | 0.7 | 1.55 | 1.21 |
| C/T -4 | 1.13 | 1.45 | 2.8 | 1.67 |
| C/T -5 | 1.75 | 2.75 | 4.87 | 3.12 |
| C/T -6 | 2.33 | 4.8 | 8.02 | 5.69 |
Table 3.
Dielectric breakdown voltage and type depending on installation location.
| Sample name | Breakdown voltage [kV] | Type | Breakdown voltage [kV] | Type |
|---|---|---|---|---|
| BFP-1 | 74.4 | BD | - | - |
| BFP -2 | 72.8 | BD | - | - |
| BFP -3 | 68.1 | Interface | 72.6 | BD |
| BFP -4 | 69.5 | BD | - | - |
| BFP -5 | 62.8 | BD | - | - |
| BFP -6 | 64 | BD | - | - |
| Deaerator-1 | 84.5 | Flashover | 87 | Flashover |
| Deaerator -2 | 78.9 | BD | - | - |
| Deaerator -3 | 78.9 | BD | - | - |
| Deaerator -4 | 72.8 | BD | - | - |
| Deaerator -5 | 70.8 | Interface | 76.6 | BD |
| Deaerator -6 | 74.2 | BD | - | - |
| C/T-1 | 79.2 | BD | - | - |
| C/T -2 | 73.5 | Interface | 74.6 | BD |
| C/T -3 | 72.9 | Interface | 66.7 | Interface |
| C/T -4 | 73.4 | BD | - | - |
| C/T -5 | 70.6 | BD | - | - |
| C/T -6 | 67.8 | BD | - | - |
Disclaimer/Publisher’s Note: The statements, opinions and data contained in all publications are solely those of the individual author(s) and contributor(s) and not of MDPI and/or the editor(s). MDPI and/or the editor(s) disclaim responsibility for any injury to people or property resulting from any ideas, methods, instructions or products referred to in the content. |
© 2024 by the authors. Licensee MDPI, Basel, Switzerland. This article is an open access article distributed under the terms and conditions of the Creative Commons Attribution (CC BY) license (http://creativecommons.org/licenses/by/4.0/).
Copyright: This open access article is published under a Creative Commons CC BY 4.0 license, which permit the free download, distribution, and reuse, provided that the author and preprint are cited in any reuse.
Downloads
89
Views
38
Comments
0
Subscription
Notify me about updates to this article or when a peer-reviewed version is published.


MDPI Initiatives
Important Links
© 2025 MDPI (Basel, Switzerland) unless otherwise stated