1. Introduction
The wear and damage of well wall of the orepass is a common problem in production, which not only reduces the service life of the orepass, but also greatly increases the safety hazards of mine production. The flow characteristics of ore-rock dispersion and its accompanying mechanical behavior are the main causes of the deformation, instability and collapse of the orepass [
1,
2,
3]. Therefore, it is of great significance to study the distribution law of the main force sources and the distribution characteristics of the damaged areas, to reveal the wear mechanism of the orepass and ensure the stability of the orepass.
In order to improve the service life of orepass in mines, many scholars have made in-depth research according to the theories of fluid mechanics, contact mechanics and ore drawing. For example, Liu et al.[
4] established a theoretical equation under the non-point pumping point according to the characteristics of the random medium pumping theory, taking the width of the pull-out point as the moving boundary. Huang et al. [
5] proposed an experimental technique that is helpful to analyze the crushing of underground mine tunnels under impact load. It is believed that before the impact kinetic energy reaches the critical value, the energy dissipation is mainly concentrated in the failure zone. Chi et al. [
6] qualitatively analyzed the migration law of ore-rock in the ore storage section through the two-dimensional flow network. Zhao et al. [
7] with the help of Hertz contact and kinematics theory, conducted the quantitative characterization of the volume damage of the well wall. Jin et al. [
8] studied the traflow characteristics of uneven particles from the perspective of ore drawing. Classical mechanics has achieved fruitful results in ore-rock flow, but in the actual production process, orepass complex geological environment and harsh conditions, lead to intuitive analysis well storage flow characteristics and mechanical behavior not only operation difficulty but affect the normal production of mine. In this background, eager to seek new methods to analyze the problem of ore-rock flow.
With the rise of simulation in engineering mechanics, the discrete element method (DEM) has become the mainstream to study the mechanical behavior of the dispersion particles [
9]. Many scholars have carried out a lot of research on the discontinuity medium based on the discrete element method. For example, Yang et al. [
10] created the storage materials in the mine tunnel through randomly distributed spheres and irregular polyhedra, and studied the change law of the impact force on the well wall and the materials in the mine channel, as well as the change law of the voidage of ore-rock. Sato and Tang [
11] used the 3 D discrete element method to simulate the ore-rock flow in rectangular and vertical tunnels, and found that the cross section of the hole is more desirable. Hadjigeorgiou and Lessard [
12] based on the summary of a series of numerical experiments using the discrete element method, studied the effects of the groove geometry, rock fragmentation shape and particle size distribution on the ore-rock flow in the groove. According to the established SRM model, Esmaieli et al. [
13] analyzed the effects of stress-structure interaction on the stability of ore groove and ore-rock impact on the orepass wall. Yuan et al. [
14] based on the discrete element analysis method, found that the change of wheat grain flow mode was the main reason for the local overpressure in the inner arch and the silo wall of the dispersion. Montellano et al. [
15] analyzed the flow characteristics of glass beads and corn particles in the central unloading process from the perspectives of flow state, packing density and stress distribution. Pengkai et al. [
16] analyzed through the change of the force chain network, the mechanism of the influence of the friction coefficient of the silo wall on the lateral pressure of the silo wall during the unloading of the rectangular hopper. Cheng et al. [
17] analyzed the change characteristics of the dispersion flow field and the thin view stress field during the unloading process of the shallow circular chamber, and explained the mechanical behavior of the dispersion to the warehouse wall from the perspective of granular flow. Feng et al. [
18] studied the influence of granular flow on the dynamic lateral pressure of the silo wall, and analyzed the stress characteristics of the silo wall under the arch effect of granular drawing. Pacheco-Martinez et al. [
19] studied the flow characteristics of the dispersion inside the silos under different vibration frequencies, and believed that the tangential motion of the silo wall effectively contained the formation of the Janseen effect.
At present, researches on granular flow and other related aspects mainly focus on grain silo, silo and ore hanging in orepass, and few involve the mechanical damage of well wall of orepass, and the existing researches still lack the understanding of macro-flow and micromechanical behavior of ore-rock dispersion particles. Therefore, according to the discrete element method, this paper analyzes the flow characteristics of ore-rock, on this basis, the contact density, internal stress distribution, contact force distribution and so on are discussed, the mechanical evolution mechanism of the dispersion system and the stress characteristics of the orepass of the storage section are revealed in the process of ore-rock flow, which lays a foundation for the follow-up study of well wall stability of orepass.
1. Physical Test
1.1. Determination of Ore-Rock Particle Parameters
The micromechanical parameters (density, particle size distribution, grading, internal friction angle and cohesion, etc.) of the ore-rock dispersion materials play an important role in the overall fluidity of the storage material and the force condition of the well wall. In order to ensure the accuracy of the experimental results, the building stone with mechanical characteristics close to the ore-rock is selected as the ideal ore-rock dispersion material. According to previous studies on the physical parameters of granular materials, the density of stones obtained by water injection is 3050 kg/m³ [
20]. On this basis, the sample scale of the building stones was adopted by the four-point method, and the granular size distribution and mass proportion of the scale samples were screened through different screens, as shown in
Table 1. Using the collapse measuring device shown in
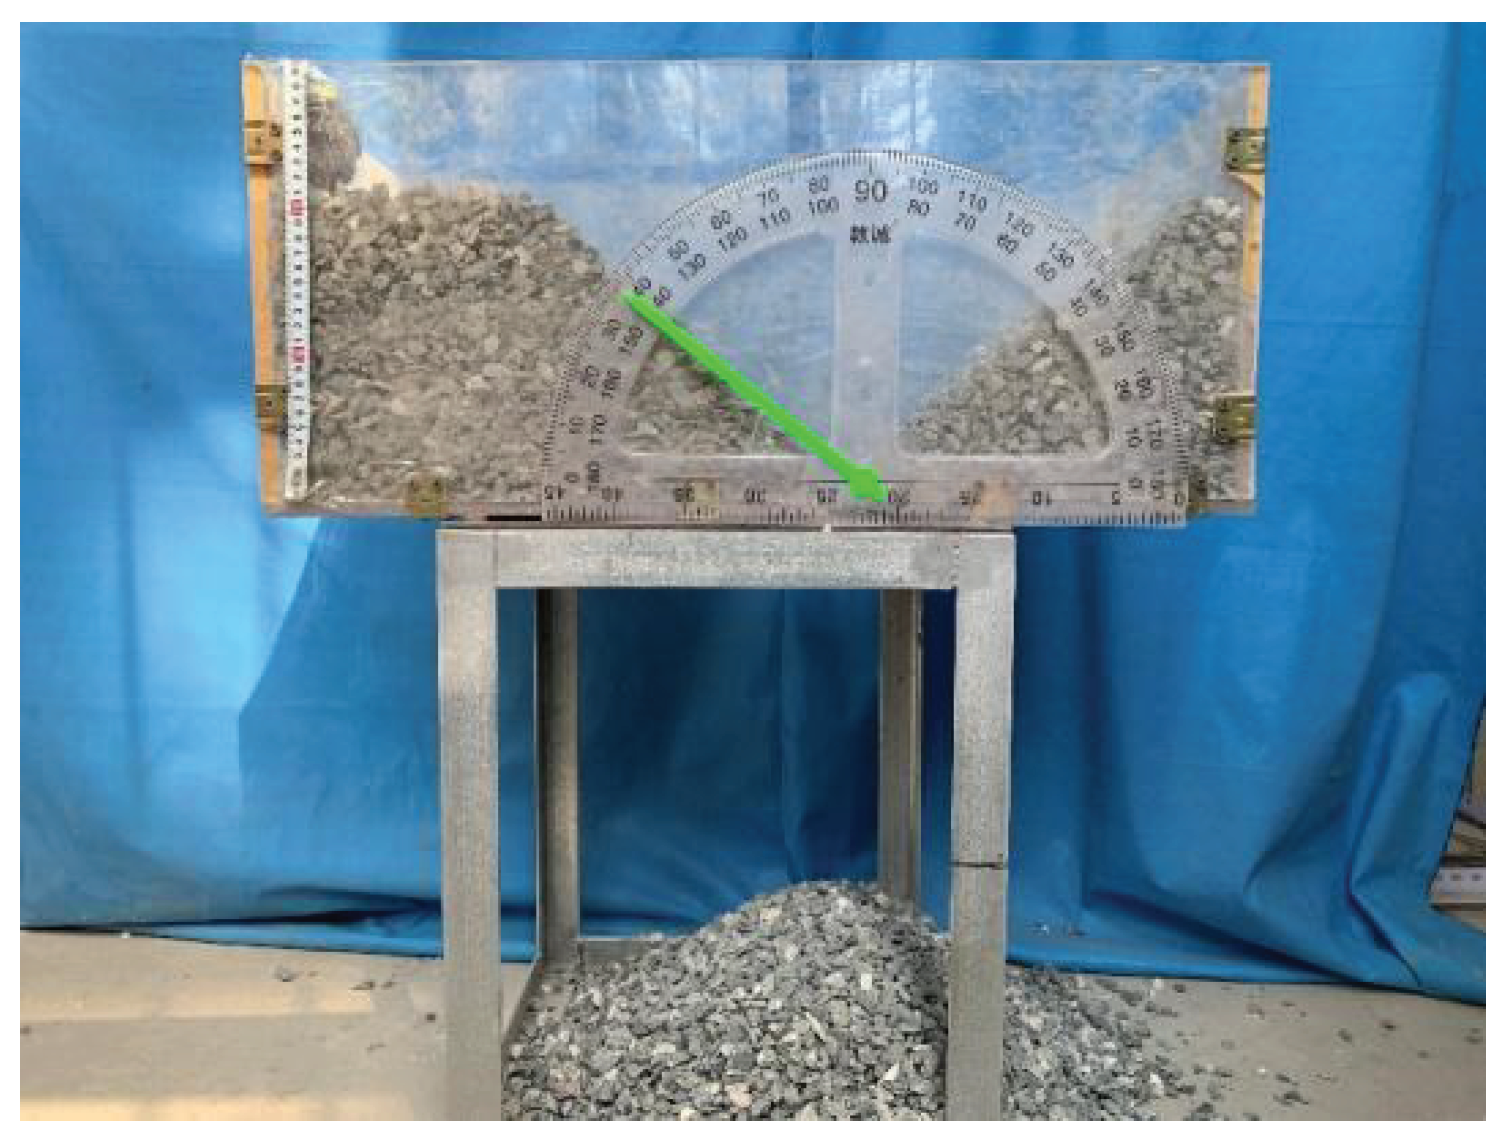
Figure 1, the natural repose angle of the stone dispersion is 38.6, and the internal friction angle and cohesion of the ore-rock dispersion are obtained indirectly by measuring the natural repose angle [
21].
1.2. Construction of the Central Unloading Model
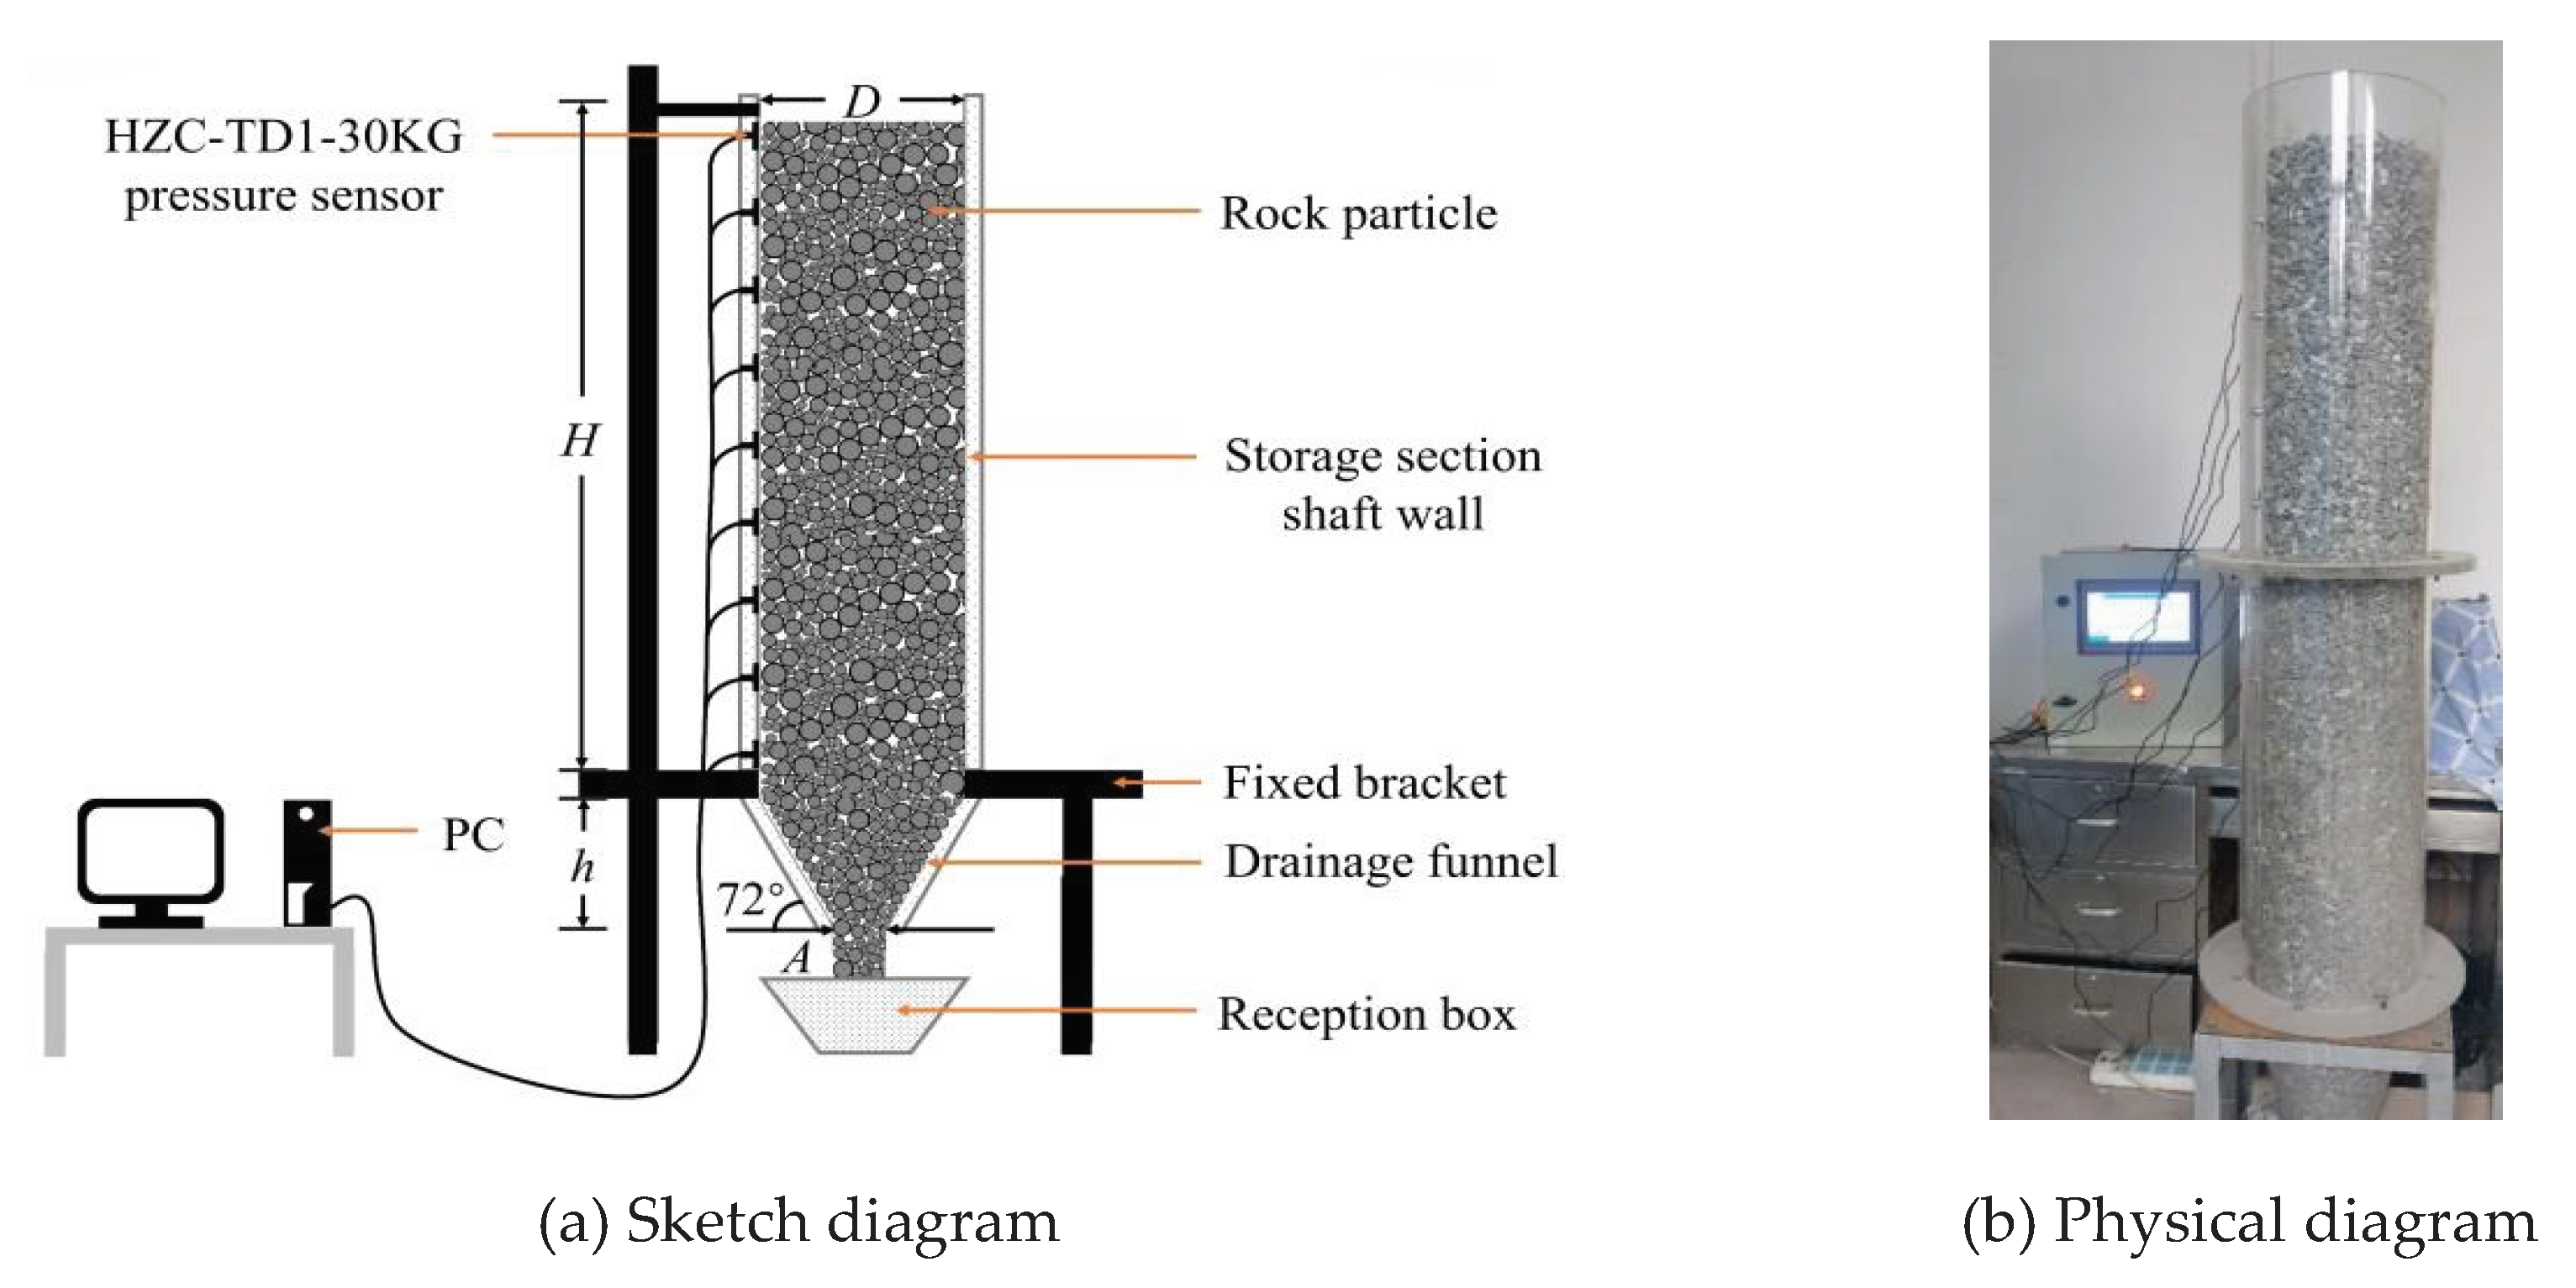
In order to simulate the actual size of the orepass, which is 32 m high, 6 m diameter, 6.4 m high drawing funnel, 3 m wide lower drawing mouth and 72° dip angle, combined with the actual geometric size and production conditions of the orepass, the geometric similarity ratio of 1:20 was selected to build the physical similarity experiment platform of central drawing. In the physical model, the height of the ore storage section H is 1.6 m, the diameter D is 0.3 m, the height of the ore drawing funnel h is 0.32 m, the width of the lower ore drawing port A is 0.15 m, and the inclination of the funnel is 72°, as shown in
Figure 2. In addition, before building the model, the inside of the acrylic silo is polished with sandpaper, in order to simulate the friction effect of the orepass on the ore-rock dispersion dispersion in the process of ore drawing.
According to the existing research results, for the central drawing model, there is little difference in the lateral pressure data on both sides of the orepass of the well wall [
22]. Therefore, in this paper, nine pressure sensors of HZC-TD1-30 KG are uniformly arranged along the geometric center line of the orepass on the left side of the well wall to record the change of the well wall lateral pressure in real time.
2. Construction of the Numerical Model
2.1. Determination of the Contact Model and Detailed Parameters
In the two-dimensional simulation of particle flow, particles are usually simplified as disc-shaped objects, which is the basis of model iterative calculation and the premise of mechanical balance. But the ore-rock particles in nature are mostly irregular blocks with sharp angles, using round particles to simulate the mechanical calculation between ore, often produce large errors. By adjusting the rolling friction coefficient between the particles and restricting the rotational ability of the particles, the result of approaching the irregular block motion can be achieved while shortening the model calculation time [
23,
24]. Based on this, in this paper, the built-in rotational resistance linear contact model and linear contact model of PFC are selected between ore-rock particles and between ore-rock and wall respectively.
On the basis of the linear contact model, the effective modulus , the normal and tangential stiffness ratio
and the anti-rotational friction coefficient of the particles are increased. Specifically, the effective modulus of the ore material is determined to be
at 350 Mpa according to the elastic modulus, and the normal and tangential stiffness ratio
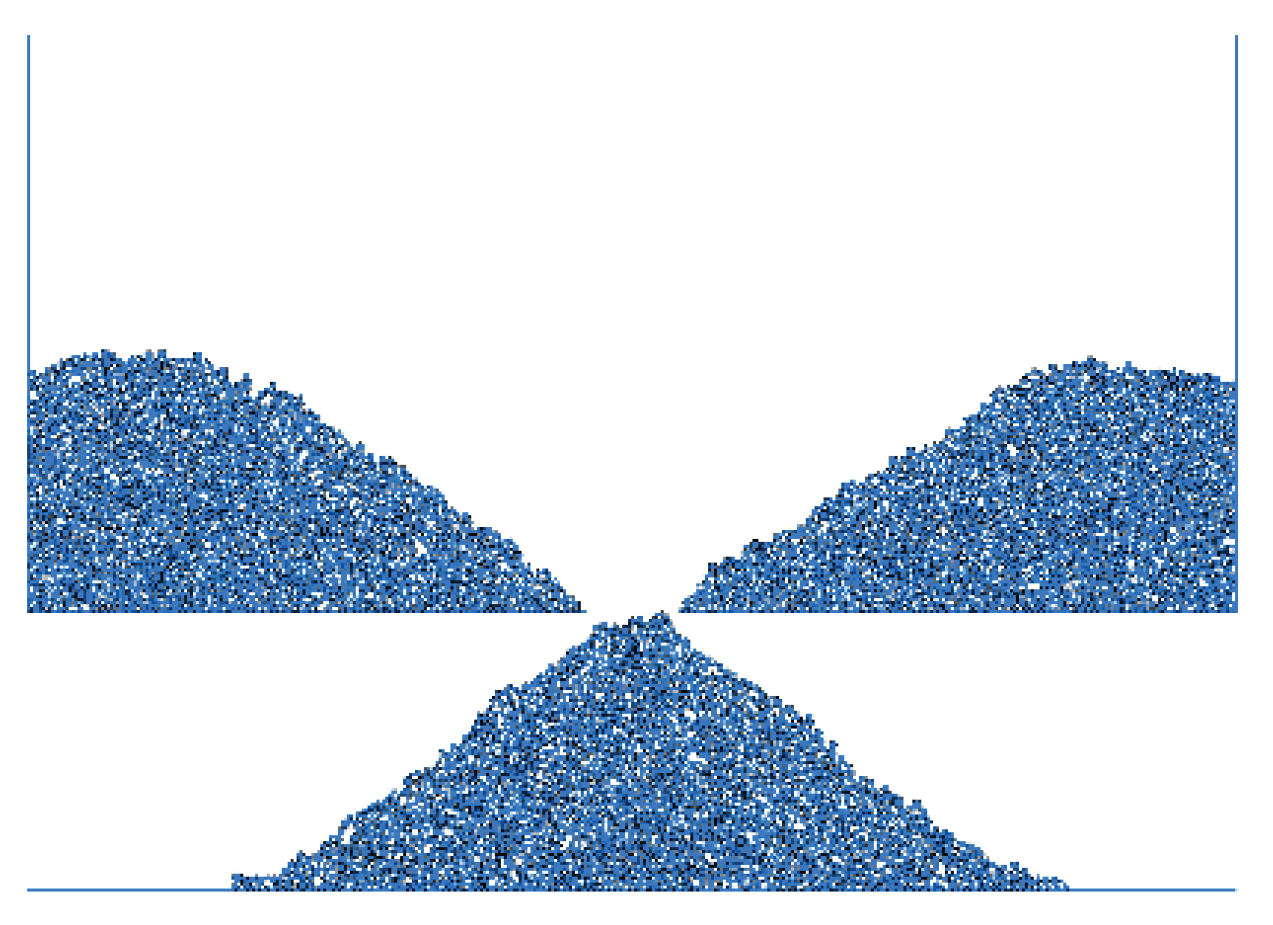
is 1.0. The collapse measurement model established by PFC was used, in order to determine the anti-rotational friction coefficient, which is based on the same value of the numerical model’s natural rerest angle and the physical test. After debugging the anti-rolling friction coefficient and different mesoscopic parameters for many times, the anti-rotational friction coefficient was finally determined to be 0.7. The collapse measurement model established is shown in
Figure 3, and the mesoscopic parameters after calibration are shown in
Table 2.
2.2. Establishment of the Numerical Model
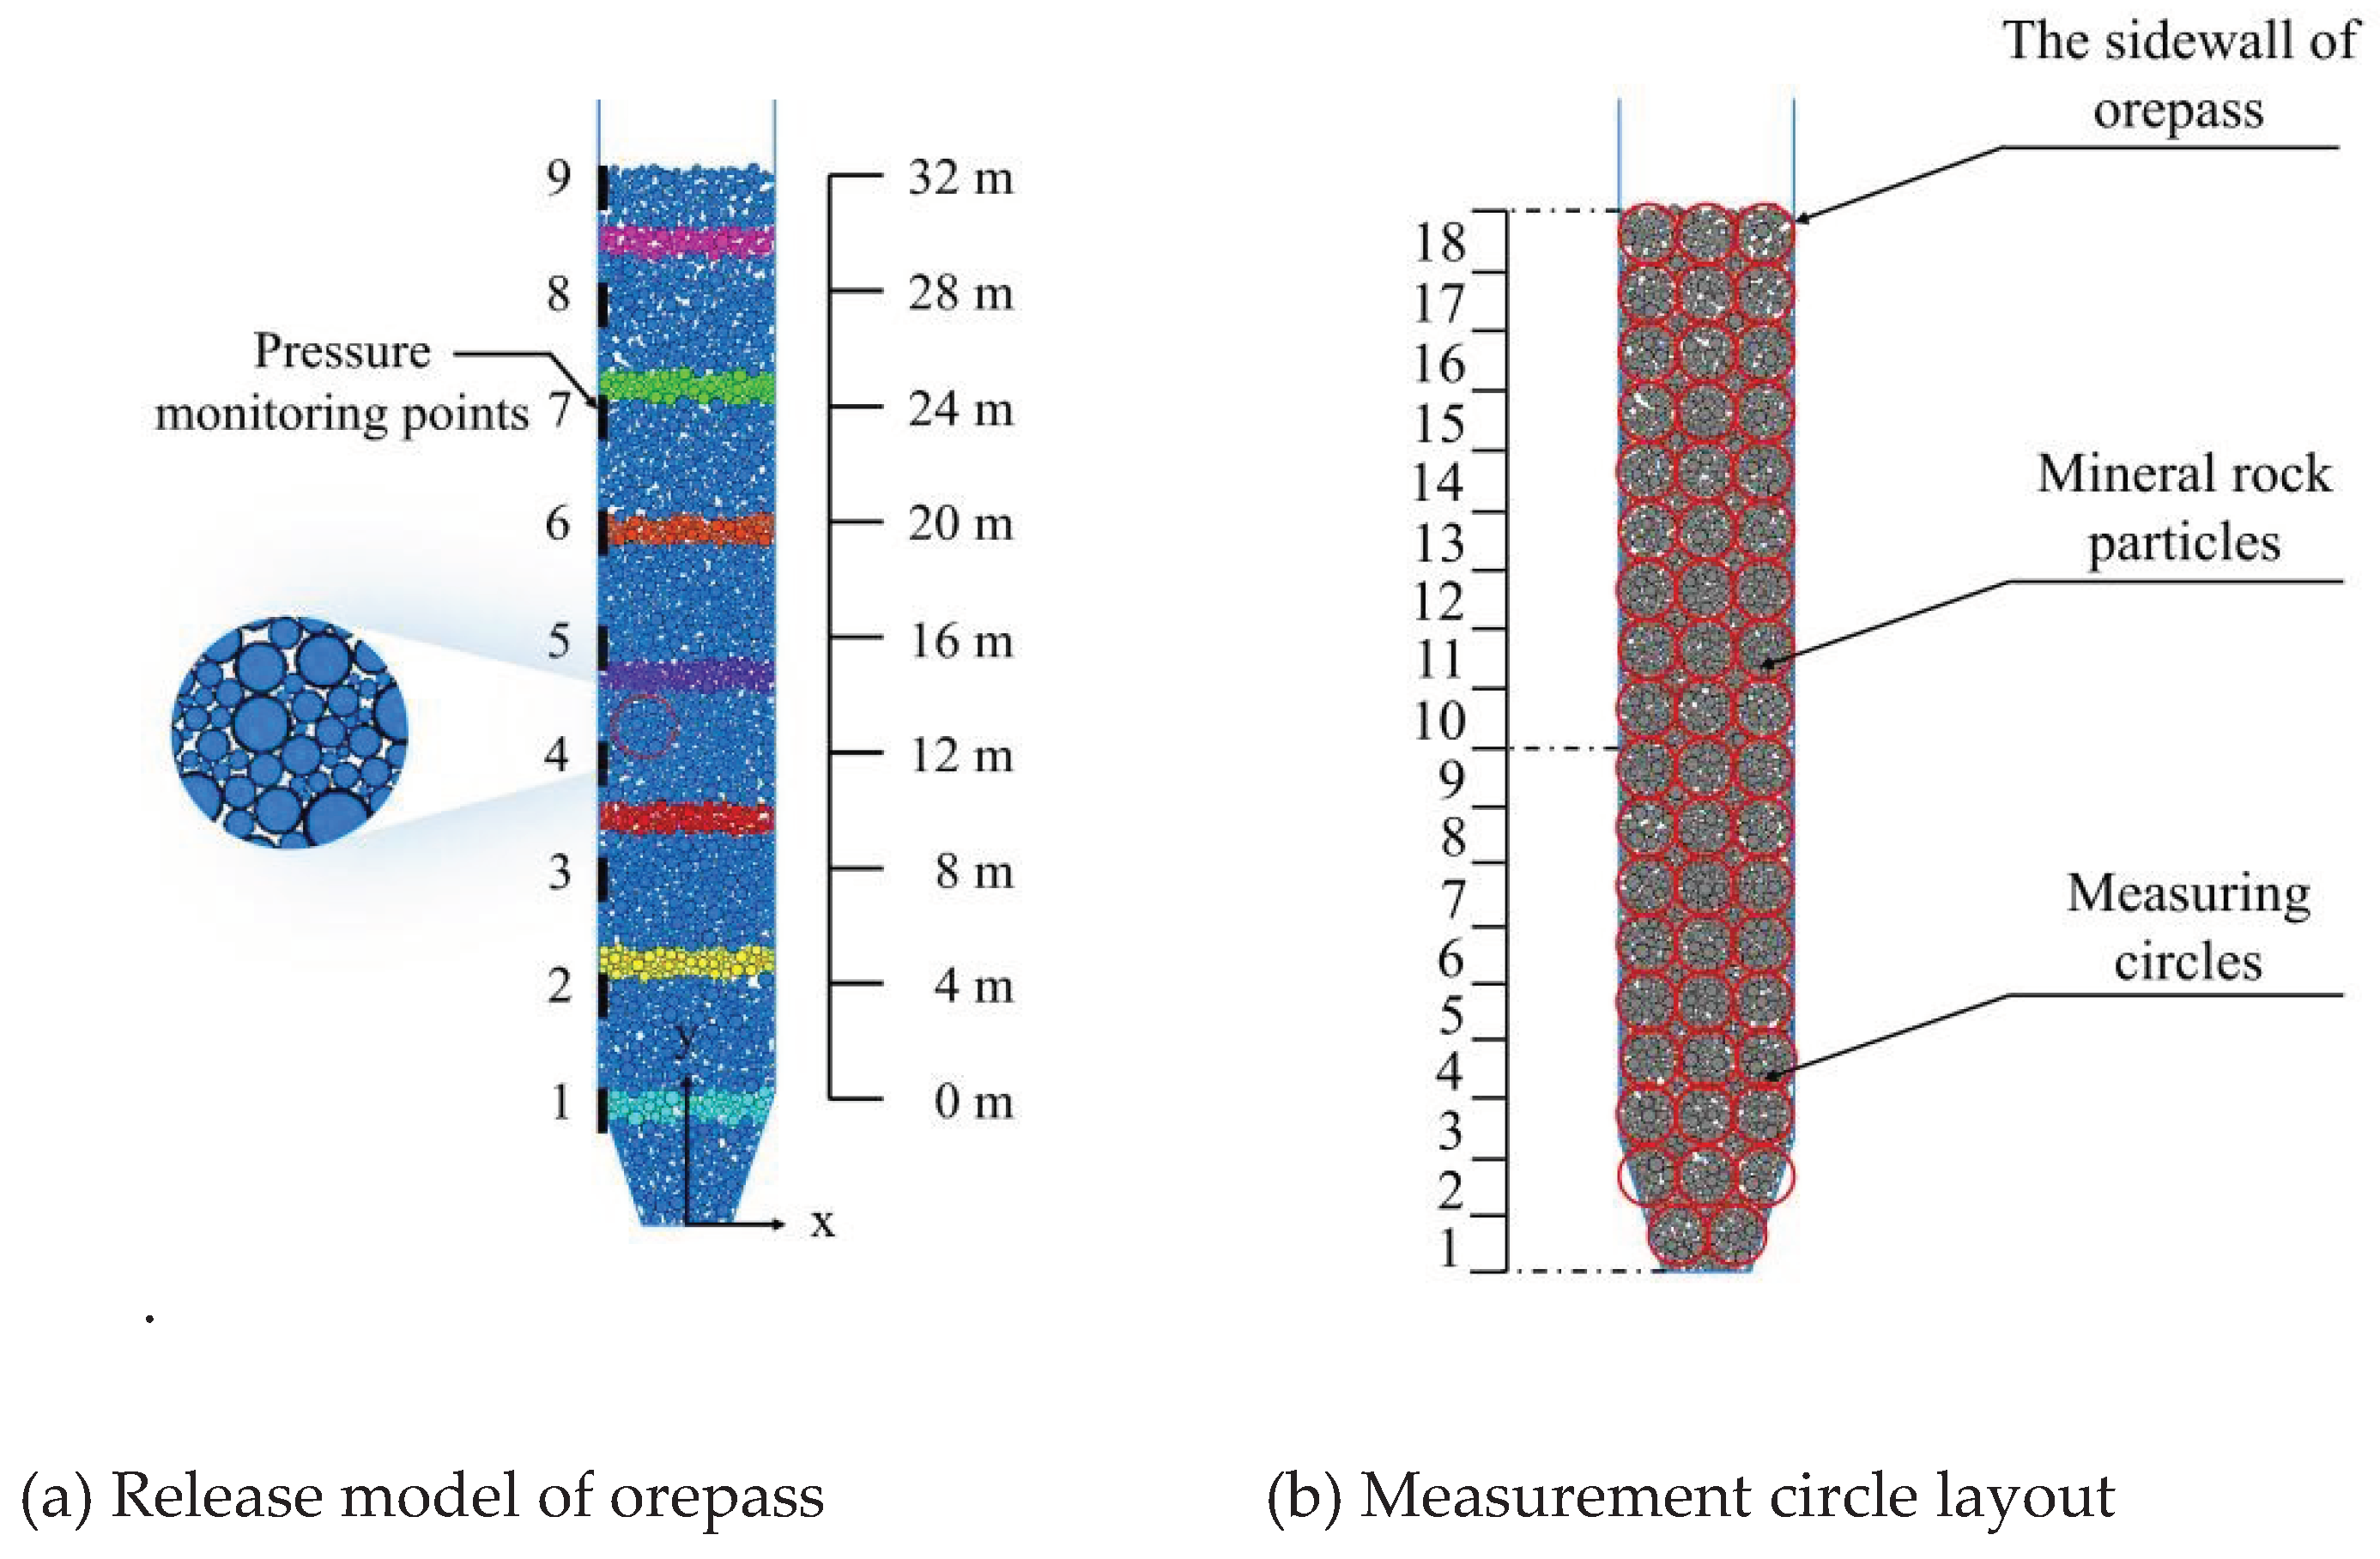
According to the actual orepass size, the numerical model is established. The center of the drawing outlet is the coordinate origin, and the total height of the ore storage section and drawing funnel is 38.4 m, in which the ore storage section is 32 m high, the drawing funnel is 6.4 m high, the diameter of the storage section is 6 m, and the inclination angle of the drawing funnel is 72°. In order to monitor the lateral pressure value of the well wall, 9 monitoring points are arranged along the left well wall at 4 m intervals, and are numbered as 1~ 9 from bottom to top. In order to observe the flow state of the ore-rock dispersion, the ore particles are marked every 4 m upward from the lower part of the ore storage section, and a total of 7 ribbons are marked, as shown in
Figure 4a.
In order to analyze the mechanical changes of ore-rock flow, the ore-rock stress is monitored by the method of measuring circle [
25,
26]. A total of 18 columns and 53 measurement circles are arranged in the orepass in the ore storage section from bottom to top. Columns 1 to 6 are called Group 1, 7 to 12 are called Group 2, and 13 to 18 are called Group 1. The radius of each measurement circle is set to 1 m. The surfer software was used to map the stress distribution of the Y side and the internal stress data of the circle to quantify the fine mechanical changes of the storage dispersion, as shown in
Figure 4b.
2.3. Reliability Analysis of the Numerical Models
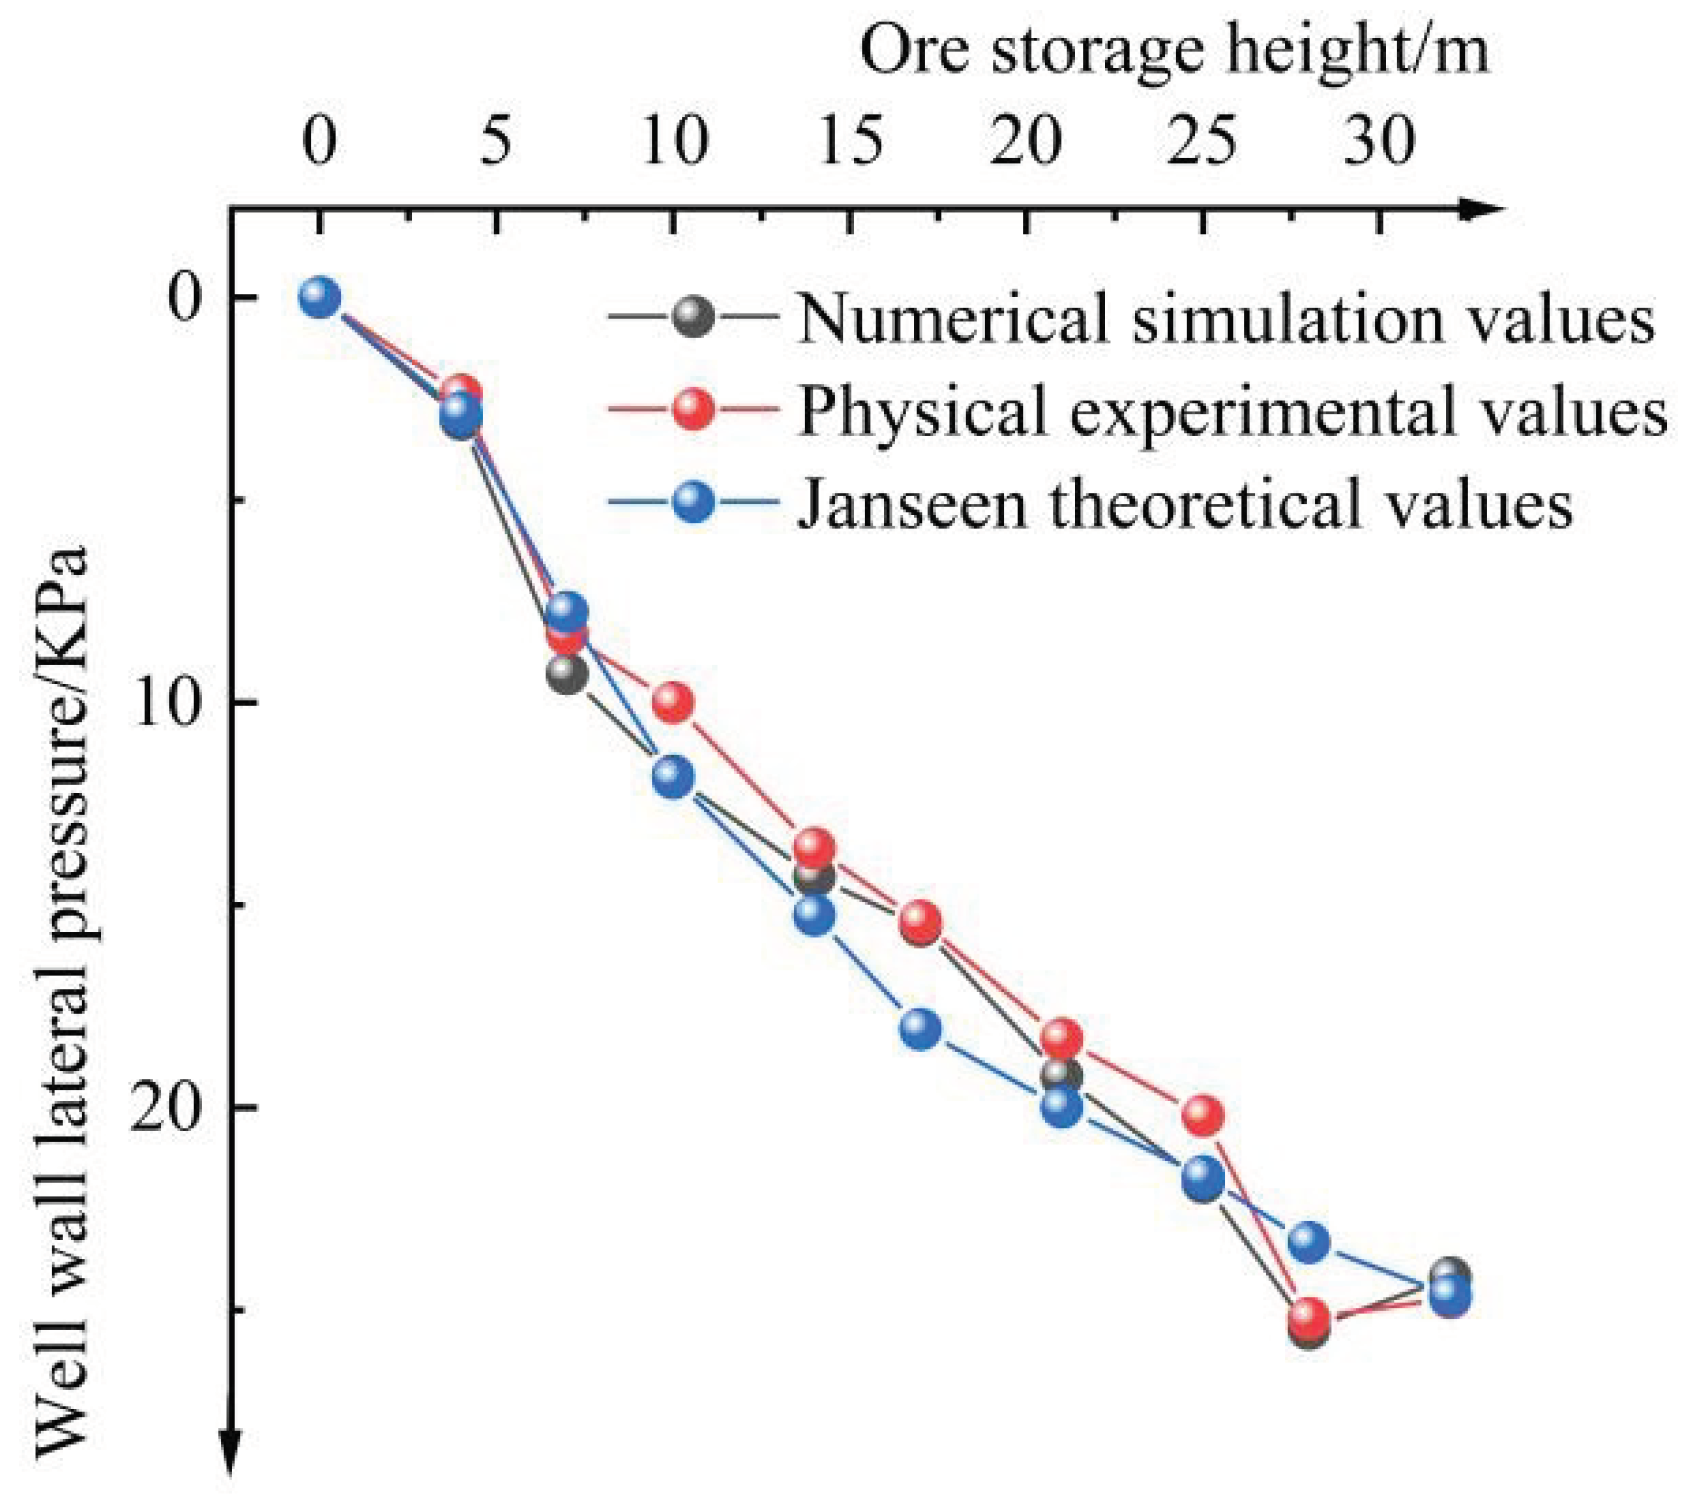
Figure 5 is the static lateral pressure value of the well wall, which is obtained by numerical simulation, that is compare with the physical similar experimental value and the theoretical calculation value [
27]. The static lateral pressure value of the well wall is calculated based on the Janseen theory. As can be seen from
Figure 5, the numerical simulation values, physical similar experimental values and the theoretical calculation values of the Janseen wall have good agreement. Based on the physical similarity experiment, it is found that the maximum error between the numerical simulation value and the theoretical value of Janseen formula is 11.8% and 18.1%, indicating that the numerical model has a certain reliability in the process of analyzing the characteristics of the pressure distribution on the side of the well.
3. Flow Characteristics and Stress Distribution of Ore-Rock Dispersion
3.1. Flow Characteristics of Ore-Rock Dispersion
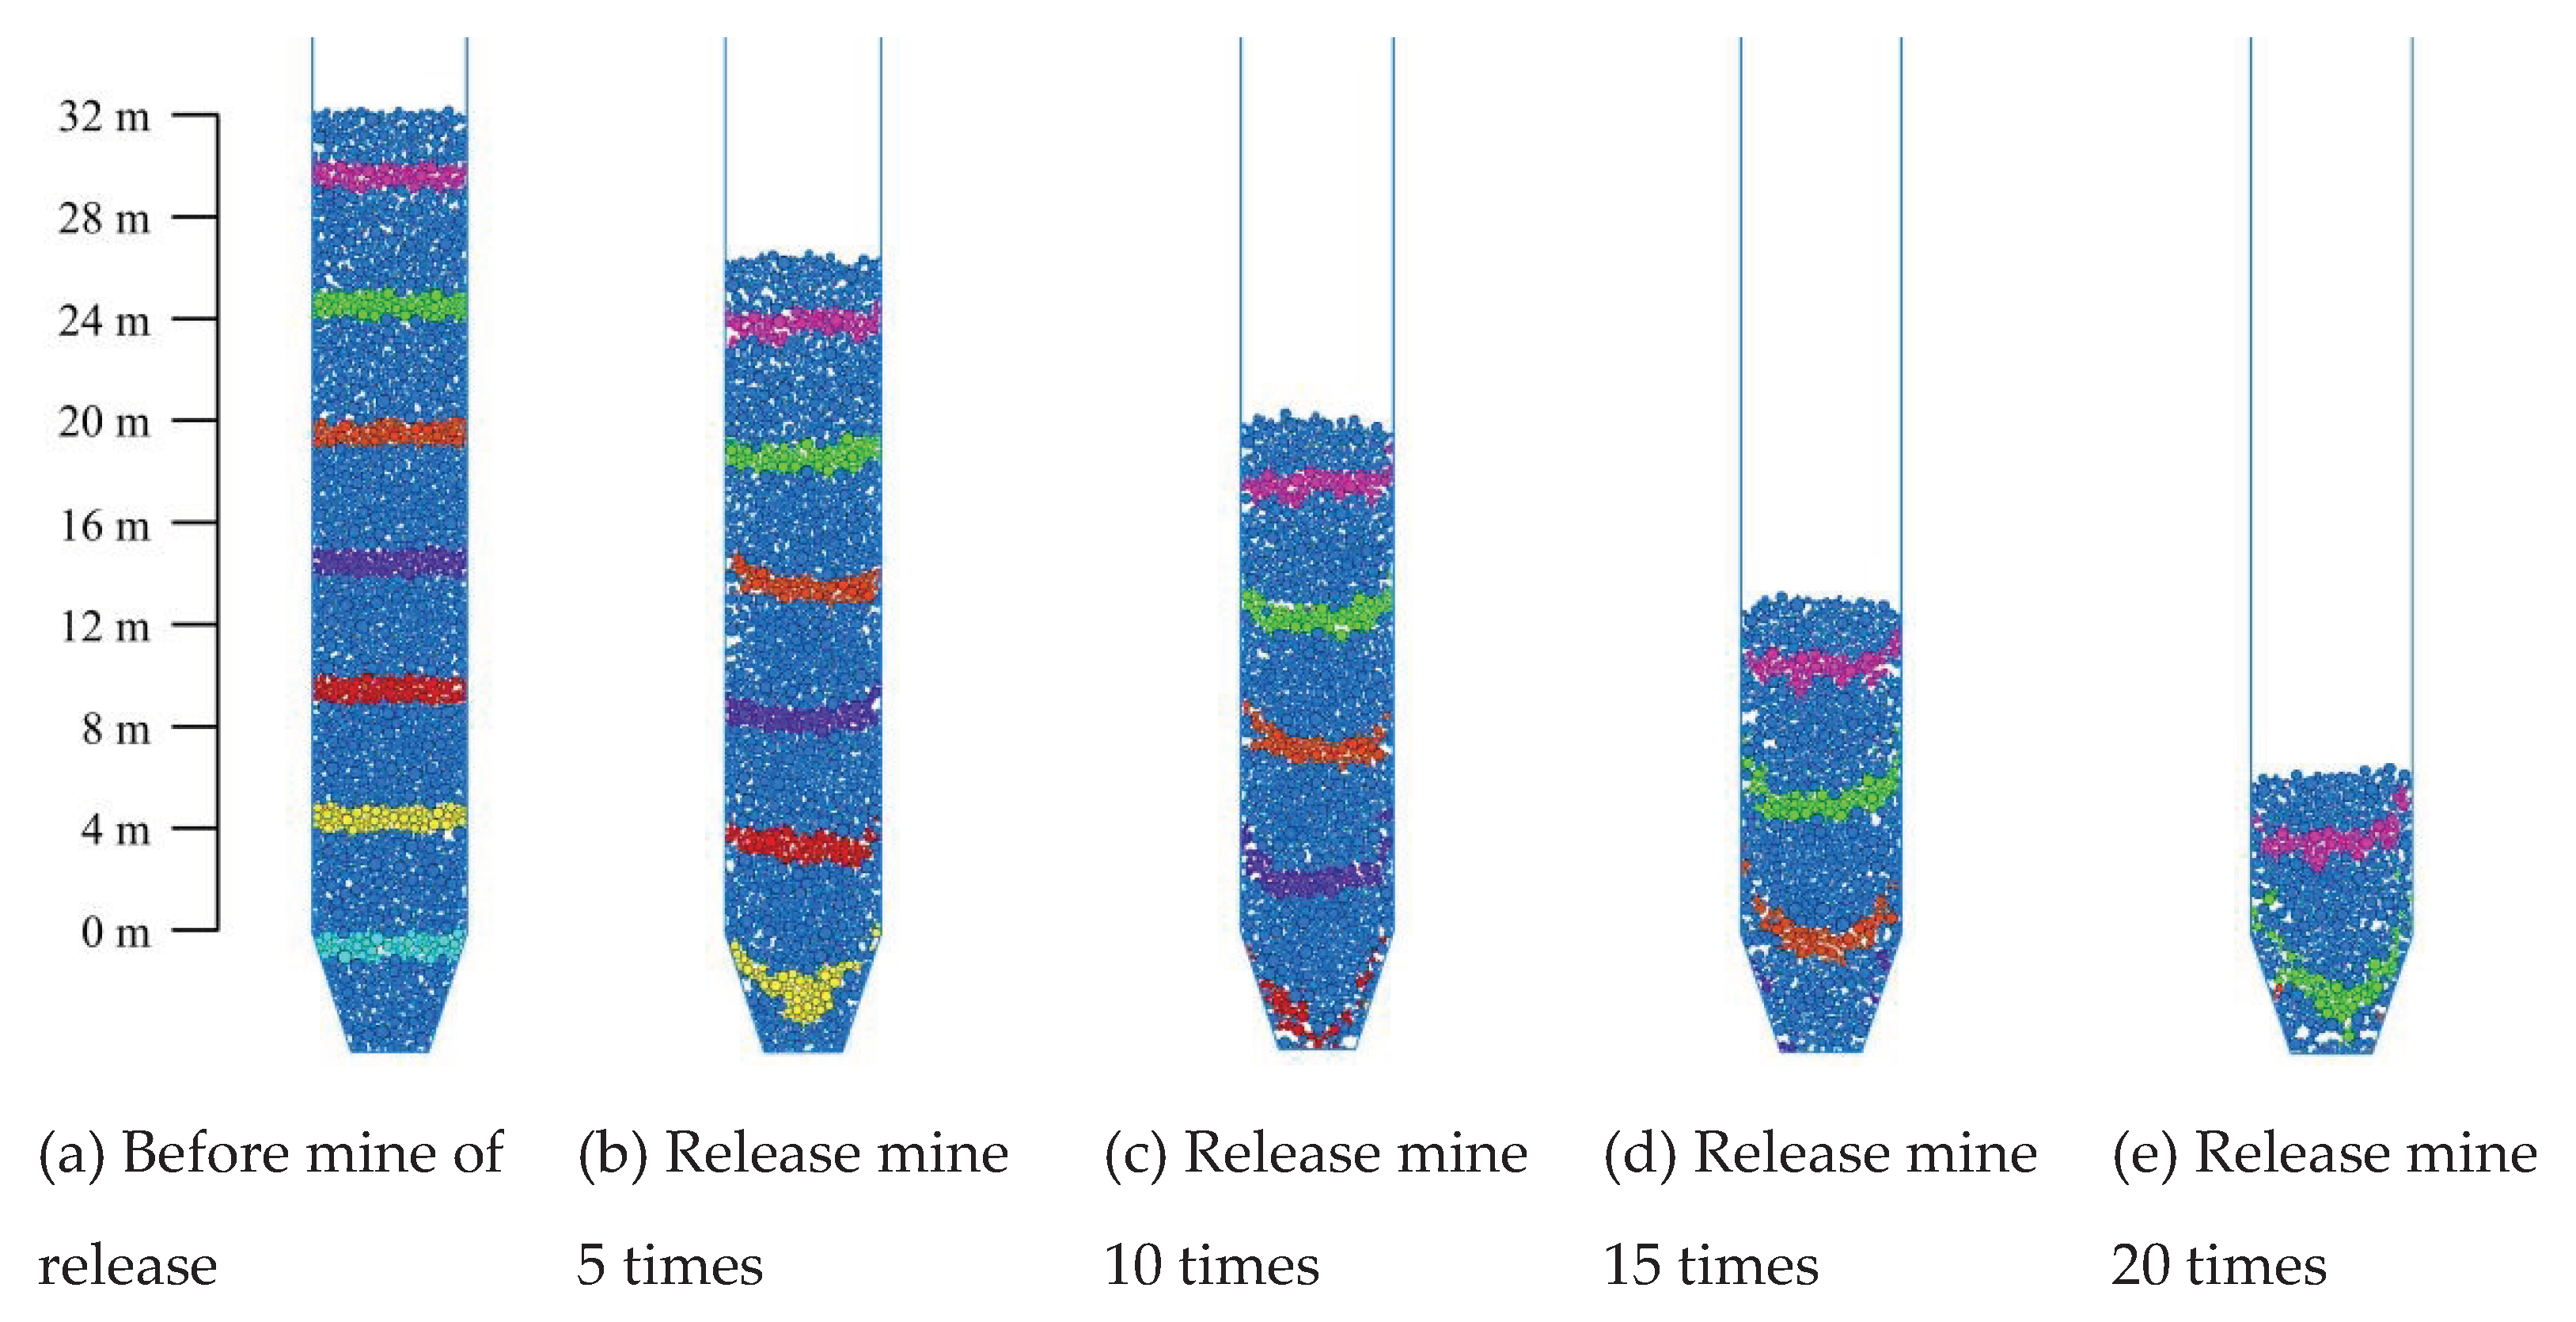
According to the actual process of ore drawing, numerical simulation of single drawing is carried out. Under the action of gravity, the storage dispersion is separated from the orepass system. When the release ore volume is greater than or equal to 5 m3, the bottom storage port is closed. When the storage dispersion reaches the internal force balance again, the single drawing work is over. Cycle the above steps in turn, and find that the ore-rock particles were completely separated from the orepass system when they were drawingd for 22 times. At this point, it is regarded as the end of the repeated ore drawing work. Due to the 21st drawing, the ore-rock particles near the pressure measuring point of no. 1 have been released. Therefore,
Figure 6 shows the macroscopic flow characteristics of ore-rock at 0~20 cyclic drawing.
Before ore drawing, because the stress between ore-rock particles is in a balanced state, there is no movement trend of rotation, slide or sliding, so that they maintain the original spatial form and arrangement. The ore-rock particles are evenly distributed on the inside of the storage section, and the particle marking belt of each layer is distributed with “one”. Initial ore drawing, the interaction between the particles and wall friction resistance, at the same time due to the outlet of the rock first release, release a certain space, the rock flow rate decreases with the distance, causing the silo internal rock present near the geometric center of the storage section rock flow rate, near the characteristics of the rock flow rate is small, makes the rock marking zone is a “U” type distribution. The mark band pattern within the height range of 0 m~10 m in the upper storage section of the drawing funnel is in the transition state of “one” distribution to “U” distribution. However, the marker bands within the height range of 10 m~24 m in the storage section are still distributed in the character “one”. With the increase of the number of ore drawing, the storage section of the inner rock marker bands show a “U” type distribution characteristics, due to the influence of the interaction between the wall and the particles of the adjacent rock, and the extra by the funnel boundary constraints, makes the drawing mouth’s ore-rock marker belt produced from “U” to “V” type distribution changes, and eventually to the “V” type flow characteristics.
3.2. Stress Distribution of the Ore-Rock Dispersion
3.2.1. Contact Density of Ore-Rock Dispersion
Coordination number (
) is the average contact number between ore-rock dispersion particles, which reflects the quality and density of the internal contact of ore-rock dispersion particles to a certain extent. Therefore, the evolution law of internal micromechanics in ore-rock particles flow process can be directly analyzed by analyzing coordination number [
28]. The formula for calculating coordination number is as follows [
29]:
where NC is the actual contact number of dispersion particles (normal contact force greater than 0). NP is the total number of particles in the dispersion.
It is worth noting that when the number of contacts of a single particle is only 1 or there is no neighboring particle contacting with it, it is regarded as not contributing to the fine mechanics of the whole dispersion system and should be ignored. To facilitate the statistics of the change of coordination number in each layer, the average value of coordination number 𝑍
𝑎 is introduced, and the calculation formula is as follows:
According to the average value of coordination 𝑍
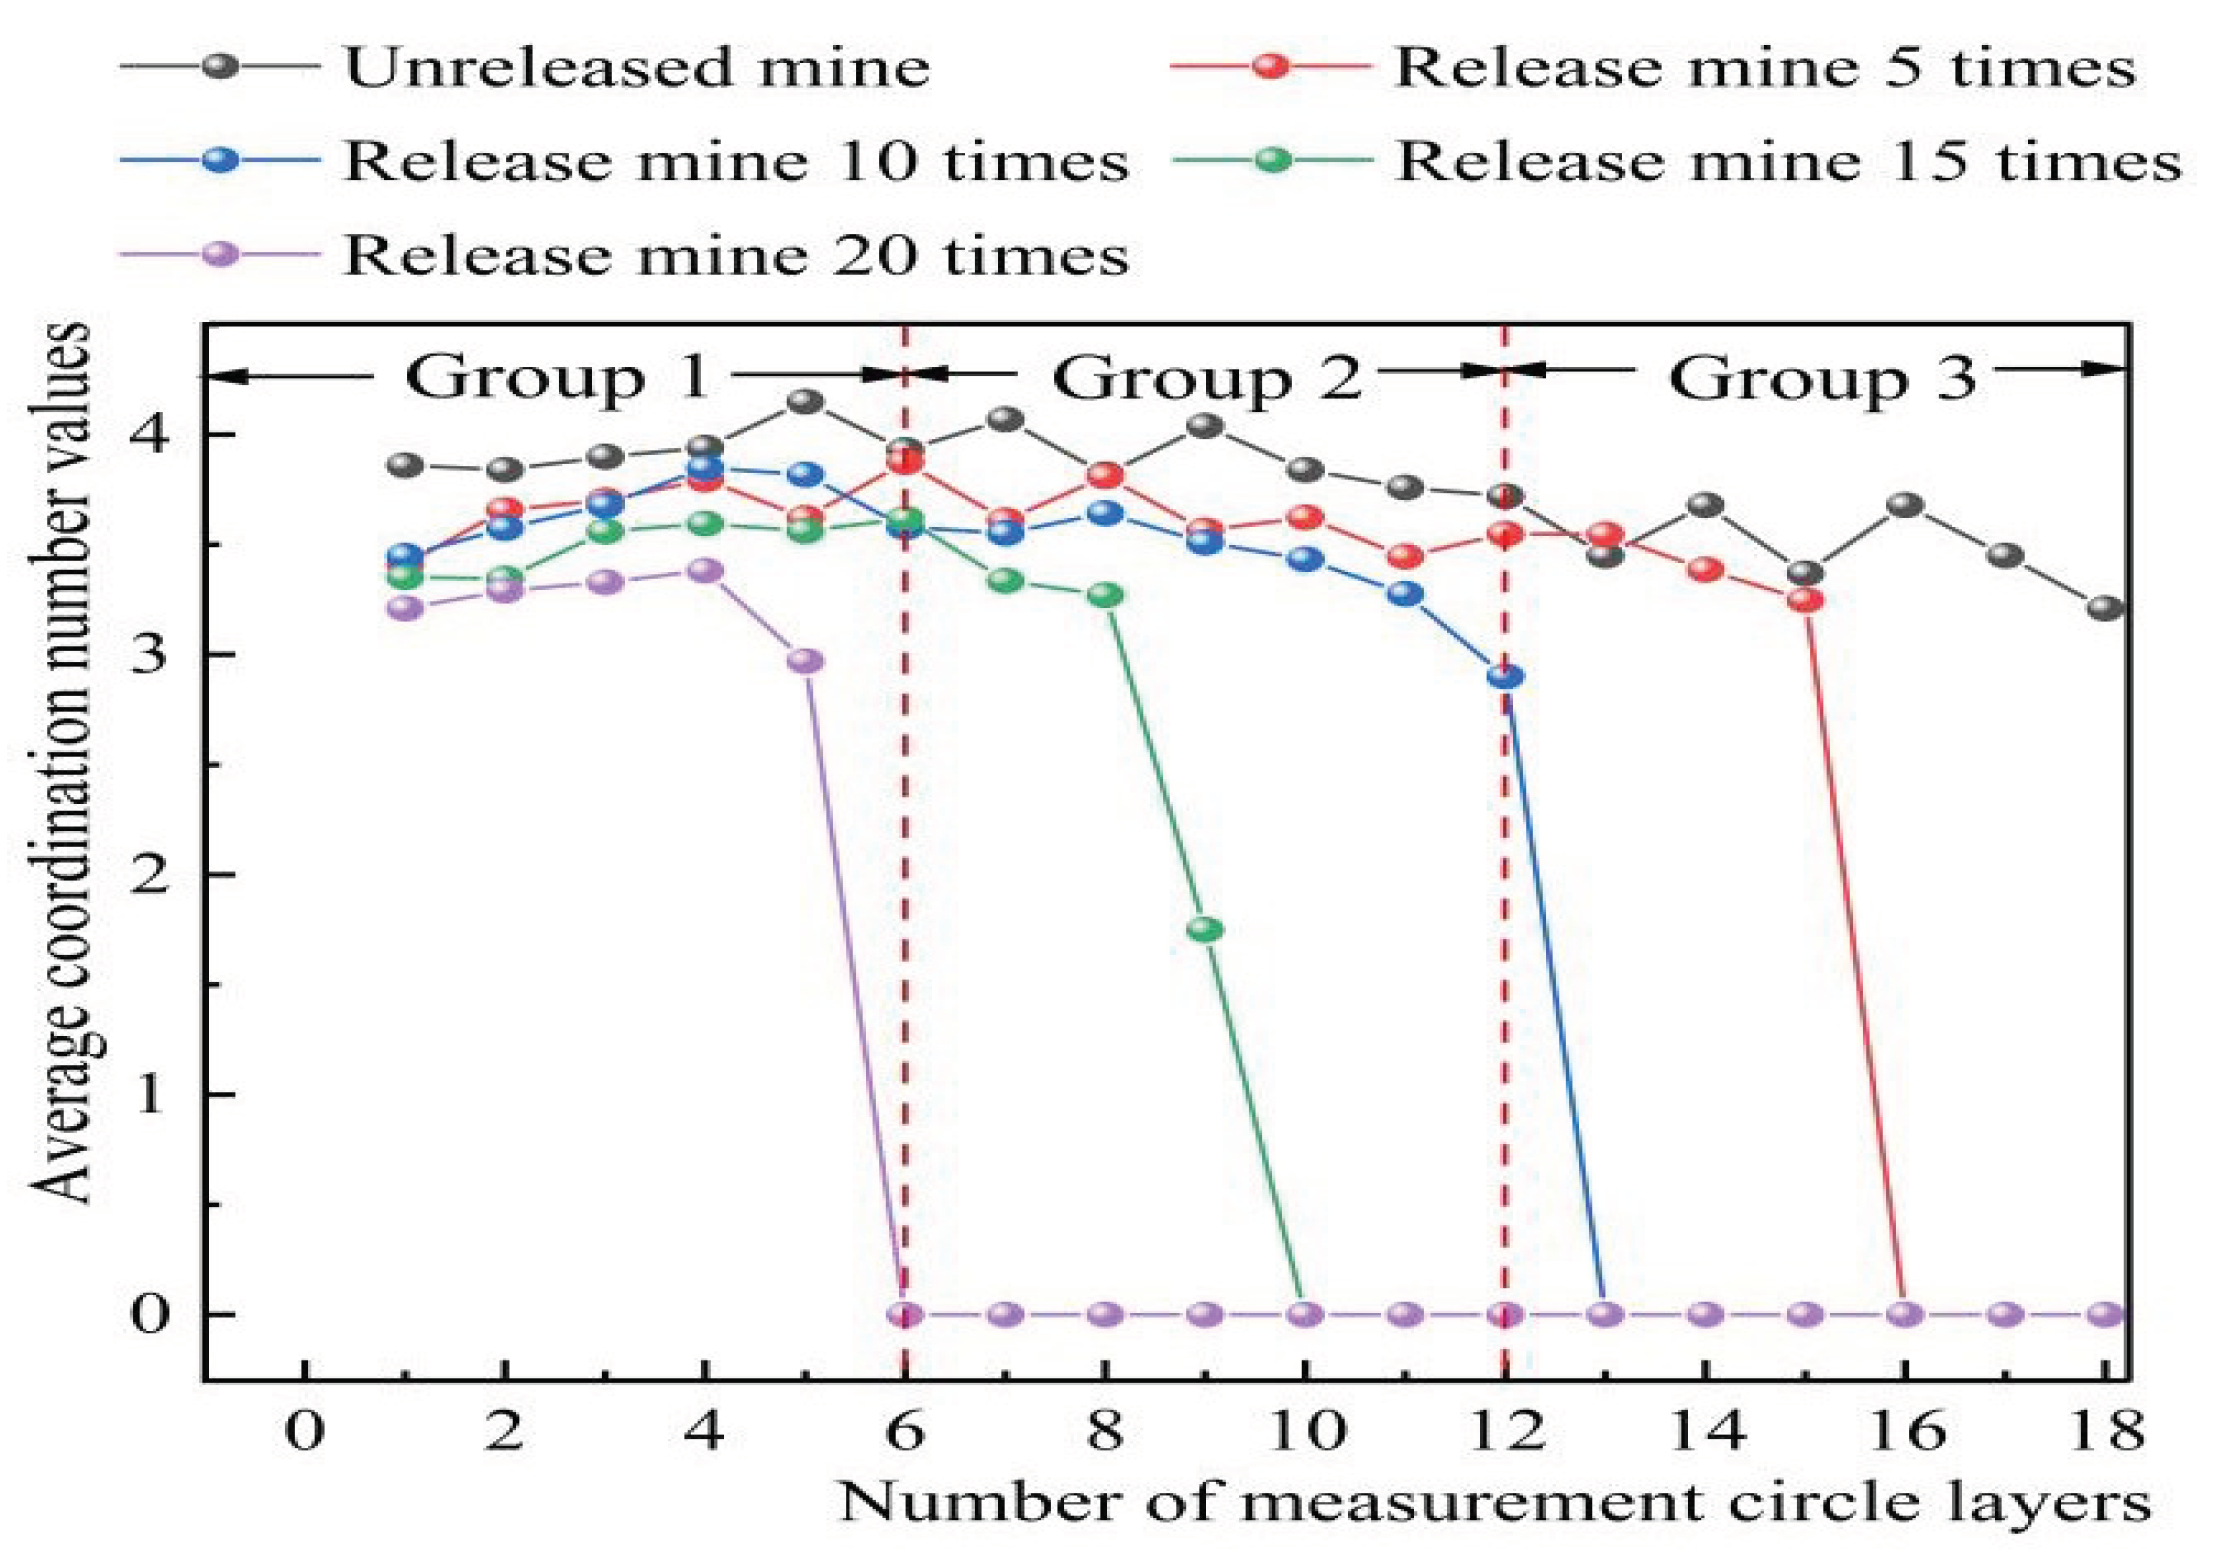
𝑎 obtained by monitoring, the change curve of the average value of each layer of ore-rock particles at different drawing times was drawn. The coordination number of 1~6 measured circles was divided into group 1, the coordination number of 7~12 measuring circles was divided into group 2, and the coordination number of 13~18 measuring circles was divided into group 3, as shown in
Figure 7. In the whole process of ore drawing, there are some differences in the average value of coordination number at different positions within the dispersion, but due to the influence of gravity, the closer to the bottom of the well, the larger the average value of coordination number is, which also indicates that the ore-rock dispersion will become more dense. As can be seen from
Figure 7, before the start of ore drawing, the average coordination number of group 1 to 3 is about 3.84~4.15, 3.72~ 3.2~4.05 and 3.21~3.68 respectively. The fluctuation rule of coordination number is group 3 > group 2 > group 1, while the corresponding value of the coordination number of each group is opposite to its fluctuation rule. When the ore was drawingd for 5 times, the value of the first group gradually increased from 3.41 to 3.87, and the value of the second group was similar to the change law of the storage, all fluctuating, and the value of the third group decreased rapidly from 3.54 to 0. When mining for 10 times, the value of group 1 increased from 3.44 to 3.85, and the value of group 2 and group 3 decreased exponentially with the increase of the number of measured circles, and finally stabilized at around the 0 value. With the increase of the number of ore drawing, the change rule of the coordination number of each group is almost consistent, decreasing exponentially to 0. From the above analysis, the group 1 number measuring position of the round in the whole process by the 2,3 groups of rock weight and flow of inertia force, make it produce the coordination number fluctuation type increase phenomenon, that the area of the ore-rock particles by loose, small contact strength to contact dense, contact strength of development. Set 2 where the measuring circle position is affected by the ore rock release, make the area of the coordination number is lower than the group 1 number value, that within the circle of the group 2 round ore-rock particles by loose contact, small contact strength to contact dense, contact strength state development, but its compaction degree than group 1. The location of the measurement circle in the third group is preferentially affected by the release of the ore-rock (the height of the ore-rock drops), resulting in no ore-rock above the area. Therefore, the coordination number of the third group measurement circle gradually decreases since the beginning of the drawing.
3.2.2. Stress Distribution Characteristics of Ore Rock Dispersion
Stress distribution cloud map is a common method used to intuitively analyze the characteristics of stress changes within the dispersion [
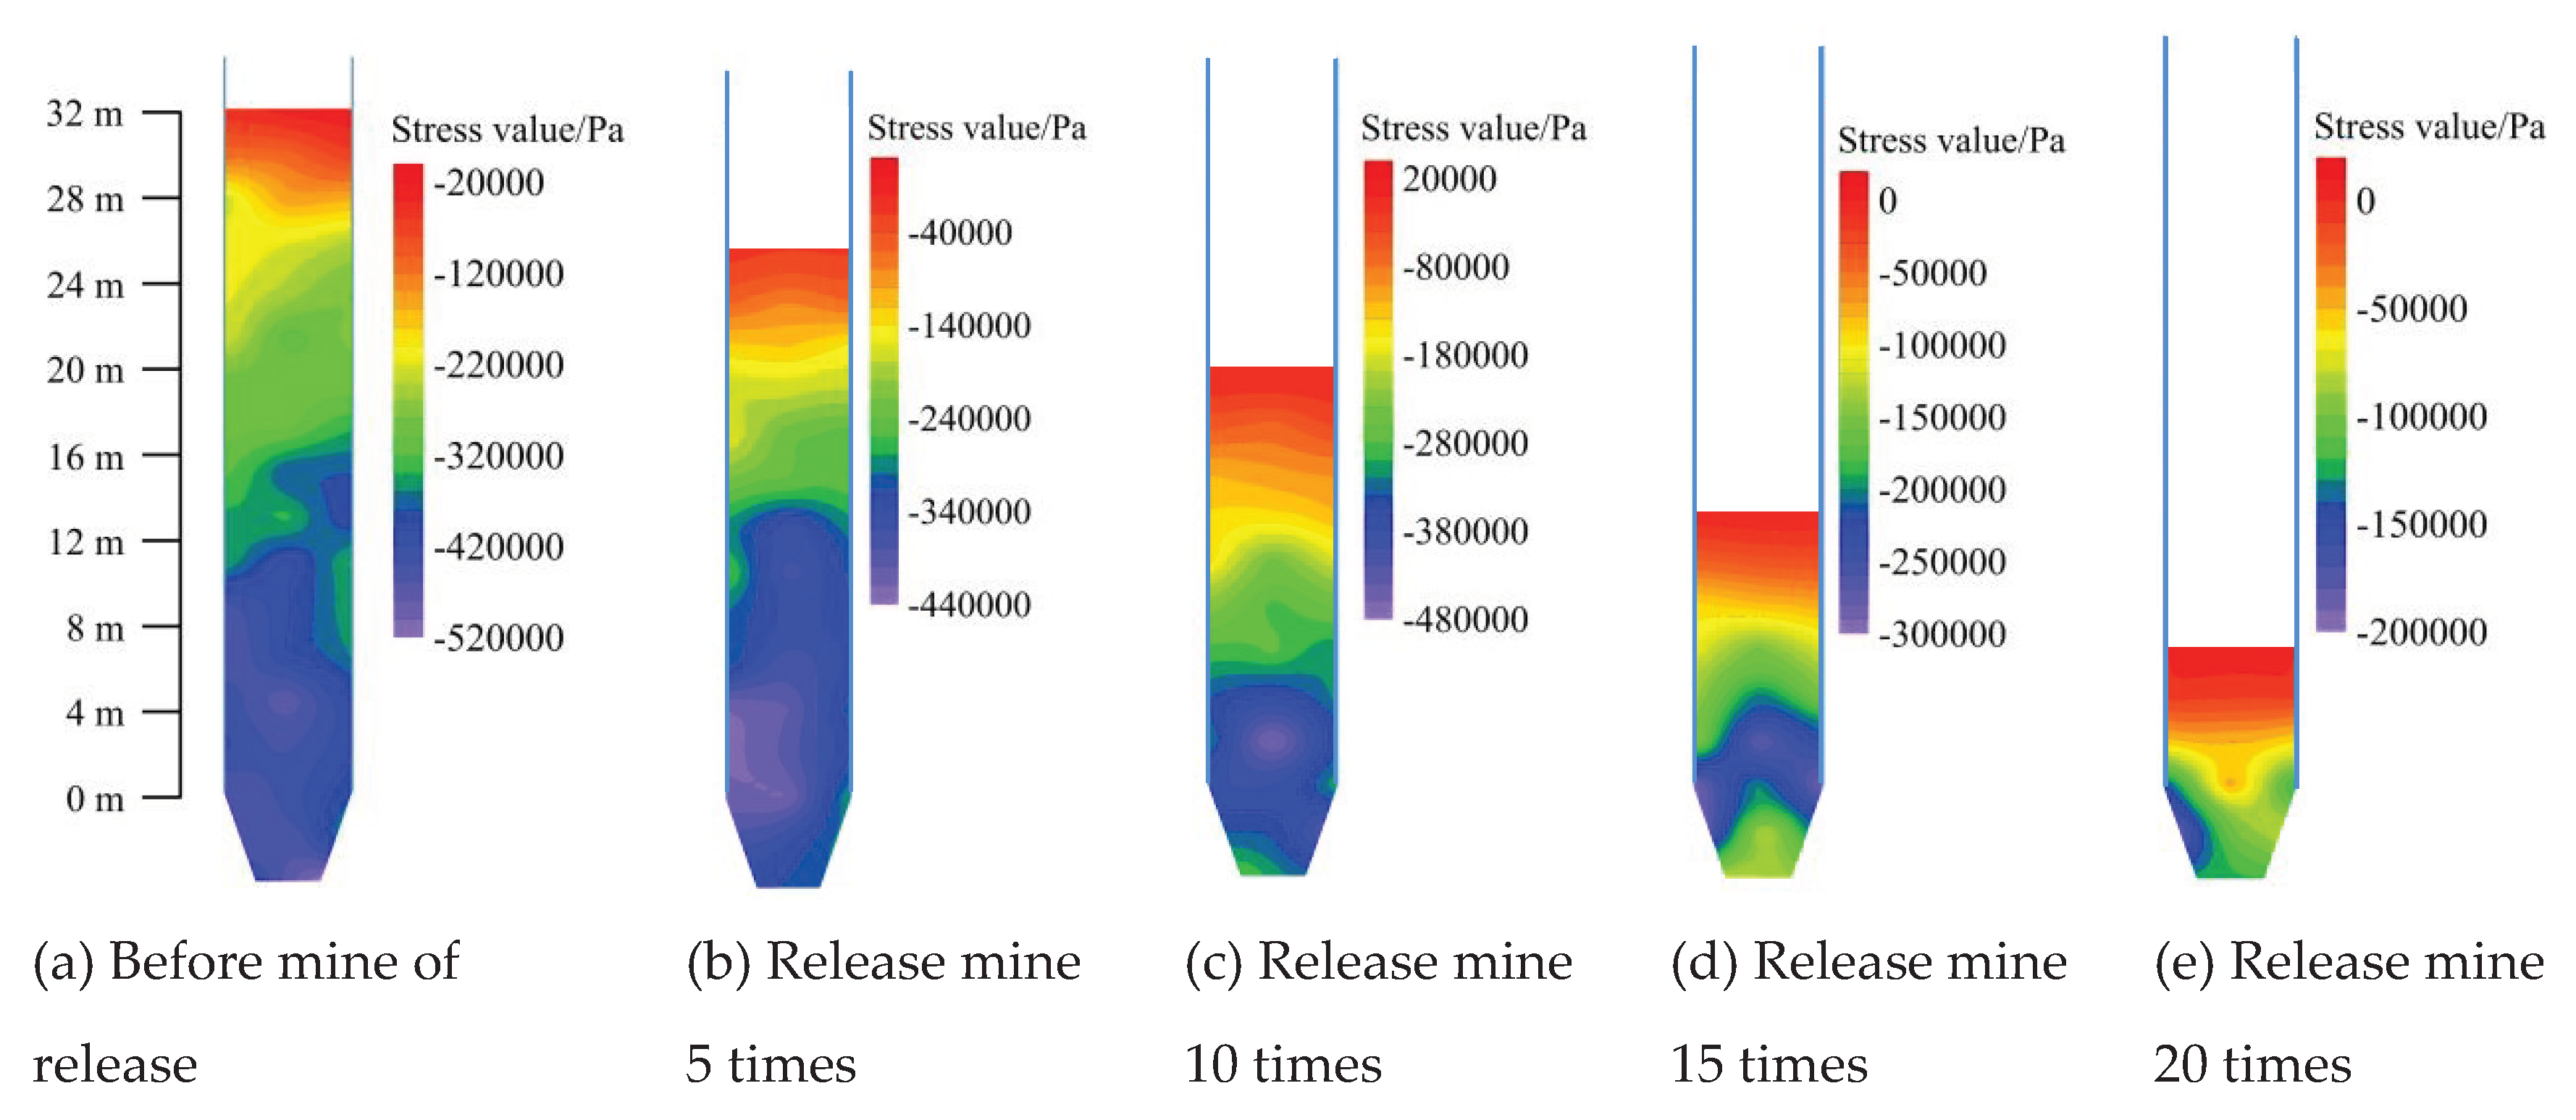
25]. The cloud map of the stress distribution is plotted according to the data measured by the stress measurement circle, as shown in
Figure 8. Before the drawing, the ore-rock dispersion within 0~16 m produces a large stress concentration phenomenon, and the stress value of the ore-rock in the wellbore increases with the increase of the shaft depth. When ore storage is performed for 5 times, the stress value of the ore-rock in the wellbore decreased to different degrees, that is, the high stress (blue) area of the storage section decreased, indicating that the decrease of the total amount of ore-rock in the wellbore is the main reason for the change of ore-rock stress and the decrease of the high stress area. With the increase of the number of drawing, the total amount of ore in the well is constantly decreasing, and the high stress concentration area of the storage section is gradually reduced from the range of 0~16 m to the drawing funnel. When the ore-rock in the shaft is completely separated from the orepass system, the high stress area in the reservoir section completely disappears. It is worth noting that in the whole process of ore drawing, the range of high stress concentration area although as the decrease of total rock reduced, the storage section elevation within 0~16 m and the main funnel is the high stress concentration area, because this area is the main high stress concentration area, which leads to the area will bear large stress, easy to produce a large number of fine cracks, and cause wall damage.
3.2.3. Contact Force Evolution Characteristics of Ore-Rock Dispersion
As a macroscopic expression of microscopic contact force, the force chain can reflect the microscopic mechanical behavior of ore-rock particles [
10,
30]. However, due to the inhomogeneity of the spatial distribution of contact force between ore-rock particles, it is very challenging to directly characterize the evolution of contact force network quantitatively, and the application of contact force probability distribution curve (PDF) can reflect the distribution of contact force between particles from the perspective of contact force [
31]. Taking the total interparticle contact force F as an example, the normal, tangential contact force vector and average contact force (fn) of any particle i in the ore rock are normalized. The calculation formula is as follows [
32]:
Where: f is the normalized processing result of the total contact force, (fn) is the average contact force, where, i is the random particle number, is the total number of particles.
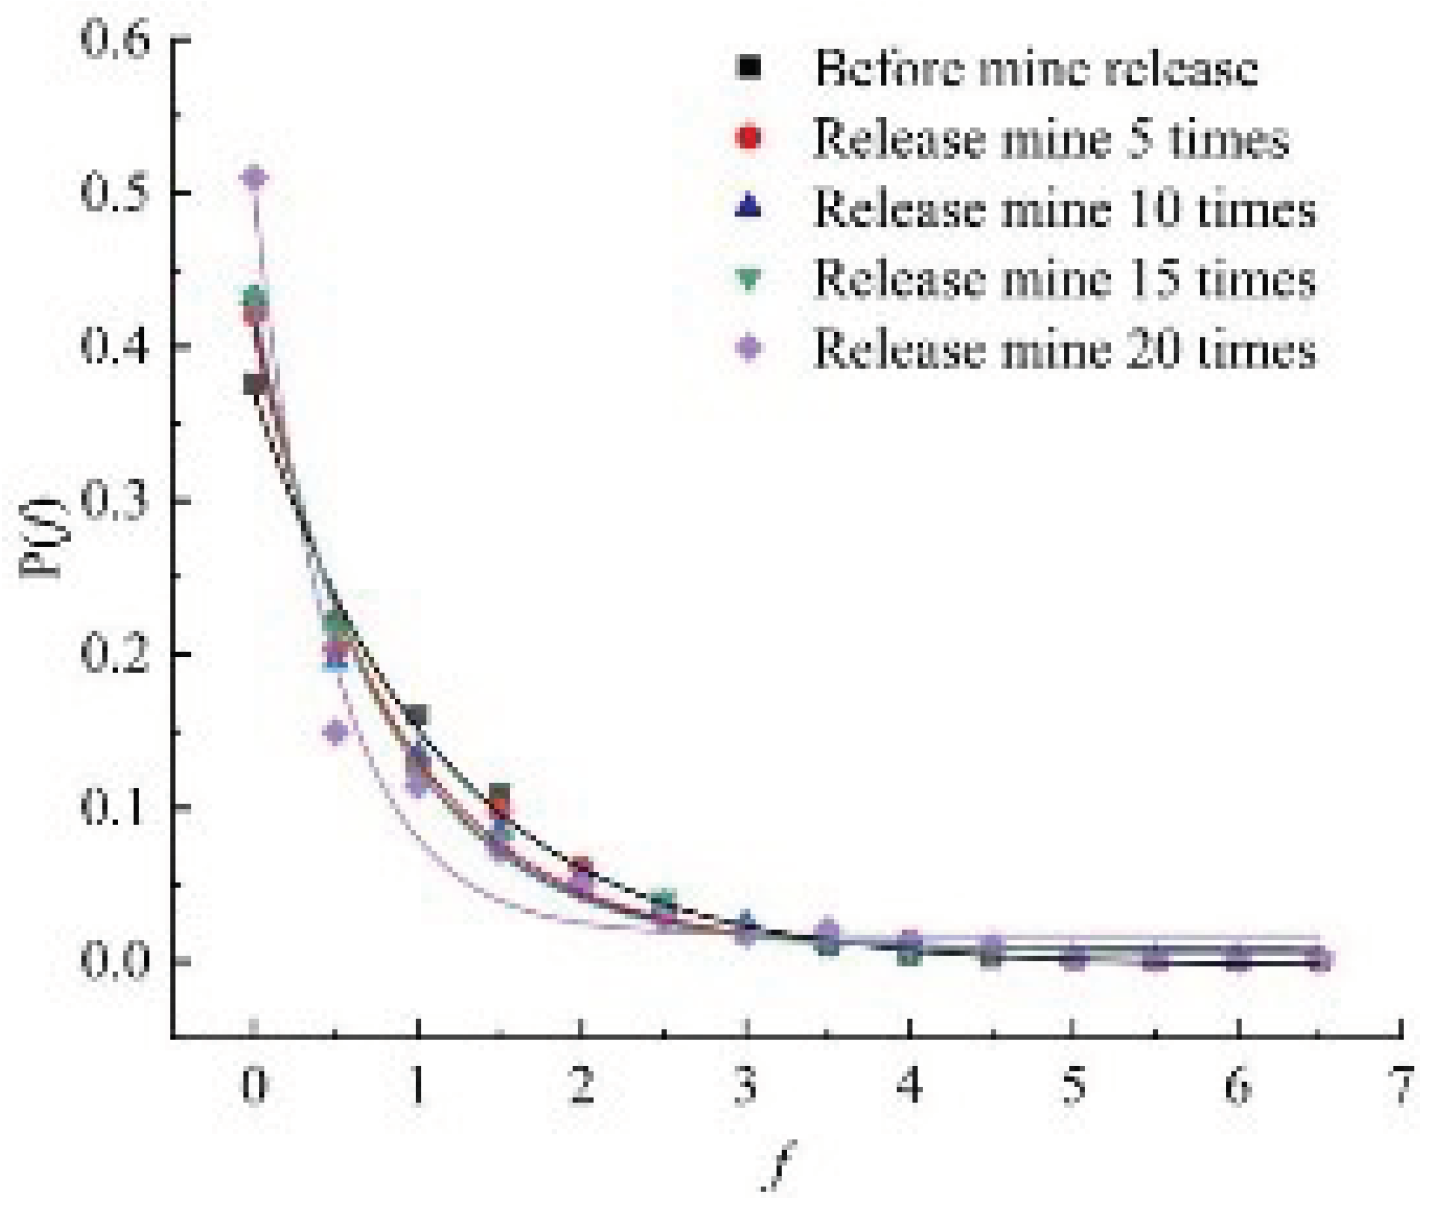
Based on formula (3),
f is divided into several intervals at 0.5, and the number of contact forces in each interval is counted separately, and the contact force probability distribution curve is obtained, as shown in
Figure 9. The normalized distribution of contact force strength decreased exponentially, indicating that the ore-rock flow in the drawing process has a significant effect on the PDF between particles. Furthermore, the exponential function
of was fitted according to the varying characteristics of the PDF, and the fitted contact force probability distribution function is shown in
Table 3. As can be seen from the table, each fitting coefficient 𝑅
2 is greater than 0.97, indicating that the contact force probability distribution function fits well.
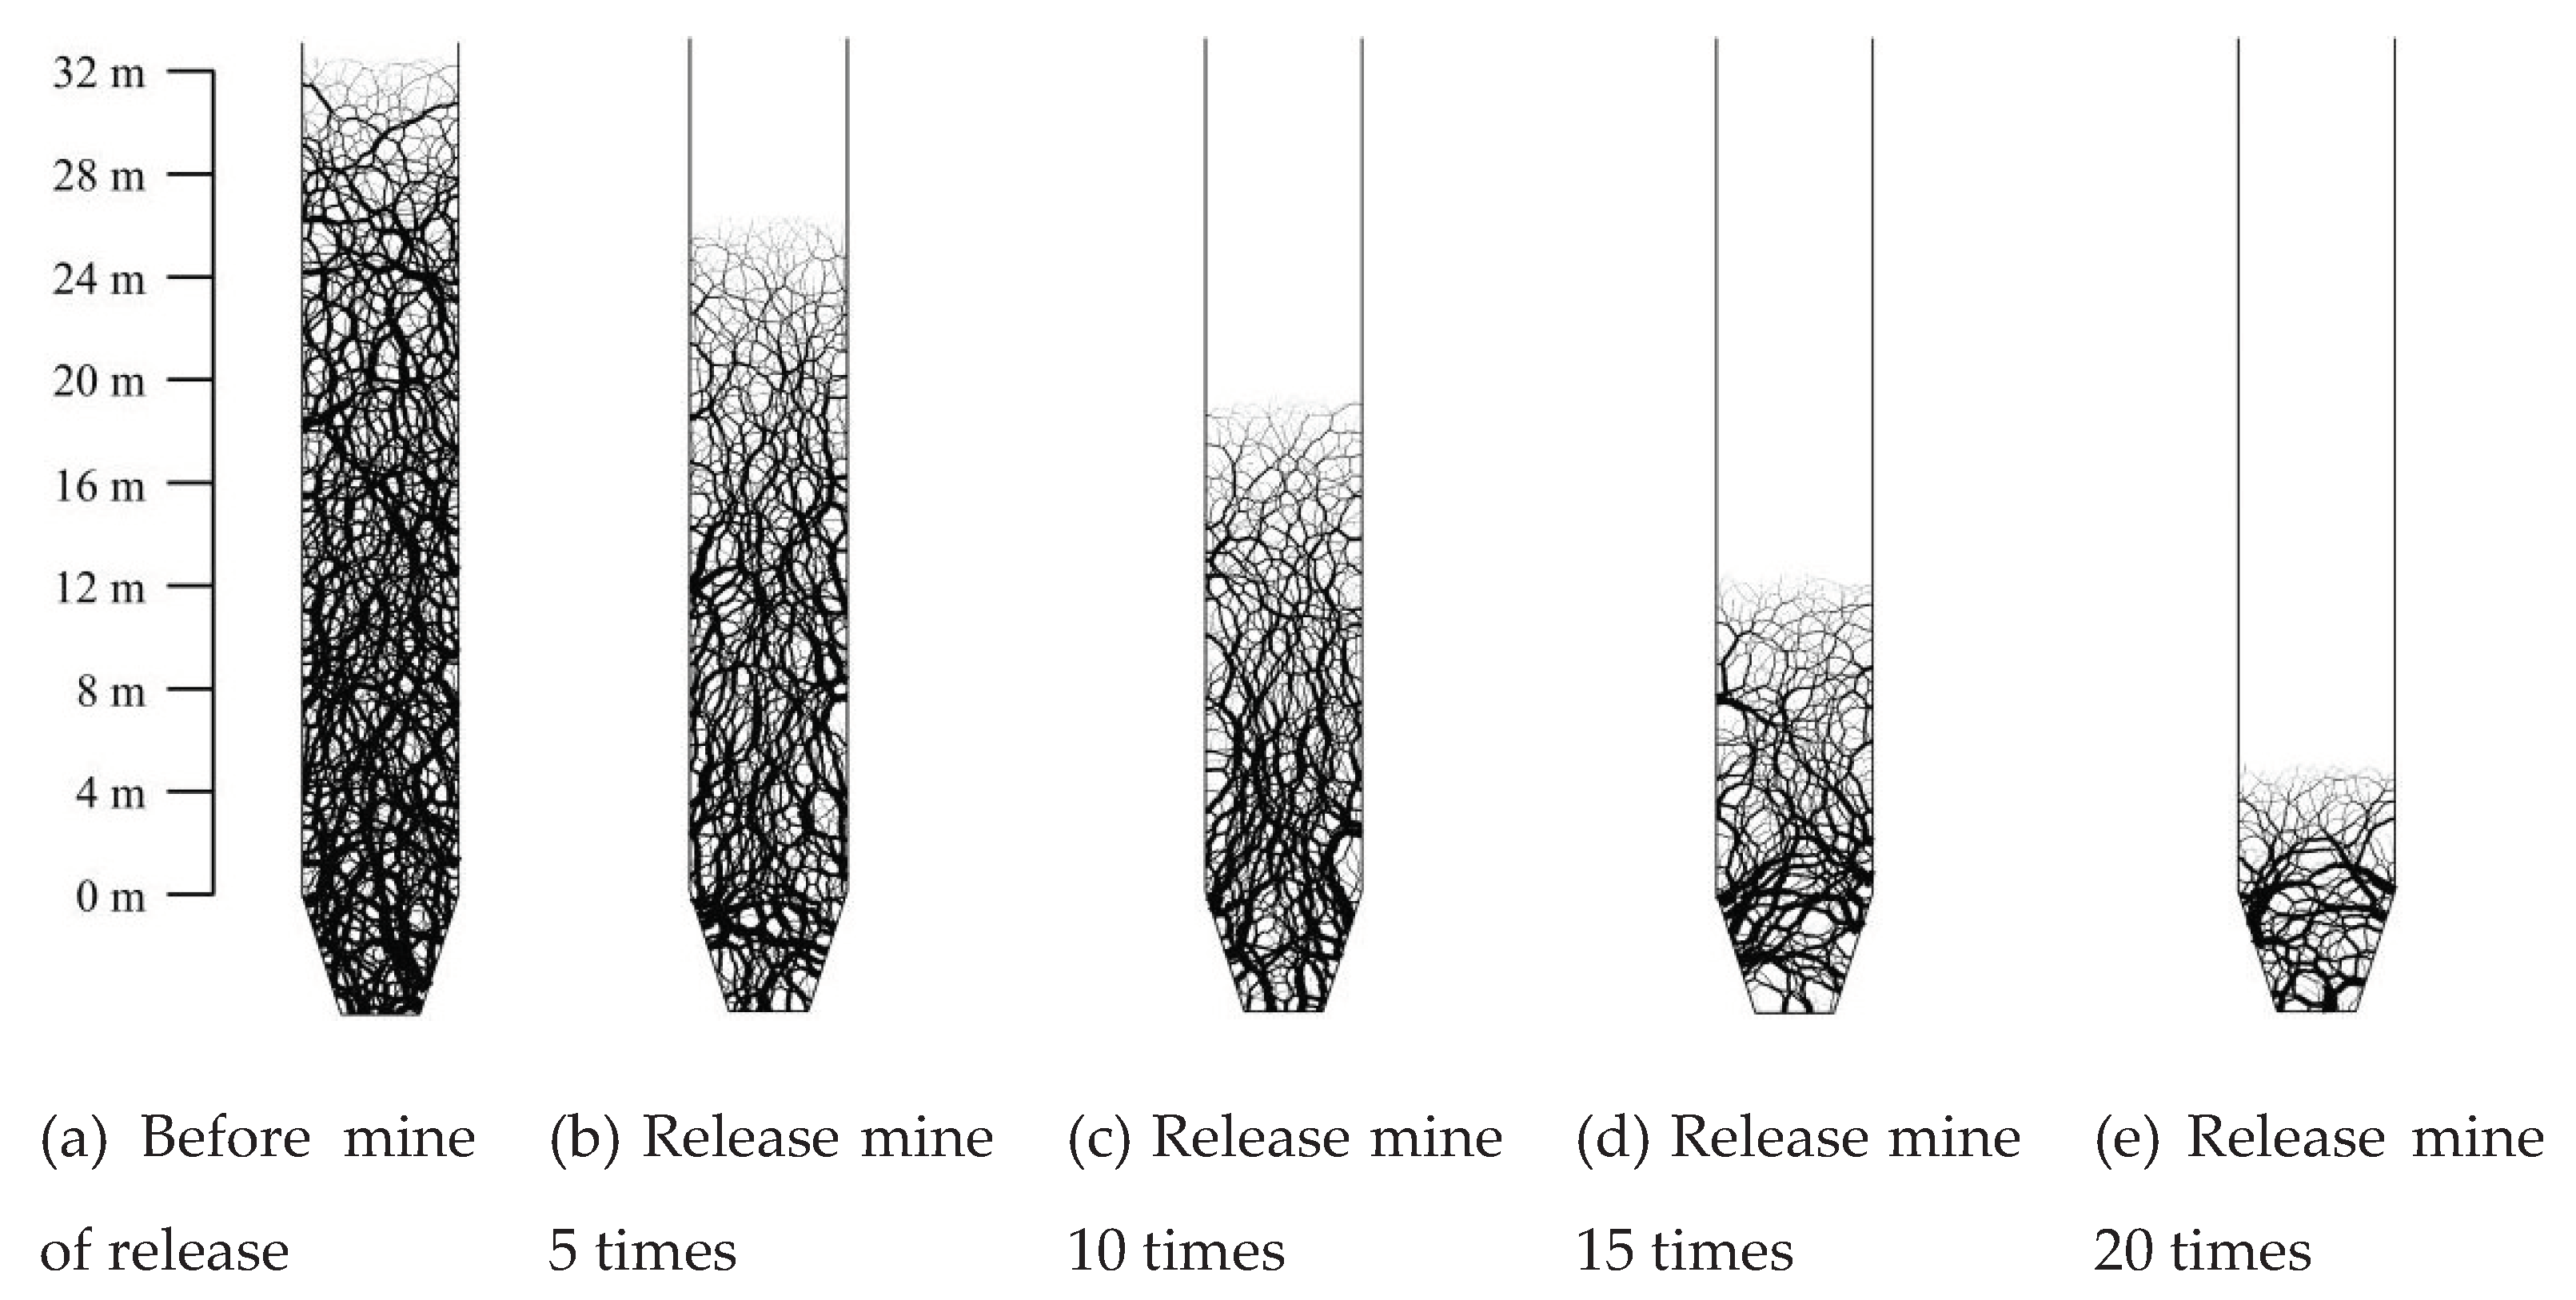
Figure 10 shows the contact force chain of ore-rock at different drawing times. The deeper the black lines in the figure are, the greater the compressive stress is. During the whole process of ore drawing, due to the influence of gravity, the color of the contact force chain gradually deepens from top to down, that is, the compressive stress gradually increases. Through the statistics of the strong and weak force chain, the ratio of the strong force chain to the weak force chain is about 1:17, which indicates that the weak force chain in the contact force chain of ore-rock particles is the main component of the force chain network. However, the proportion of the strong chain is relatively small, and the force chain network composed of the interwoven strong and weak force chain maintains the stability of the whole ore-rock dispersion. With the increase of ore drawing times, the strong and weak force chain inside the dispersion constantly breaks and transfers under the action of ore-rock flow, and the proportion of the weak force chain decreases exponentially. This indicates that the number of ore-rock particles contained in the weak force chain is gradually increasing, but contributes less to the stability of the whole dispersion system, and the number of ore-rock particles contained in the strong chain gradually decreases, but contributes more to the stability of the whole dispersion system.
3.3. Lateral Pressure Distribution of the Well Wall in the Storage Section
In the storage section,the important reason for the change of stress ore-rock on both sides is that in the flow process, the internal spatial distribution and flow characteristics of particles are changed [
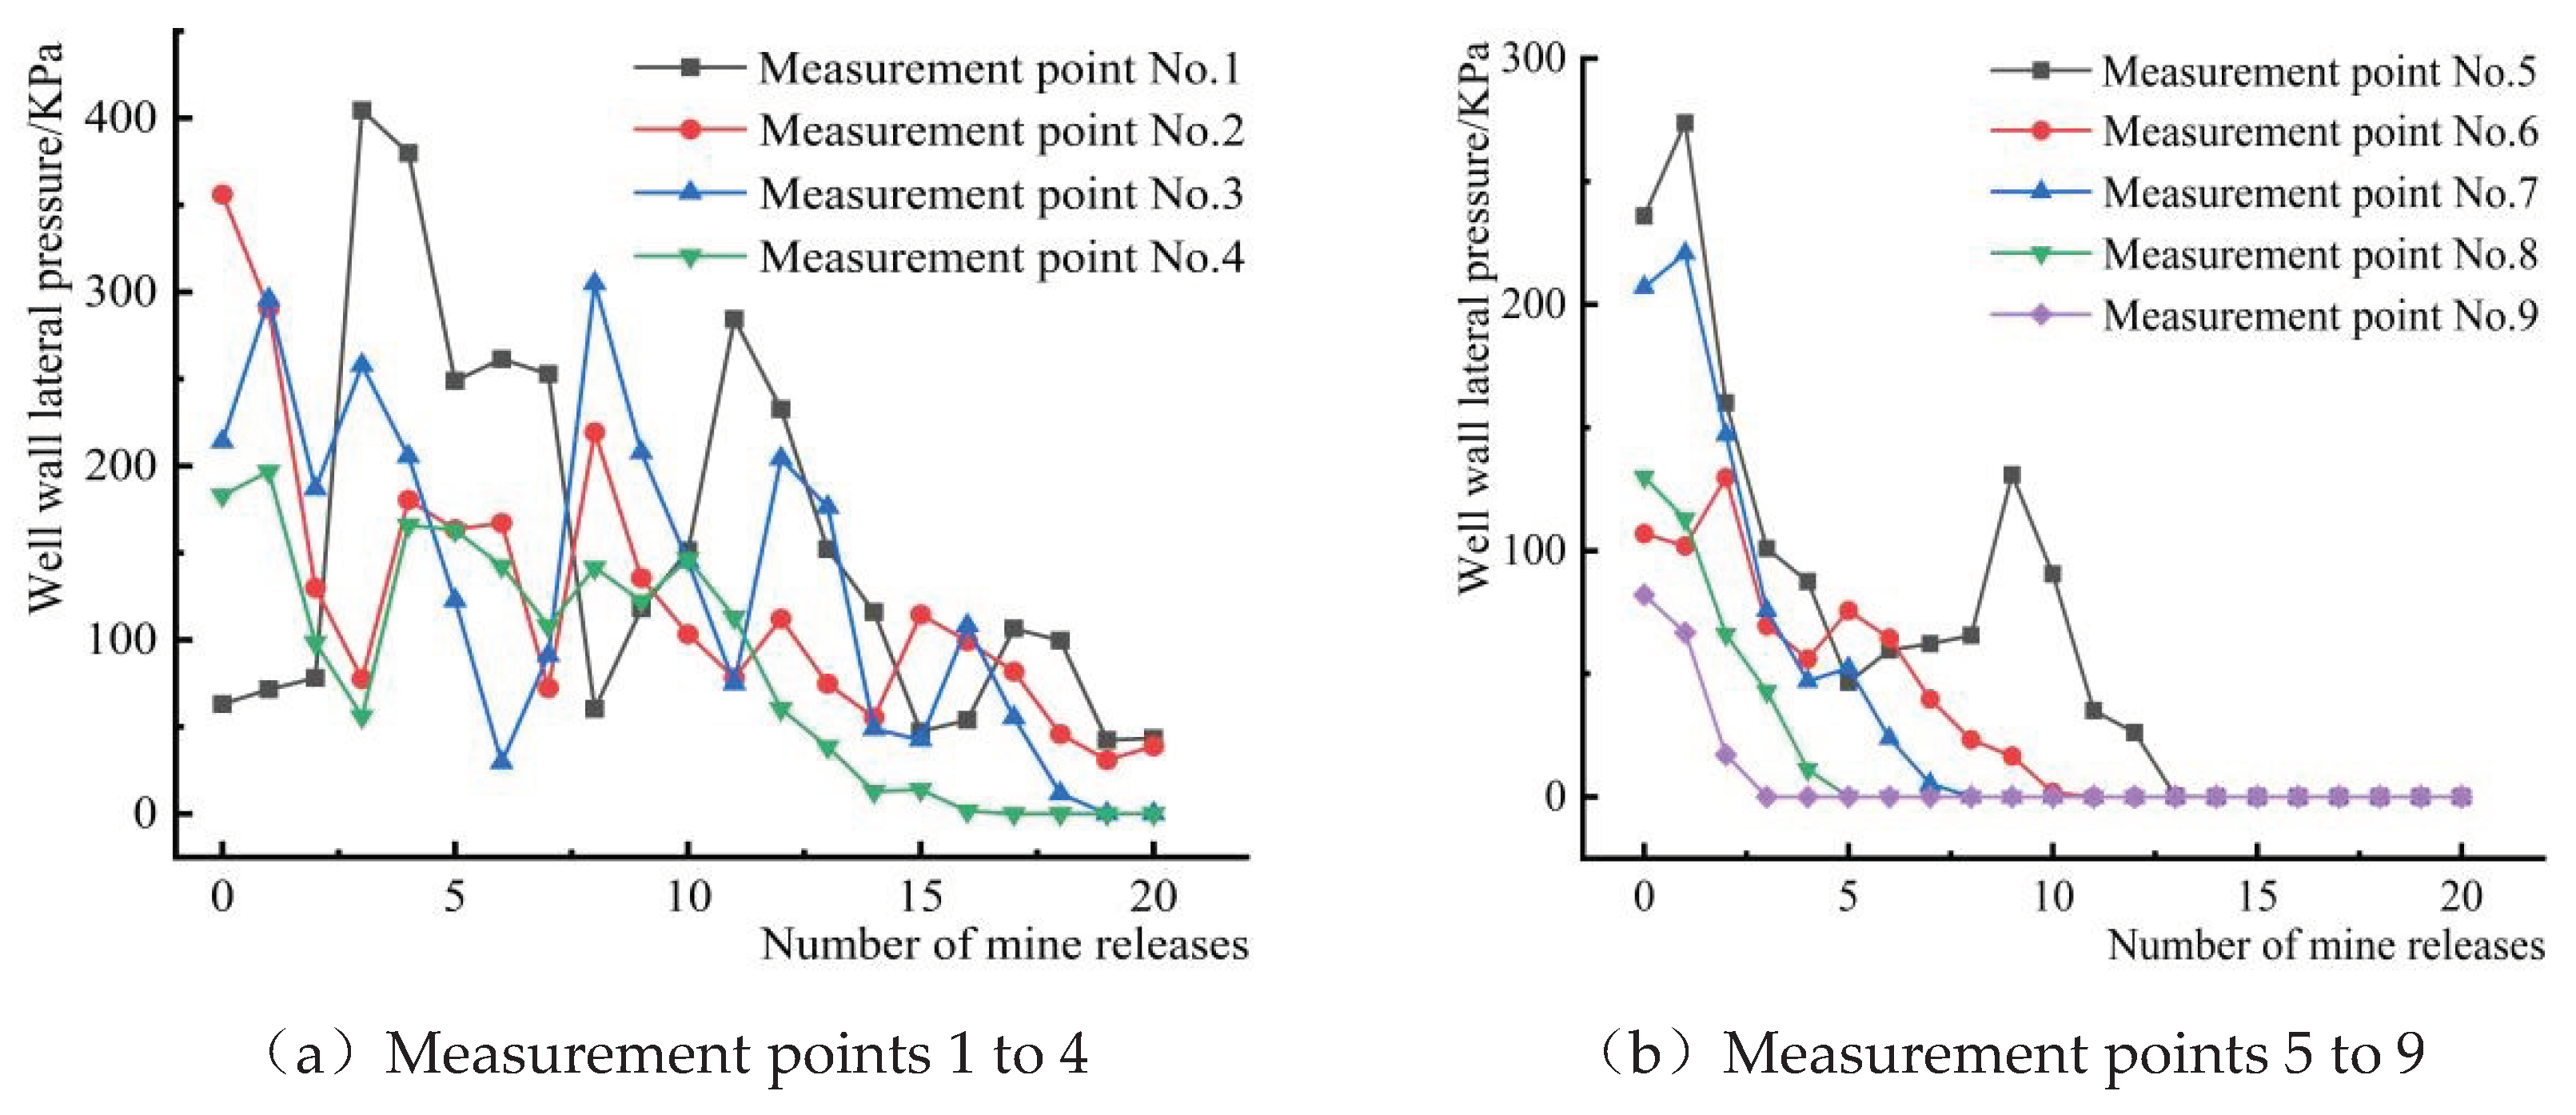
33]. However, due to the discontinuity of the ore-rock dispersion, it is difficult to accurately describe the change mechanism of the well wall stress, through the dynamic lateral pressure change of the well wall. In the storage section,the damage degree is indirectly quantified on the basis of the dynamic lateral pressure distribution of the well wall of each measuring point, then the mechanical mechanism of the stress change of the well wall is revealed. According to the elevation position of each measuring point, the measuring points 1 to 4 and 5~9 are divided into the lower area of the storage section and the upper part of the storage section, the change characteristics of the lateral pressure and overpressure data of each measuring point are counted in real time, as shown in
Figure 11 and
Table 4.Acknowledgement
It can be seen from
Figure 11, while the dynamic lateral pressure of the well wall of each measuring point basically decreases exponentially, and the dynamic lateral pressure value generally increases from top to down (measuring point 9 to measuring point 1), the dynamic lateral pressure of some measuring points (measuring point 1, measuring point 3~7) has increased significantly, compared with the static lateral pressure without ore drawing, and the maximum dynamic lateral pressure value appears after a period of time, not at the moment of initial drawing. At the beginning of the opening of the ore drawing port, the ore-rock dispersion will rotate and slip under the action of its own gravity, which breaks the initial mechanical balance inside the storage material, and causes the mechanical behavior of spontaneously forming arch and caving inside the storage material. The formation of the arch causes the increase of the lateral pressure value of the measuring point near the arch foot, that is, the “overpressure phenomenon”. Near the arch foot,the collapse of the arch leads to the instantaneous decrease of the lateral pressure value of the measuring point. The phenomenon of arch-collapse occurs alternately in the process of ore-rock flow, resulting in the dynamic lateral pressure of each measuring point with the exponential fluctuation decreasing, and after a period of time the peak lateral pressure appearing. This is consistent with the results of previous scholars’ research on scattered fluidity and spontaneous arch in the flow process [
34,
35].
Table 4 shows the overpressure data of each measuring point under different ore drawing nodes.In the 1~9 measuring points, 1,3~7 measuring points have appeared different degrees of overpressure phenomenon, in which the 1 measuring point accumulated overpressure 15 times, 3 measuring point overpressure 3 times, 4~7 measuring point overpressure 1 time. It indicates that the number of overpressure phenomenon in the lower part of the storage section is much greater than that in the upper part, and the closer the measuring point at the bottom of the storage section, the more times of overpressure phenomenon. This is due to when the ore drawing port is opened, the speed of ore-rock particles and acceleration gradually increase, movement intensity gradually rise, to the section of the wall produced a strong dynamic load, cause the phenomenon of overpressure and dynamic lateral pressure increase, and with the increasing number of ore drawing (the total amount of ore-rock in the shaft is constantly decreasing), even if the ore-rock dispersion movement, the dynamic lateral pressure of the wall will be declining. When the lower area of the storage section bears the secondary impact load caused by the phenomenon of broken breaking, the gravity compaction of the upper covered rock is additional, which increases the dynamic lateral pressure, overpressure coefficient and overpressure frequency of the well wall, resulting the overpressure coefficient of measuring point 1 is the largest, followed by the measuring point 3. The peak overpressure coefficient of measuring point 1 is about 5 times that of the measuring point 6, which further indicates that the overpressure coefficient is positively correlated with the storage depth in the process of ore-rock flow, that is, the deeper the storage depth, the greater the overpressure coefficient. The phenomenon of overpressure occurs the most frequently, and in the measuring point area where the overpressure coefficient value is the largest, the damage degree of the well wall will be greater. Therefore, from the perspective of overpressure frequency and overpressure coefficient, the damage degree of the lower storage section is much greater than that of the upper storage section.
4. Conclusions
Based on the discrete element analysis method, the flow characteristics of the ore-rock dispersion, the mechanical evolution mechanism of the ore-rock and the force characteristics of the storage section are studied, and a method using the overpressure coefficient and overpressure frequency. The main conclusions are as follows:
- (1)
The important factors affecting the ore-rock’s macroscopic flow form are that the friction between ore-rock particles, and between ore-rock and well wall and the constraint of funnel boundary. In the process of different flow rates, the “one” pattern is gradually changed to “U” type, and finally released with the “V” type flow characteristics.
- (2)
The closer it is to the bottom of the orepass, the larger the average coordination number, the density and stress concentration become more and more obvious, and the range of high stress concentration area decreases with the decrease of the total amount of ore-rock. The well wall and funnel at the bottom of the storage section are under great stress, which is easy to produce a large number of fine cracks, and then cause the well wall damage.
- (3)
With the increase of the number of ore drawing, the particle contact strength probability distribution decreases exponentially, the strength of the internal chain in the ore-rock flow fracture and transfer, the number of weak force chain rock particles gradually increased, the number of strong chain rock particles gradually reduced, but the strong chain in ensuring the stability of the whole dispersion structure system play a leading role.
- (4)
The dynamic load formed in the flow of ore-rock is mainly played in the lower part of the storage section. The overpressure coefficient is positively correlated with the storage depth. The greater the overpressure coefficient and the more the overpressure occurs, the well wall is much more damaged than the well wall of the upper storage section.
Funding
The authors greatly acknowledge the financial support from the National Natural Science Foundation of China (Grant No. 52204137), the Natural Science Foundation of Liaoning Province (Grant No. 2022-BS-281), and the Outstanding Young Scientific and Technological Talents Project of Liaoning University of Science and Technology (Grant No. 2023YQ10).
Ethics approval and consent to participate
Not applicable for studies not involving humans or animals.
Conflicts of Interests
On behalf of all authors, the corresponding author states that there is no conflict of interest. The authors declare that they have no known competing financial interests or personal relationships that could have appeared to influence the work reported in this study.
References
- Jiang, W. The Study of Arching Mechanism of Ores in Chute Based on Discontinuous Deformation Analysis[J]. Int. J. Digit. Content Technol. Its Appl. 2013, 7. [Google Scholar]
- Yin, Y.; Ma, C.; Lu, Z. Deformation and damage of orepass wall under impact and cutting [J]. World of mining-surface & underground 2020, 72, 205–210. [Google Scholar]
- Ma, C.; Lu, Z.; Yin, Y.; et al. Prediction model for the migration trajectory and velocity of ore-rock dispersions in an orepass storage section[J]. Chinese Journal of Engineering 2021, 43, 627–635. [Google Scholar]
- Huan Liu, Rongxing He, Guanghui Li, et al. Development of gravity flow draw theory and determination of its parameters[J]. Int. J. Rock Mech. Min. Sci. 2023, 171, 105582. [Google Scholar] [CrossRef]
- Yongheng Huang, Ping Cao, Yixian Wang. Motion Situation and Kinetic Energy Analysis for Ore pass of Underground Mine[J]. Appl. Mech. Mater. 2011, 90–93, 383–386. [Google Scholar]
- Chi Ma, Zengxiang Lu, Yue Yin. A flow network method for calculating the migration velocity of ore-rock in ore-pass storage section[J]. World of mining-surface & underground 2021.
- Yun Zhao, Haiwang Ye, Tao Lei, et al. Theoretical study of damage characteristics on ore pass wall based on the erosion-wearing theory[J]. Chinese Journal of Rock Mechanics and Engineering 2017, 36, 4002–4007. [Google Scholar]
- Aibing Jin, ShuaiJun Chen, Hao Sun, et al. Characteristics of particle percolation based on inhomogeneous particle size distribution[J]. Journal of Central South University (Science and Technology) 2020, 51, 1673–1681. [Google Scholar]
- Cundall P A, Strack O D L. A discrete numerical model for granular assemblies[J]. geotechnique 1979, 29, 47–65. [Google Scholar] [CrossRef]
- Yujiang Yang, Zhe Deng, Zengxiang Lu. Effects of ore-rock falling velocity on the stored materials and the force on the shaft wall in a vertical orepass[J]. Mechanics of Advanced Materials and Structures 2023, 30, 3455–3462. [Google Scholar] [CrossRef]
- Akira Sato, Haowen Tang. Analysis of Ore Pass Hang-Ups in Long Vertical Ore Passes by 3-D DEM[J]. International Journal of Mining Engineering and Mineral Processing 2020, 9, 1–11. [Google Scholar]
- J Hadjigeorgiou, J.F. Lessard. Numerical investigations of ore pass hang-up phenomena[J]. International Journal of Rock Mechanics & Mining Sciences 2007, 44, 820–834. [Google Scholar]
- Kamran Esmaieli, John Hadjigeorgiou, Martin Grenon. Stability Analysis of the 1J9A Ore Pass at Brunswick Mine Using a Two-Stage Numerical Modeling Approach[J]. Rock Mech Rock Eng 2013, 46, 1323–1338. [Google Scholar] [CrossRef]
- Fang Yuan, Kun Pang, Chengying Dong, et al. The PFC3D numerical simulation on dynamic pressures and flow of sidedraw silos[J]. Engineering Mechanics 2016, 33, 301–305. [Google Scholar]
- Gonzalez-Montellano C, Gallego E, Ramirez-Gomez A, et al. Three dimensional discrete element models for simulating the filling and emptying of silos: Analysis of numerical results[J]. Computers & Chemical Engineering 2012, 40, 22–32. [Google Scholar]
- P Xu, X Duan, G Qian, et al. Dependence of wall stress ratio on wall friction coefficient during the discharging of a 3D rectangular hopper[J]. Powder Technology 2015, 284, 326–335. [Google Scholar] [CrossRef]
- Qipeng Cheng, Weiwei Sun, Sai Lu. Discrete element analysis of squat silo under eccentric drawing by PFC3D[J]. Journal of Civil Engineering and Management 2016, 33, 43–47. [Google Scholar]
- Yong Feng, Jie Liu. Research on the dynamic evolution of overpressure coefficient of grain unloading into arch in silos[J]. Chinese Journal of Applied Mechanics 2020, 37, 1036–1042. [Google Scholar]
- Pacheco-Martinez H, Van Gerner H J, Ruiz-Suárez, et al. Storage and drawing of a granular fluid[J]. Physical Review E Statistical Nonlinear & Soft Matter Physics 2008, 77, 021303. [Google Scholar]
- Qingfa Chen, EnJiang Liu, Shaoping Wang. Characteristics of ore contact force in ellipsoid ore drawing law [J]. Journal of Mining & Safety Engineering 2021, 38, 1210–1219. [Google Scholar]
- Ji Zhou. Study on the natural resting angle of loose ores[J]. Nonferrous Metals 1983, 24–29. [Google Scholar]
- Liu Kejin, Xiao Zhaoran, Wang Shihao. Discrete element-based simulation of silo storage unloading arch formation process and silo wall pressure distribution[J]. Transactions of the Chinese Society of Agricultural Engineering 2018, 34, 277–285. [Google Scholar]
- Wensrich C M, Katterfeld A. Rolling friction as a technique for modelling particle shape in DEM[J]. Powder Technology 2012, 217, 409–417. [Google Scholar] [CrossRef]
- Iwashita K, Oda M. Rolling resistance at contacts in simulation of shear band development by DEM[J]. Journal of engineering mechanics 1998, 124, 285–292. [Google Scholar]
- Shaojie Chen, Zhiguo Xia, Fan Feng, et al. Numerical study on strength and failure characteristics of rock samples with different hole defects[J]. 2021, 80, 1523–1540.
- Jun Hu, Hukun Wang, Zhiguo Xia, et al. Mechanical properties and acoustic emission characteristics of two dissimilar layers of rock-like specimens with prefabricated parallel fssures[J]. Geomech. Geophys. Geo-energ. Geo-resour. 2024, 10, 19. [Google Scholar] [CrossRef]
- Chen Xishan. Extension of classical Janssen loose mass pressure theory and its application in mining engineering[J]. Chinese Journal of Geotechnical Engineering 2010, 32, 315–319. [Google Scholar]
- Shi Chong, Zhang Qiang, Wang Shengnian. Numerical simulation techniques and applications of granular flow (PFC5.0)[J]. Rock and soil mechanics 2018, 39, 36. [Google Scholar]
- Oda, M. Co-ordination number and its relation to shear strength of granular material[J]. Soils and foundations 1977, 17, 29–42. [Google Scholar] [CrossRef] [PubMed]
- Radjai F, Wolf D E, Jean M, et al. Bimodal character of stress transmission in granular packings[J]. Physical review letters 1998, 80, 61. [Google Scholar] [CrossRef]
- Majmudar T S, Behringer R P. Contact force measurements and stress-induced anisotropy in granular materials[J]. nature 2005, 435, 1079–1082. [Google Scholar] [CrossRef] [PubMed]
- Azema M, Radja F. Force chains and contact network topology in packings of elongated particles[J]. 2011.
- Maiti R, Das G, Das P K. Experiments on eccentric granular drawing from a quasi-two-dimensional silo[J]. Powder Technology 2016, 301, 1054–1066. [Google Scholar] [CrossRef]
- Cannavacciuolo A, Barletta D, Donsì G, et al. Arch-Free flow in aerated silo drawing of cohesive powders[J]. powder Technology 2009, 191, 272–279. [Google Scholar] [CrossRef]
- Han Gaoxiao, Gong Quanmei, Zhou Shunhua. Particle flow simulation analysis of micro-mechanism of soil arching effect of friction-type geotechnical materials [J]. Rock and Soil Mechanics 2013, 34, 1791–1798. [Google Scholar]
|
Disclaimer/Publisher’s Note: The statements, opinions and data contained in all publications are solely those of the individual author(s) and contributor(s) and not of MDPI and/or the editor(s). MDPI and/or the editor(s) disclaim responsibility for any injury to people or property resulting from any ideas, methods, instructions or products referred to in the content. |
© 2024 by the authors. Licensee MDPI, Basel, Switzerland. This article is an open access article distributed under the terms and conditions of the Creative Commons Attribution (CC BY) license (http://creativecommons.org/licenses/by/4.0/).
