1. Introduction
Low bone mineral density (l-BMD) and subsequent micro-architectural deterioration of bone texture leads to osteoporosis, a severe skeletal disorder resulting in increased bone fragility. This fragility’s condition leads to increased fractures' risk, occurring even for minor traumas or during daily activities. Most commonly affected sites are spine vertebrae, femur, humerus, wrist and ankle bones.
It’s the most common bone disorder worldwide and it affects 27 million people solely in Europe [
1,
2].
In literature, it’s described as two types of osteoporosis: primary and secondary type. There are two subtypes of primary osteoporosis, type I or post-menopausal and type II or senile. Secondary osteoporosis instead might be caused by other health conditions or medical treatment. Osteoporosis affects 10.2% of adults aged 50 above and its incidence is expected to rise to 13.6% by 2030. Osteoporotic fractures significantly affect morbidity, mortality and quality of life, so screening activities should include all women over 65 and postmenopausal women with any clinical risk factor [
3].
Due to its increased incidence among the last 40 years, several novel techniques and technologies have been developed to better detect it. Dual-energy X-ray absorptiometry (DXA) describes an individual’s bone mineral density combining two X-ray beams with different energy levels. From 1994 onwards two parameters have spread out worldwide to assess osteoporosis, known as the “T-score” and “Z-score”.
The “T-score” is a statistical value representing the deviation of the subject’s bone mineral density from the reference population (healthy population of the same sex aged 20-30 years) in terms of standard deviations. According to the World Health Organization (WHO) osteoporosis is diagnosed when bone mineral density is equal or less than 2.5 standard deviations below that of a young, healthy adult women reference population, so when T-score is equal or below -2.5. A T-score between -1 and -2.5 indicates osteopenia.
The “Z score”, on the other hand, indicates how many standard deviations the bone mineral density of a patient differs from that of a healthy population of the same age and gender [
4,
5,
6].
Although DXA is considered the gold standard [
7], some studies have raised concerns about its accuracy in early osteoporosis detection. DXA is projection-dependent and cannot differentiate trabecular from cortical BMD. It can also be influenced by adjacent vessel calcifications, tissue thickness, intestinal content, and degenerative bone alterations [
8].
Dual-Energy Computed Tomography (DECT) enables more accurate evaluation and characterization of individual materials. The acquisition of monochromatic images reduces beam hardening artifacts, leveraging the energy-dependent photoelectric effect across different X-ray spectra. DECT has provided valuable clinical information for musculoskeletal applications [
9] and for bone mineral density (BMD) assessment with minimal influence from marrow fat.
The aim of this study is to demonstrate the potential use of Dual-Energy CT, specifically using a hydroxyapatite (HAP) filter, for osteoporosis evaluation in postmenopausal women who already undergo CT exams. This approach aims to provide good diagnostic accuracy while reducing ionizing radiation exposure by combining osteoporosis screening with routine CT exams.
2. Materials and Methods
2.1. Study Population
This retrospective opportunistic study included 51 postmenopausal female patients who underwent both DXA and Dual-Energy CT of the lumbar spine, abdomen, and pelvis in 2022-2023 for oncological follow-up or other clinical evaluation. Only patients with a maximum time gap of 6 months between DXA and DECT exams were included. Patients with focal bone lesions, clinical or radiological disease, prosthetic materials, post-surgical outcomes, or prior fractures were excluded from the study.
2.2. Imaging
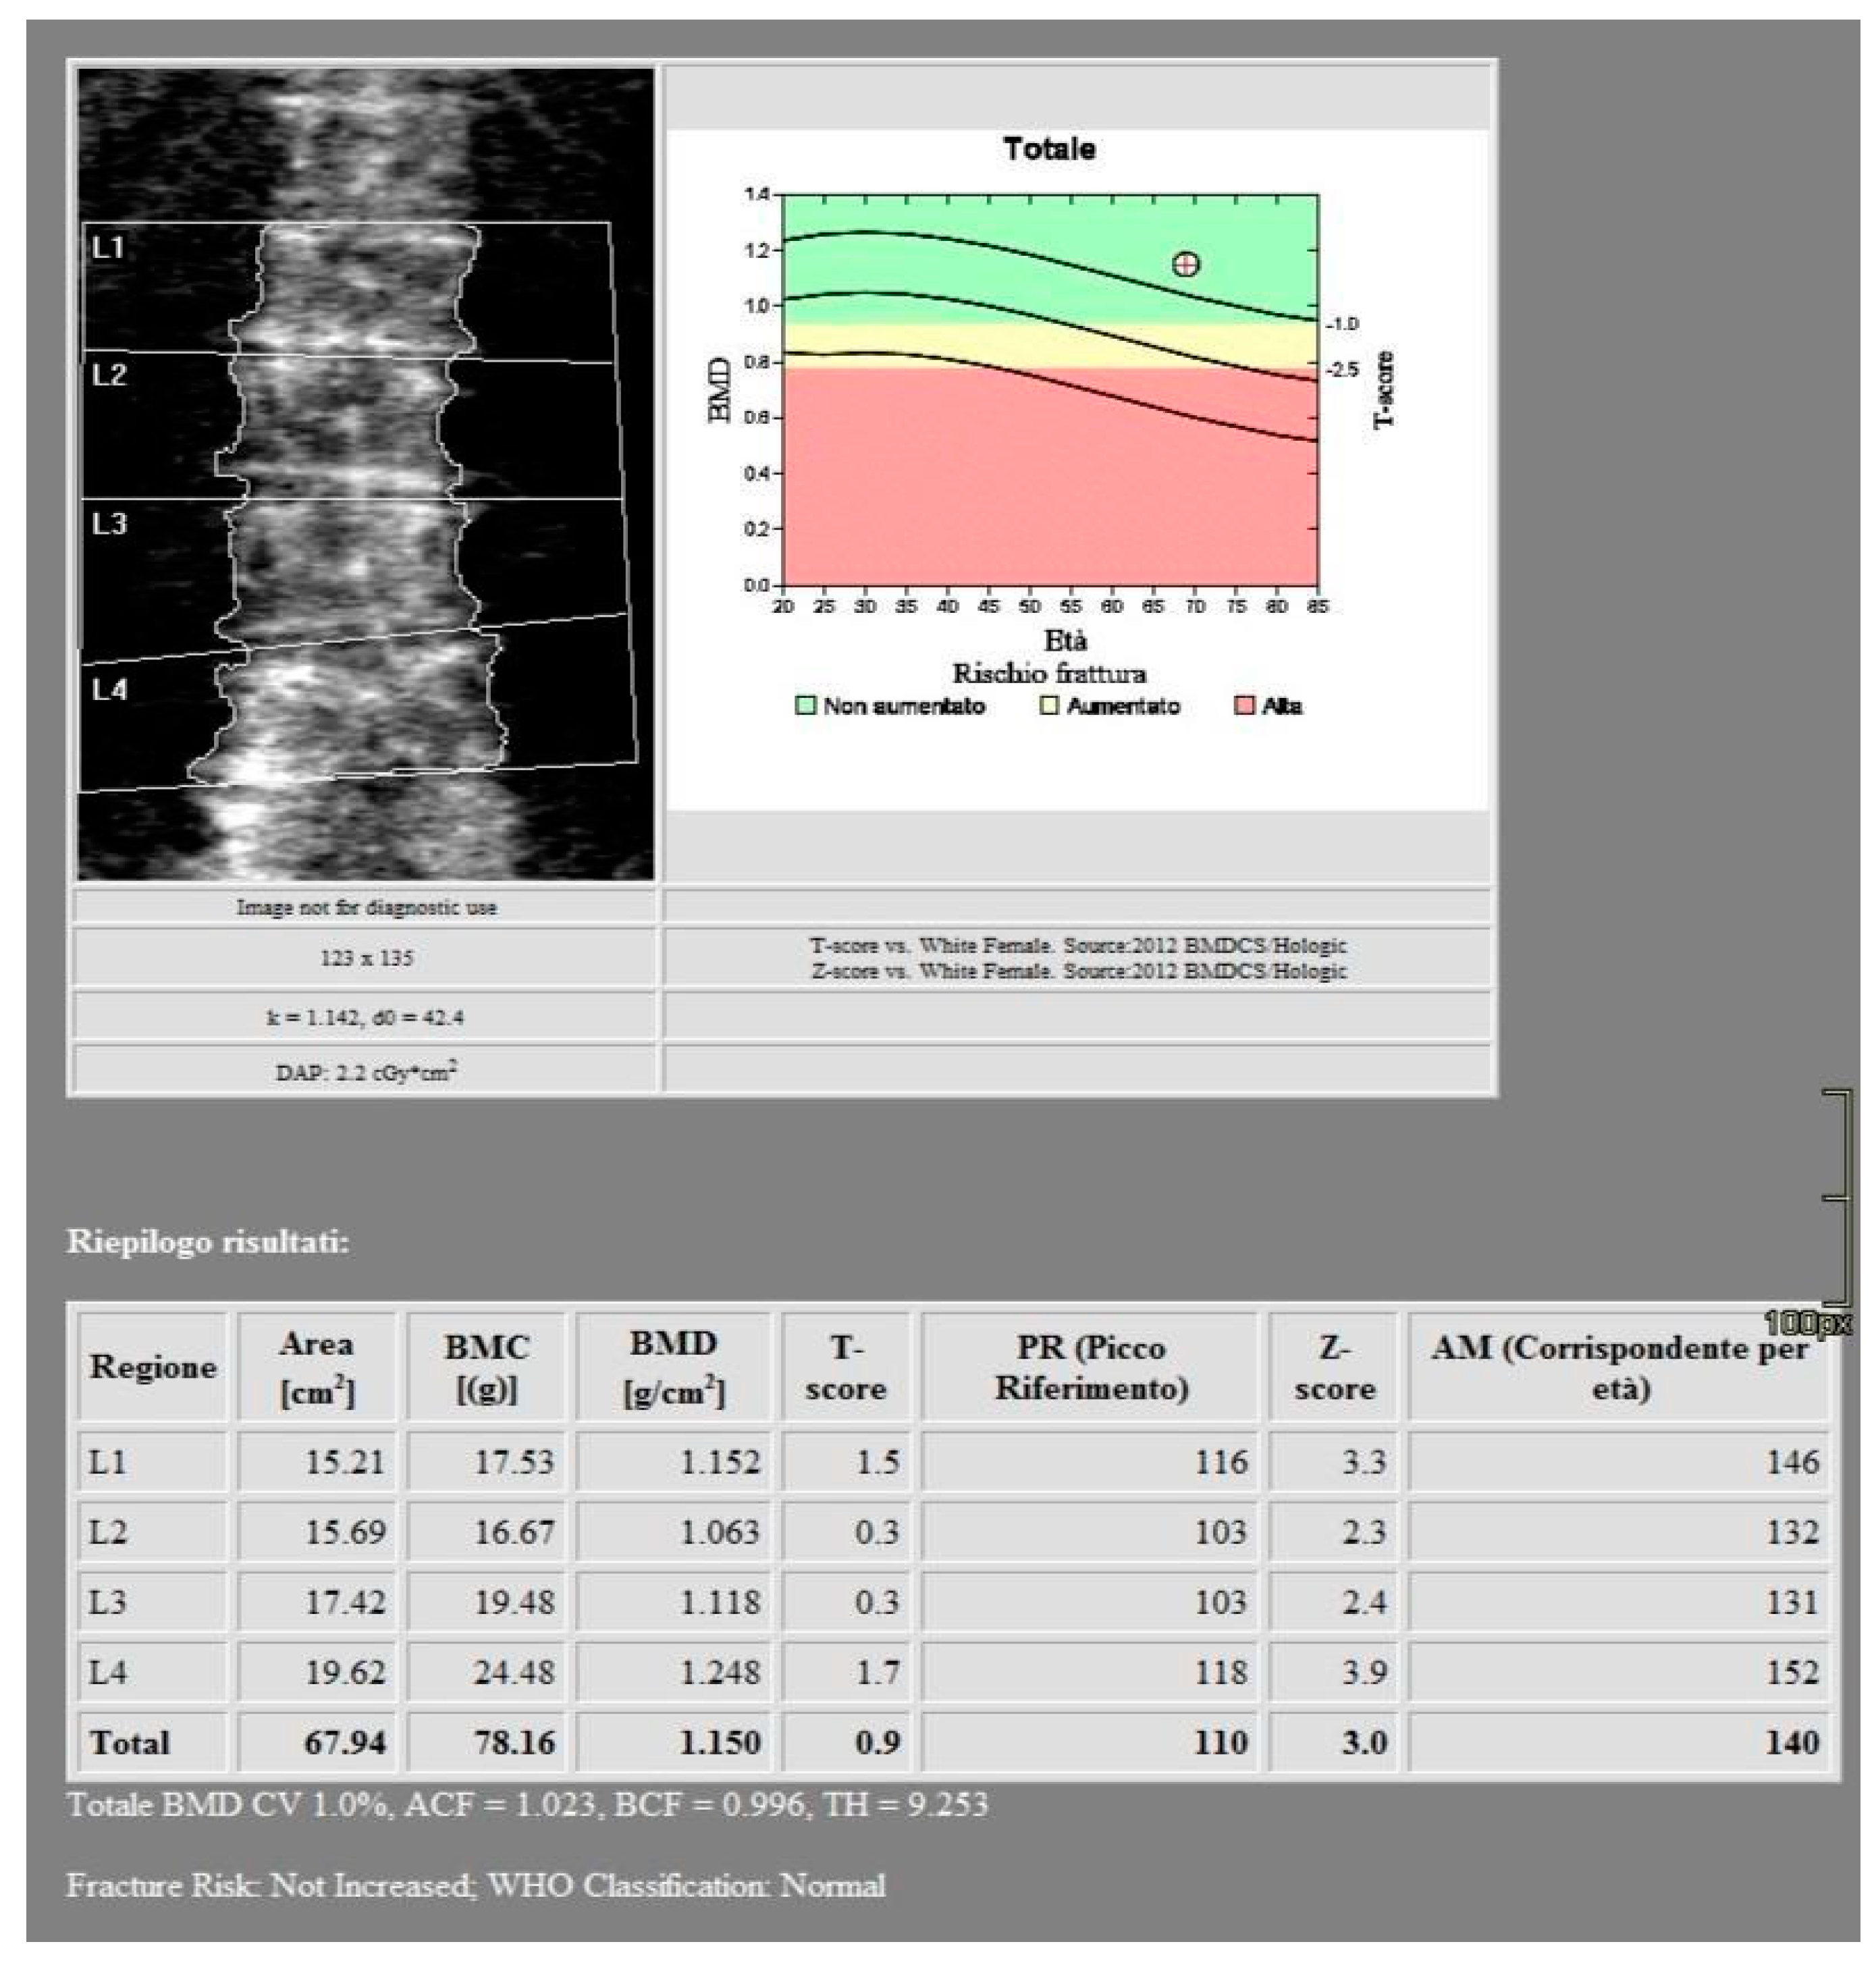
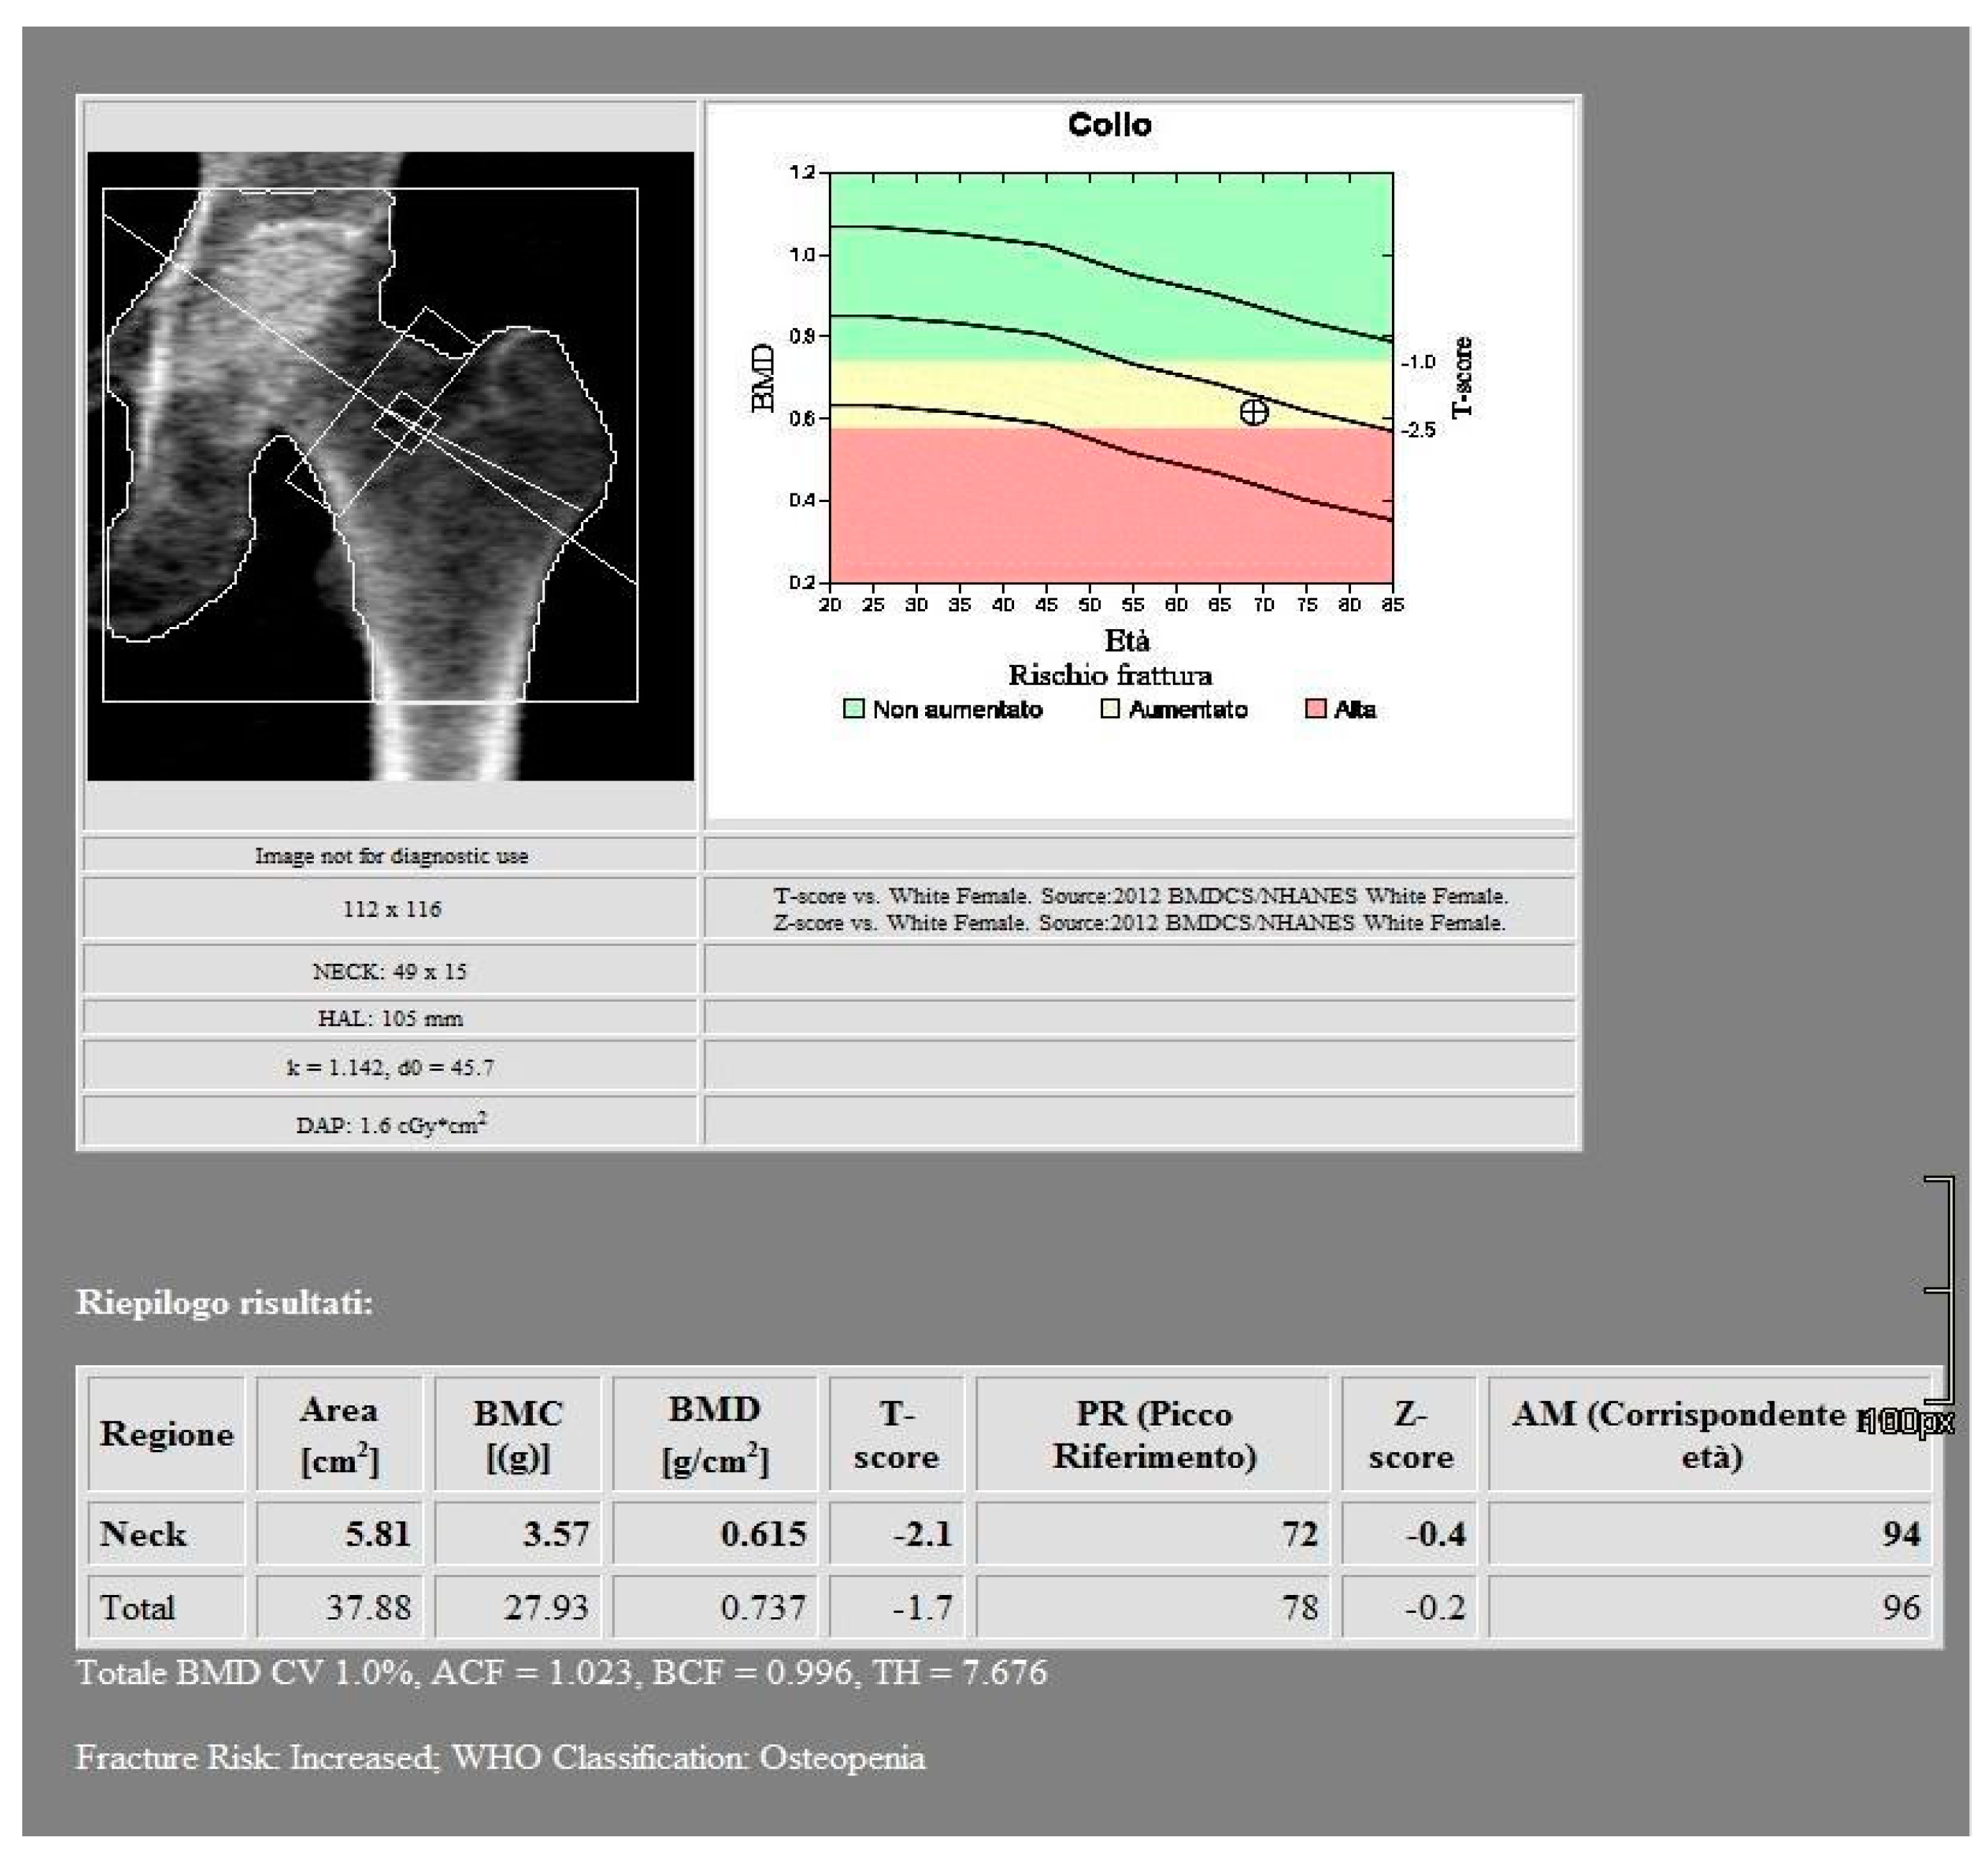
All images were acquired using a 256-slice multidetector CT system with spectral imaging capability (Revolution, GE Healthcare, Chicago, USA) using a 1.0 mm slice thickness, tube voltage of 80-140 kVp, and tube current of 200 mA (Dose Right automatic exposure control system). The CT data were reconstructed with GSI data, and MPR reconstructions were performed in coronal and sagittal planes. DXA scans were performed using a bone densitometer (Discovery A, HOLOGIC, USA) for the lumbar vertebrae (L1 to L4) and femoral neck (
Figure 1 and
Figure 2).
2.3. Radiation Dose
Radiation dose analysis shows a mean DLP value for DECT scans of 2699,8 mGy * cm and a mean DAP value for DXA scans of 4,01 Gy * cm2.
2.4. Post Processing
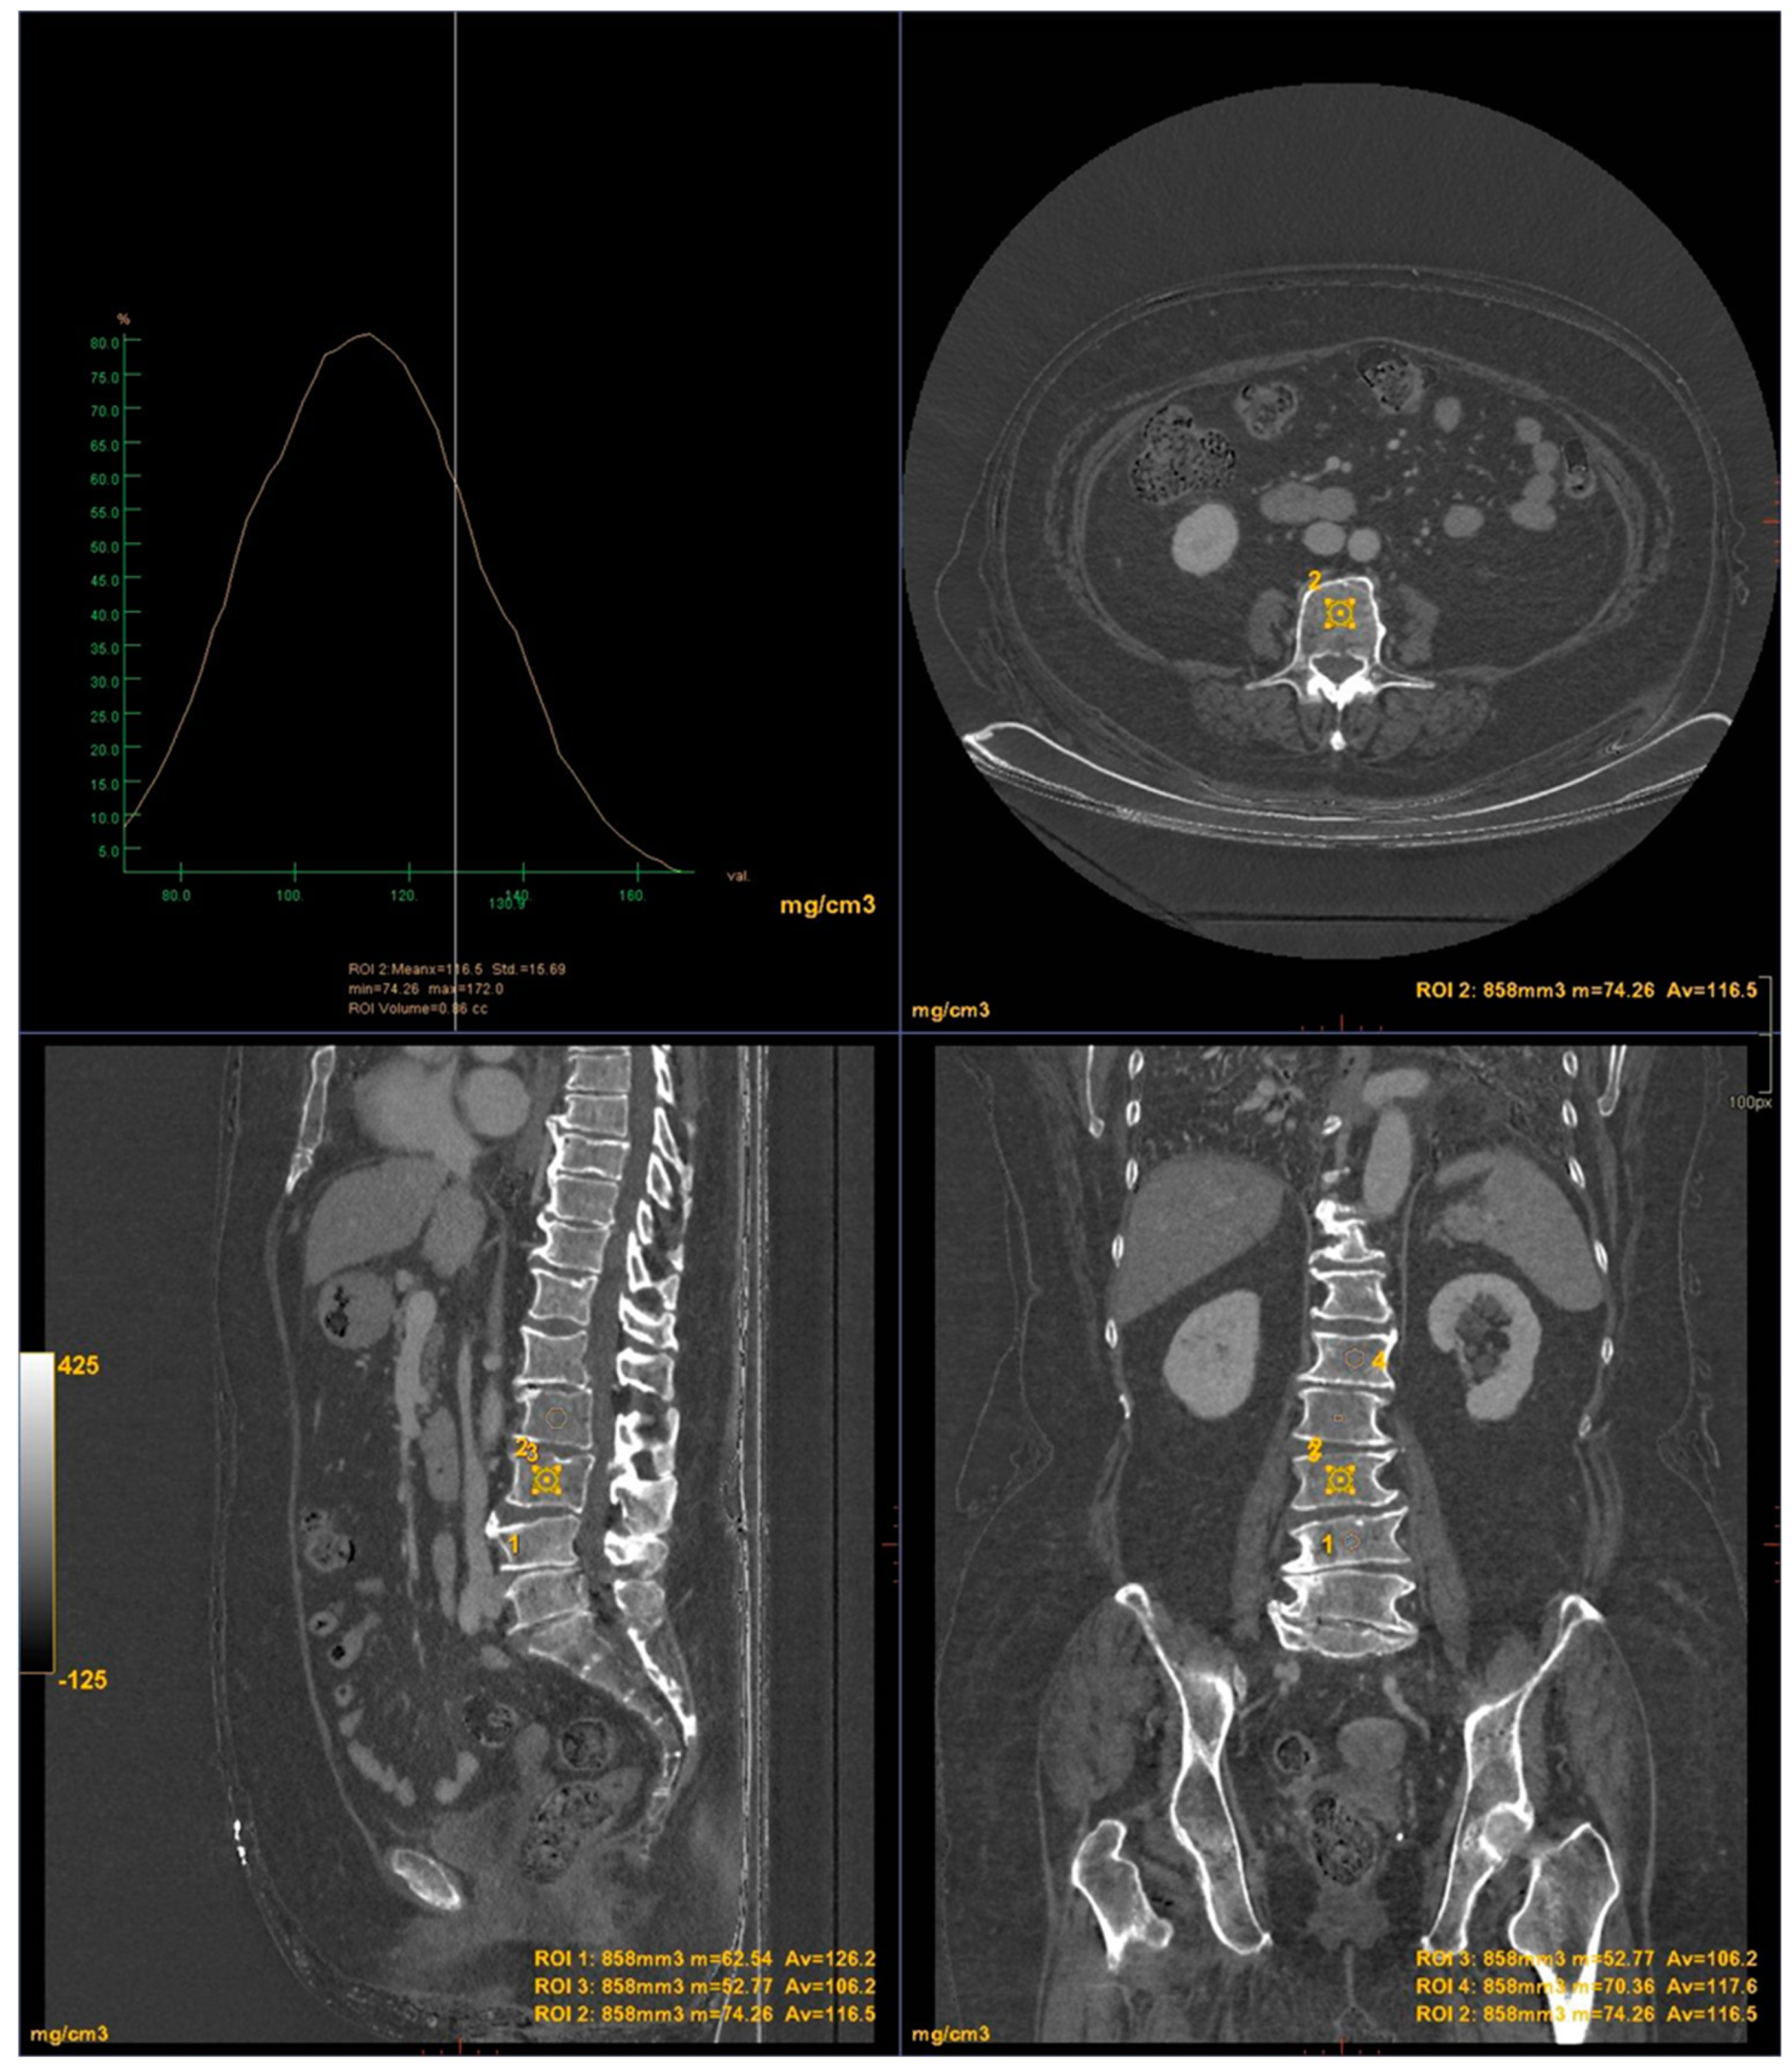
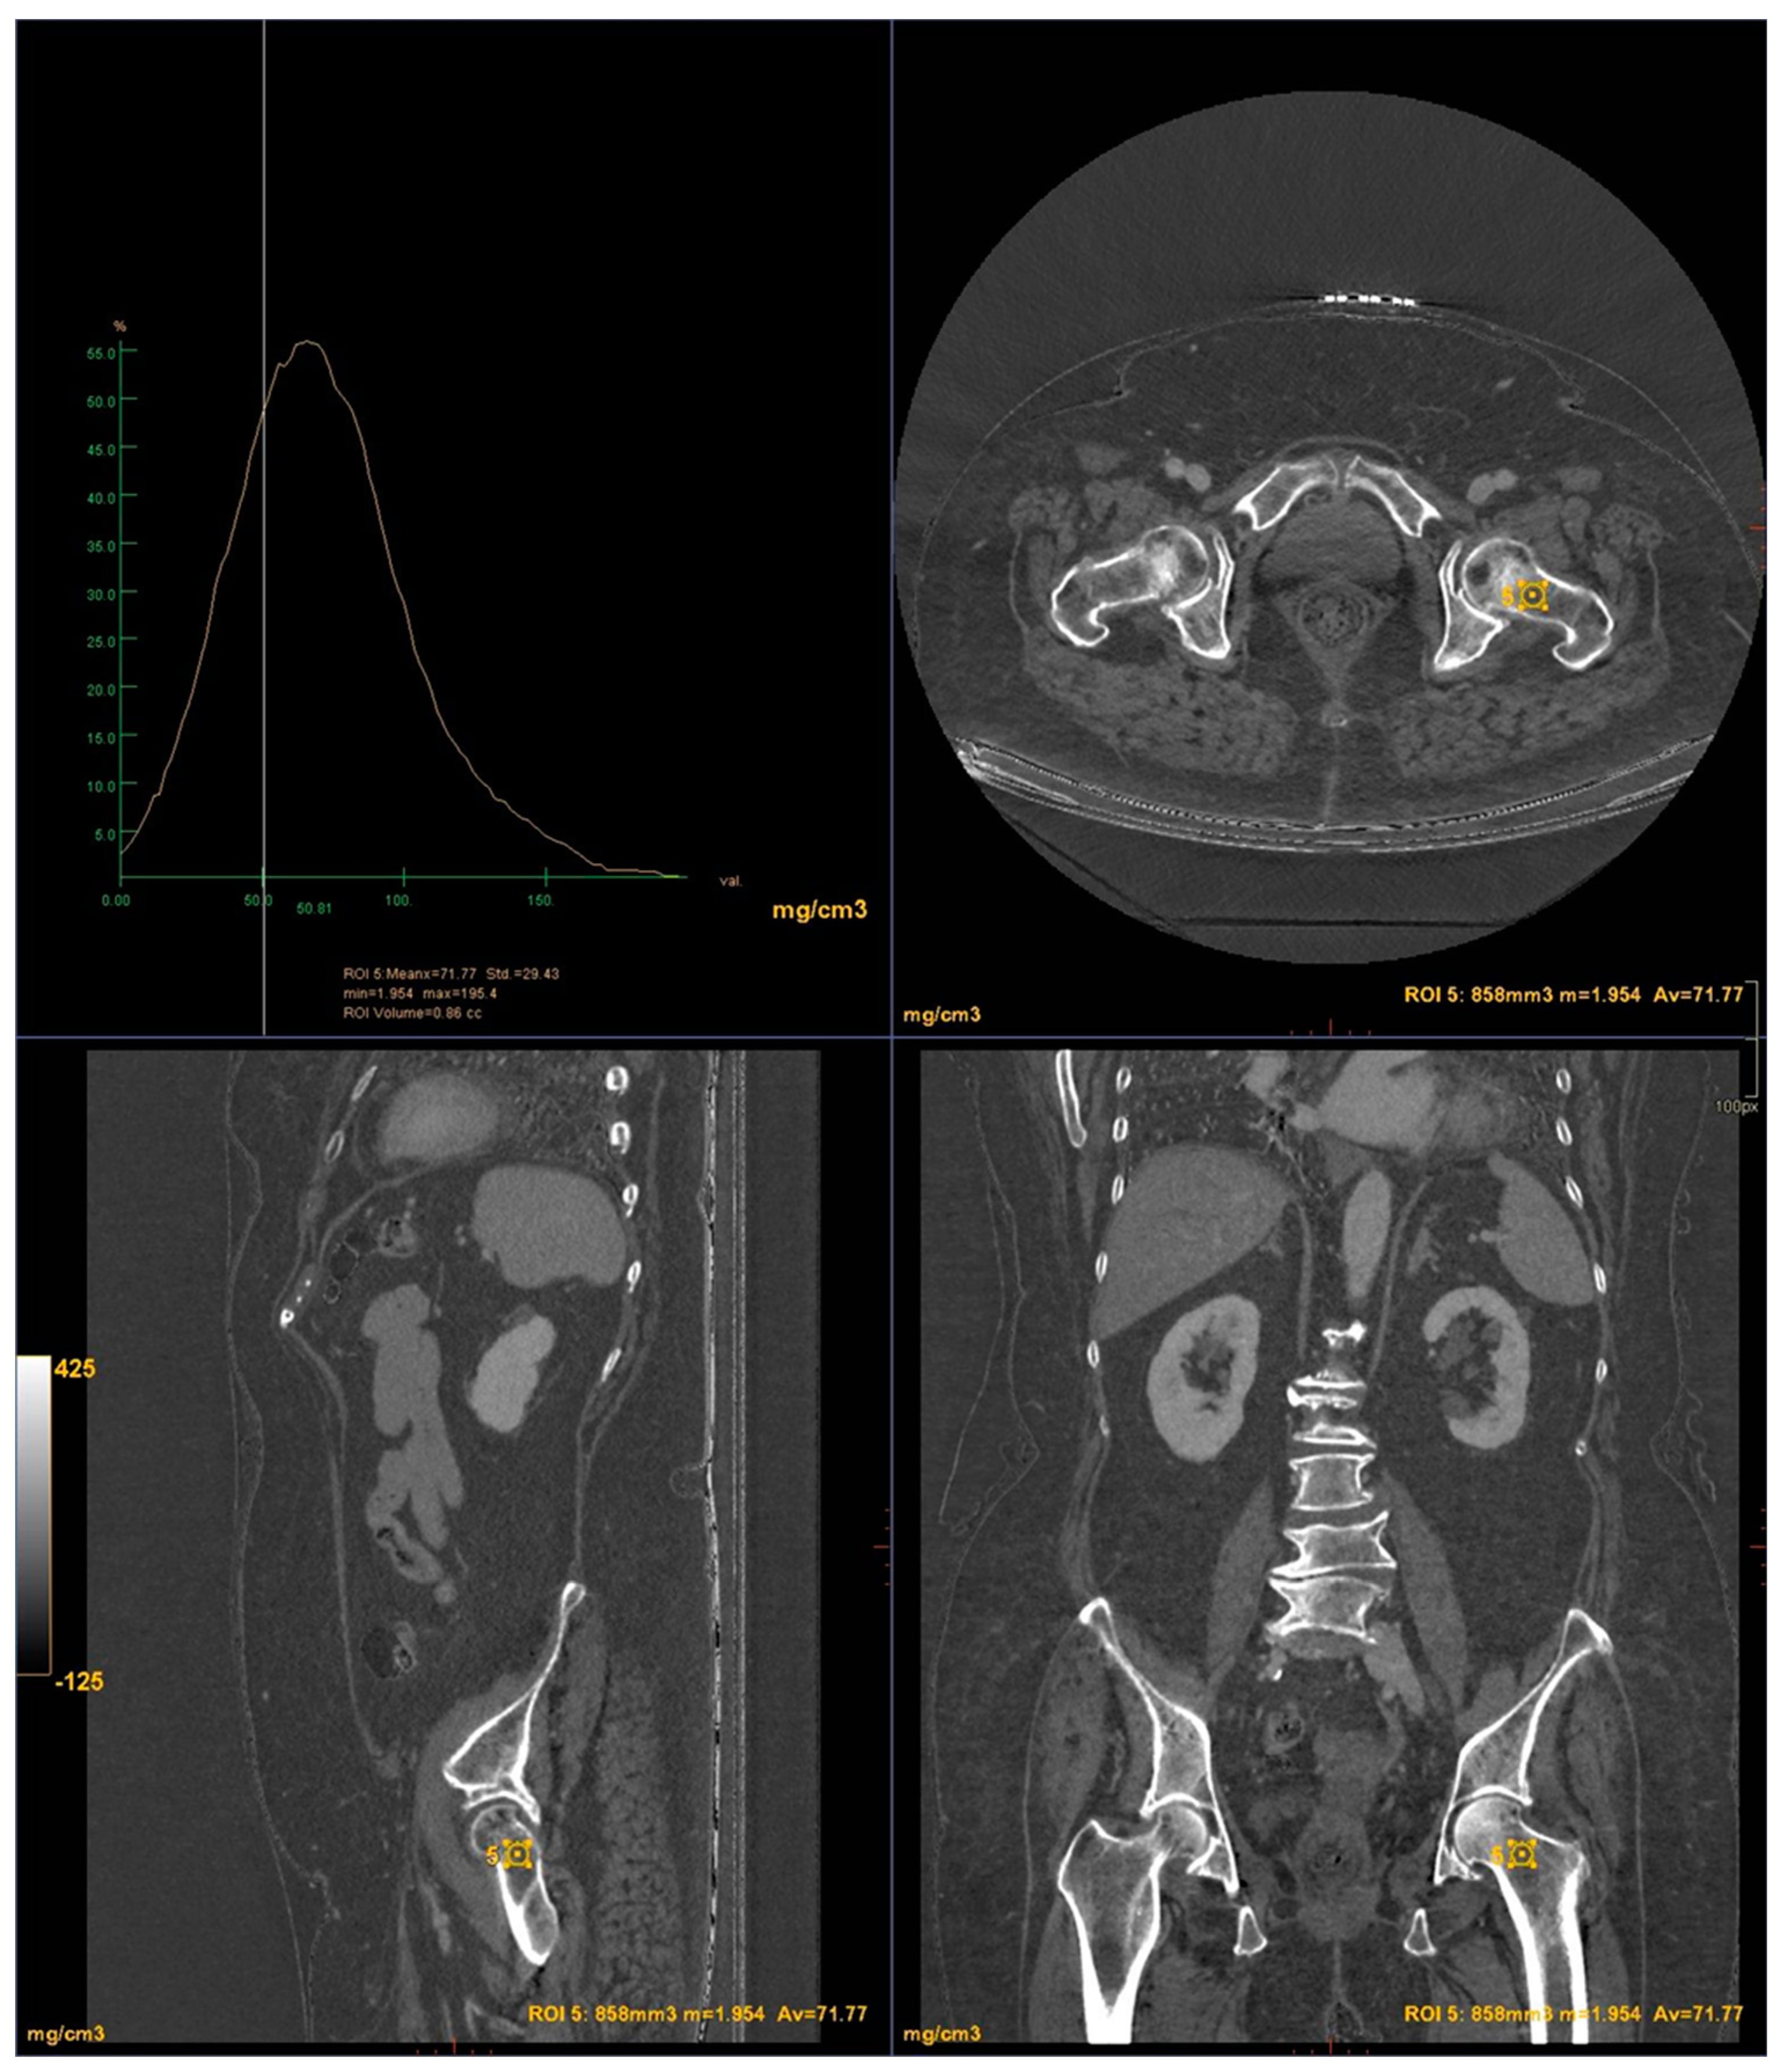
CT images were processed using AW3.2 software (GE Healthcare, USA) with a bone window and HAP(fat) reconstruction filter, which highlights structures containing hydroxyapatite. Three-dimensional volume of interest (VOI) measurements were taken at the lumbar vertebrae (
Figure 3) and femoral neck (
Figure 4), sampling the trabecular bone while excluding cortical bone regions.
2.5. Data Evaluation and Statistical Analysis
All statistical analyses were performed using GraphPad Prism 8 (GraphPad Software, San Diego California US). Continuous data with a normal distribution were presented as mean and standard deviations (mean ± SD). Comparisons between absolute mean values were performed using the paired t-test. The method of Bland-Altman was used to evaluate the agreement between DXA and DECT HAP(fat) measurements. In addition, the coefficient of determination (R2) and residual root-mean-square error (RMSE) were calculated to evaluate the goodness of the linear fits.
3. Results
The baseline characteristics of the 51 patients participating in the study are presented in
Table 1 and
Table 2. According to the BMD measurement on DXA, 15 participants were diagnosed in osteoporotic range in the lumbar area and 15 participants in the hip area. 27 participants were identified in the osteopenic range in the lumbar area and 24 participants in the hip area. 9 subjects were classified in the normal range in the lumbar area and 12 subjects in the hip area.
For the lumbar vertebrae the mean BMD and T-score on DXA images were 0.648 g/cm
2 and -3.66 for the osteoporosis group, 0.855 g/cm
2 and -1.73 for the osteopenic group and 1.02 g/cm
2 and -0.83 for the normal group, respectively (
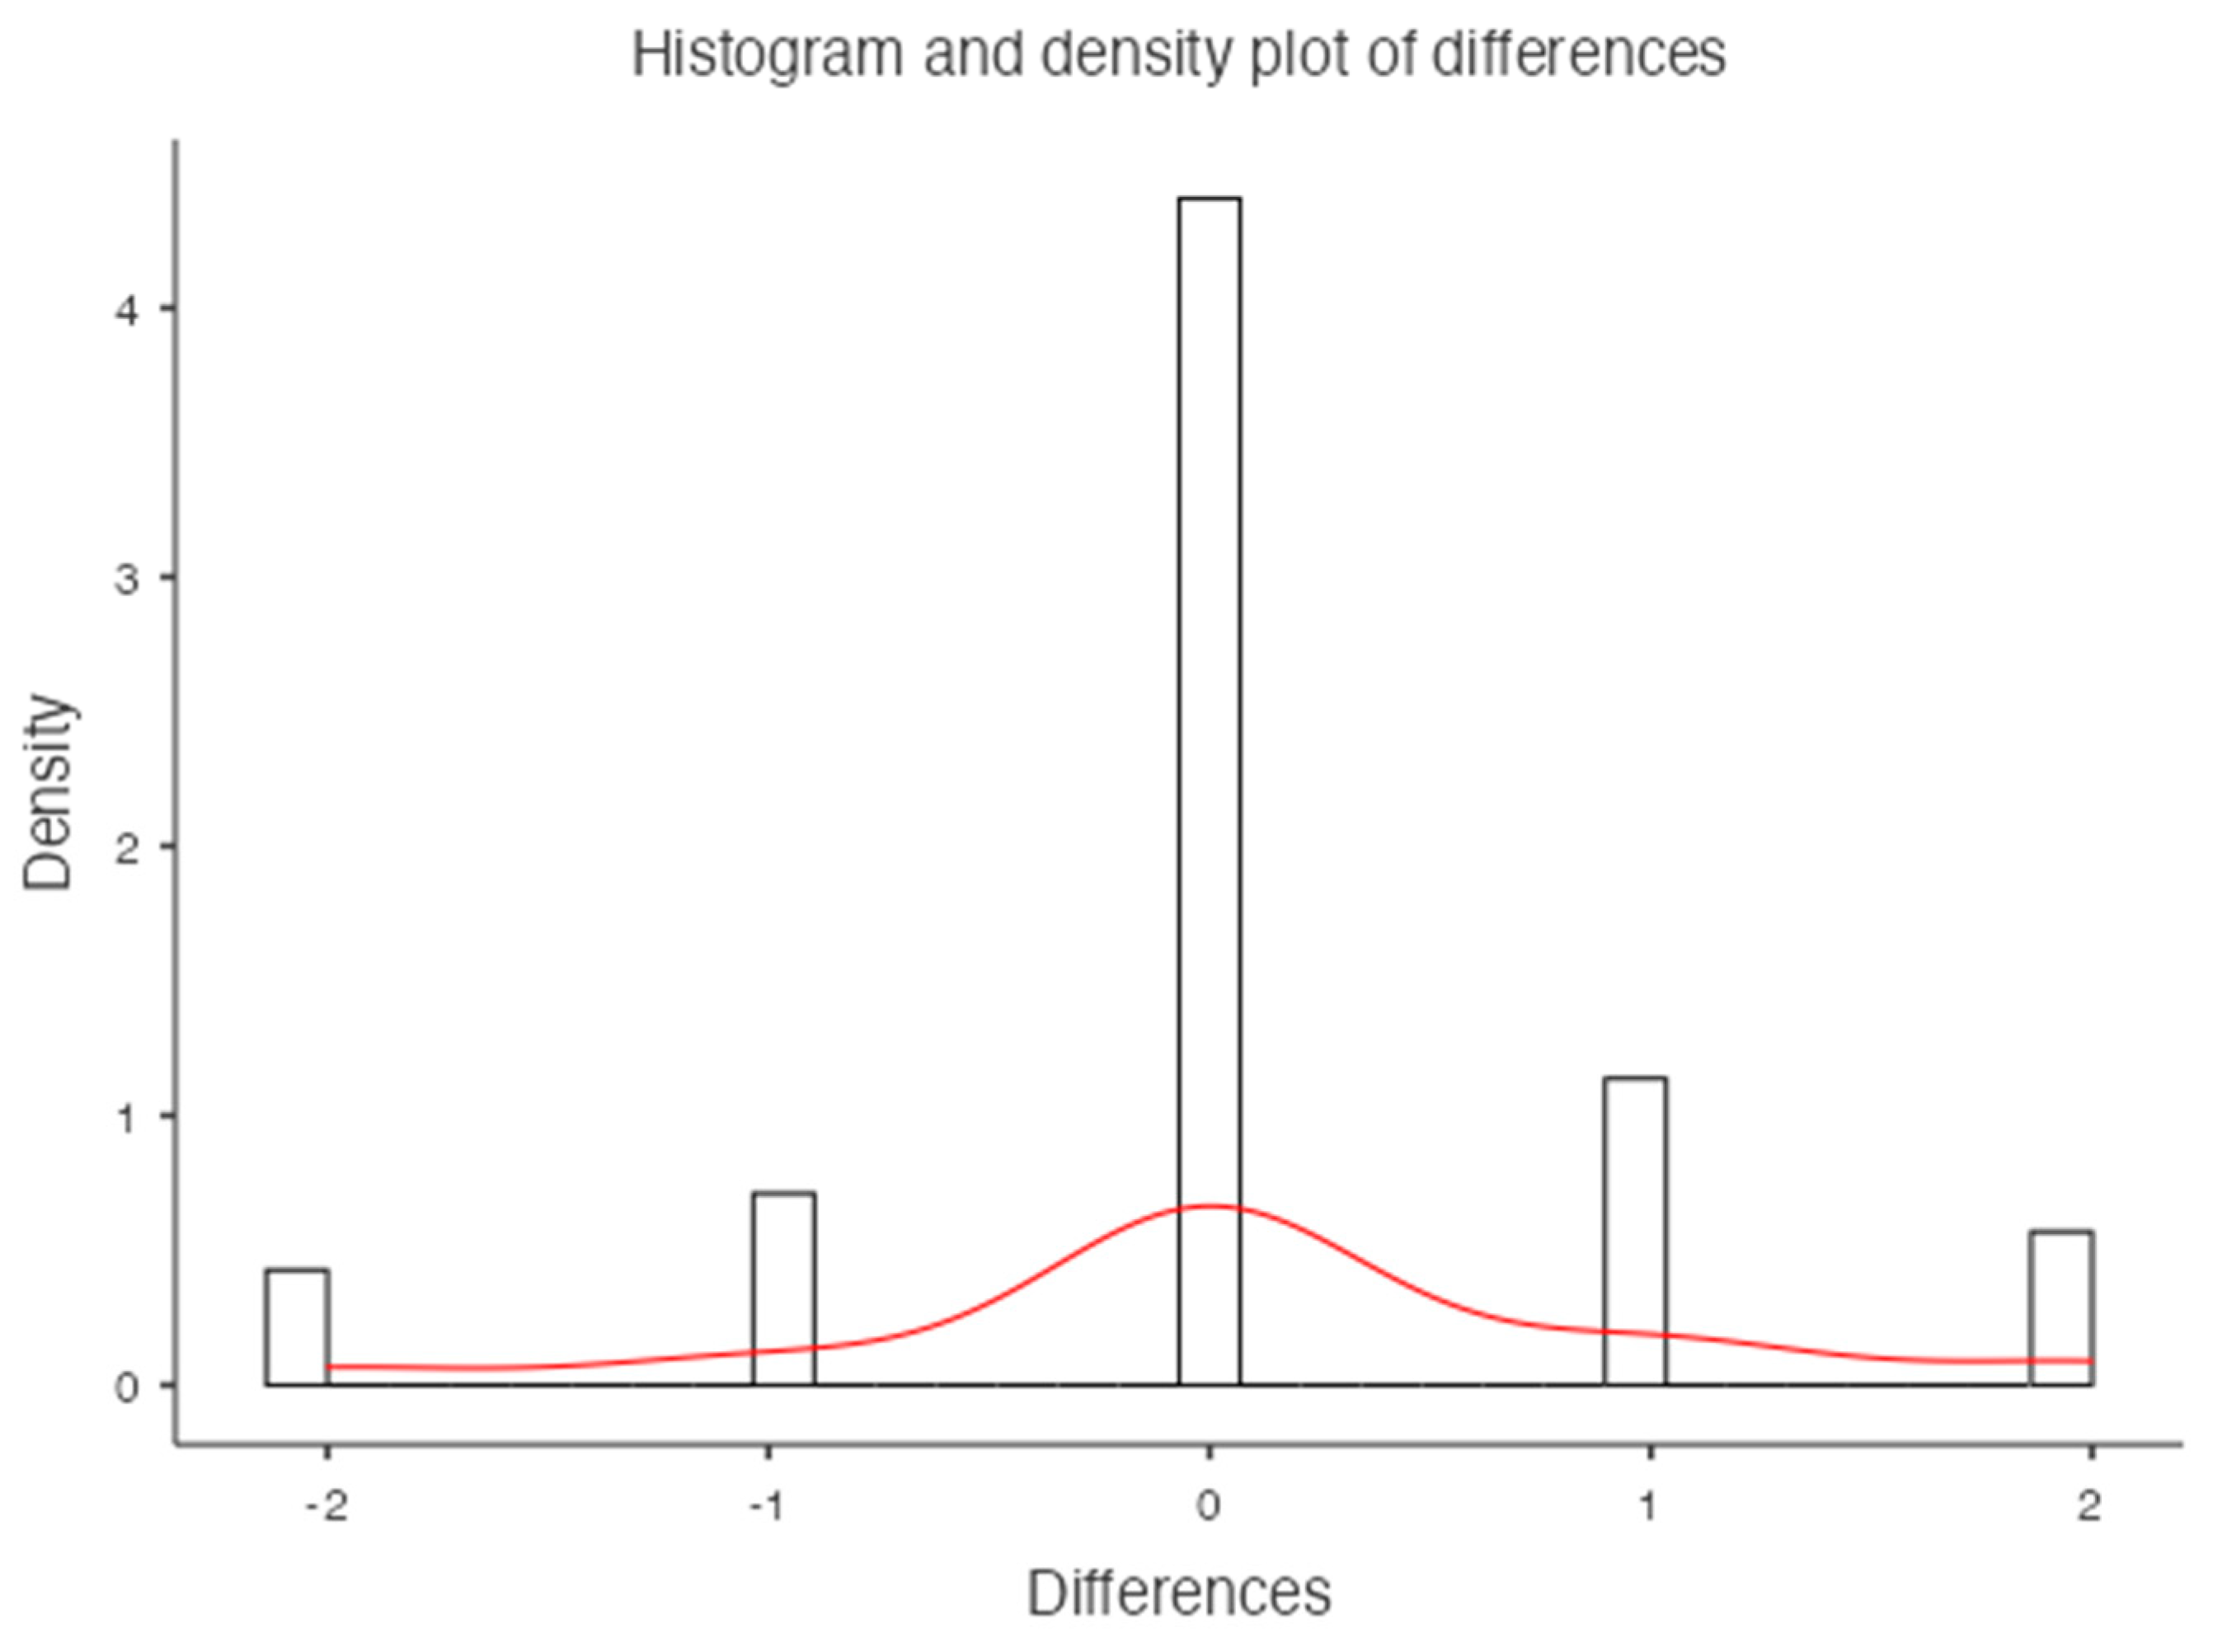
Figure 5). There was a significant difference among the osteoporosis, osteopenic and normal groups in BMD and T-score (all p < 0.001). The mean HAP value on DECT images was 144.86 mg/cm
3 for the osteoporosis group, 162.49 mg/cm
3 for the osteopenic group and 139.57 mg/cm
3 for the normal group (p= 0.2591) (
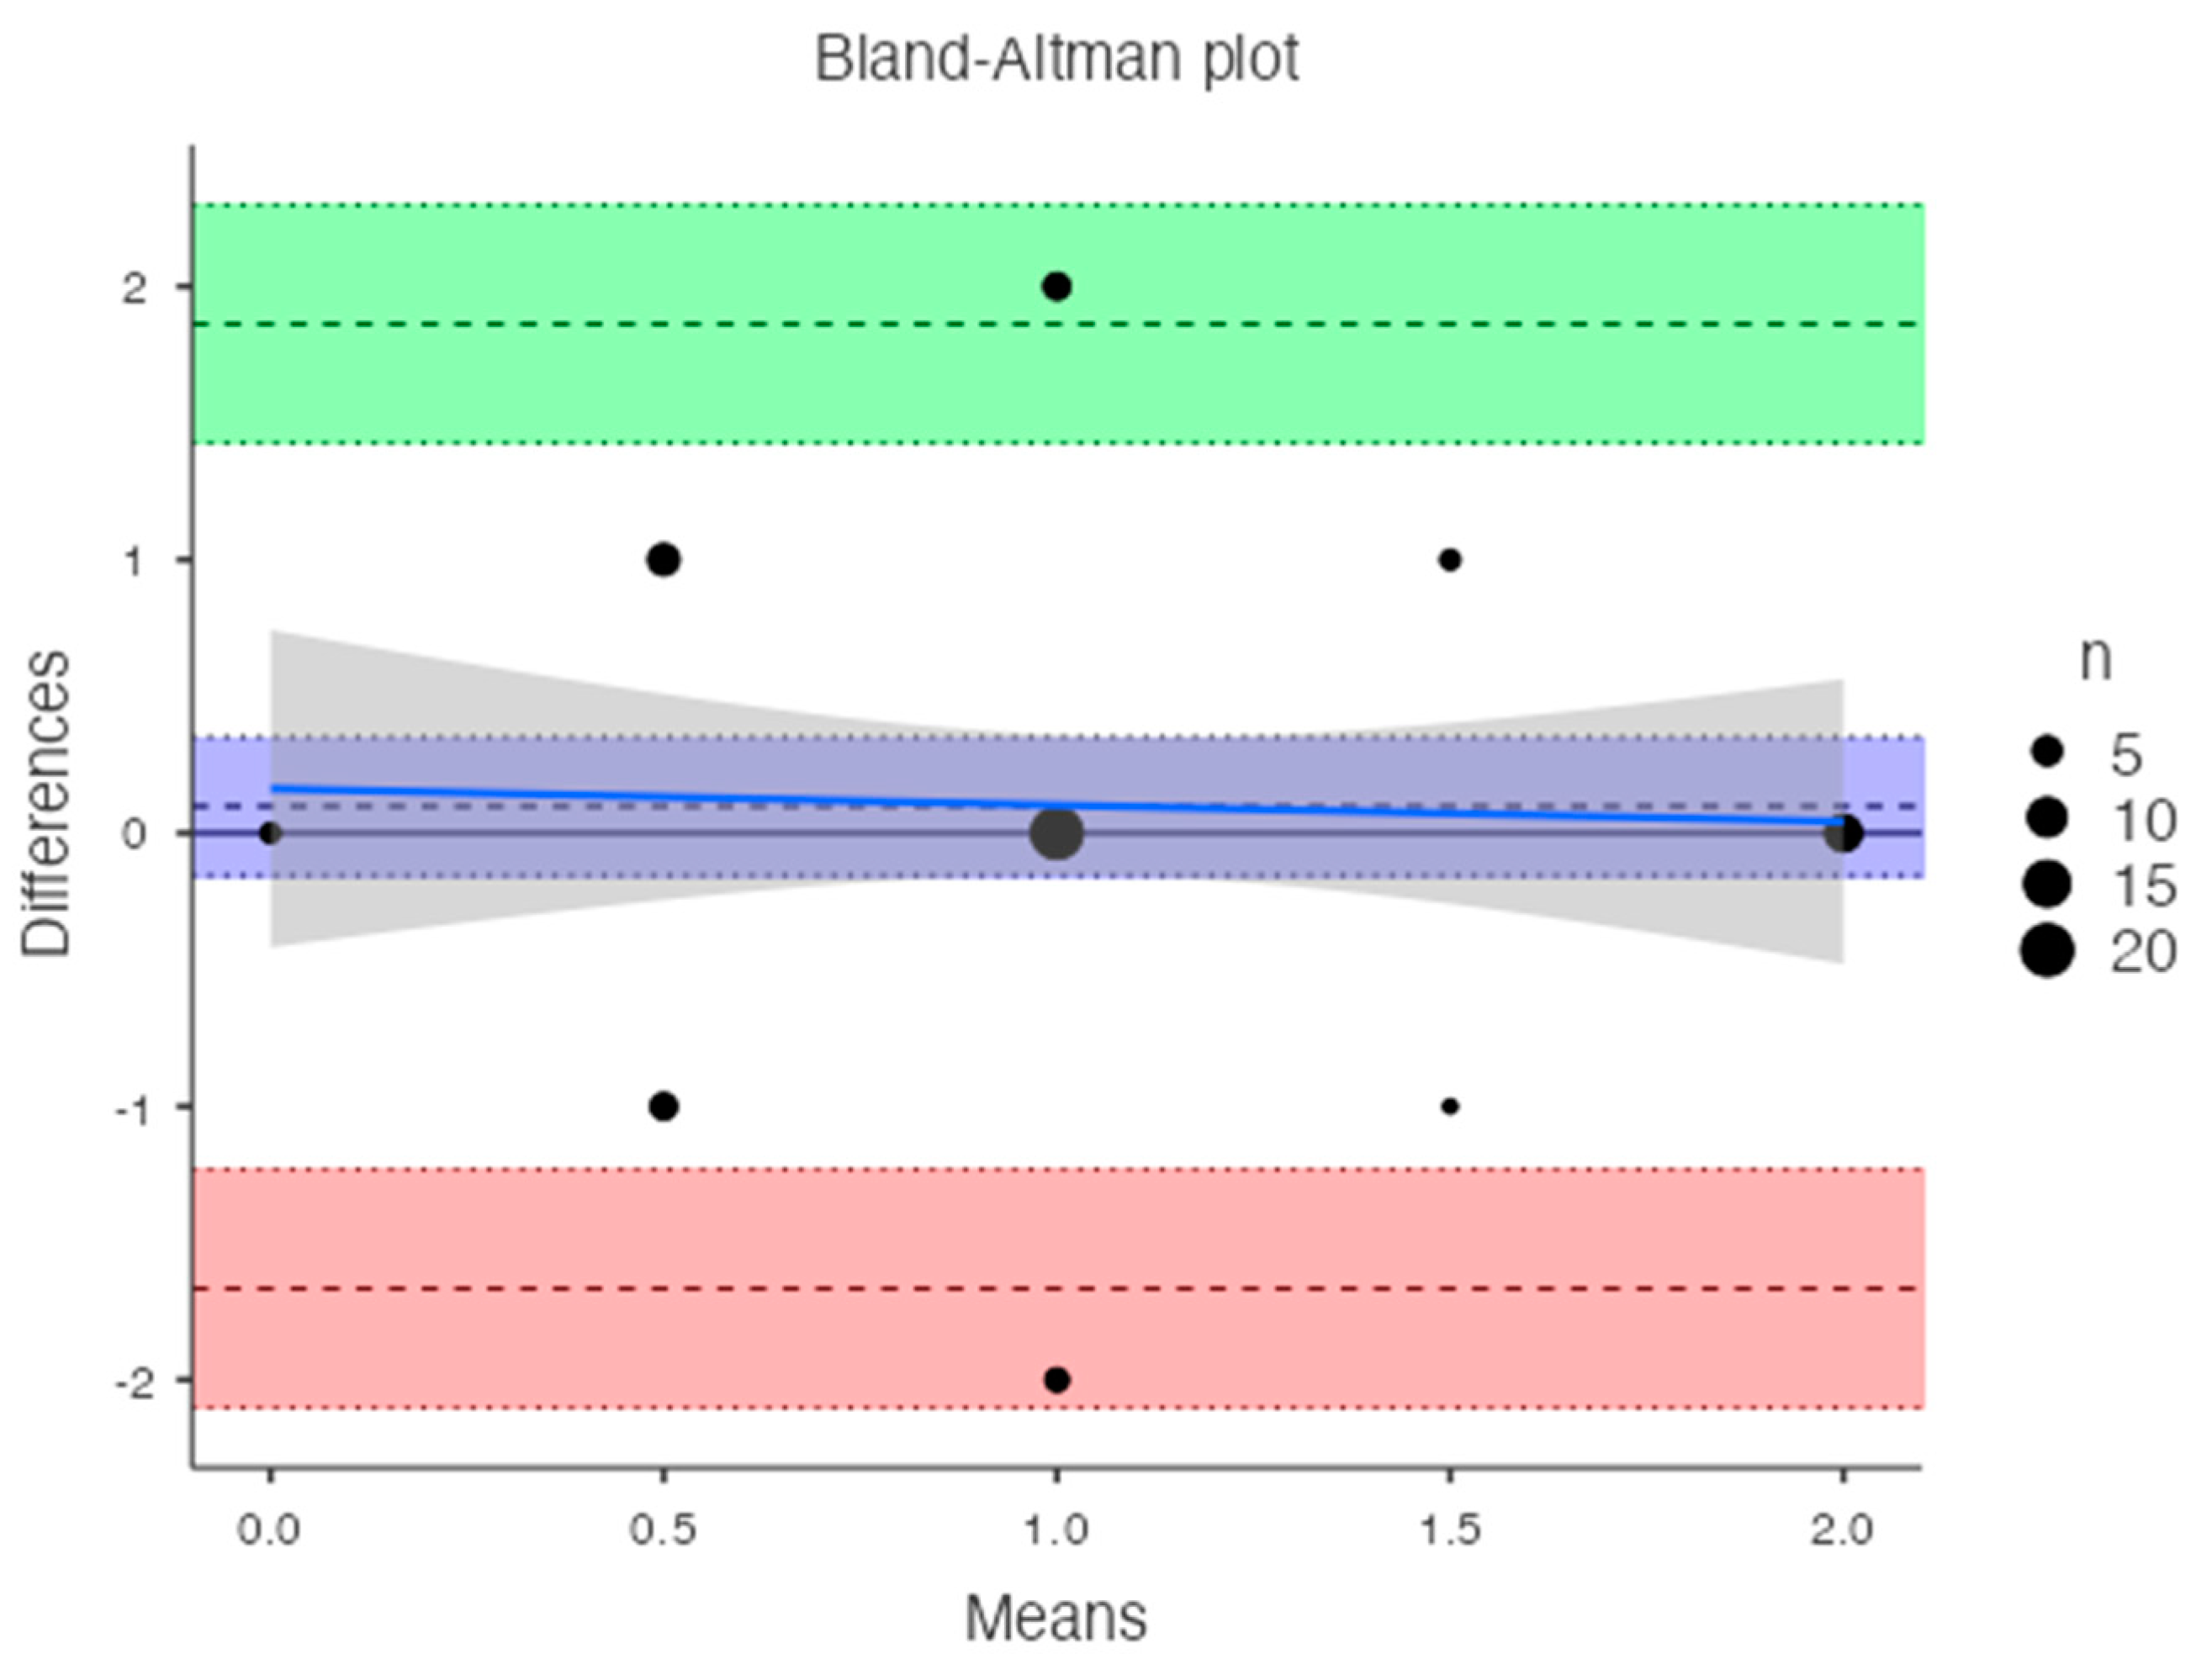
Table 1). Bland-Altman analysis revealed a bias of 0.09, with 95% limits of agreement from −1.6 to 1.8 (p = 0.4) (
Figure 6).
For the femoral neck the mean BMD and T-score on DXA images were 0.522 g/cm
2 and -2.92 for the osteoporosis group, 1.19 g/cm
2 and -1.7 for the osteopenic group and 1.98 g/cm
2 and -0.68 for the normal group, respectively (
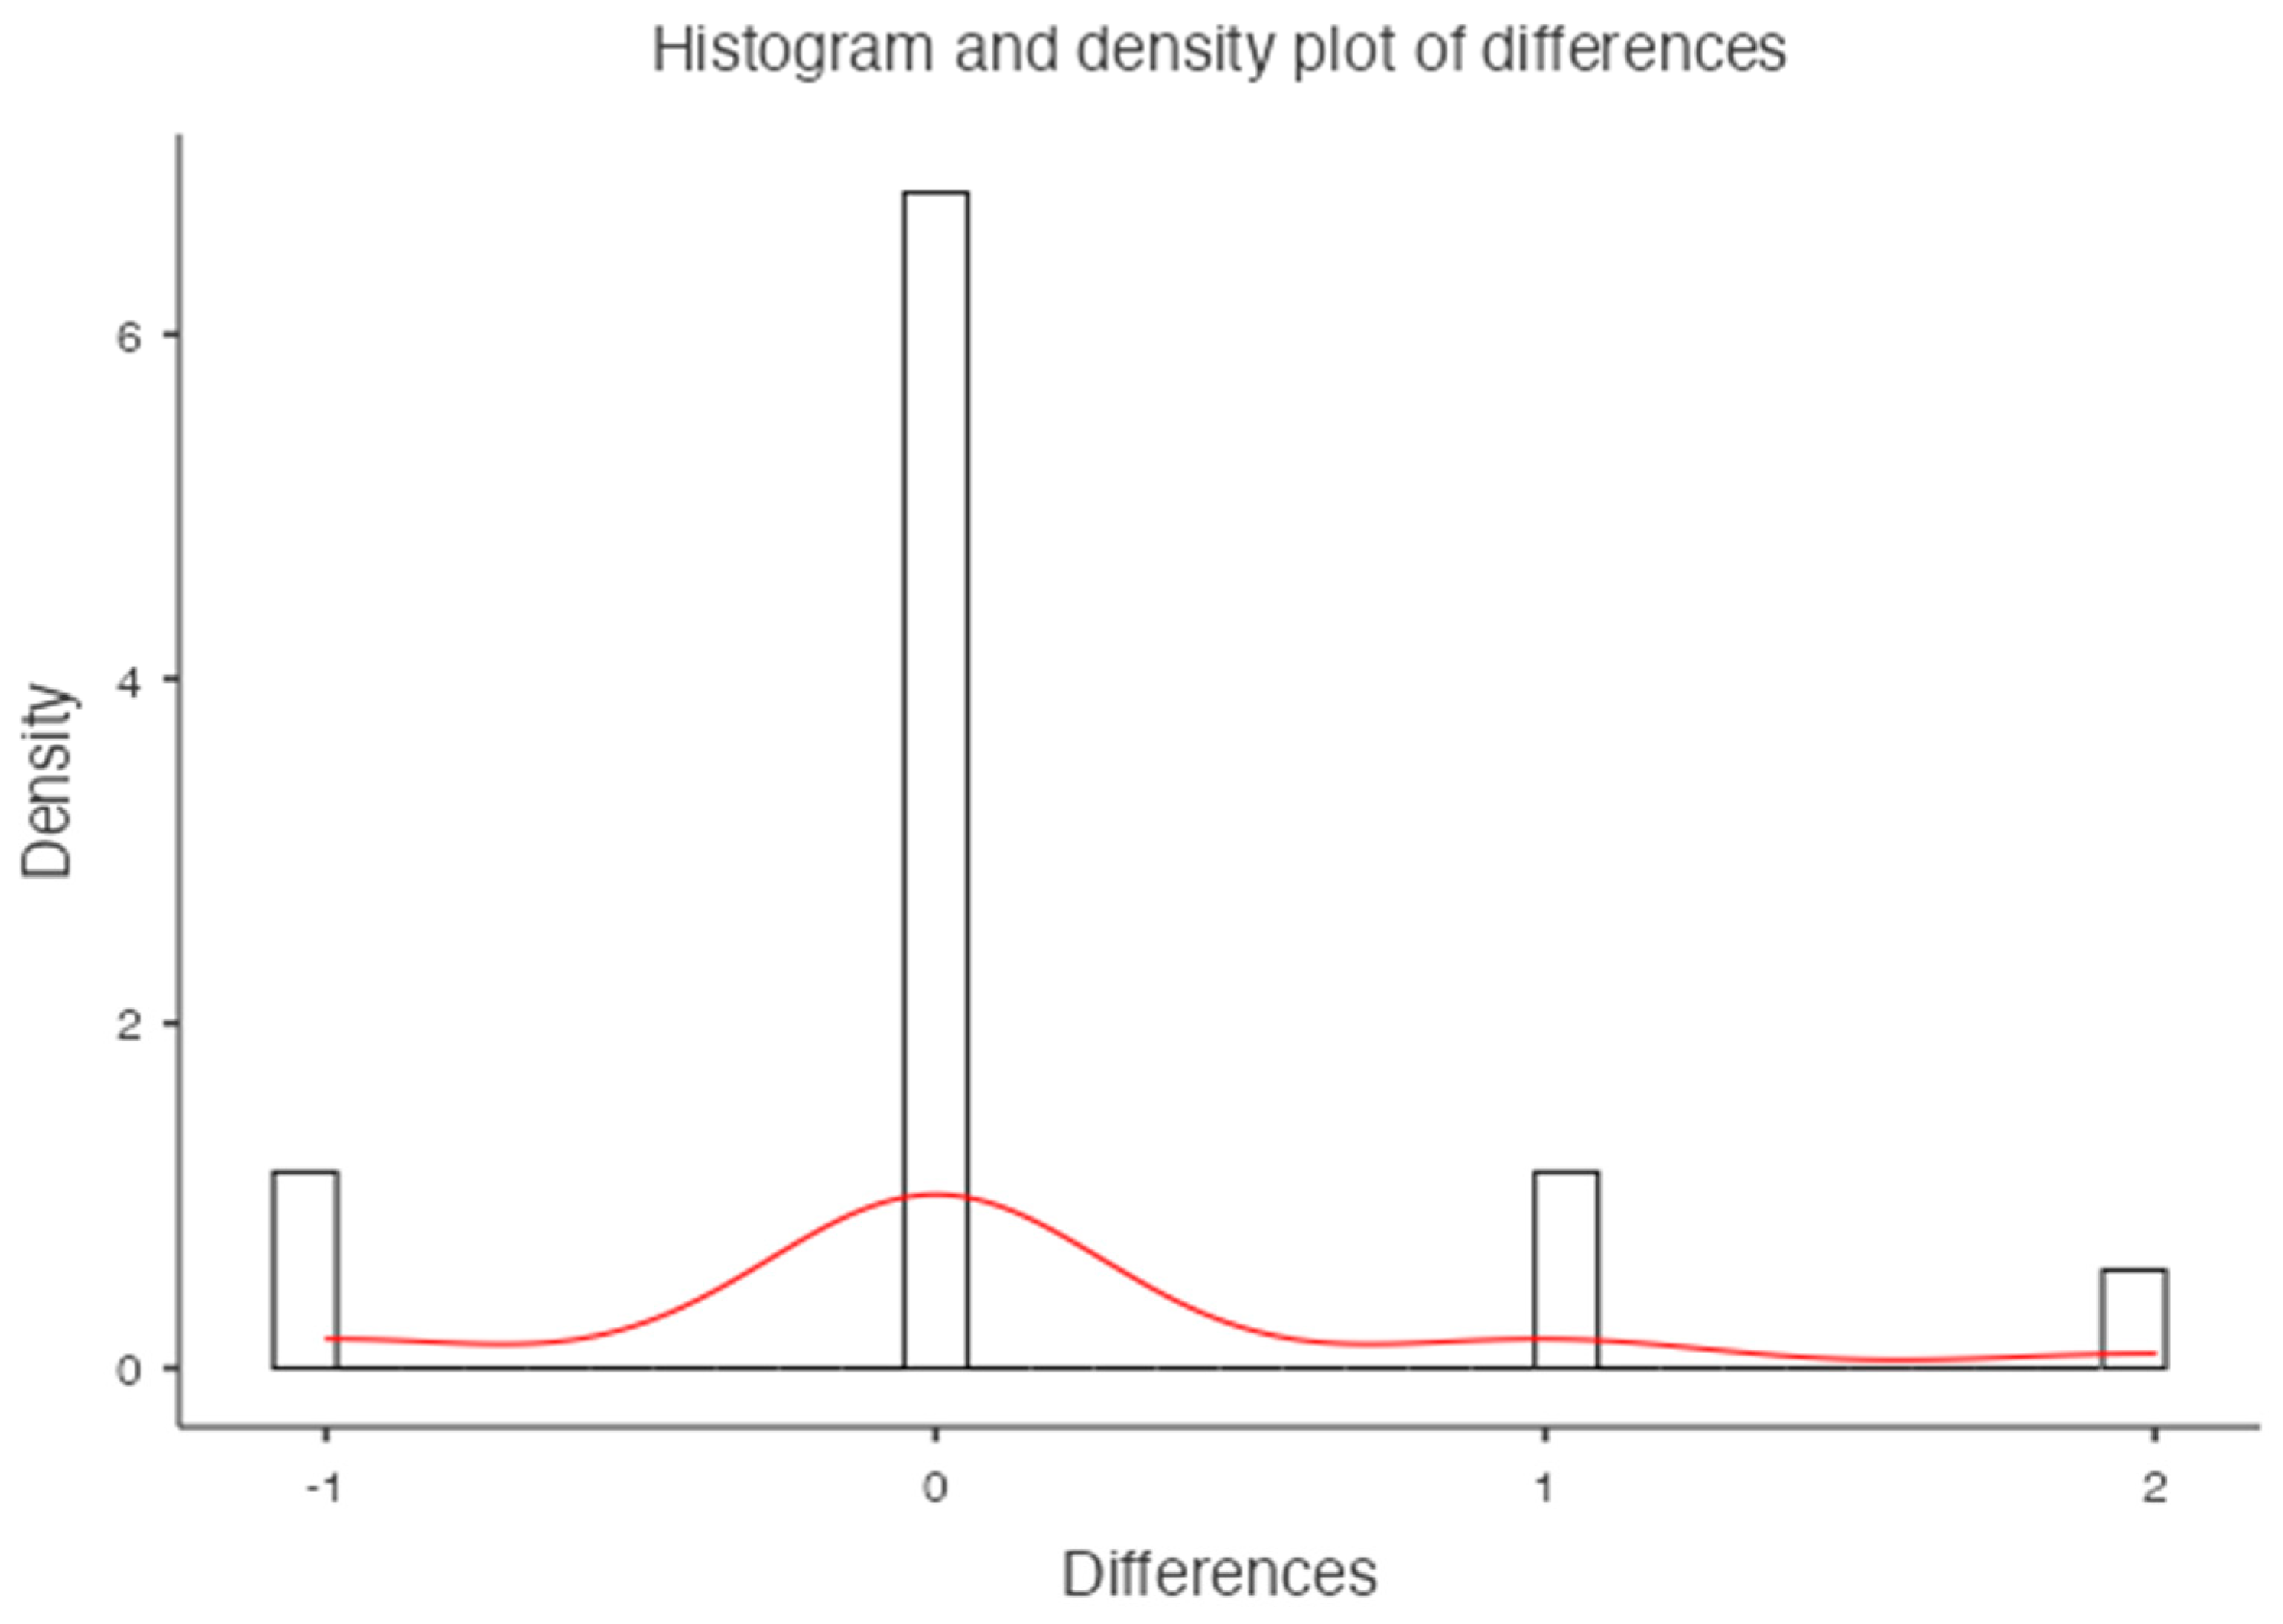
Figure 7). There was a significant difference among the osteoporosis, osteopenic and normal groups in BMD and T-score (all p < 0.001). The mean HAP value on DECT images was 74.71 mg/cm
3 for the osteoporosis group, 107.57 mg/cm
3 for the osteopenic group and 121.93 mg/cm
3 for the normal group (p < 0.001) (
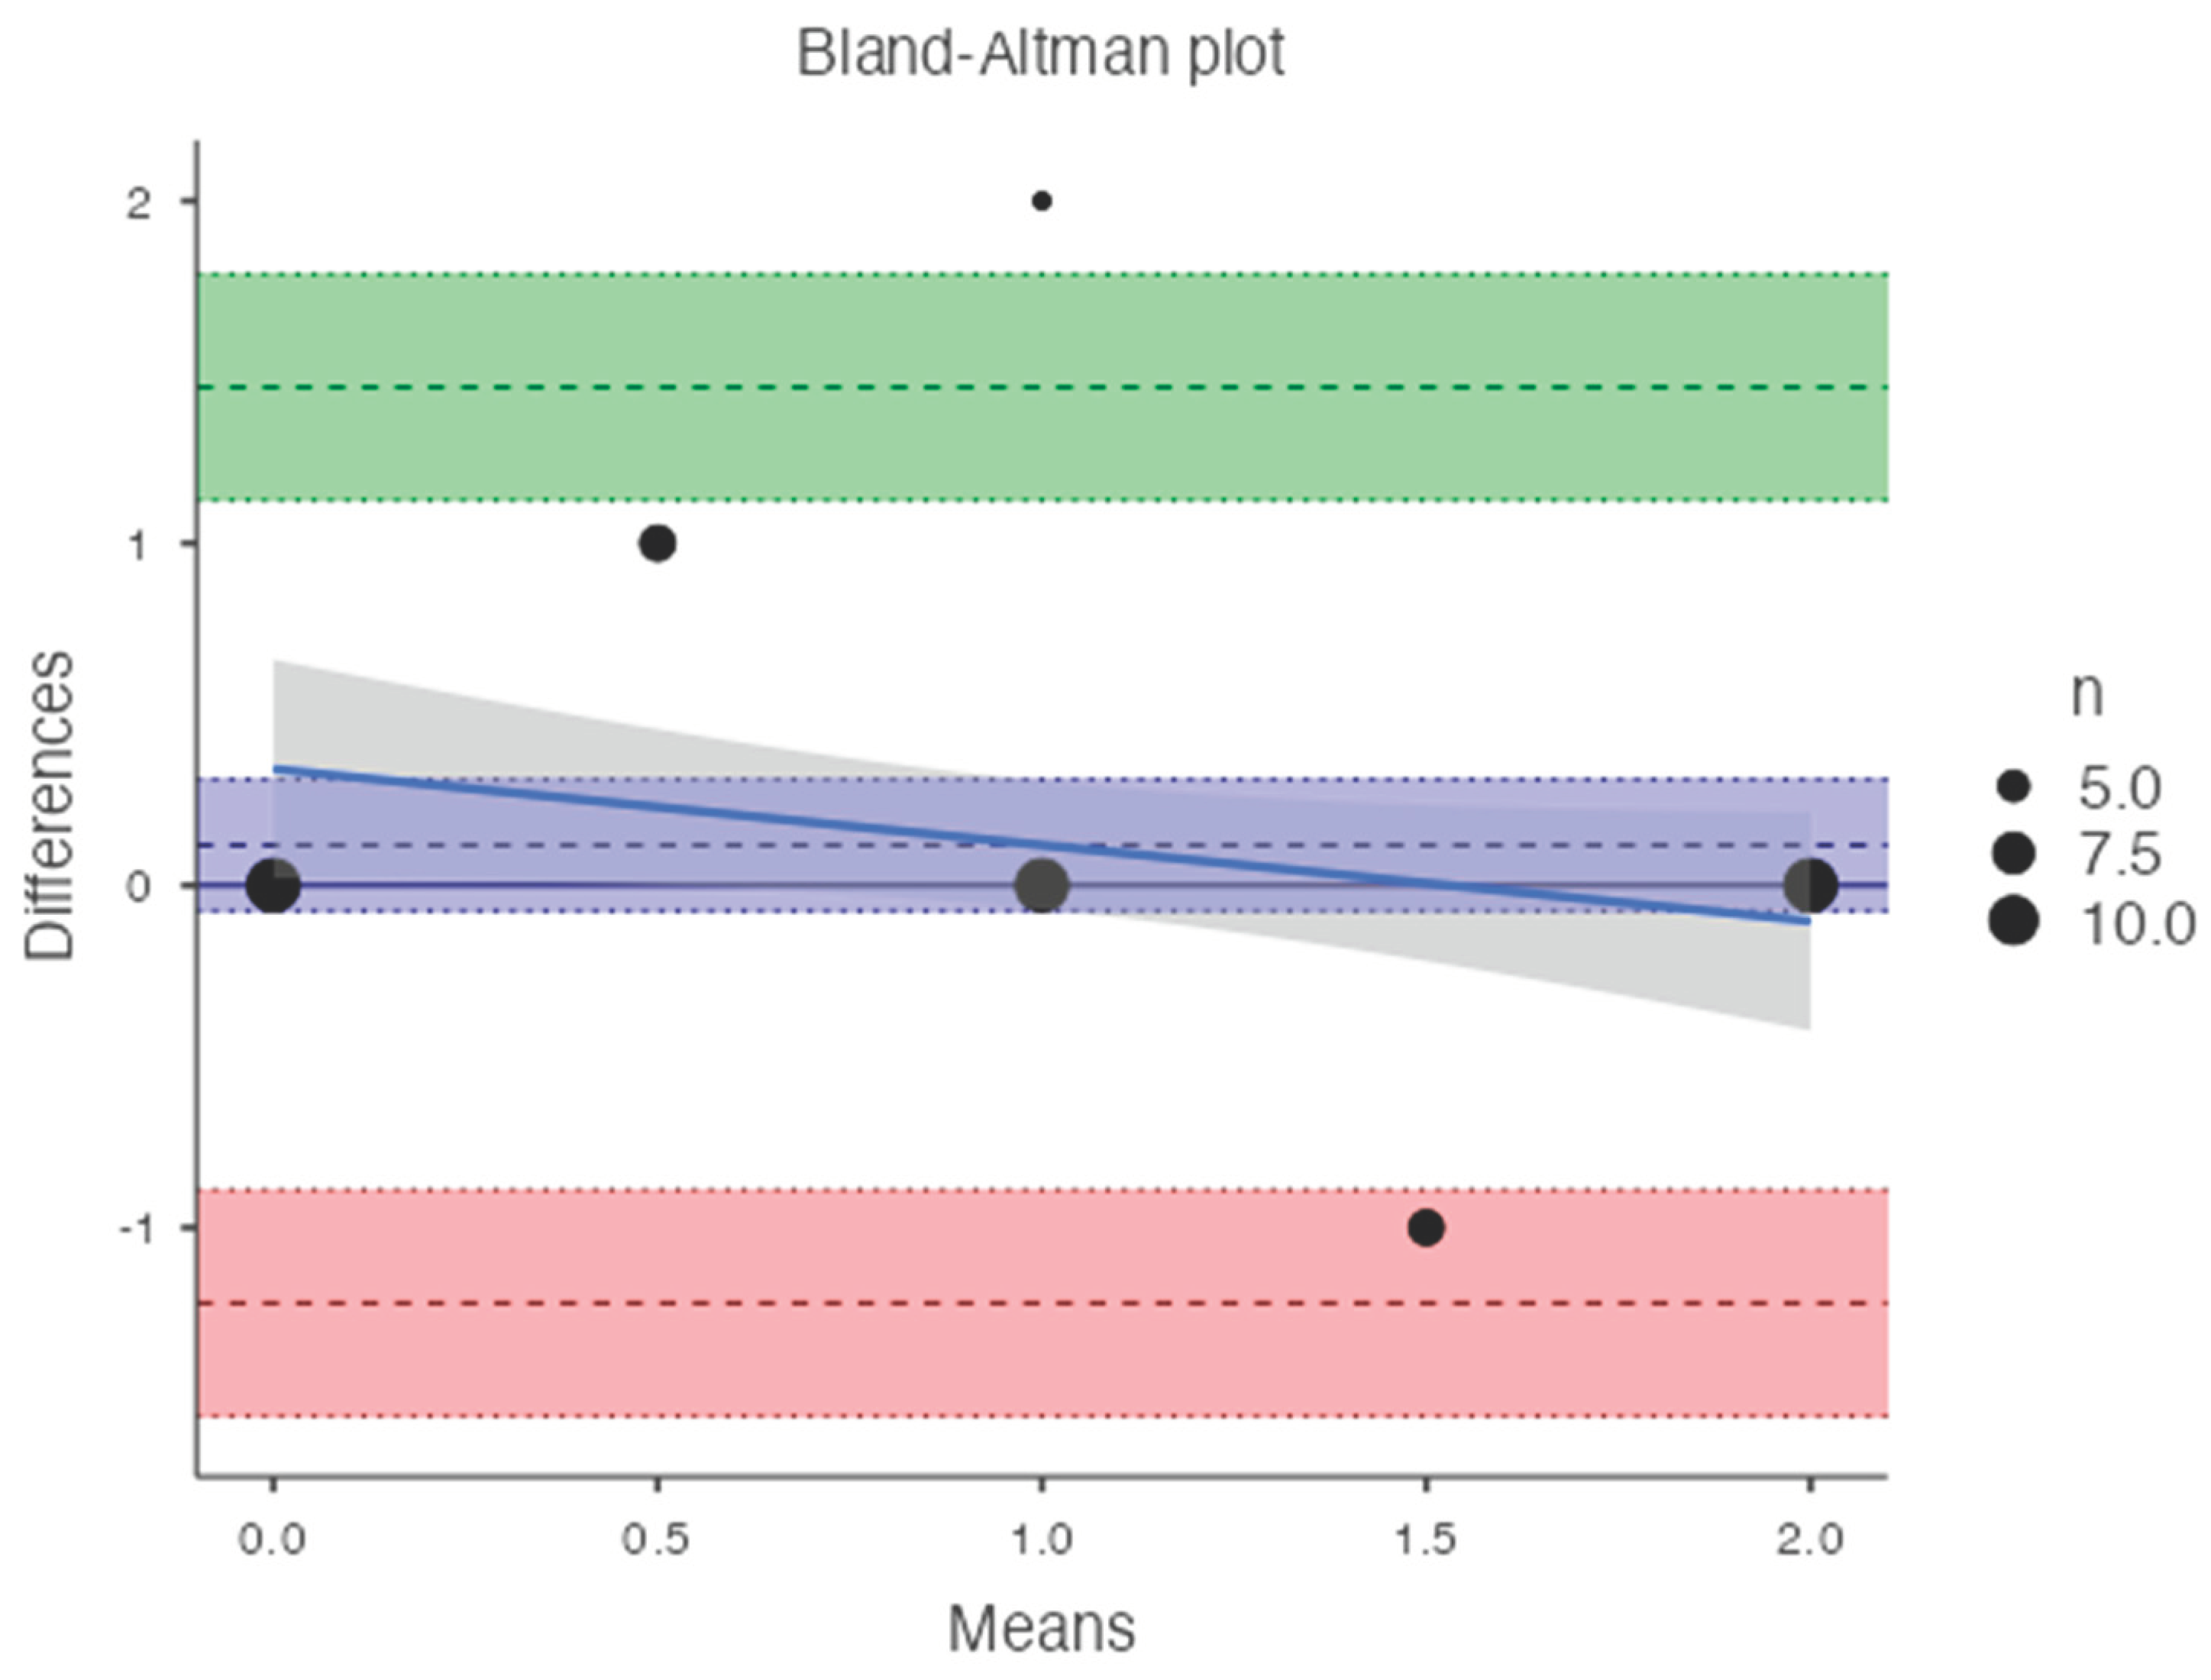
Table 2). Bland-Altman analysis revealed a bias of 0.11, with 95% limits of agreement from −1.2 to 1.4 (p = 0.2) (
Figure 8).
An inverse correlation was observed between T-score and DECT HAP(fat) measurements on the lumbar vertebrae (R2: -0.042; RMSE: 0.690). In contrast, a good linear relationship was found between T-score and DECT HAP(fat) measurements on the femoral neck (R2: 0.341; RMSE: 0.589).
4. Discussion
Despite DXA is still considered to be the gold standard in osteoporosis’ diagnostic programs, several studies reported the opportunistic role of CT scan as a useful tool for assessing BMD [
10] since DXA cannot be used in patients with scoliosis or calcifications from chronic disease, metal implants in both hips or at multiple levels of the spine, or cement in a vertebral body. In addition, DXA cannot distinguish cancellous bone from cortical bone quality as it is based on two dimensions. As shown by Pickhardt and colleagues [
11], the use of CT-derived lumbar BMD vs DXA measurements is helpful. In a population study of almost 2000 adults, CT scans were both specific and sensitive (>90%) in osteoporosis detection compared to DXA scans.
In this retrospective study, we demonstrated the potential of DECT to obtain BMD values in mg/cm3 using a specific image reconstruction algorithm [
12]. In fact, the use of the HAP(fat) algorithm allowed for additional information in routine scans without further radiation exposure.
In a single scan, DECT has the capability to achieve material separation and generate various base material pairs based on clinical requirements, accompanied by a set of monochromatic images. Some experimental and clinical studies indicate that the density value of the base substance can effectively represent the material content when the chosen base material pairs closely match the actual material. According to Deng et al, we found that HAP concentration using HAP(fat) material pair was correlated with BMD, and the CT value (HU) was also measured on the DECT monochromatic images that are less susceptible to beam hardening artifacts. [
13]
In contrast to Gruenewald et al. [
14], our analysis not only assessed the lumbar vertebrae (L1 to L4) but also extended to include the femoral neck. Unlike other studies, we did not find a statistically significant correlation between vertebral values obtained with DXA and DECT, as DECT assesses the true volumetric BMD of trabecular bone while DXA measures in reference to a surface, including both cortical and trabecular components [
15,
16]. On the contrary, we found a correlation between femoral measurements from DXA and DECT. This result could be beneficial in the future to spare patients undergoing regular screening for chronic diseases from unnecessary DXA exams, potentially saving radiation exposure.
Specific BMD values obtained with DECT for osteoporosis diagnosis should be further developed in future studies with larger patient cohorts, making DECT a routine technique for osteoporosis diagnosis. Moreover, patients with chronic conditions undergoing DXA for BMD evaluation and additional DECT for disease follow-up could benefit from a BMD calculation through routine DECT, minimizing radiation exposure [
17,
18].
This study has several limitations. The first is that the reference standard for BMD values was DXA, as literature lacked DECT reference values. DXA may introduce variability in measurements due to overlying soft tissues, vascular calcifications, intestinal contents, and degenerative bone changes, potentially influencing results. Moreover, the study did not assess risk factors for BMD alterations, as patients were opportunistically studied during routine exams for other purposes, and external factors (medications, comorbidities) were not considered. The third is that the HAP(fat) algorithm was vendor-specific, making our results non-reproducible with DECT from different vendors. Furthermore, only postmenopausal women were included in this study, while WHO T-score standards encompass both men and premenopausal women. The last one is that data collection involved four different operators for different patients, potentially introducing variability in VOI positioning. An automatic trabecular bone density calculation algorithm would reduce this variability.
5. Conclusions
No significant correlation was observed between T-score and DECT HAP(fat) measurements on the lumbar vertebrae, on the other hand a good linear relationship was found between T-score and DECT HAP(fat) measurements on the femoral neck. DECT scans performed on the femoral neck may be used to assess bone mineral density and fracture risk, improving the ability to track disease progression and providing better care.
Author Contributions
Conceptualization, L.P.S and S.P.; Data Curation, L.P.S, S.P. and S.A.C.; Formal Analysis, L.P.S, S.P, L.M.; Investigation, S.P., S.A.C and S.S.; Methodology, L.P.S, S.P and S.A.C.; Project Administration, L.P.S. and S.P.; Resources, L.M., R.V.; Supervision, P.M., L.M., R.V., L.P.S. and S.P.; Validation, P.M., R.V. and L.M.; Visualization, P.M., S.S.; Writing—Original Draft, S.S., S.P, S.A.C; Writing—Review and Editing, S.S., L.P.S., S.P., S.A.C., L.M., P.M, L.M. and R.V. All authors have read and agreed to the published version of the manuscript.
Funding
This research received no external funding.
Institutional Review Board Statement
This study was conducted in accordance with the Declaration of Helsinki.
Data Availability Statement
The data presented in this study are available on request from the corresponding author.
Conflicts of Interest
The authors declare no conflicts of interest.
References
- Grüneboom, A.; Kling, L.; Christiansen, S.; Mill, L.; Maier, A.; Engelke, K.; Quick, H.H.; Schett, G.; Gunzer, M. Next-generation imaging of the skeletal system and its blood supply. Nat Rev Rheumatol. 2019, 15, 533–549. [Google Scholar] [CrossRef] [PubMed]
- Francisco, I.; Nunes, C.; Pereira, F.; Travassos, R.; Ribeiro, M.P.; Marques, F.; McEvoy, M.; Santos, M.; Oliveira, C.; Marto, C.M.; et al. Bone Mineral Density through DEXA and CBCT: A Systematic Review with Meta-Analysis. Appl. Sci. 2023, 13, 5962. [Google Scholar] [CrossRef]
- Harris, K.; Zagar, C.A.; Lawrence, K.V. Osteoporosis: Common Questions and Answers. Am Fam Physician. 2023, 107, 238–246. [Google Scholar] [PubMed]
- Kanis, J.A. , WHO Study Group. Assessment of fracture risk and its application to screening for postmenopausal osteoporosis: synopsis of a WHO report. Osteoporos Int. 1994, 4, 368–81. [Google Scholar] [CrossRef] [PubMed]
- Link, T.M. ; Osteoporosis imaging: state of the art and advanced imaging. Radiology, 2012, 263, 3–17. [Google Scholar] [CrossRef] [PubMed]
- Courtois, E.; et al. Assessing lumbar vertebral bone quality: a methodological evaluation of CT and MRI as alternatives to traditional DEXA. Eur Spine J, 2023, 32, 3176–3182. [Google Scholar] [CrossRef] [PubMed]
- Bolotin, H.H. ; DXA in vivo BMD methodology: an erroneous and misleading research and clinical gauge of bone mineral status, bone fragility, and bone remodelling. Bone, 2007, 41, 138–54. [Google Scholar] [CrossRef] [PubMed]
- Vetter, J.R.; Perman, W.H.; Kalender, W.A.; Mazess, R.B.; Holden, J.E. Evaluation of a prototype dual-energy computed tomographic apparatus. II. Determination of vertebral bone mineral content. Med Phys. 1986, 13, 340–3. [Google Scholar] [CrossRef] [PubMed]
- Booz, C.; Nöske, J.; Martin, S.S.; Albrecht, M.H.; Yel, I.; Lenga, L.; Gruber-Rouh, T.; Eichler, K.; D'Angelo, T.; Vogl, T.J.; Wichmann, J.L. Virtual Noncalcium Dual-Energy CT: Detection of Lumbar Disk Herniation in Comparison with Standard Gray-scale CT. Radiology. 2019, 290, 446–455. [Google Scholar] [CrossRef] [PubMed]
- Touban, B.M.; Sayegh, M.J.; Galina, J.; Pavlesen, S.; Radwan, T.; Anders, M. Computed Tomography Measured Psoas Cross Sectional Area Is Associated With Bone Mineral Density Measured by Dual Energy X-Ray Absorptiometry. J Clin Densitom., 2022, 25, 592–598. [Google Scholar] [CrossRef] [PubMed]
- Pickhardt, P.J.; Pooler, B.D.; Lauder, T.; del Rio, A.M.; Bruce, R.J.; Binkley, N. Opportunistic screening for osteoporosis using abdominal computed tomography scans obtained for other indications. Ann Intern Med. 2013, 158, 588–595. [Google Scholar] [CrossRef] [PubMed]
- Wesarg, S.; Kirschner, M.; Becker, M.; Erdt, M.; Kafchitsas, K.; Khan, M.F. Dual-energy CT-based assessment of the trabecular bone in vertebrae. Methods Inf Med. 2012, 51, 398–405. [Google Scholar] [PubMed]
- Deng, L.; Yao, Y.; Shang, A.L.; Du, T.; Zhang, J.; Yang, Q.; Li, J.; Wang, Q.; Li, X. Opportunistic screening for osteoporosis using hydroxyapatite measurements of the vertebral by thorax dual-energy spectral CT in postmenopausal females. Sci Rep. 2022, 12, 21642. [Google Scholar] [CrossRef] [PubMed]
- Gruenewald, L.D.; Koch, V.; Martin, S.S.; Yel, I.; Eichler, K.; Gruber-Rouh, T.; Lenga, L.; Wichmann, J.L.; Alizadeh, L.S.; Albrecht, M.H.; Mader, C.; Huizinga, N.A.; D'Angelo, T.; Mazziotti, S.; Wesarg, S.; Vogl, T.J.; Booz, C. Diagnostic accuracy of quantitative dual-energy CT-based volumetric bone mineral density assessment for the prediction of osteoporosis-associated fractures. Eur Radiol. 2022, 32, 3076–3084. [Google Scholar] [CrossRef] [PubMed]
- Booz, C.; Hofmann, P.C.; Sedlmair, M.; Flohr, T.G.; Schmidt, B.; D'Angelo, T.; Martin, S.S.; Lenga, L.; Leithner, D.; Vogl, T.J.; Wichmann, J.L. Evaluation of bone mineral density of the lumbar spine using a novel phantomless dual-energy CT post-processing algorithm in comparison with dual-energy X-ray absorptiometry. Eur Radiol Exp. 2017, 1, 11. [Google Scholar] [CrossRef] [PubMed]
- Wichmann, J.L.; Booz, C.; Wesarg, S.; Kafchitsas, K.; Bauer, R.W.; Kerl, J.M.; Lehnert, T.; Vogl, T.J.; Khan, M.F. Dual-energy CT-based phantomless in vivo three-dimensional bone mineral density assessment of the lumbar spine. Radiology. 2014, 271, 778–84. [Google Scholar] [CrossRef] [PubMed]
- Haworth, C.S.; Selby, P.L.; Webb, A.K.; Dodd, M.E.; Musson, H.; McL Niven, R.; Economou, G.; Horrocks, A.W.; Freemont, A.J.; Mawer, E.B.; Adams, J.E. Low bone mineral density in adults with cystic fibrosis. Thorax. 1999, 54, 961–7. [Google Scholar] [CrossRef] [PubMed]
- Grotz, W.H.; Mundinger, F.A.; Rasenack, J.; Speidel, L.; Olschewski, M.; Exner, V.M.; Schollmeyer, P.J. Bone loss after kidney transplantation: a longitudinal study in 115 graft recipients. Nephrol Dial Transplant. 1995, 10, 2096–100. [Google Scholar] [PubMed]
|
Disclaimer/Publisher’s Note: The statements, opinions and data contained in all publications are solely those of the individual author(s) and contributor(s) and not of MDPI and/or the editor(s). MDPI and/or the editor(s) disclaim responsibility for any injury to people or property resulting from any ideas, methods, instructions or products referred to in the content. |
© 2024 by the authors. Licensee MDPI, Basel, Switzerland. This article is an open access article distributed under the terms and conditions of the Creative Commons Attribution (CC BY) license (http://creativecommons.org/licenses/by/4.0/).
