Preprint
Article

On a New Theory of Climate Interference for MISs and Glacial Terminations from Antarctica Ice-core Records. 1: Interference Model

Altmetrics

Downloads

152

Views

95

Comments

0

This version is not peer-reviewed

Submitted:

15 March 2024

Posted:

15 March 2024

Read the latest preprint version here

Alerts
Abstract
Variance-driven decomposition based on the singular spectrum analysis of the European Project for Ice Coring in Antarctica (EPICA) dD, CO2 and CH4 records allowed a novel quantitative structural interpretation of all glacial/interglacial cycles and glacial terminations of the last 800 kyr. This bottom-up approach used the response components of EPICA stacked records to reconstruct the envelope of the thermal response through a physical interference model. The aim was to improve the understanding regarding the features of intensity, amplitude, and asymmetry of 73 marine isotope stages (MIS) and seven terminations. The Antarctic stack record can be described by a variance-weighted interference model of ten thermal waves of different origins (mid-term oscillation, orbitals and suborbitals) that stochastically interfere at a given time according to their relative differences in frequency, intensity, and polarity. Interglacial/glacial stages resulted from constructive interference and bipolar amplification of warming/cooling responses, respectively. The low intensity MISs (including 90% of substages) and the unbiased-dated terminations fell in the low interference regions where dominant destructive patterns minimise the thermal envelope. The positive skewness of the EPICA stack resulted from the constructive interference with a strong bias in the warming direction, especially after the Mid-Brunhes Event. Duration analysis of short eccentricity hemicycles exhibited an intrinsic unexpectedly prolonged mean cooling in the nominal solution (5.8 kyr) and its EPICA response as well (8.6 kyr), along with an interference-induced asymmetry (21.1 kyr). The overall effect resulted in the saw-tooth shape of glacial cycles which is heavily induced by interference and related to the intermediate feedback mechanisms controlled by short eccentricity.
Keywords: 
Subject: Environmental and Earth Sciences  -   Geophysics and Geology

1. Introduction

The Mid-Late Pleistocene glacial-interglacial cycles are particularly relevant for understanding the dynamics of the past climate system and assessing the Holocene interglacial period and current climate change. However, the fundamental characteristics of climatic variability remain unclear [1,2,3,4,5,6]. The state of current knowledge is well summarised in the IPCC [7] report cited in Ellis and Palmer [4], which affirms that “Orbital forcing is considered the pacemaker of transitions between glacials and interglacials (high confidence), although there is still no consensus on exactly how the different physical processes influenced by insolation changes interact to influence ice sheet volume.
During the Pliocene-Pleistocene, Northern Hemisphere (NH) glaciation gradually developed in four subtrends [8,9] that progressively lowered the global average temperature and ice-volume growth [10,11,12,13,14,15,16,17,18], which was followed by a relative stasis of ice growth and temperature cooling in the last 600 kyr; this period is termed the Mid-Brunhes Oscillation (MBO) [8,19]. This trend of climate cooling was triggered by non-orbital long-term changes in atmospheric greenhouse gases (GHGs) composition [8,20,21,22,23]. By superimposing orbital forcings on this long-term trend of climate deterioration that caused relevant mean climate state changes [8,9], spectacular glacial-interglacial cycles in the main frequency bands of precession (~ 21-kyr), obliquity (~ 41 kyr), and short eccentricity (~ 100 kyr) were determined, which functioned as the ‘orbital pacemaker’ of climate [24,25,26]. The Mid-Pleistocene Transition (MPT) from ~ 1.2 to 0.7 Ma marked a fundamental change in the climate system state from 41-kyr to ~100-kyr cycles and the beginning of the classic Mid-Late Pleistocene ‘Ice Ages’ [8,9,10,11,27,28]. In this paleoclimatological context, the Earth’s climate in the last 800 kyr (i.e., the post-MPT period during the MBO recovery) is crucial for understanding the wide alternation between cold glacial periods and warm interglacial periods characterised by ~ 100-kyr dominant climate variability (51.6% variance) [19].
The terms ‘glacial’ and ‘interglacial’ underline the changes in ice-volume and sea-level that are associated with the appearance and disappearance of large NH continental ice-sheets [3,5]. Contributions have been made in the field of glacial/interglacial characterisation using a modelling approach [29,30,31,32,33,34]. This top-down approach includes the mathematical representation of atmosphere/ocean/sea ice, land surface and vegetation, ice sheets, carbon cycle, and astronomical forcings to simulate climate signals. Other studies investigated the climate variability using different proxies by reviewing the common features and differences between them to assess the pattern of glacial/interglacial strength, termination duration and timing, insolation characteristics, and intra-MIS variability [2,3,5,6]. Understanding the causes of these oscillations, which are also related to the big unresolved question of the MPT origin, requires not only the replication of a ‘bulk’ glacial cycle and an understanding of how slightly different external forcing can lead to a wide range of responses [3], but also the replication of the internal structure of glacial cycles [9].
Furthermore, there are several unresolved issues regarding Pleistocene climatology, despite the fact that several studies have been conducted on it over many decades. The understanding of the climate system is not satisfactory from a dynamic perspective of how the climate system evolves from glacial to interglacial states and vice versa [5]. The long ice-core records obtained by the European Project for Ice Coring in Antarctica have reinforced the view that each glacial/interglacial cycle has individual patterns in amplitude, length and profile, which remain unclear [1,2,3,5]. There is no simple astronomical factor that controls the amplitude patterns among interglacial periods, which seem to arise, at least in part, from the patterns of carbon dioxide (CO2) [5]. The latter interpretation was supported and extended to glacial stages by Viaggi [19] on both CO2 and CH4 patterns, and confirmed in the present work. However, an observational structural approach to achieve internal organisation of glacial and interglacial stages and substages is lacking. The saw-tooth shape of the Mid-Late Pleistocene glacial cycles (slow cooling and rapid warming) reflects changes in the internal dynamics of the climate system, as asymmetry was not found in any orbital forcing [11,35,36]. These internal dynamics need to be clarified. Moreover, the true nature of glacial ‘termination’ (TER) is still an open question. Glacial TER is strictly defined as the midpoint of the rapid and wide transition between Mid-Late Pleistocene glacial and interglacial climate conditions, as recorded in marine stable oxygen isotopes [37]; it marks the interglacial onset [5]. In contrast to TER, glacial inceptions mark the transition from a relevant interglacial to a glacial state by decreasing temperature, ice sheet build-up, and falling sea level. Understanding their origin is even more difficult.
Viaggi [8,9,19,38] strongly emphasised both the need to study palaeoclimate proxies by variance-driven decomposition spectral methods, and to study these forcing-related components as responses of the climate system overcoming the nominal-centric paradigm. Indeed, climate responses resulted from an exponential feedback-driven (albedo mechanisms, carbon cycle, etc.) energy-transfer [16,39,40,41,42,43,44,45,46,47,48,49,50,51,52] from an initial, low-energy, and orbitally paced insolation change [24,25,26]. This viewpoint involves an interesting perspective change in climate studies from being nominal-centric to response-centric, thus providing new possible interpretative insights into the climate system because response components acquire different characteristics [9].
The present study is the first to examine the internal structures for all glacial and interglacial MISs and TERs over the last 800 kyr, and tries to answer some of the open questions concerning the Mid-Late Pleistocene climate variability based on this new observational perspective. Owing to the full-resolution variance-driven decomposition of EPICA records (δD, CO2 and CH4) [5,53,54,55] obtained using singular spectrum analysis (SSA) [19], it has become possible to provide a novel quantitative structural interpretation of glacial-interglacial cycles and glacial terminations. This bottom-up approach uses the response components of EPICA records (midterm1, orbitals, and suborbitals) [19] to reconstruct the envelope of the thermal response through a physical interference model, with the goal of contributing to the understanding of the intensity, amplitude, asymmetry, and internal variability of 73 MISs and seven TERs by means of a new theory of climate interference. This research is structured into two companion studies: the present study focuses on the interference model and its second part will elucidate the interference patterns (that is, signal configuration at a given time) (in progress).

2. Materials and Methods

2.1. Materials

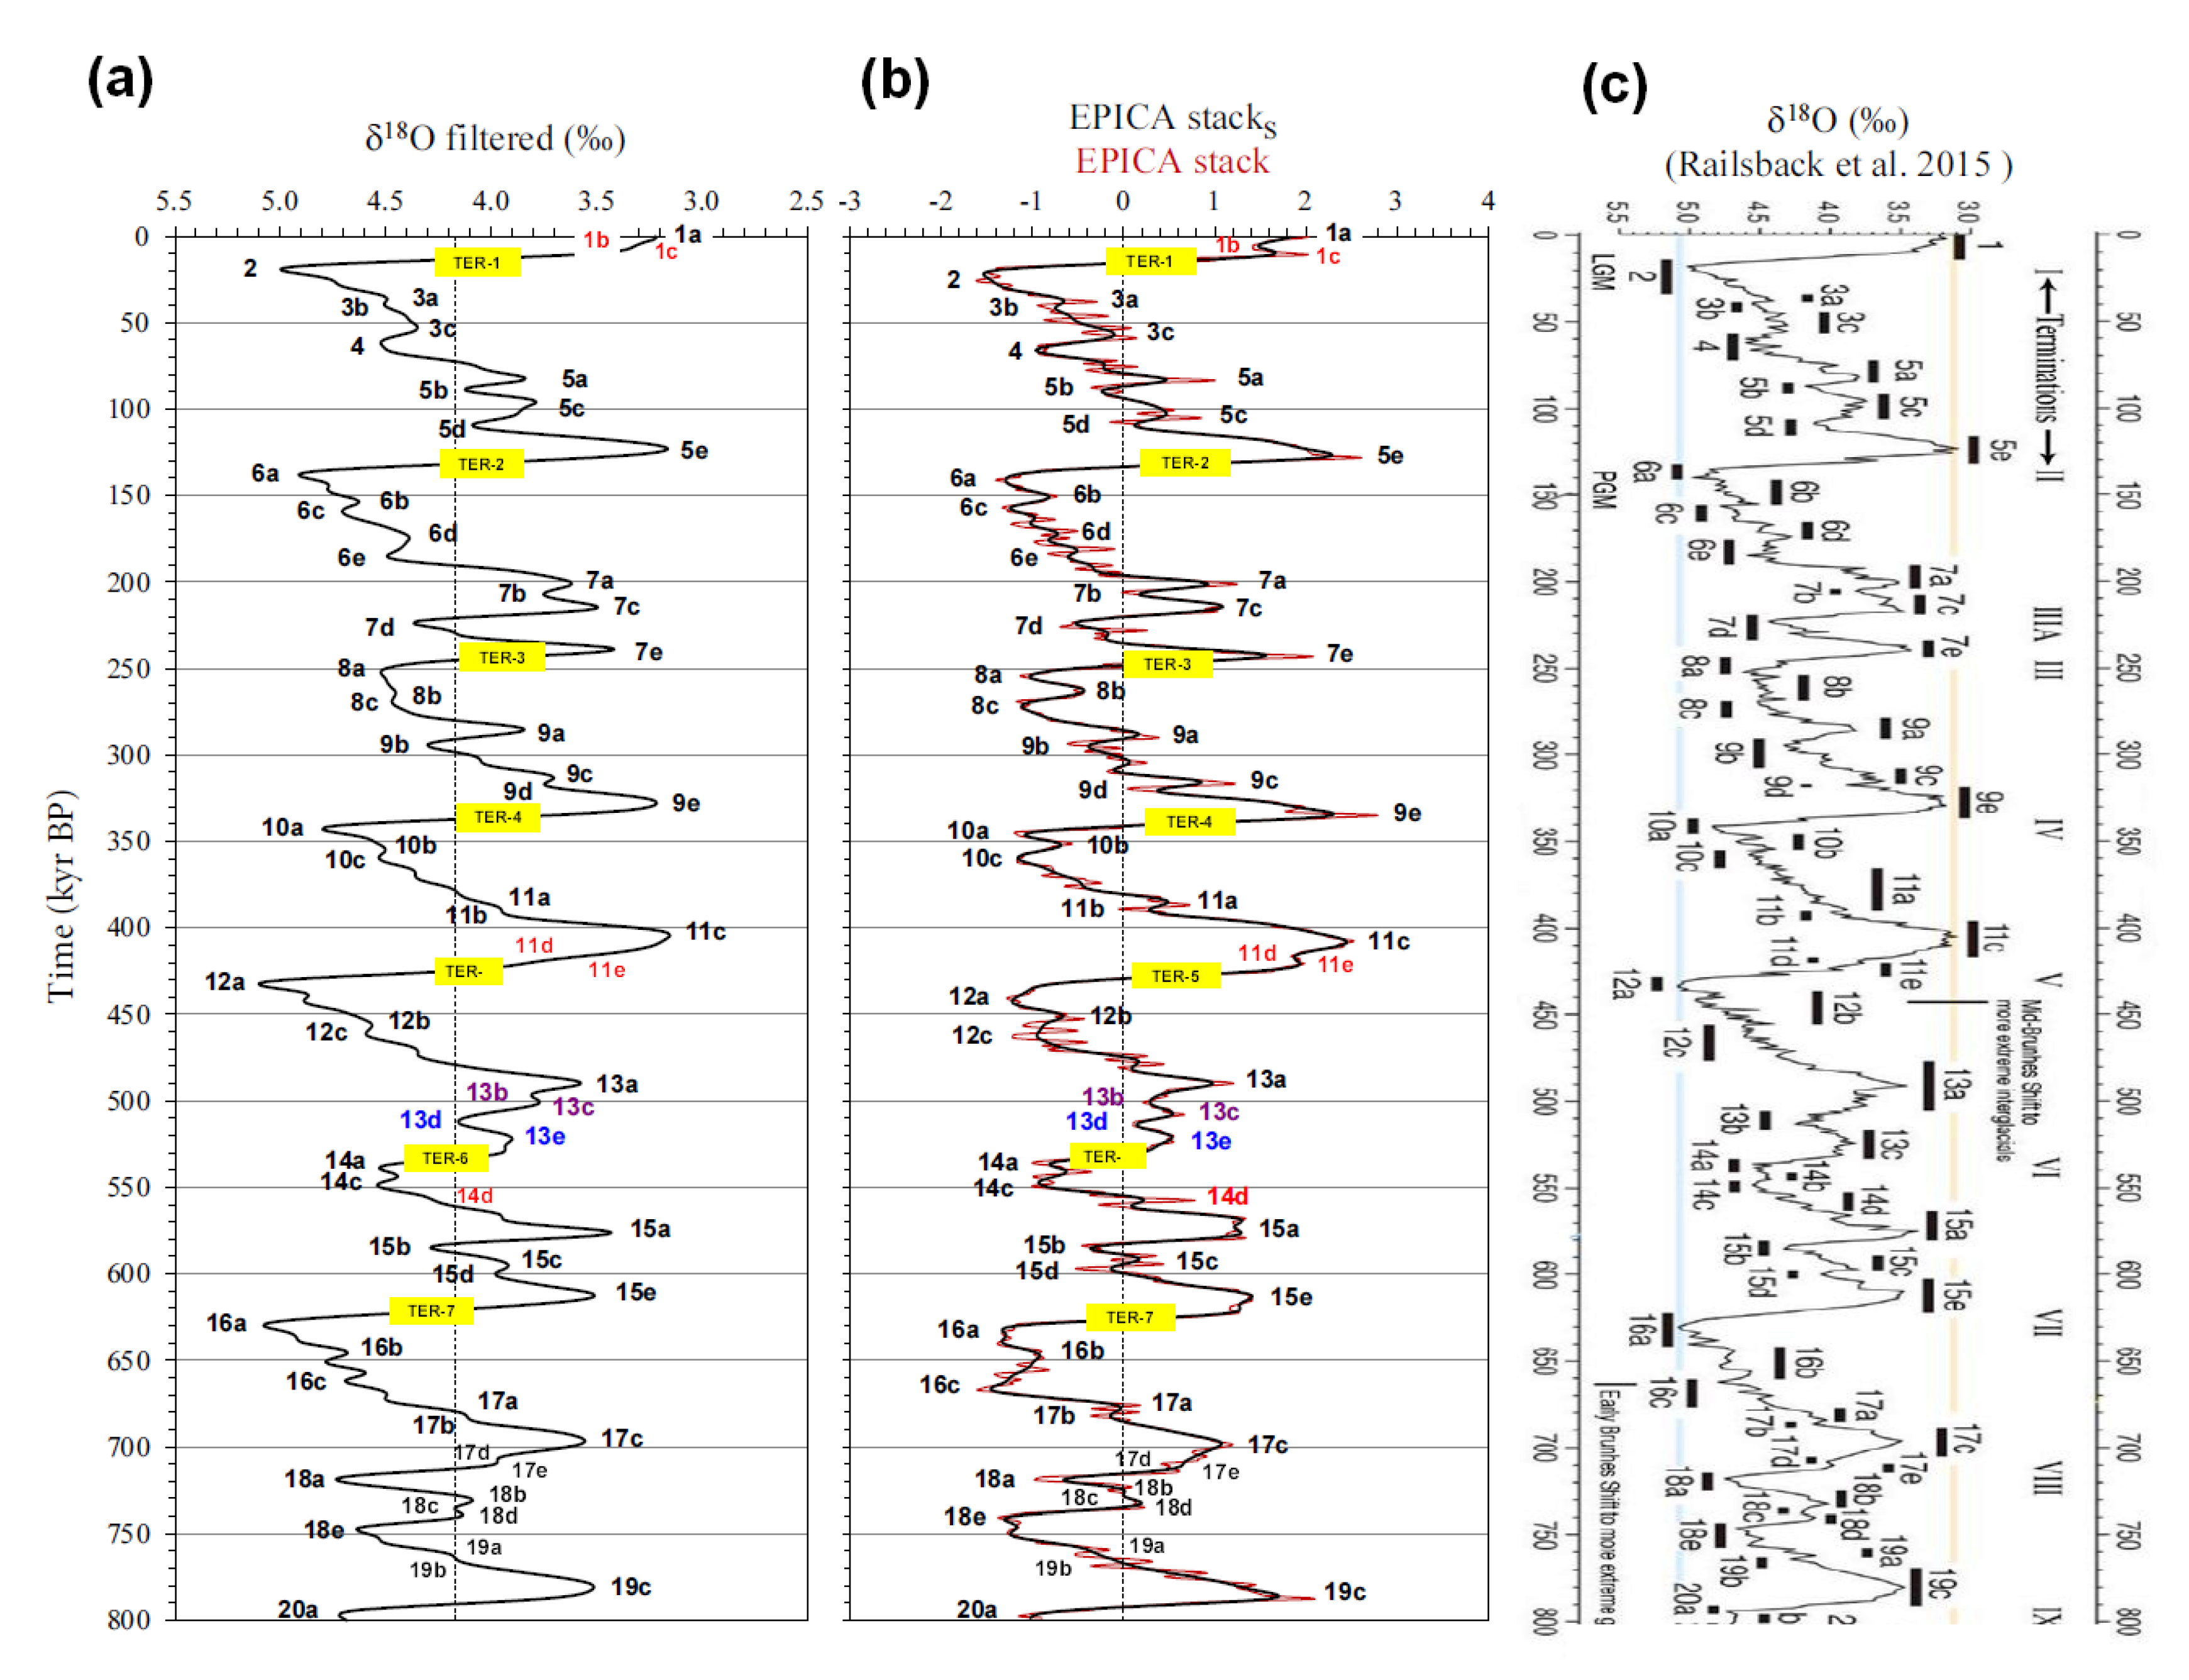
Benthic δ18O measures changes in global ice-volume and deep water temperature, which are controlled by high-latitude surface temperature [11,56]. In the present work, the benthic LR04 δ18O record of Lisiecki and Raymo [57] filtered by SSA at 1 kyr [8] was used and resampled at 0.5 kyr via cubic spline interpolation during the last 800 kyr for uniformity with the EPICA stack record [19]. The LR04 δ18O benthic stack was obtained from 57 oceanic series globally distributed over a wide latitudinal range (Atlantic, Pacific, and Indian Oceans) [57]. LR04 is a global average signal from which regional variability was smoothed. The LR04 stack was orbitally tuned to an ice model driven by insolation that occurs on 21 June at 65° N in La93(1,1) orbital solutions, with a corrected sedimentation rate [57]. The insolation phase and amplitude errors between the La93 and La2004 [35] orbital solutions are very low and can be considered negligible for the last 800 kyr [8]. The EPICA stack is the mean signal among the highly covariant standardised δD, CO2 and CH4 SSA-filtered records [19] recalibrated by PIWG [5] based on the AICC2012 age model [58] with an average uncertainty of 1700 ± 995 yr BP [59]. The EPICA smoothed stack (stacks) is the Savitzky-Golay filtered signal by 4-order least squares polynomial fitting across a moving window of 15. This compensates for the higher resolution of the original EPICA records. The EPICA stacks better approximates the global benthic LR04 δ18O signal [9] (Figure 1), the latter being intrinsically related to the global/high-latitude atmospheric temperatures [11]. Despite potential age discrepancies, there is a striking similarity in the glacial-interglacial variability between the EPICA stacks and LR04 δ18O records, even though amplitude offsets exist possibly resulting from the deep-temperature component of benthic δ18O [56,60,61] and/or regional differences. Indeed, the cross-correlation function (CCF) indicates a Pearson correlation at a 0-lag of 0.87 (Figure 1b), which was highly significant based on the correlation test (Figure 1c). This correlation was the highest among the single EPICA δD, CO2 and CH4 filtered records in the range of 0.80 to 0.83 [9]. The CCF exhibited the highest coefficient (0.91) at ‒5 lag number, equivalent to a δ18O ‘bulk’ lags of ~ 2.5 kyr. The finding demonstrates that the pattern of global glacial–interglacial cycles also arises from patterns of Antarctic atmospheric CO2 and CH4. Comparisons of glacial-interglacial models suggest that Antarctic temperature changes represent global-scale temperature variations [62]. The modelling results of Yin and Berger [33] also indicate that the variations in the annual mean temperatures averaged over the Earth and over the southern high latitudes were controlled by GHGs, whereas insolation played a key role over the northern high latitudes. These differences are due to different geographical configurations, which lead to more climatic responses to seasonal insolation forcing over the Arctic, and more global and annual GHGs forcing over the Southern Ocean [33]. Hence, the EPICA stack can be considered a proxy of the global/NH atmospheric temperatures averaged by feedbacks-related CO2 and CH4 covariant changes [9], and the ten EPICA stack components (mid-term oscillation, obliquity modulation cycle, short eccentricity, obliquity, precession, half-precession, sun-9.7 kyr, sun-6.0 kyr, ‘unclear’-3.7 kyr and sun-2.5 kyr) [19] approximate the forcings-paced thermal responses of the climate system. This offers the opportunity to study MISs structure on the EPICA stack record by graphic correlation with the LR04 δ18O curve.

2.2. Methods

To avoid confusion in the variety of MISs nomenclatures, we used the nomenclature of Railsback et al. [63], in addition to some informal modifications for the purposes of the present study, which sometimes contrasts with the literature usage. The peak age of 73 MISs for the last 800 kyr were collected by a peak detection algorithm from the SSA-filtered LR04 δ18O benthic stack [8,57], and reassigned to the EPICA stack by graphic correlation to overcome differences in age model and samples resolution between the original records (Figure 2). Graphic correlation requires judgment to assess which features correspond to one another and to distinguish noise from signal features. For these reasons, SSA filtering of both the LR04 [8] and EPICA stacked records [19] were used to identify δ18O MIS peaks and capture the age of the correlated EPICA peaks. The EPICA stacks is used as graphic ‘reference’ to compensate for resolution differences between the original records. The red-labelled MIS in Figure 2 are substages recognisable in the EPICA stack but barely discernible on LR04 (MIS-1b/1c/11d/11e/14d).
Some of these are new informal substages (MIS-1b/1c). The long-lasting MIS-13a of Railsback et al. [63] was split into two substages (purple label) recognisable in both the EPICA stack and LR04 (MIS-13b/13c); consequently, MIS-13d and MIS-13e were renamed (blue label). Considering the not simple definition of some terms in Quaternary climatology (glacial/interglacial, stadial/interstadial), it is appropriate to specify the terminology used in the present work. According to the American Commission on Stratigraphic Nomenclature [64], glacials represent episodes during which extensive continental glaciers developed and interglacials are intervals during which the climate was incompatible with a wide extent of glaciers. Further qualitative low-order subdivisions (substages) include stadials and interstadials, reflecting secondary advances (colder substages) and recessions or standstills (warmer substages) of glaciers, respectively [5]. Thus, these terms are strictly related to the relative mean temperature, ice volume, and sea level as reflected in the historical concept of MIS [65]. However, classification of MISs in terms of glacial/interglacial stages or stadial/interstadial substages is sometimes difficult or lacking, and is rather subjective [5,63,66]. In an attempt to provide a more objective criterion, the first categorisation of MISs on a quantitative and structural basis is presented in this study, as it is fundamental to the purpose of the present research. MIS intensity (or strength) is defined as the position of its peak in the proxy scale, which is usually referred to as meaning relative ‘temperature/ice-volume’ (cold/glacial, cold-temperate, temperate, warm-temperate, warm/interglacial, etc.). The MIS amplitude is calculated on the EPICA stack as the mean depth of its peak within the lower and upper branches, and implies a hierarchical concept (stage/substage). The categorisation of MISs in terms of stage/substage was performed with respect to the average amplitude and intensity values of EPICA stack oscillations during the pre-/post-Mid-Brunhes Event (MBE, ~ 430 kyr) time intervals. When both the MIS amplitude and intensity were greater or less than the respective pre- or post-MBE averages, the oscillation was categorised at the corresponding stage rank (interglacial or glacial, respectively). In all other cases, MIS was considered a substage (stadial or interstadial). The position of the substage peak relative to the dominant wave of the EPICA short eccentricity component was used to define the glacial (negative pulse) or interglacial (positive wave) contexts of the substage. Being dominant (51.6% variance), this thermal condition determined the relevant climate background for defining the glacial/interglacial context of MIS substages. Thus, MISs are ultimately categorised into stages/substages according to their amplitude, intensity, and background context (glacial stage, glacial interstadial, glacial stadial, interglacial stage, interglacial interstadial, and interglacial stadial). The aforementioned structural criteria provide a practical categorisation of MISs for the purposes of the present study. A detailed analysis of the structural interference patterns of the categorised MISs is presented in Part 2 (in progress).
TERs are diachronous climatostratigraphic boundaries because of the potentially variable mixing time of the ocean, resulting in local temporal offsets of up to ~ 4 kyr between the MIS boundaries [5]. As transitions, the identification and dating of TERs may be more controversial than those of maxima or minima [63]. In the present study, the ages of TERs were obtained from [57], ratified by the International Commission on Stratigraphy [67], and recalibrated on the EPICA stack as the midpoint between the age peaks of neighbouring MISs (Table 1). For dating TER-1 and TER-5 in the EPICA stack, informal changes in the MISs nomenclature were not considered for consistency with the literature. The EPICA midpoint ages of the TERs were approximated according to data acquisition at 0.5-kyr resampled time-series [19].
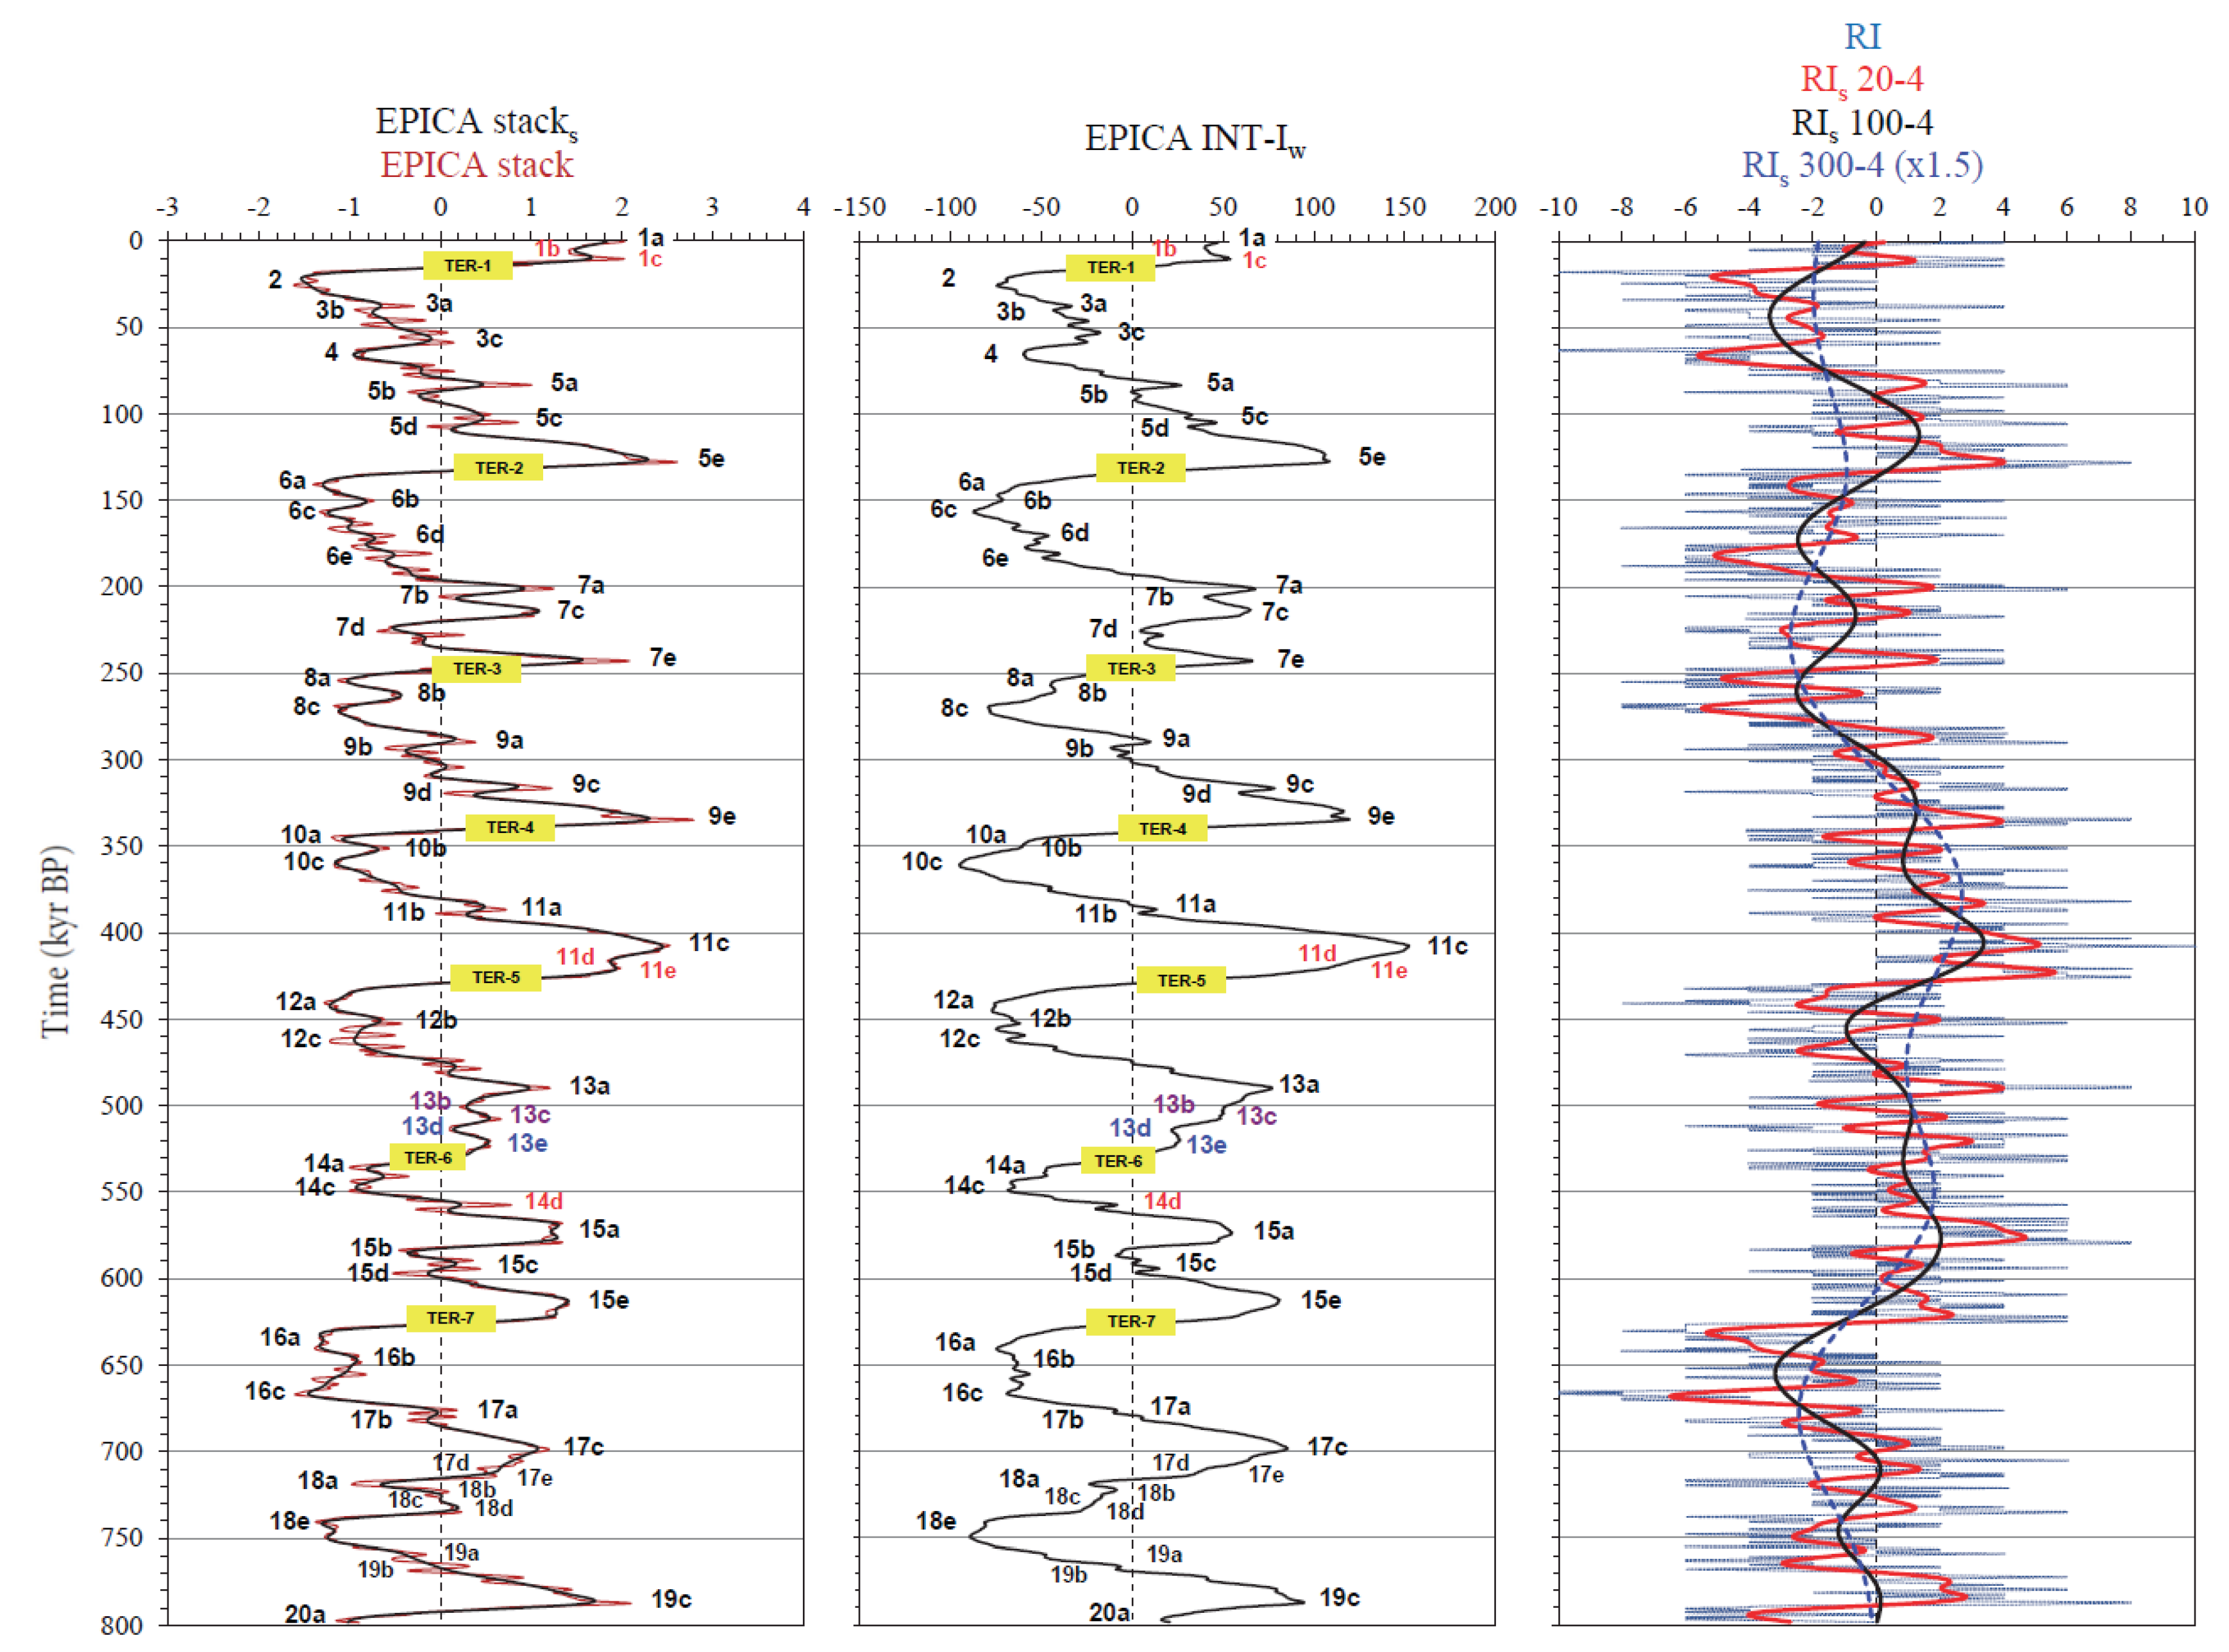
The interference model was evaluated on ten EPICA stack components using interference indices (simple sum, INT-I, and variance-weighted version, INT-Iw) and multiple linear regression models to reconstruct the envelope of the EPICA thermal response. The best resulting interference signal (INT-Iw) is segmented into interference classes to identify the homogeneous region of interference intensity. A response index (RI) is calculated as the difference between the number of EPICA positive (stack > 0) and negative (stack ≤ 0) weighted components to further investigate the interference model. RI measures the polarity alignment according to the time of the ten thermal components, regardless of their intensity. For example, an RI of 4 indicates that seven thermal waves are positive (warming) and three are negative (cooling). Three different smoothed versions (RIs) by a Savitzky-Golay filter based on least squares 4-order polynomial fitting across moving windows of 20, 100 and 300, respectively, were applied to examine the mid-term (20)/long-term (100 and 300) behaviour of the polarity among thermal responses. A variant of the RI calculated for the five suborbital components only (RIsub) quantified the polarisation of these cycles. The concept of the time alignment of signals is sometimes expressed as a positive/negative response index (PRI/NRI), that is, the percentage of positive (warming)/negative (cooling) components out of the total. Finally, the 80 reference ages (73 MISs and seven TERs) calibrated on the EPICA stack (AICC2012 age model, [5,58]) were used to collect a selected dataset of the ten forcing-related EPICA stack components to investigate the interference model of MISs and TERs (abbreviated the MIS dataset) by the INT-Iw class.

3. Results and Discussion

3.1. Interference Model of EPICA Stack Components

3.1.1. Interference Indices

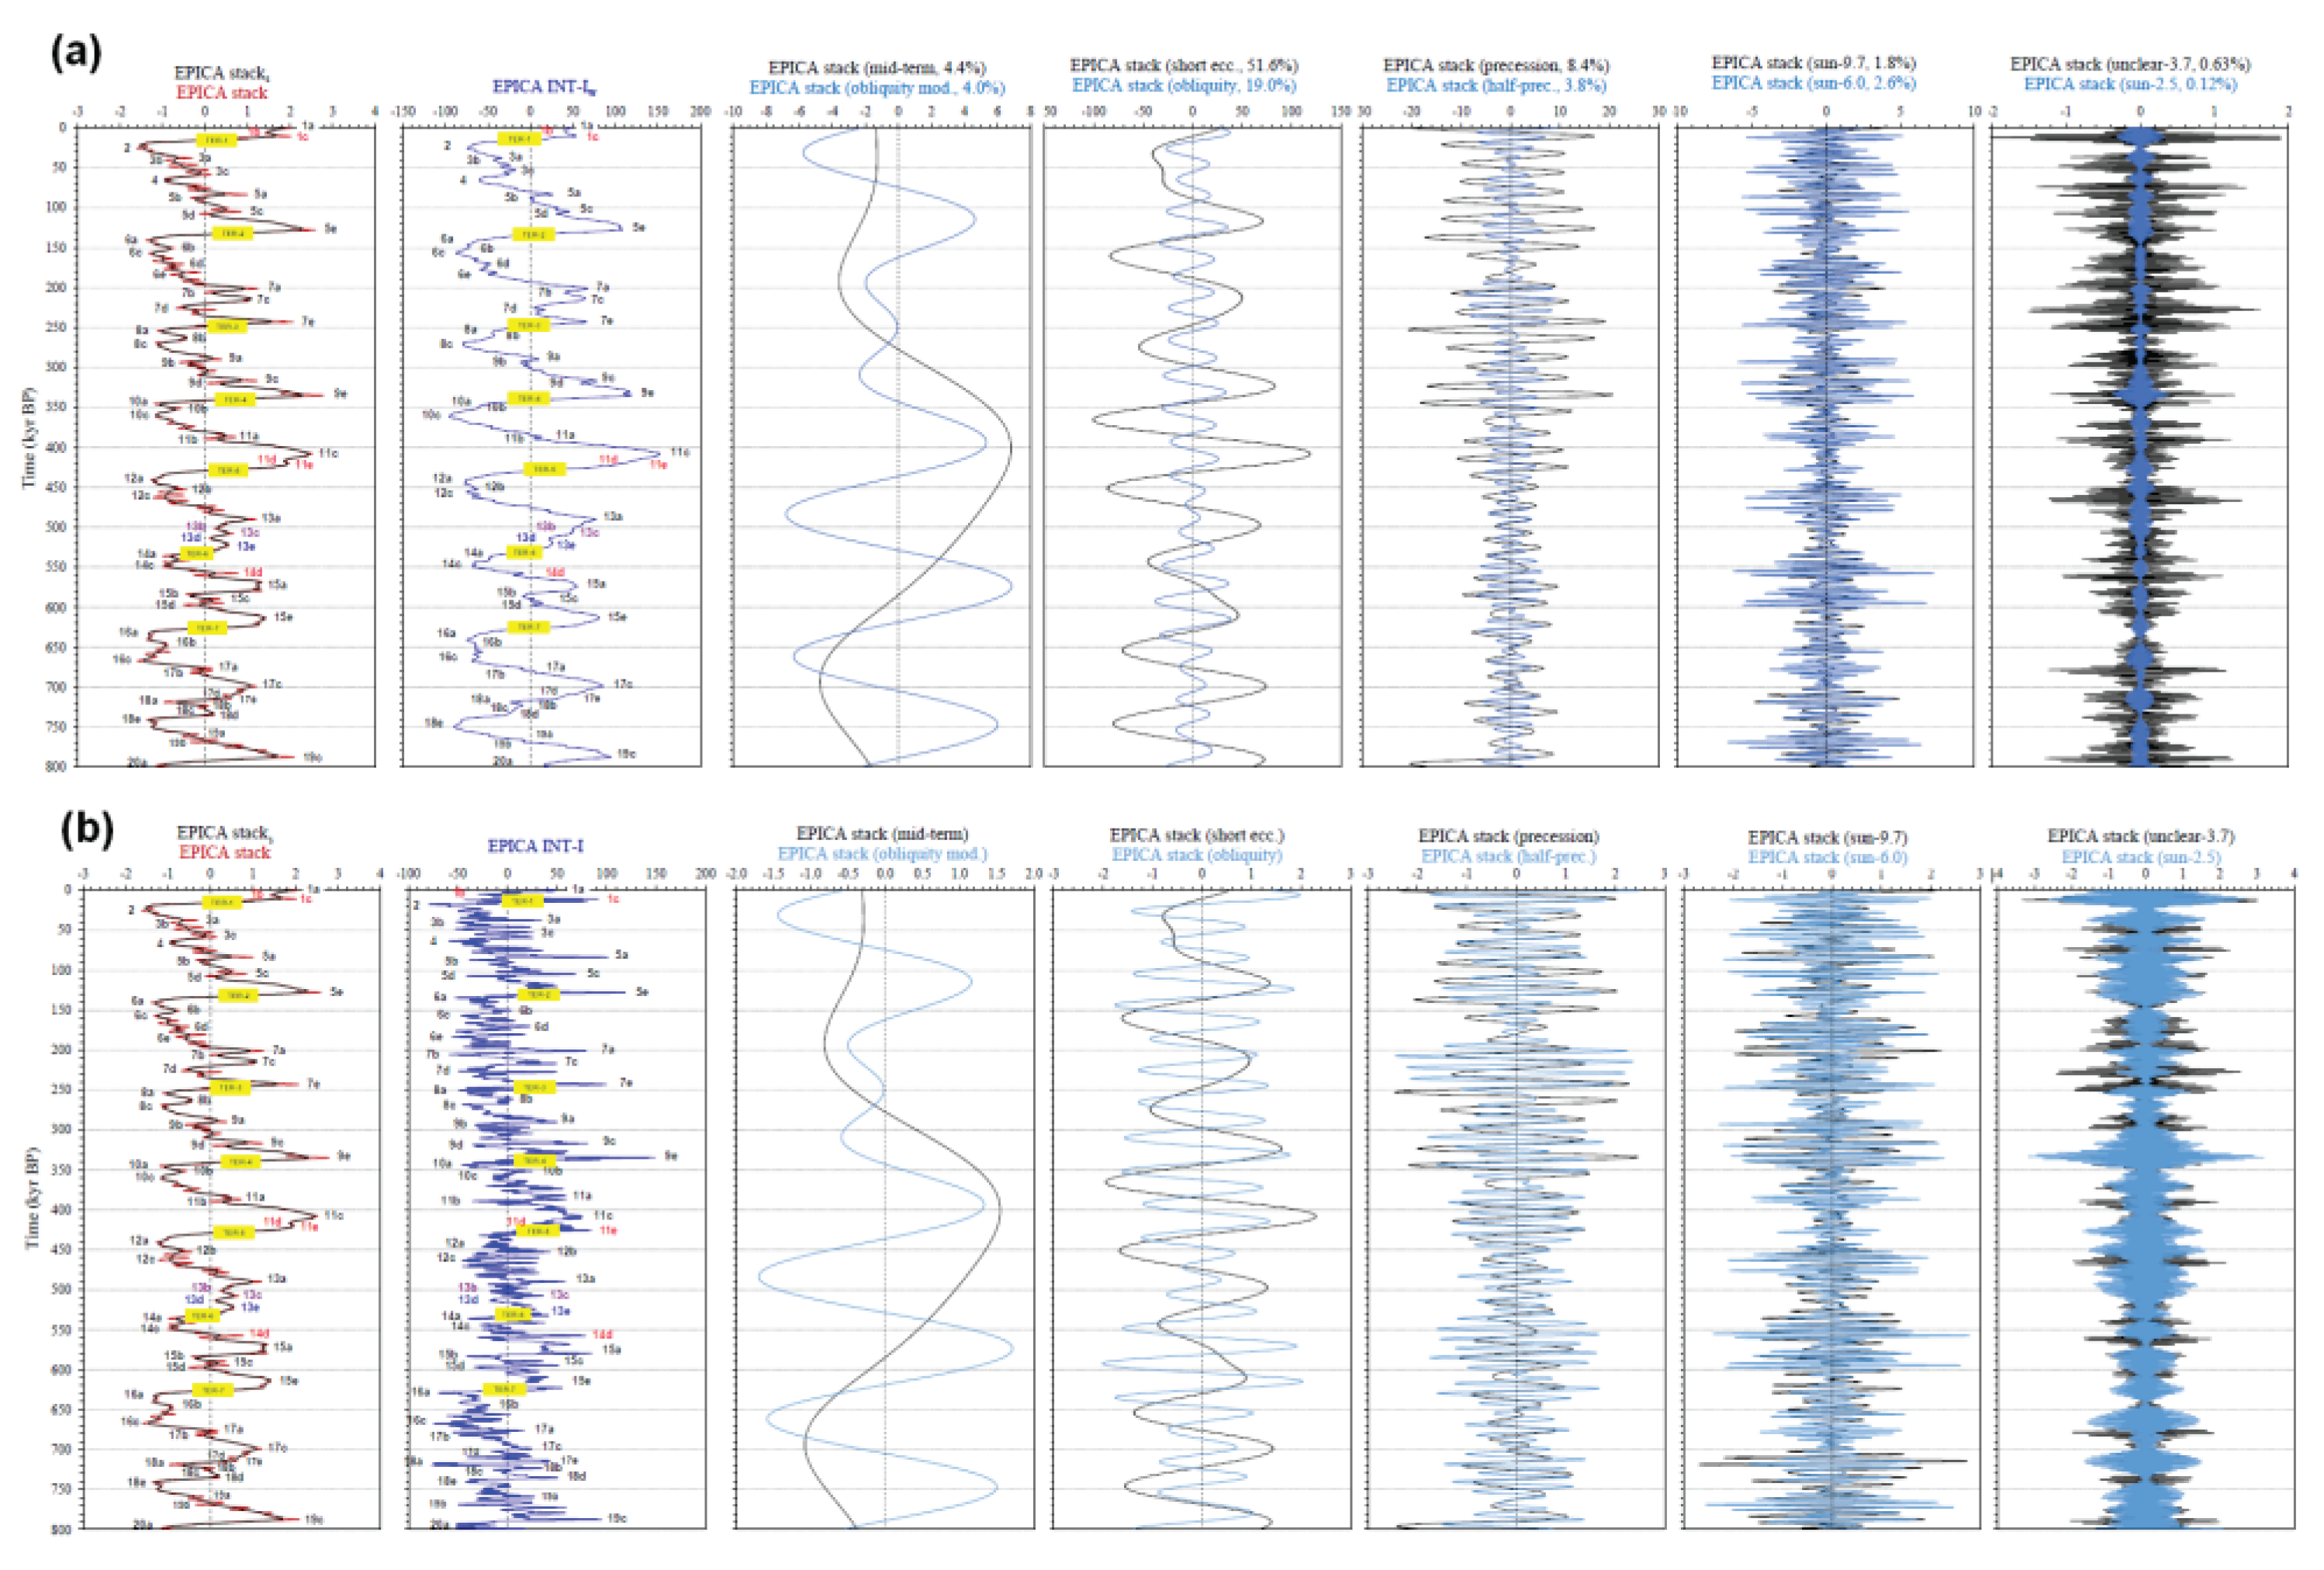
Interference is a linear physical phenomenon in which two or more wave signals of even different amplitudes, frequencies and polarities are superimposed without affecting each other to form a resultant complex wave of greater, lower or the same amplitude [69]. Interference is an energy redistribution process. Figure 3 depicts the temporal interaction among the EPICA variance-weighted (Figure 3a) and unweighted (Figure 3b) SSA components of different origin, frequencies and strength (% variance) compared with the LR04 δ18O and EPICA stack records. Positive values of the stack components indicate warming climate polarity and vice versa. The weighted interference index (INT-Iw) of EPICA (Figure 3a) reconstructs at a given time the envelope of the resulting thermal response as the vector sum of the ten variance-weighted zero-mean thermal stacked responses (R) as follows:
INT-Iw = (4.4 × RMT) + (4 × ROM) + (51.6 × RSE) + (19 × ROB) + (8.4 × RPR) + (3.8 × RHP) +
(1.8 × RS9.7) + (2.6 × RS6.0) + (0.63 × RUC3.7) + (0.12 × RS2.5)
where [19]:
  • RMT: mid-term oscillation stack (4.4%);
  • ROM: obliquity modulation cycle stack (4%);
  • RSE: short eccentricity stack (51.6%);
  • ROB: obliquity stack (19%);
  • RPR: precession stack (8.4%);
  • RHP: half-precession stack (3.8%);
  • RS9.7: sun-9.7 kyr cycle stack (1.8%);
  • RS6.0: sun-6.0 kyr cycle stack (2.6%);
  • RUC3.7: ‘unclear’-3.7 kyr cycle stack (0.63%); and
  • RS2.5: sun-2.5 kyr cycle stack (0.12%)
Instead, INT-I (Figure 3b) is an unweighted version of INT-Iw as follows:
INT-I = RMT + ROM + RSE + ROB + RPR + RHP + RS9.7 + RS6.0 + RUC3.7 + RS2.5
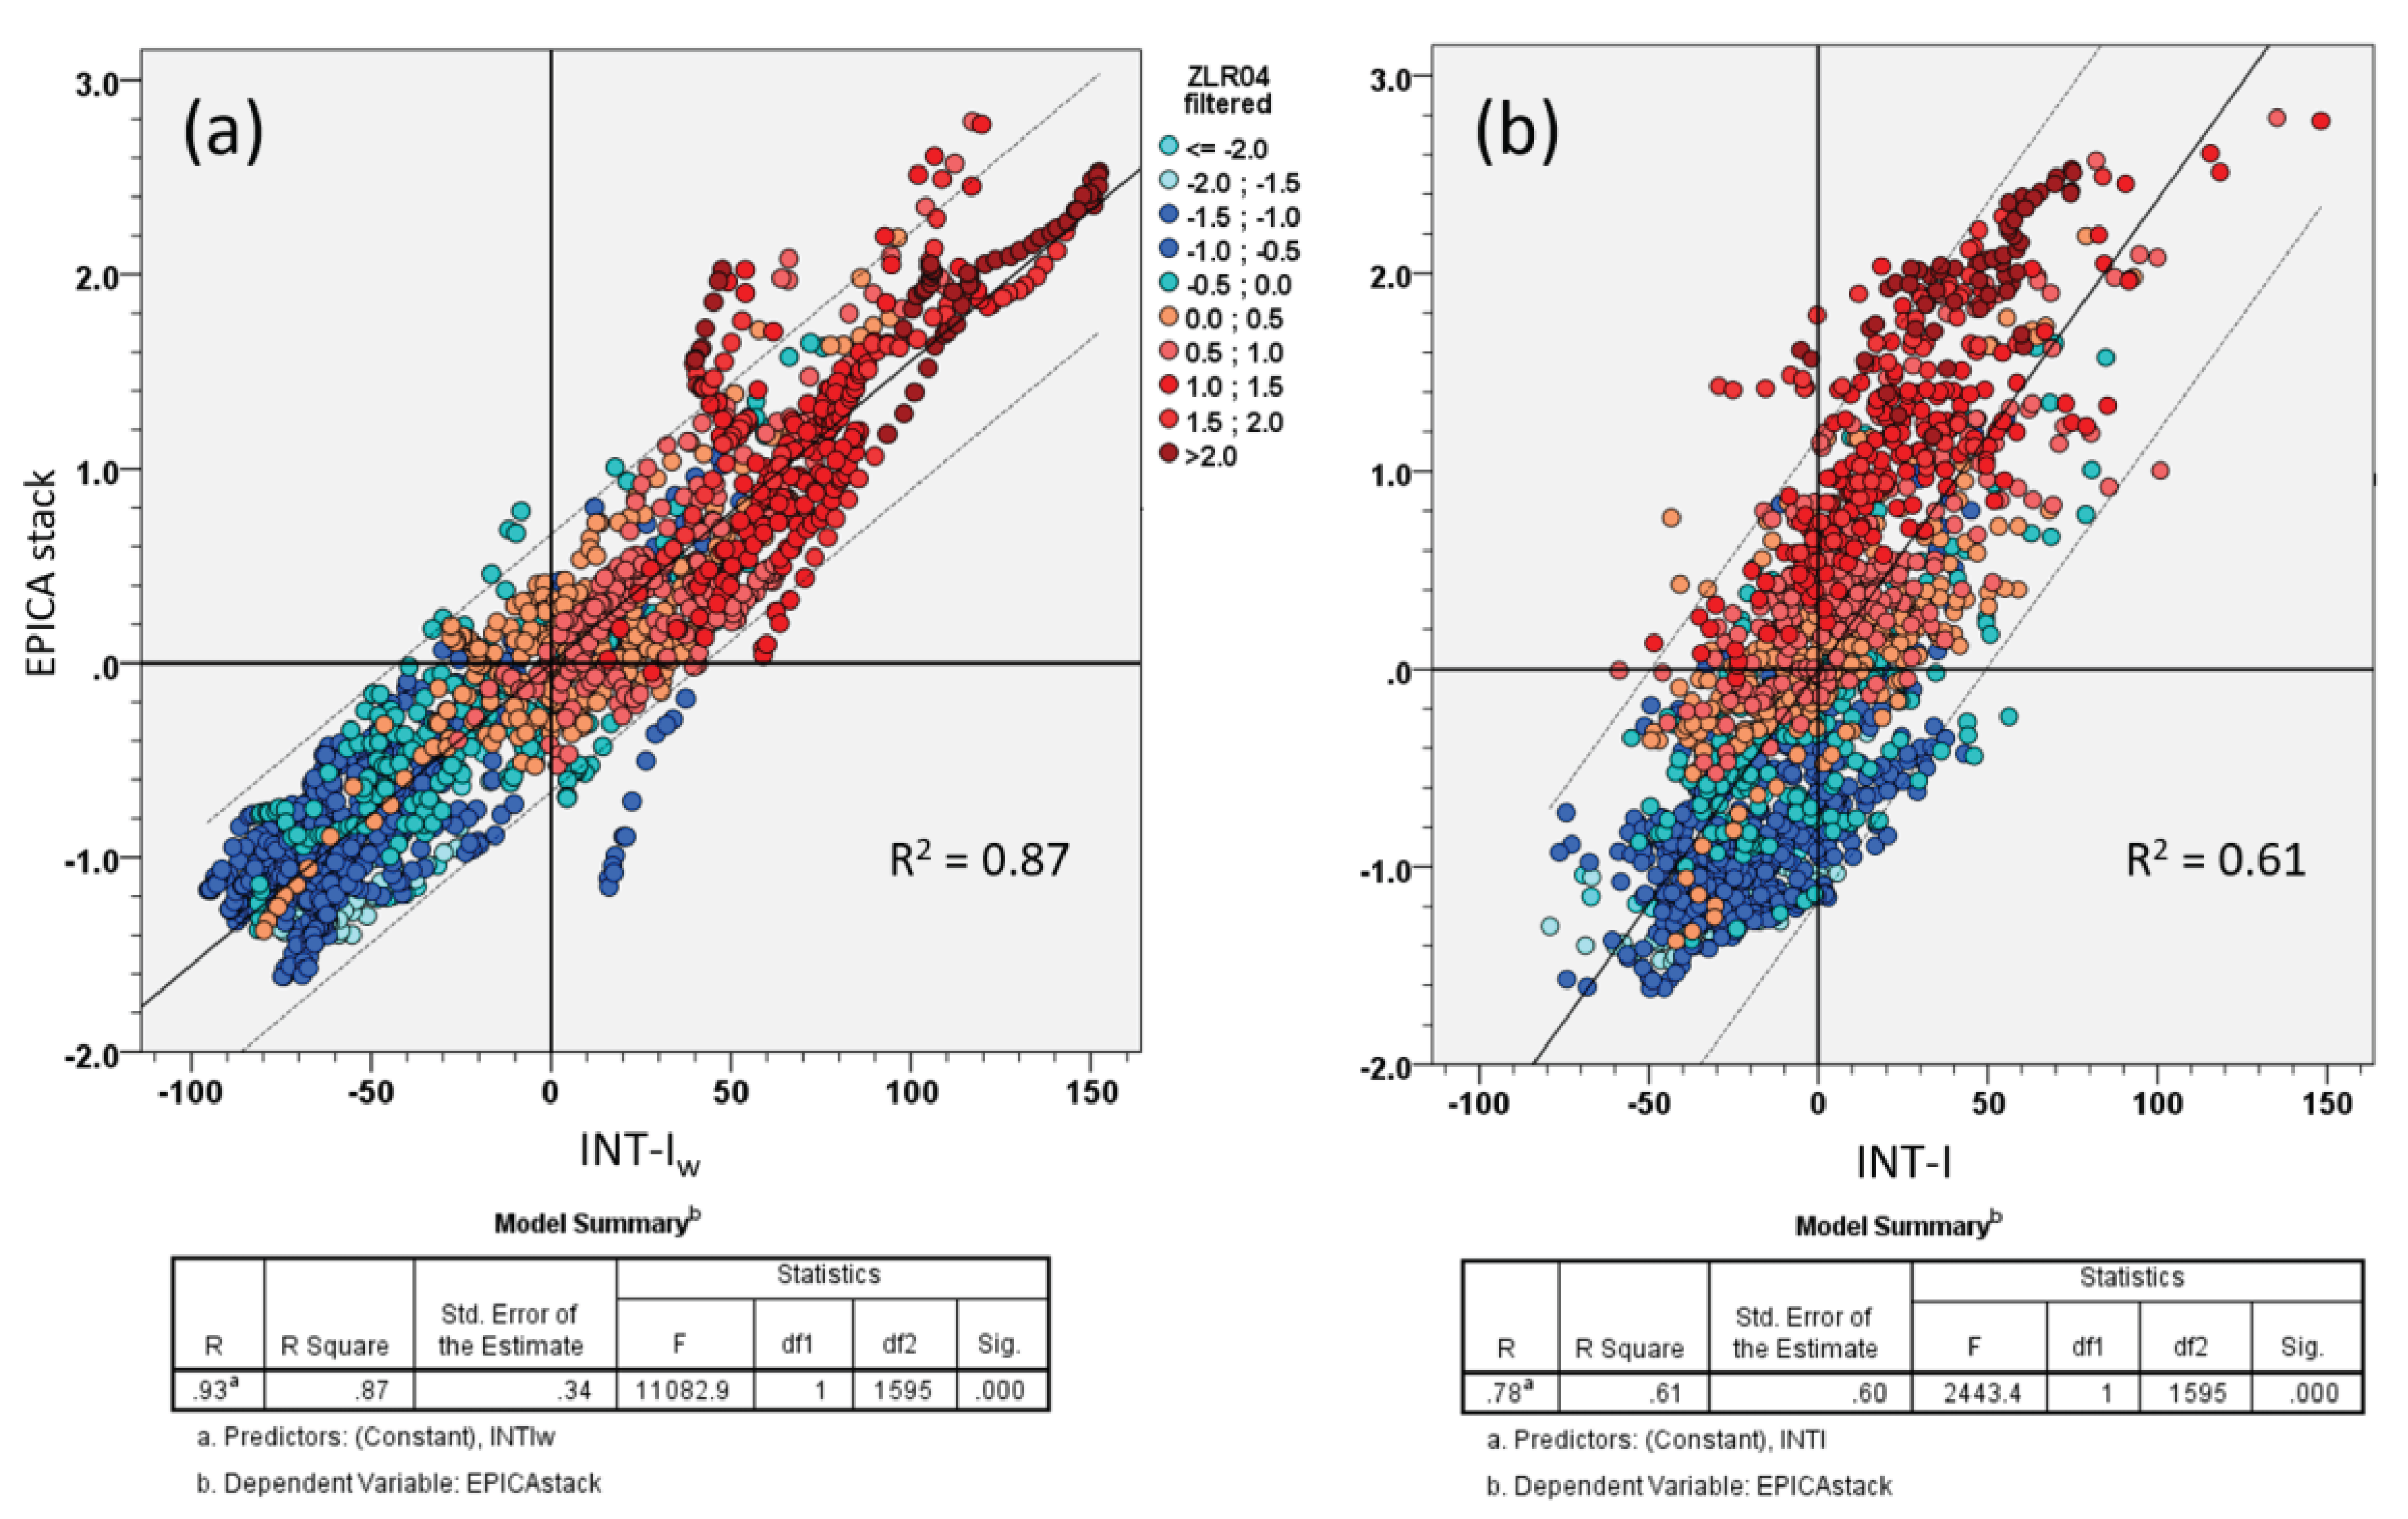
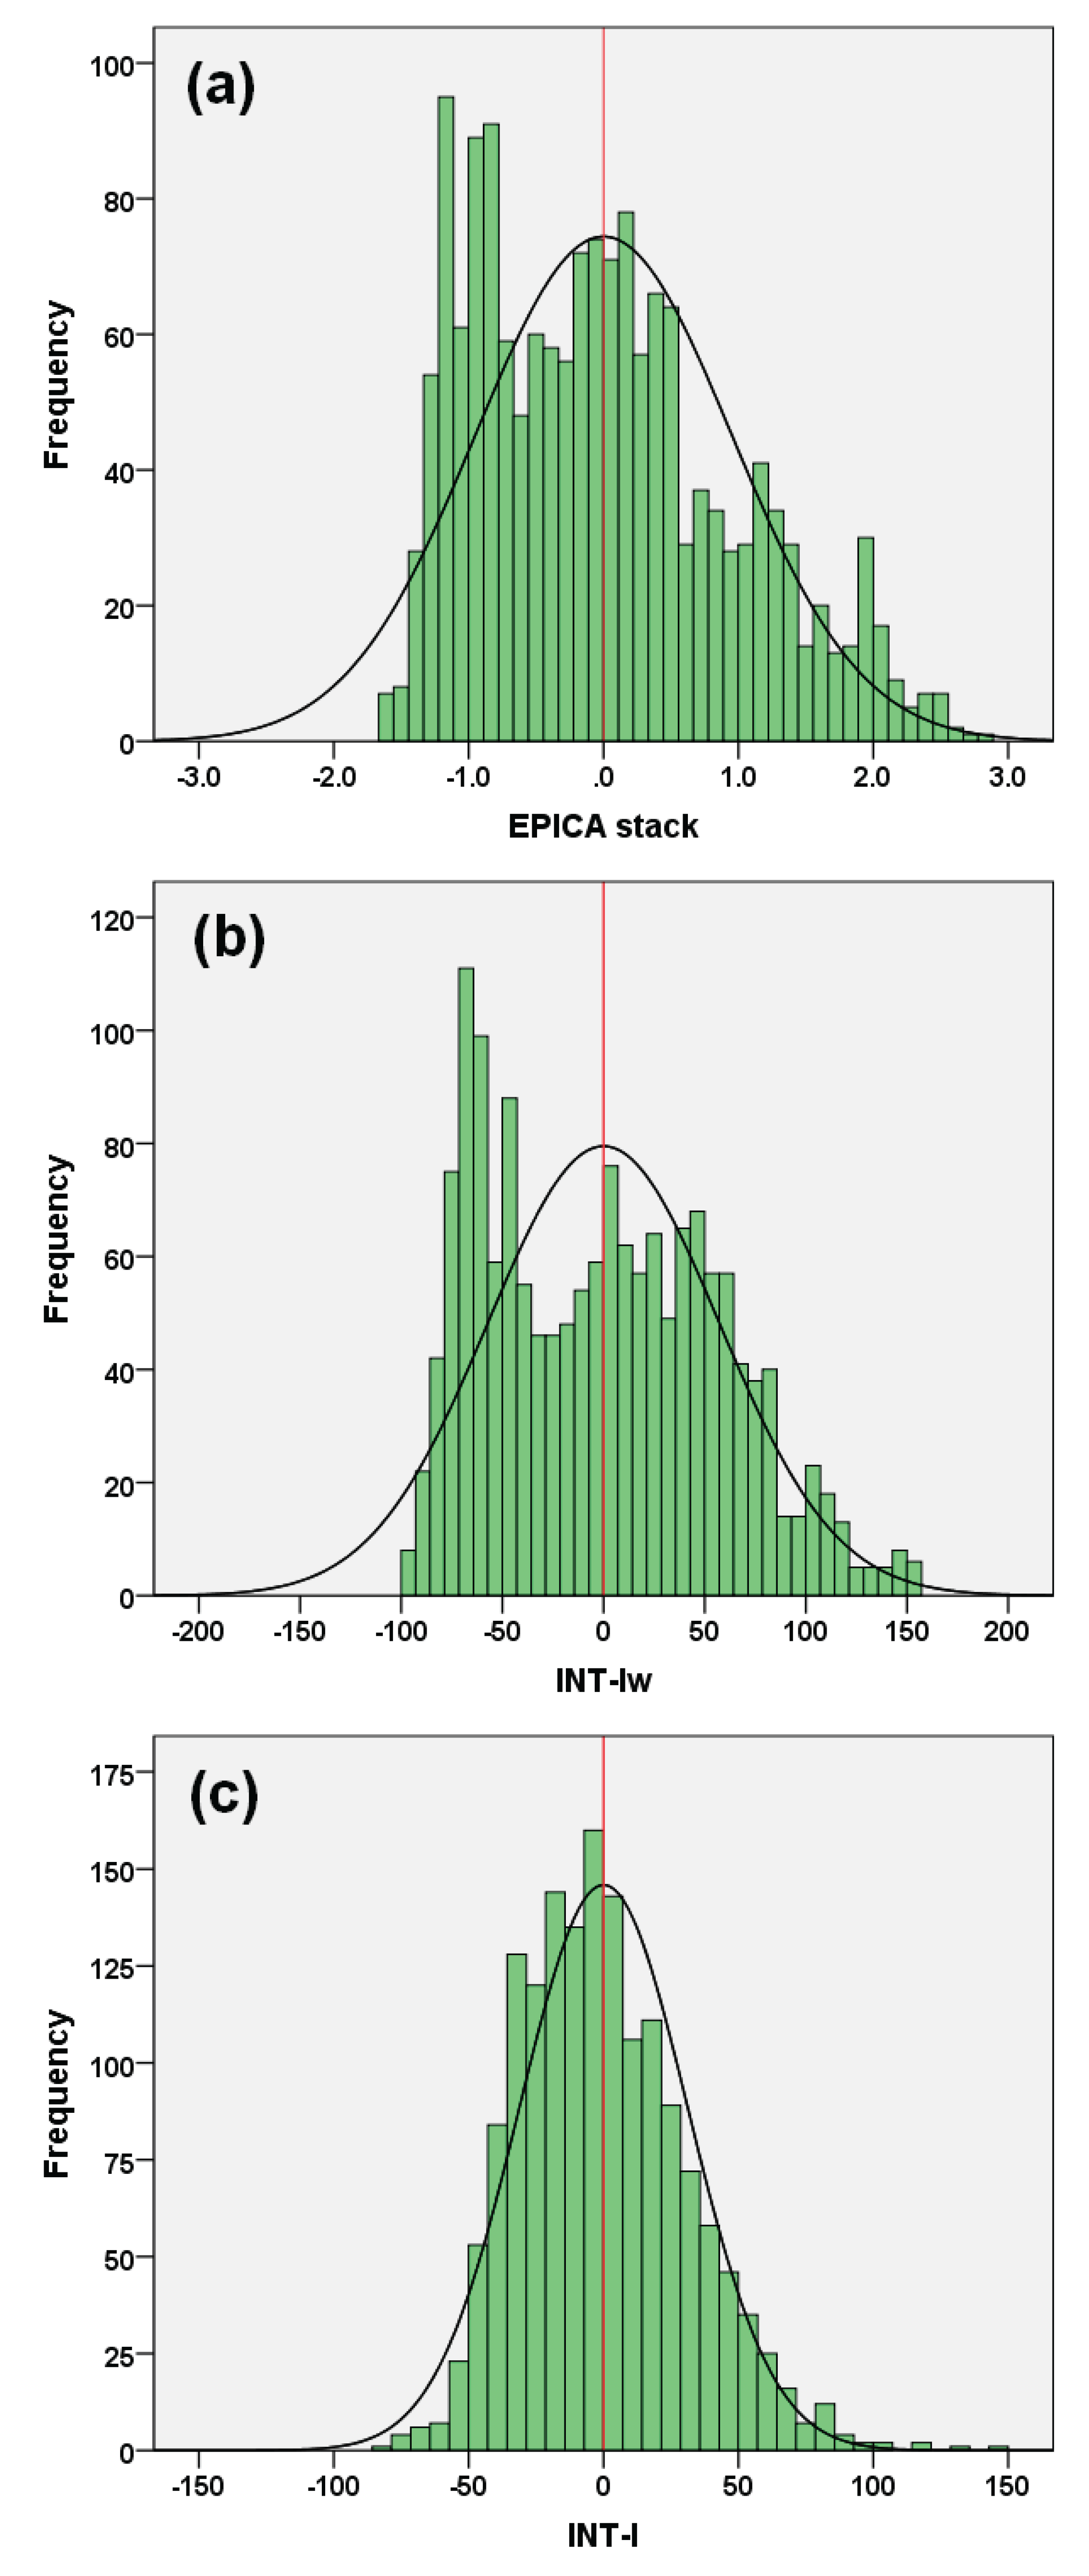
Figure 3 shows how a simple (unweighted) interference model of the climate components fails to describe the envelope of the EPICA stack. Indeed, the INT-I record (Figure 3b) does not reproduce the overall shape of the EPICA stack curves, whereas the weighted version describes the latter more accurately (Figure 3a). This is also demonstrated by the cross plots in Figure 4, where the EPICA stack shows a robust linear correlation (R2 = 0.87) with INT-Iw (Figure 4a) and a low correlation (R2 = 0.61) with the unweighted version (Figure 4b). The standard error of the estimate is 0.34 for INT-Iw and almost double that of the unweighted version (0.60). In addition, the histograms in Figure 5 show that the weighted-interference model is a better approximation of the EPICA stack record. The distribution pattern of INT-Iw (Figure 5b) is similar to that of the EPICA stack (Figure 5a), whereas the unweighted version shows a different histogram (Figure 5c). Relevant features are the strong positive asymmetry (warming) and the ‘truncation’ of the negative tail (cooling) of both EPICA stack and INT-Iw, along with the multimodal distribution. This type of intensity asymmetry (smaller glacial intensity than interglacials) of the post-MPT cycles is different from the temporal asymmetry that is known as ‘saw-tooth’ shape and is clearly visible in the 0-mean records in Figure 2b. The intensity asymmetry also relates to the key question of why the pre-MBE interglacials appear to be cooler (i.e., less warm) than the post-MBE interglacials [33]. These asymmetries are discussed in Section 3.1.4 and Section 3.1.5.
A multiple linear regression model of the weighted components provides an excellent reconstruction of the EPICA stack record, as demonstrated by the goodness-of-fit statistics (R2 = 0.97; Std. err. = 0.18; F = 4528; Sig. = 0.000) (Table 2). Here, the weighted interference vectors are the kernel of the multiple regression model, and the low standard errors increase predominantly in the suborbital components in progressive order (i.e., increasing frequencies).
This analysis demonstrates how Antarctic δD and CO2-CH4 stacked records during the last 800 kyr can be described by a variance-weighted interference model of independent thermal responses that interfere at a given time according to their relative differences in frequency, intensity and polarity. INT-Iw essentially expresses the Antarctic surface thermal forcing mediated by feedback-related GHG responses and approximates global and NH atmospheric temperatures. Interference is a linear physical phenomenon, which does not disagree with the nonlinear nature of climate records being nonlinear the responses that interfere at a given time [8,9,19,38]. Climate signals paced by forcing are modified exponentially in their response components through the interplay of positive feedback mechanisms [16,40,42,44,46,48,49,50], which transfer much of the energy of the climate system [8,9,19,38]. The nonlinear phase locking, in which the external Milankovitch forcing affects the amplitude and period of climate oscillations to satisfy the nonlinear resonance condition [70], is likely the mechanism linking weak forcing perturbations with the induced feedback signals to produce exponential responses. Similarly, the climate parametric resonance model of Caccamo and Magazù [52] introduces a set of positive feedback loops in which the climate system response is non-linearly amplified with a net positive gain. This leads to a self-reinforcing feedback mechanism that amplifies the effects of the small disturbances connected with Milankovitch’s cycles including eccentricity [52,71]. Interference is a different phenomenon involving response components at a given time through a process of stochastic energy redistribution to produce the bulk climate wave.
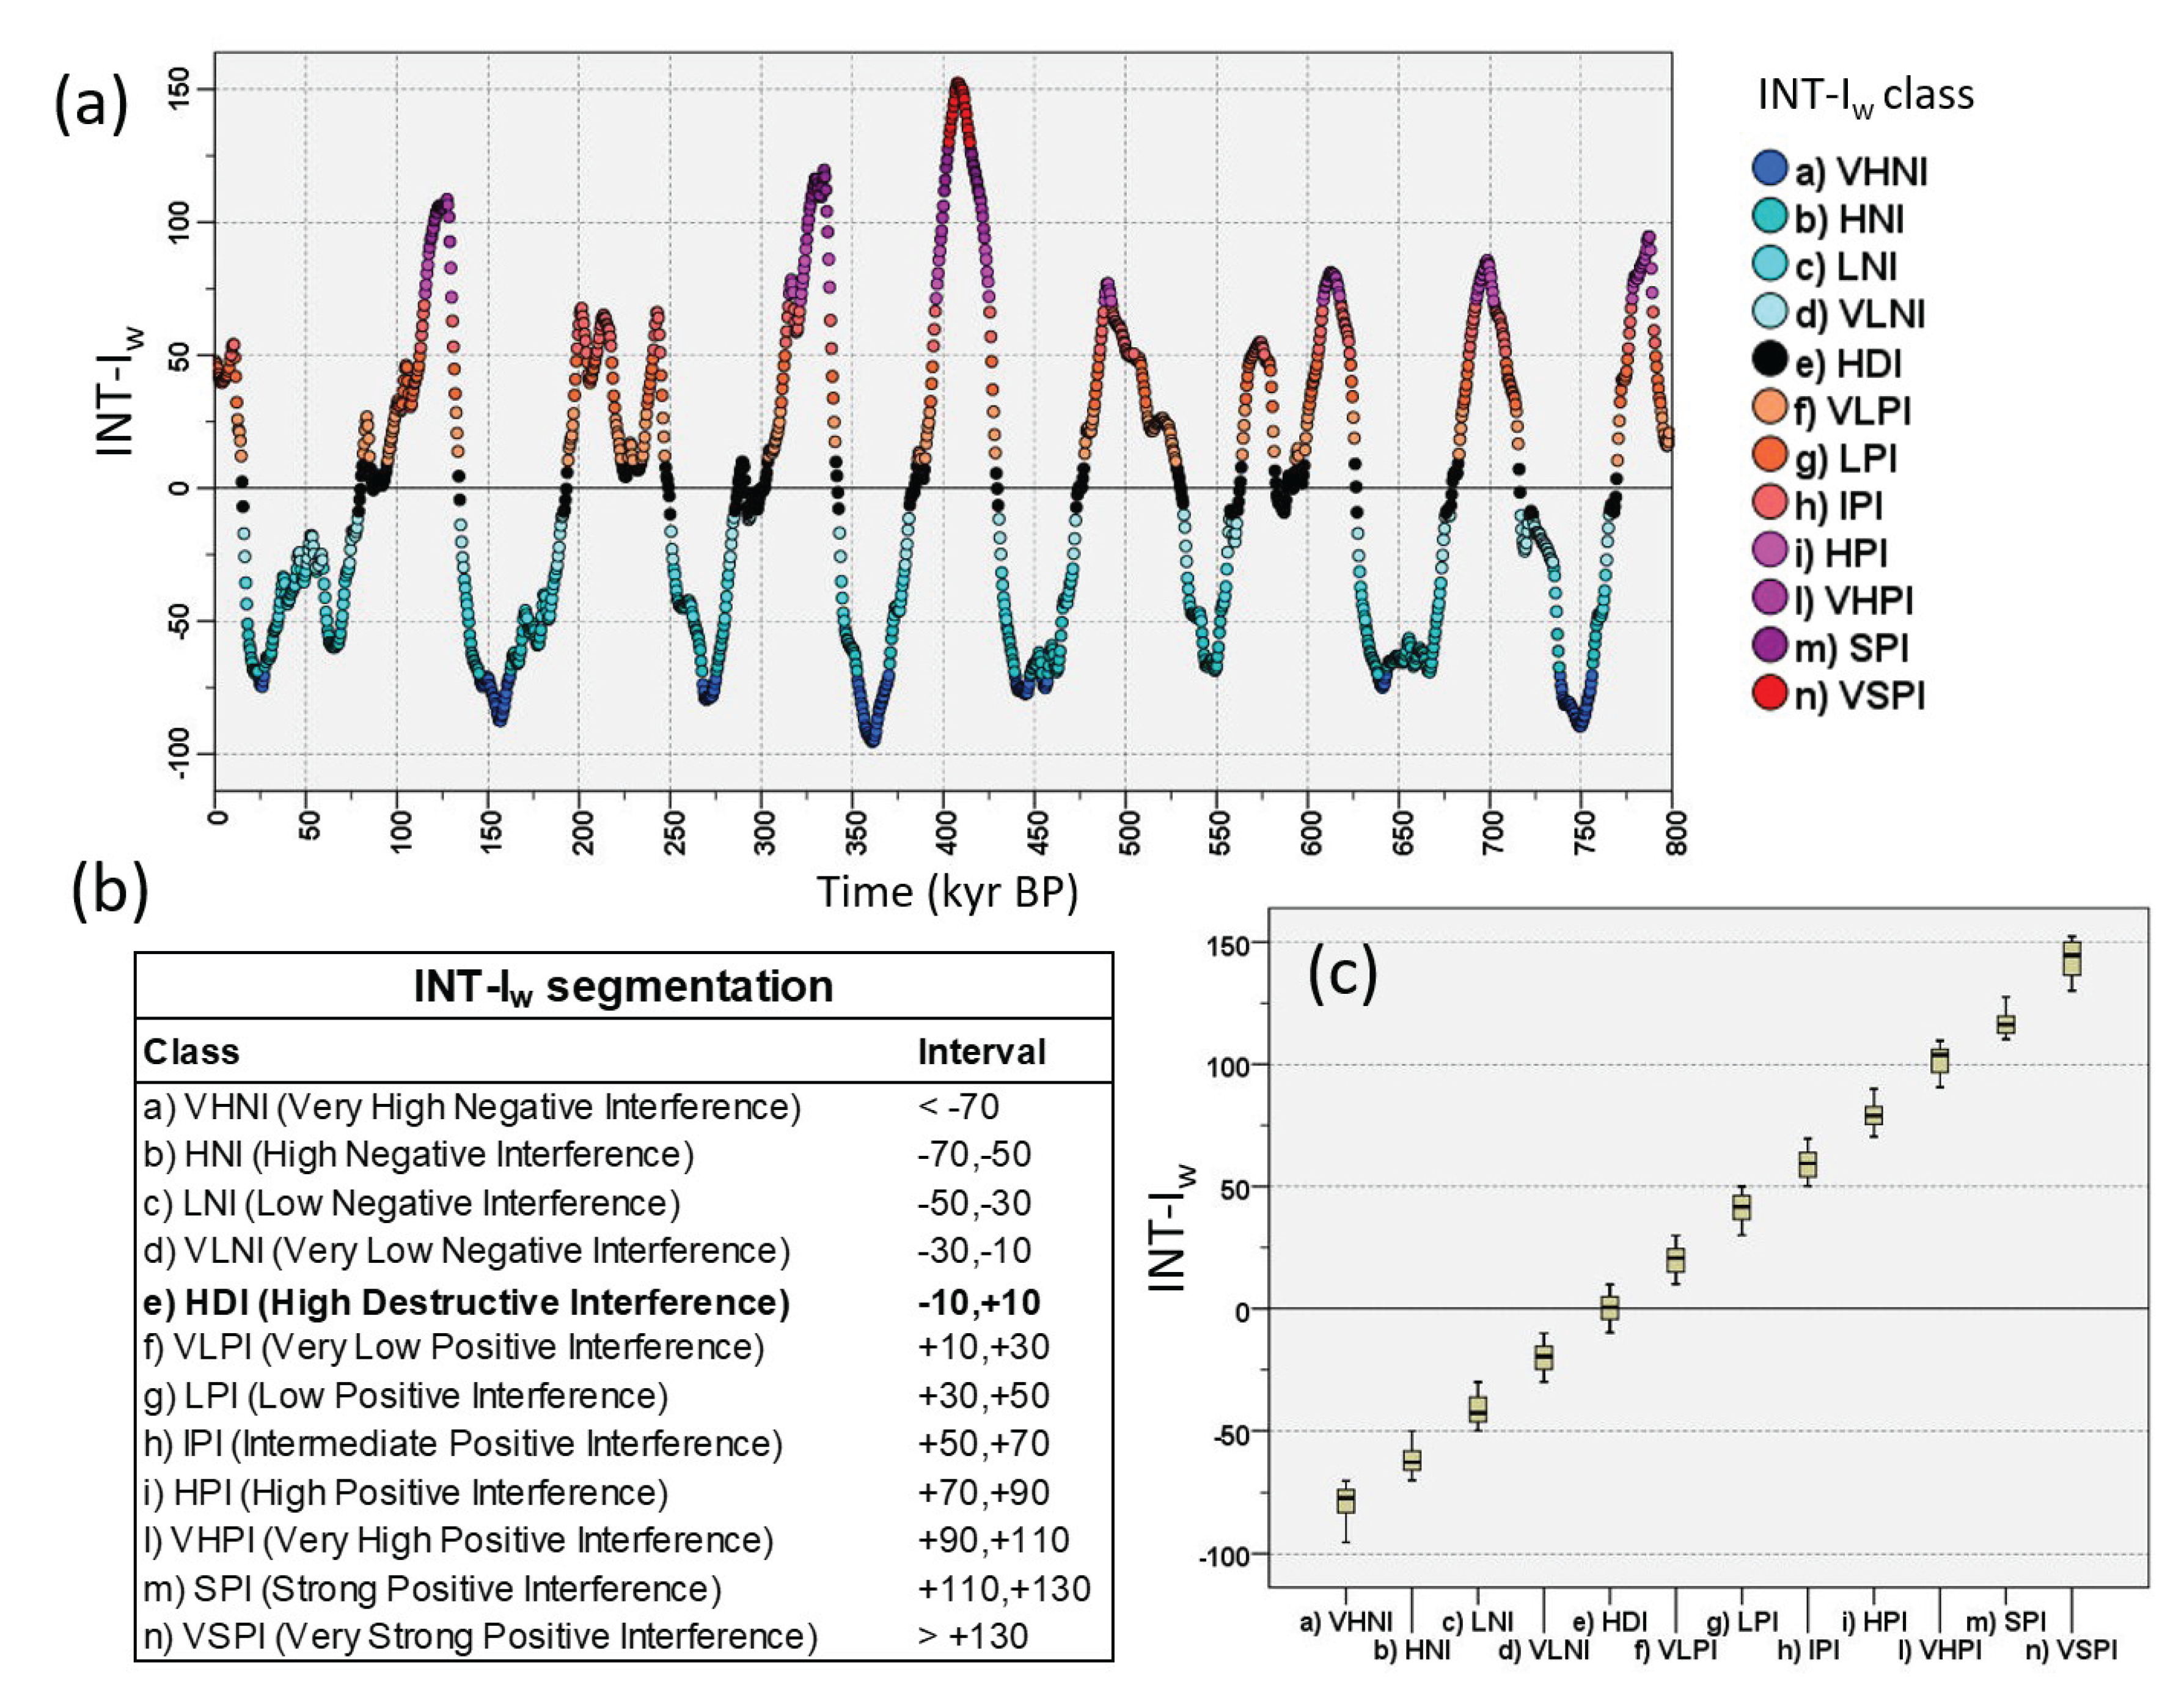
Twelve INT-Iw clusters by equal-width segmentation (20 unit) have been named to identify homogeneous regions of interference intensity centred on a 0-mean class in the relative range ‒10 to 10 (Figure 6).
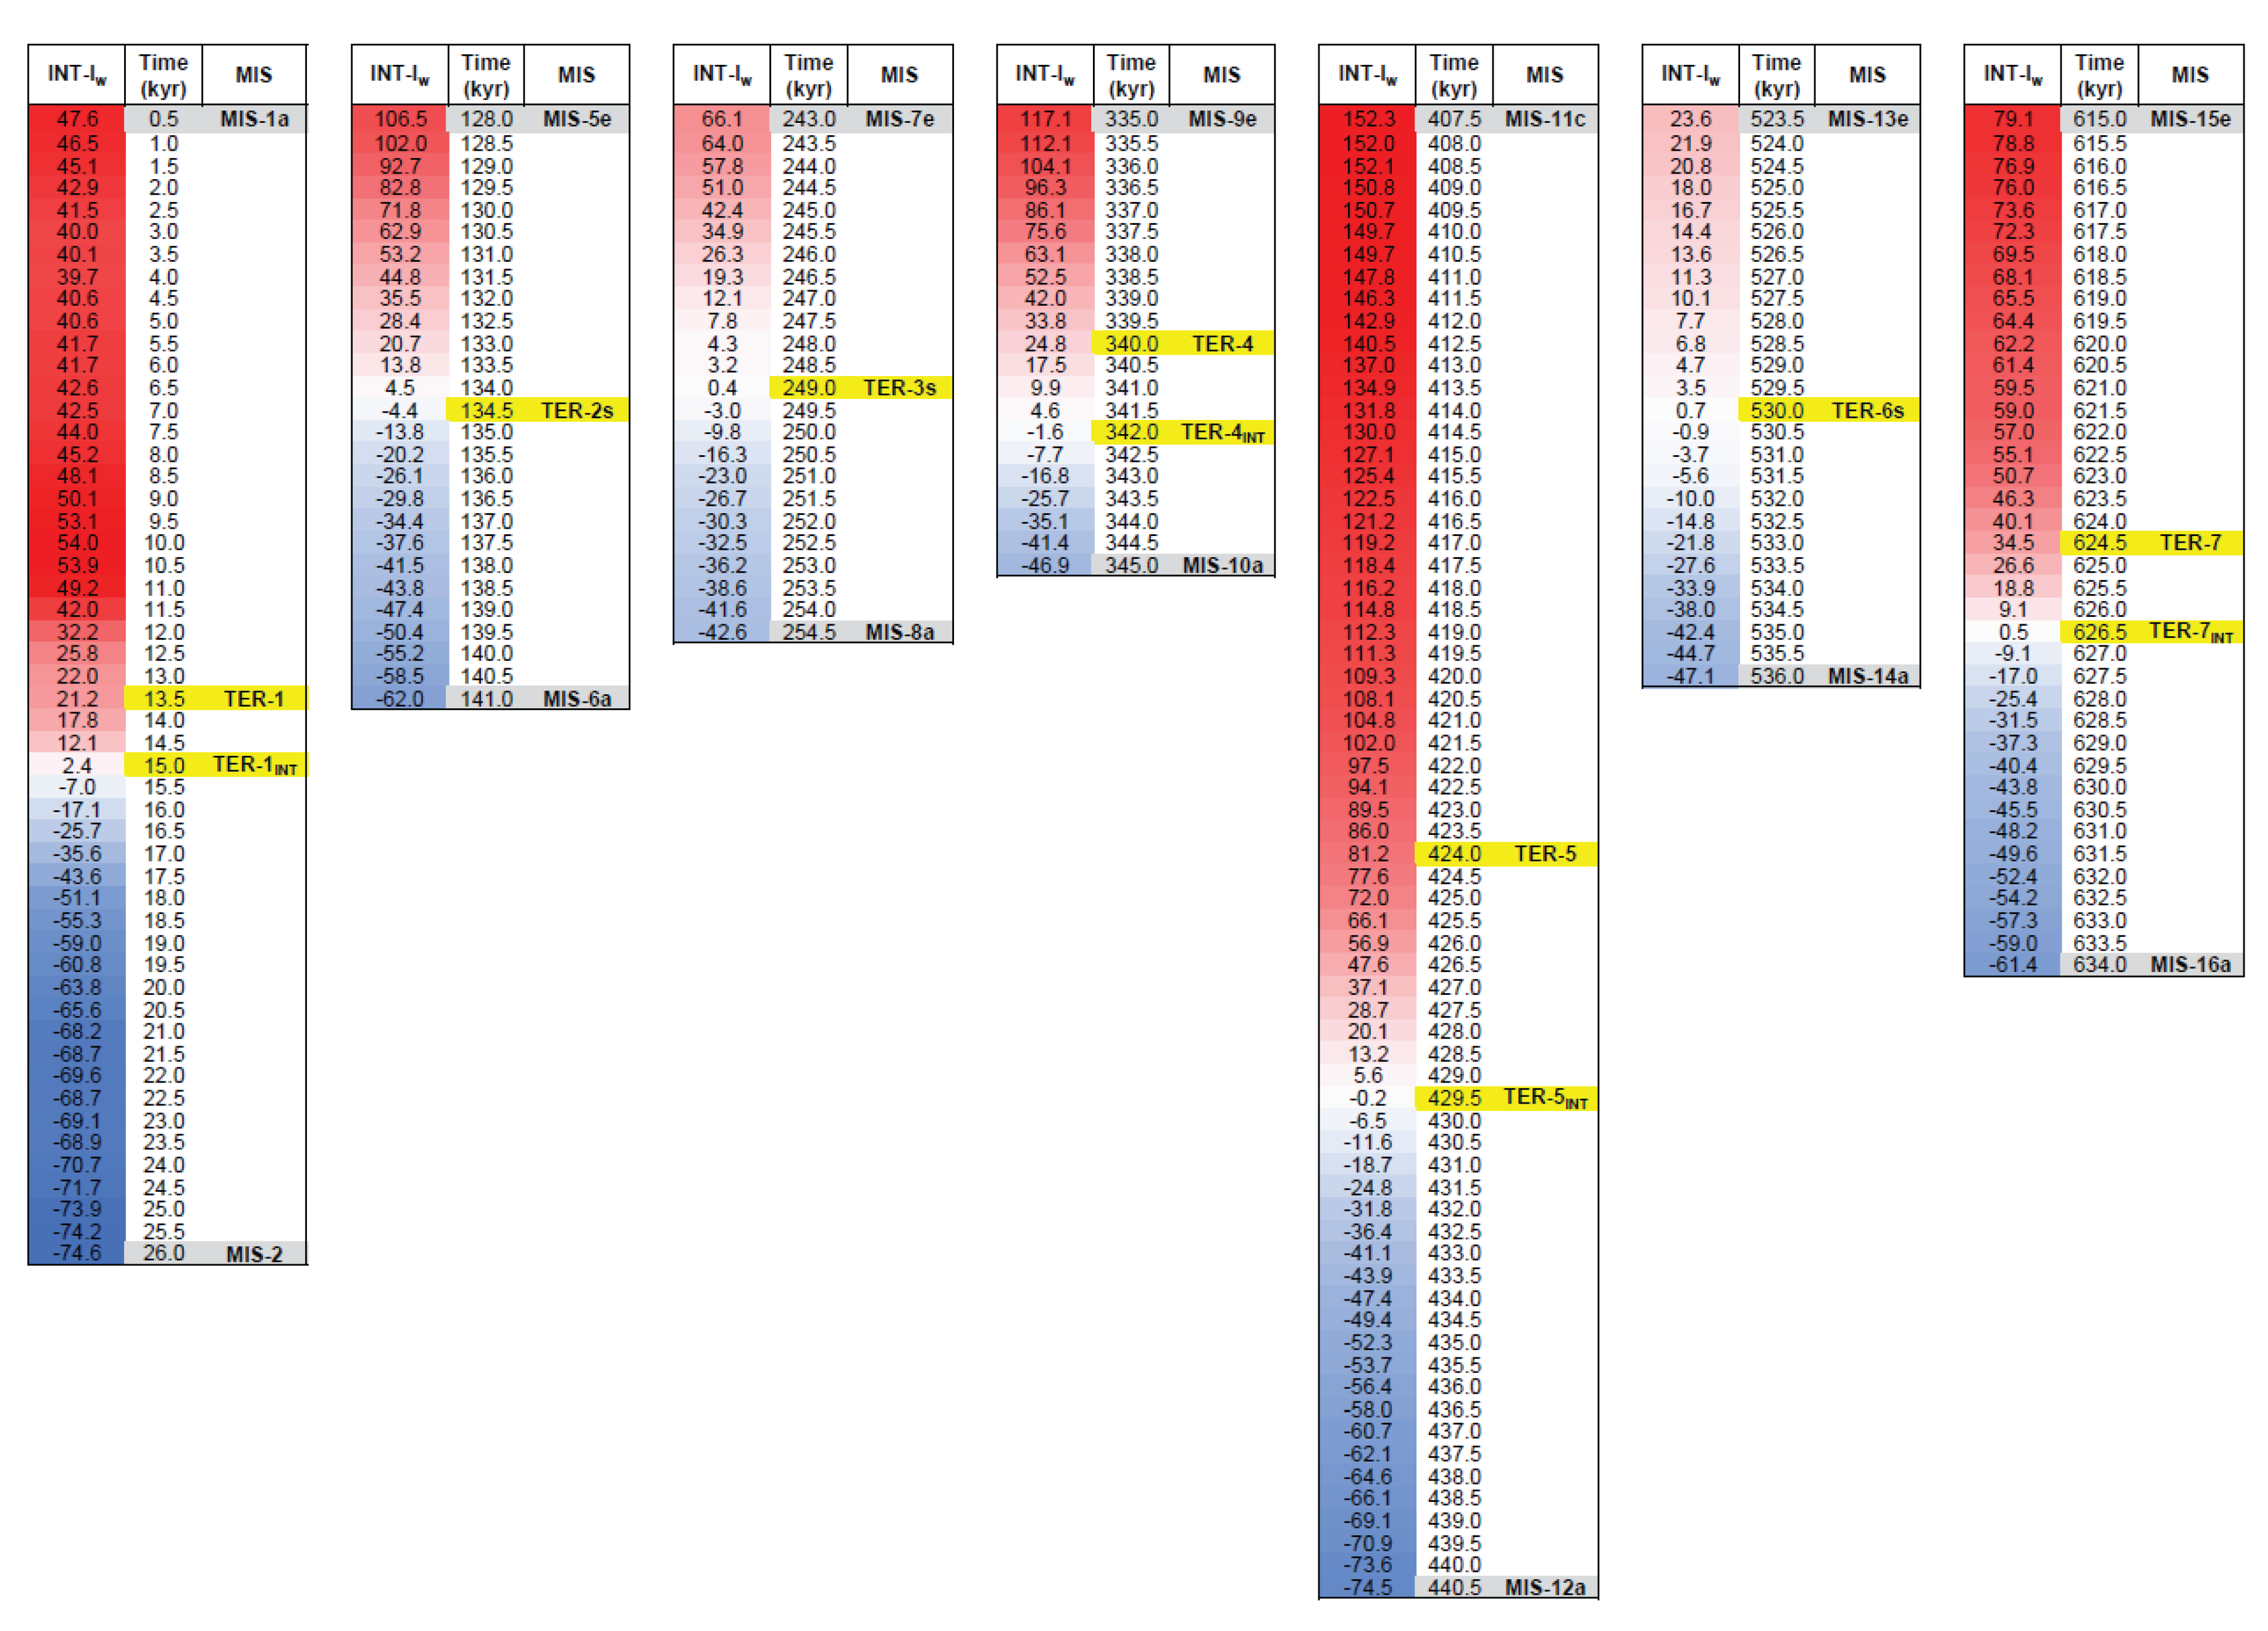
The terms ‘positive’ or ‘negative’ interference used in the segmentation class legend (Figure 6b) refer to the absolute intensity (from very low to very strong) of the resulting warming or cooling waves, respectively. The interference model allows recalibration of TER ages according to the structural notion of the ‘cancellation interference’ of thermal responses between glacial and interglacial peaks (INT-Iw near-0 value) (Table 3, Figure 7). Although the age difference between the EPICA criteria is small, for some TERs (TER-1/4/5/7) the midpoint interference intensity is significantly different from the neutrality (such as TER-2/3/6, which are coincident) and experiences an unexpected relevant positive bias, as can be seen from the values of the INT-Iw. TER-1 and TER-4 belong to the VLPI class, whereas TER-5 and TER-7 belong to the HPI and LPI classes, respectively (Figure 7). Therefore, to study the interference structure even of the recalibrated TERs, they have been added to the MIS dataset as additional cases with the ‘INT’ subscript (87 total cases).

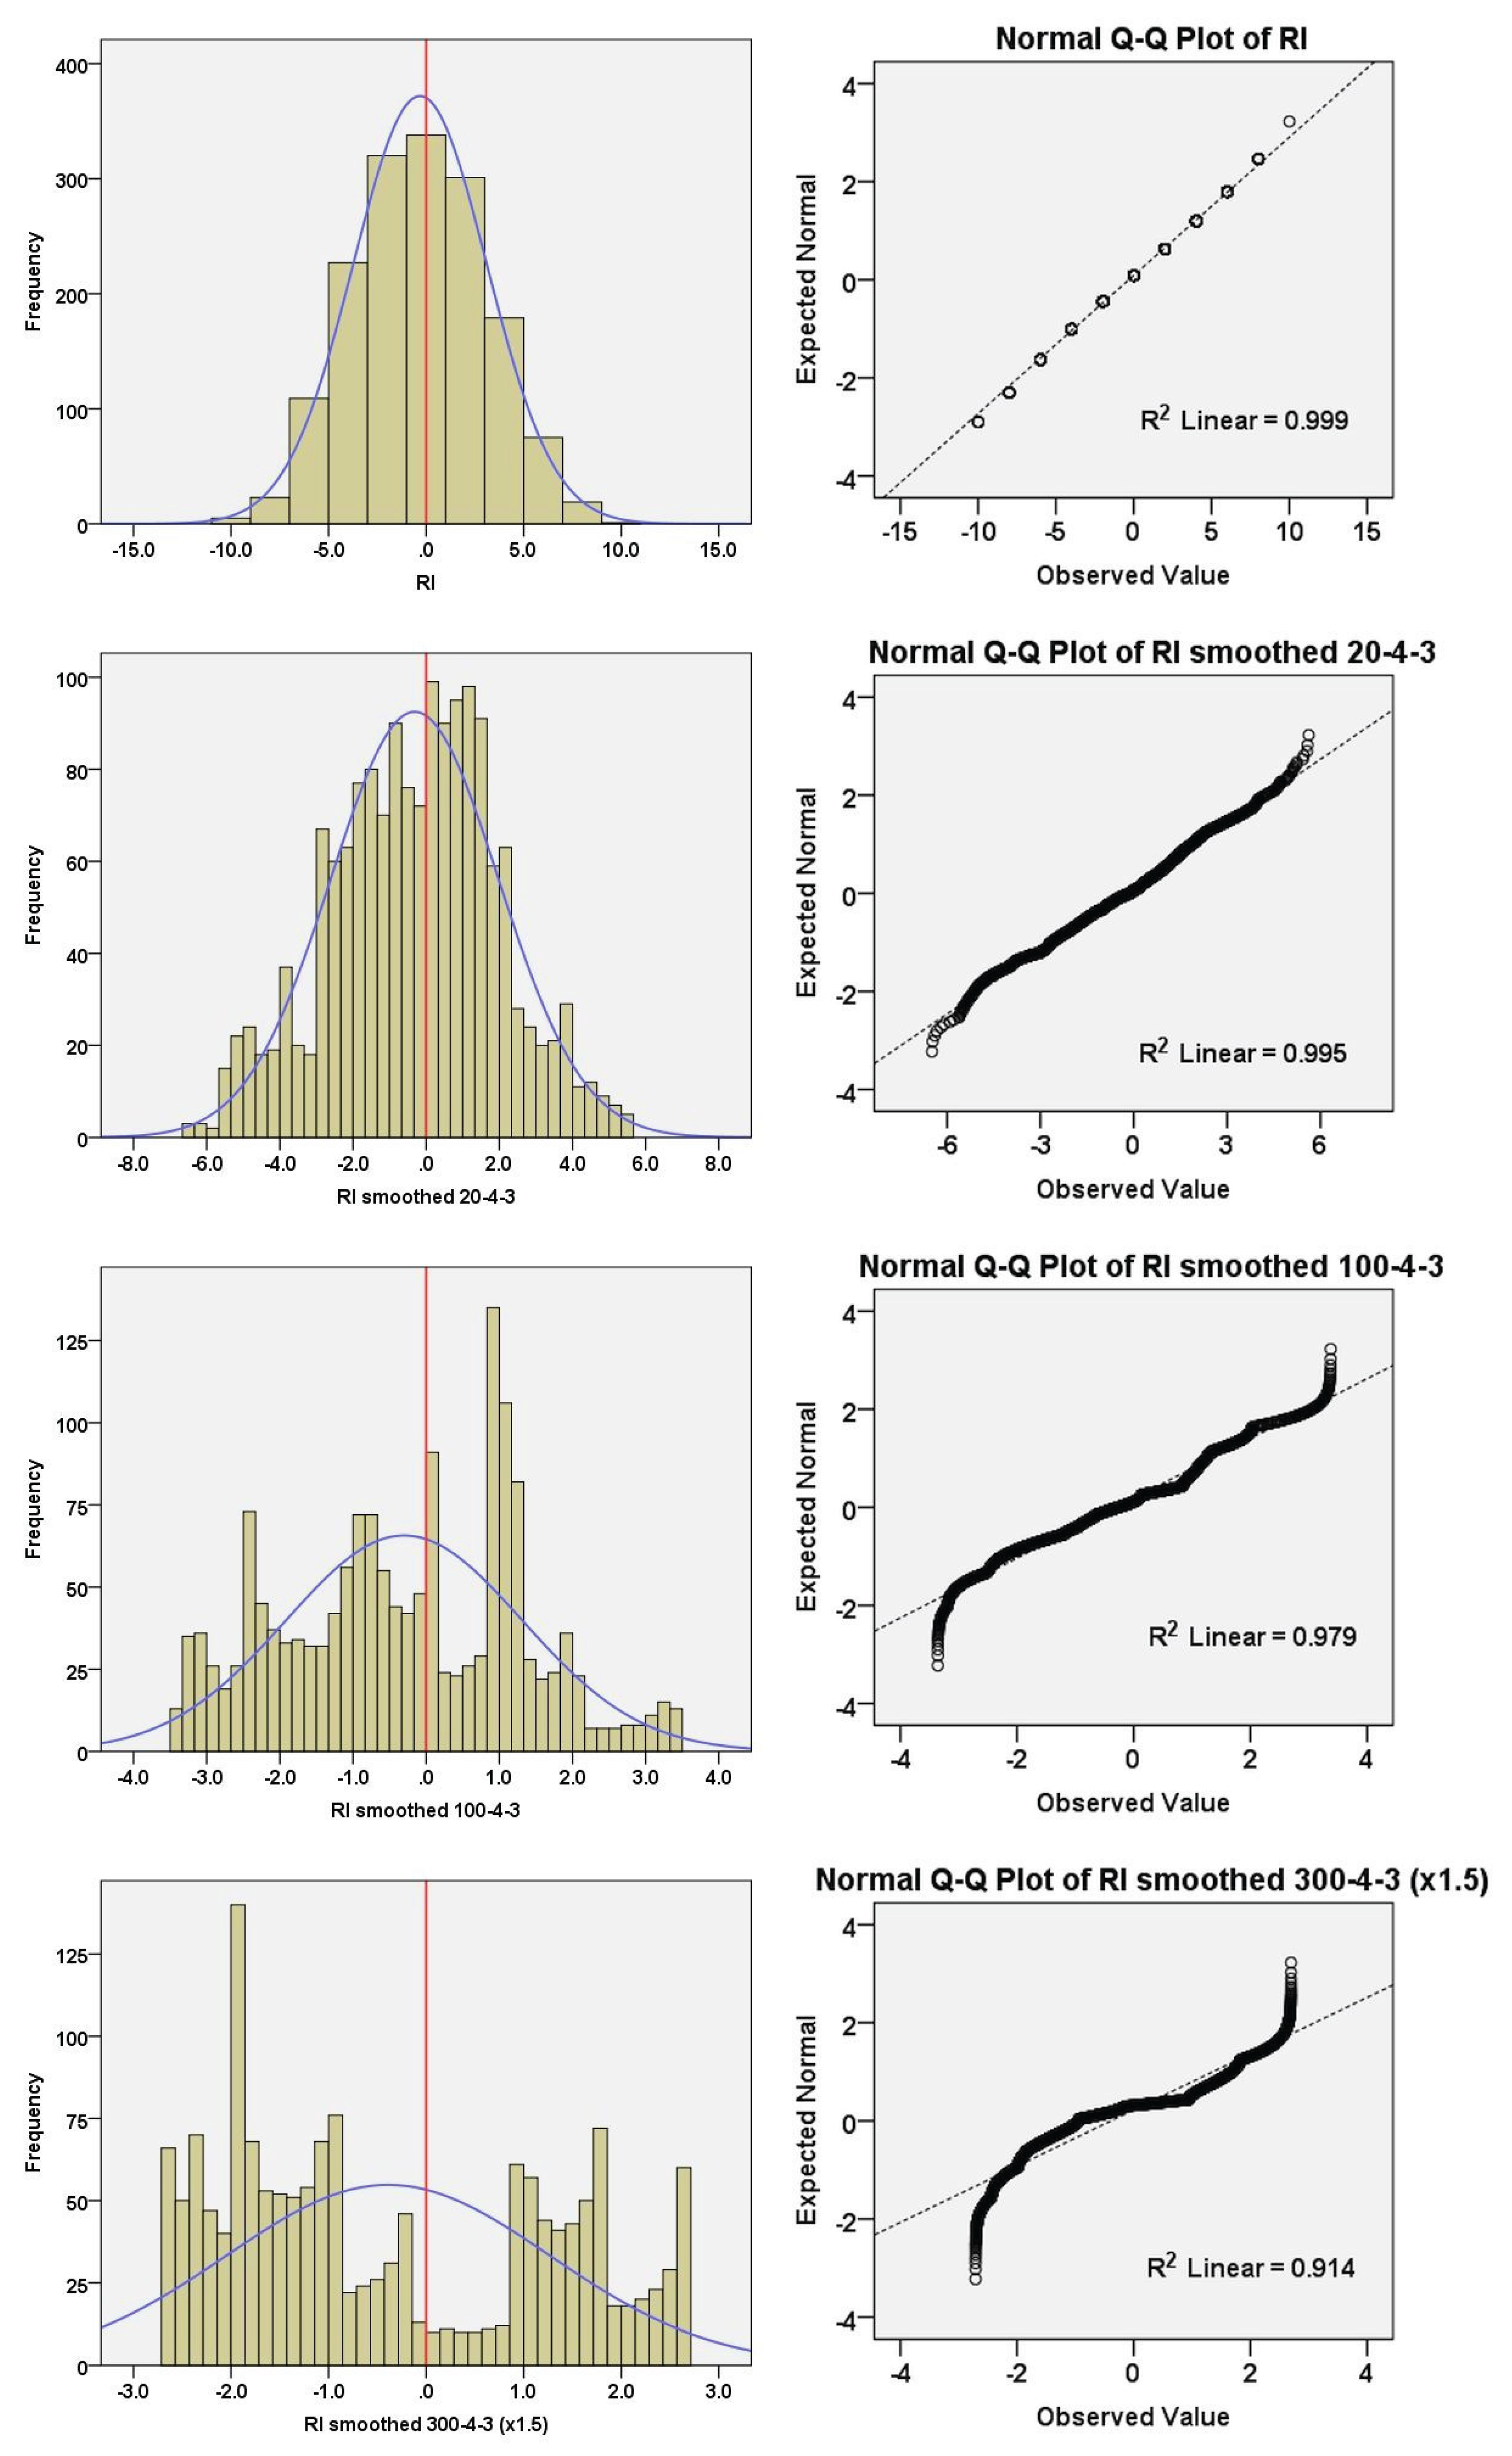
3.1.2. Polarity Alignment

This section discusses the time alignment of the EPICA components using the response indices (Figure 8) and their frequency distributions (Figure 9). The RI shows a quasi-normal distribution, as evident by the symmetry of the histogram and linearity of the Q-Q normality plot. In particular, the RI centres on the null value, indicating the maximum occurrence probability of 50% warming and cooling alignments (RI = 0). The finding suggests that the short-term interference of the independent thermal components is a Gaussian stochastic process governed by chance. Instead, at the mid-term (RIs 20)/long-term (RIs 100 and 300) scales, the stochastic interactions increasingly deviate from normality and exhibit a multi-modal distribution that reveals patterns of consistency, suggesting a possible effect on the features of the MISs (Figure 9). Long-term polarity indices are minimum (cooling alignment) at ~ 680–660 kyr (MISs-16) and maximum (warming alignment) at ~ 420–380 kyr (MIS-11c/d/e) (Figure 8). In contrast, MIS-5e shows a relatively positive RIs of 100 but a negative RIs of 300, indicating a long-term antipolar pattern. MISs-7 are associated with long-term strong negative polarity (RIs 300), which is opposed to weaker maximum of the RIs 100. Interestingly, MISs-1 are associated with long-term negative alignment. These examples suggest complex interaction patterns among the components of the climate system.

3.1.3. Constructive and Destructive Interference

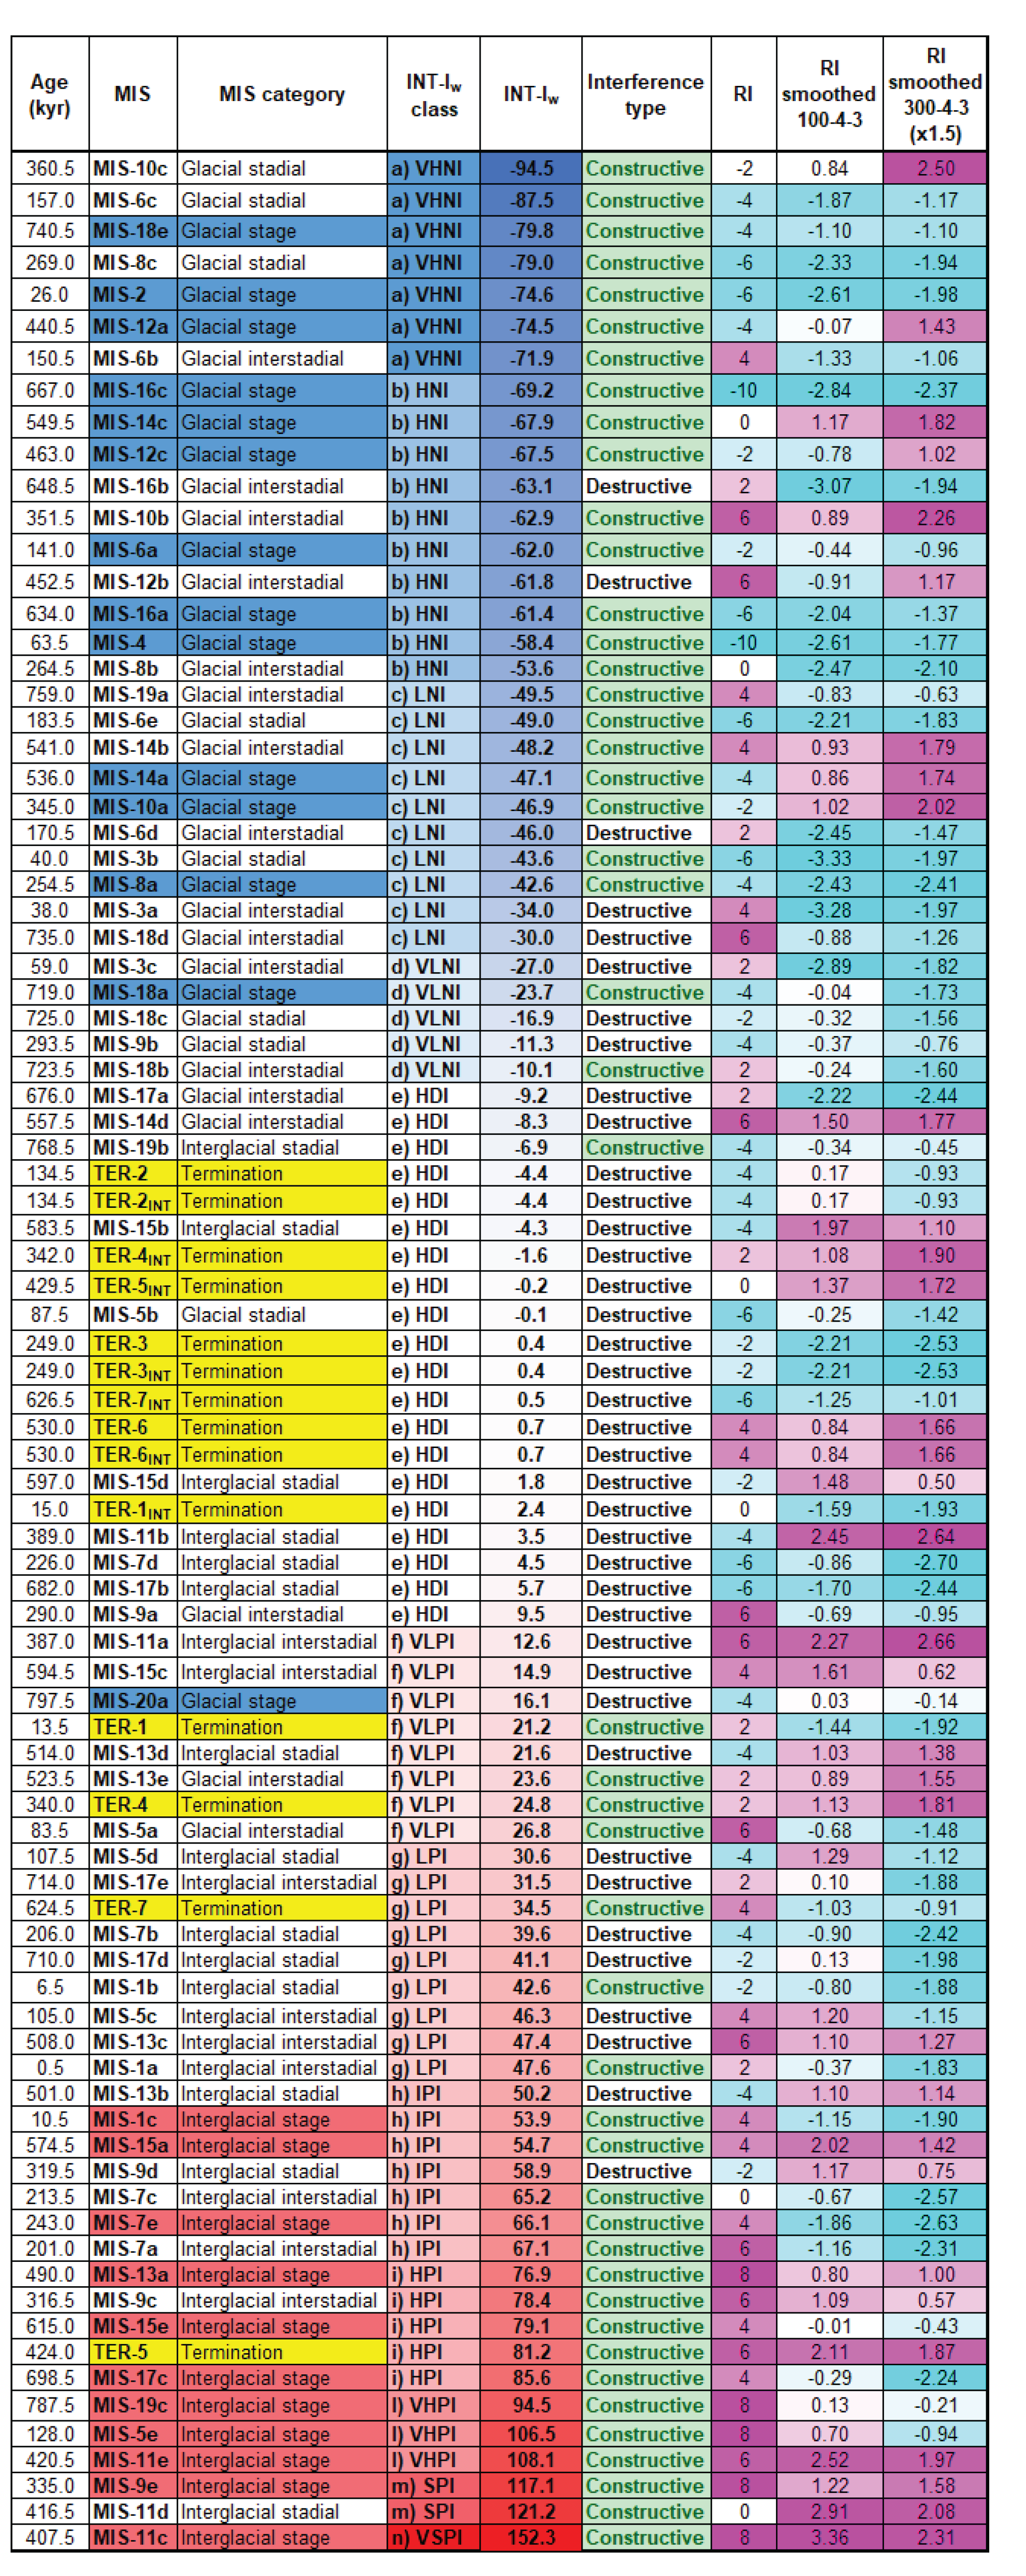
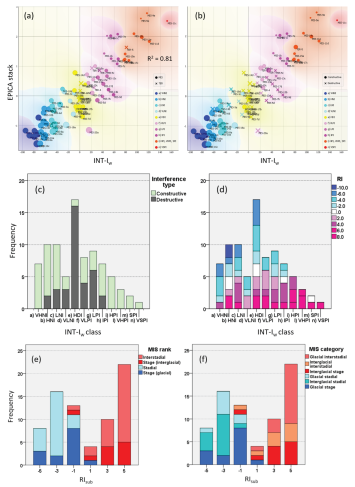
The ‘constructive’ or ‘destructive’ interference type refers to INT-Iw when the resulting wave is larger or smaller than the larger (absolute) positive/negative EPICA component, respectively. This implies that constructive interference reinforces the wider positive (warming) or negative (cooling) thermal waves at a given time, whereas destructive interference weakens the resulting wave. Figure 10 depicts the interference ‘heat map’ of the MIS dataset (87 cases) sorted by both INT-Iw class and INT-Iw to highlight the interference model results. Figure 11 summarises the interference model. The EPICA stack vs. INT-Iw cross-plots with colour superposition of the INT-Iw class, symbol shape by MIS/TER (Figure 11a), and constructive/destructive interference (Figure 11b) confirm that INT-Iw is a good approximation of the EPICA stack record (R2 = 0.81), as shown in Figure 4a for 1597 cases. At first glance, interglacial stages result from high to very strong (73%) and intermediate (27%) constructive interference of warming responses (from IPI to VSPI: MIS-1c, MIS-5e, MIS-7e, MIS-9e, MIS-11c/e, MIS-13a, MIS-15a/e, MIS-17c, MIS-19c) related to global δ18O depletion, and appear to be compactly clustered towards medium/very high values of positive interference (Figure 10). Instead, the glacial stages appear more dispersed along the spectrum of negative constructive interference, with the exception of MIS-20a, which falls unexpectedly into the VLPI class. In fact, 64% of glacial stages are associated with high/very high values of constructive interference of cooling responses (VHNI and HNI: MIS-2, MIS-4, MIS-6a, MIS-12a/c, MIS-14c, MIS-16a/c, MIS-18e) related to global δ18O enrichment. The other 36% are characterised by low negative constructive interference (LNI: MIS-8a, MIS-10a, MIS-14a; VLNI: MIS-18a) and the unexpectedly low positive destructive interference of MIS-20a (VLPI).
MIS-20a (VLPI) appears to be an anomaly of underestimated negative INT-Iw, owing to destructive interference with a large warming response of short eccentricity. This anomaly may only be apparent because the EPICA record does not reach MIS-20c which may have a more pronounced negative envelope of interference, similar to MIS-6c/8c/10c/14c with respect to the corresponding MIS-6a/8a/10a/14a (Figure 8). In fact, this shape of increased interference (warming direction) in late glacial MISs occurs in the cases of MIS-6a/c, MIS-8a/c, MIS-10a/c, and MIS-14a/c, although it is not as pronounced. The findings suggest that it is a structural feature of thermal forcing related to TERs. This topic is explored further in Part 2 of this study (in progress). In contrast, low-intensity MISs, including 90% of substages, fall in the low-interference regions where dominant destructive interference minimises the thermal response (HDI: MIS-5b, MIS-7d, MIS-9a, MIS-11b, MIS-14d, MIS-15b/d, MIS-17a/b, MIS-19b; VLNI: MIS-3c, MIS-9b, MIS-18a/b/c; VLPI: MIS-5a, MIS-11a, MIS-13d/e, MIS-15c, MIS-20a) (Figure 11b,c).
Concerning TERs, TER-2/2INT, TER-3/3INT and TER-6/6INT share the same dating and fall consistently in the HDI region with destructive patterns and ‘cancellation’ interference, whereas TER-1/4/5/7 dated by midpoint appear away from the near-0 interference region and are characterised by an unexpected constructive interference and positive bias (VLPI: TER-1/4; LPI: TER-7; HPI: TER-5) (Figure 7 and Figure 10). This observation is likely an artefact caused by the inaccuracy of the midpoint dating criterion determined by the asymmetrical pattern of glacial cycles (see also Section 3.1.4). In general, the absolute differences in dating terminations between the two EPICA criteria are not significant as they are contained between 1.5–2 kyr, with the exception of TER-5 which goes up to 5.5 kyr. On a conceptual/structural basis the differences become important for TER-1/4/5/7. Thus, TERs are most appropriately dated and described by the structural criterion of null interference and clearly fall in the HDI region with destructive patterns. While constructive and destructive interference showed a clear distribution pattern within the interference classes (constructive dominated in high-intensity regions; destructive dominated in low-intensity regions) (Figure 11c), the RI shows a more heterogeneous distribution, reflecting the Gaussian stochastic nature of the short-term interaction among climate components (Figure 11d). Indeed, contrary to what one would expect, in the VHNI region there are no MISs with minimum RI (up to –6 only, or NRI = 80%, MIS-2/8c), while those with RI = –4 (NRI = 70%, MIS-6c/12a/18e) are more frequent, with one case having an RI = 4 (NRI = 30% only, MIS-6b). The HDI class shows the widest distribution of RI values ranging from –6 to 6, whereas in the VHPI region and above, there are positive RI values from 6 (PRI = 80%, MIS-11e) to a maximum of 8 (PRI = 90%, MIS-5e/9e/11c/19c). Only one case in the SPI class had a RI of 0, equivalent to a PRI of 50% (MIS-11d). From Figures 11e-f, it is interesting to note that the millennial-scale suborbital components (half-precession, sun-related 9.7/6.0/2.5 kyr cycles, and unknown-3.7 kyr cycle) are significant in determining the rank of the MISs. This is demonstrated by the RIsub showing the greater positive polarisation (3, 5) of such cycles more frequently in interstadials than in interglacial stages. The polarisation is substantially opposite in stadials compared to glacial stages, where higher frequencies of negative suborbital alignments are observed (RIsub = ‒3, ‒5).
In summary, the response-centric interpretation of the climate in terms of physical interference shows complex stochastic interactions of both intensity and polarity among ten strength-weighted thermal waves spanning the mid-term, orbital (including short eccentricity), and suborbital frequency bands, leading to constructive or destructive energy redistribution with both glacial and interglacial polarity at different ranks (stage, substage). This overcomes the fact that the features and timing of nominal forcings and climate responses may be significantly different because of nonlinear transformations by intermediate feedback mechanisms and age model discrepancies.

3.1.4. Intensity Asymmetry

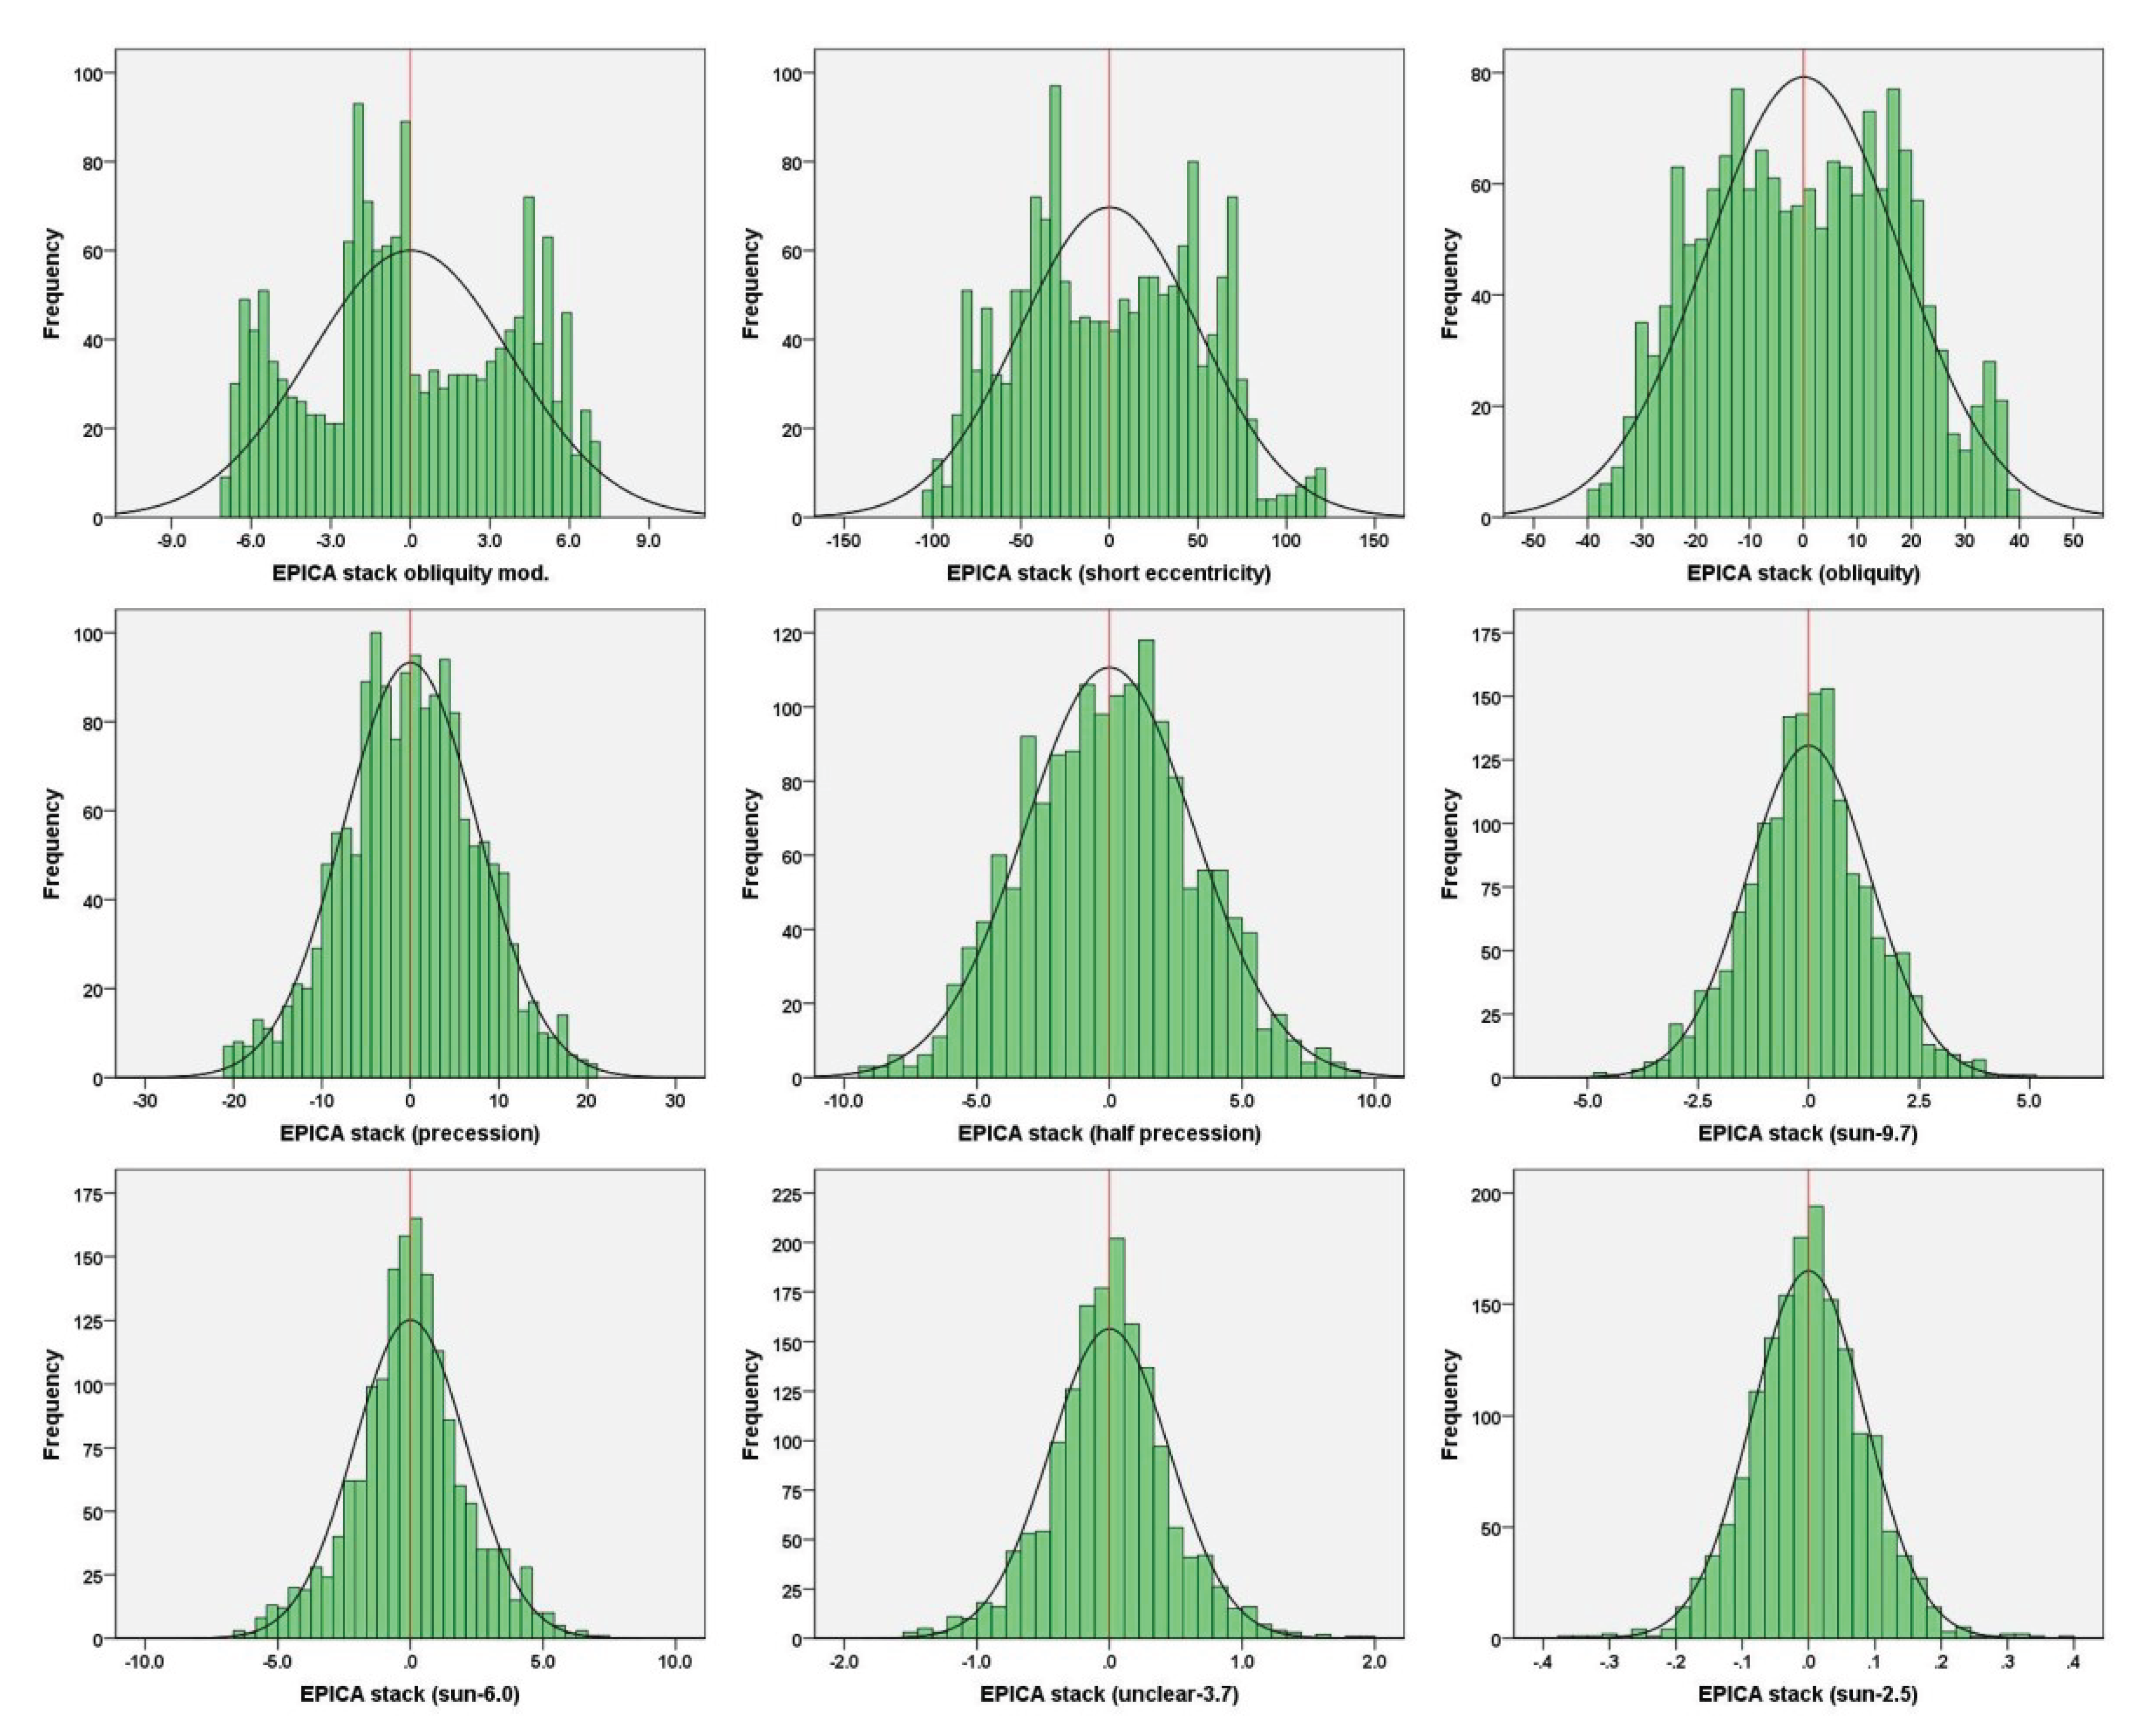
Interestingly, the relevant asymmetry does not characterise the cyclical stacked components of EPICA (Figure 12), whereas both the EPICA stack and INT-Iw show strong positive skewness (Table 4, Figure 5). This suggests that the intensity asymmetry results from the interference process. To verify this suggestion, an exercise was conducted to develop INT-Iw by progressively adding climatic components according to their relative strength in descending order and measuring the asymmetry statistics each time (Table 5). The progressive increase in both the positive skewness and maxima owing to the summation of new components until stabilisation after half-precession is a relevant feature. In particular, the suborbital components excluding half-precession do not modify skewness because of their low quantitative impact [19]. The tendency to reduce the minima indicates an overall damping effect of the negative interference, reflected in the truncation of the glacial tails of both the INT-Iw and EPICA stack histograms.
This analysis demonstrates the key role of interference in transforming the intrinsic features of the thermal responses, leading to the characteristic distribution pattern of the EPICA stack (positive skewness and negative tail ‘truncation’).
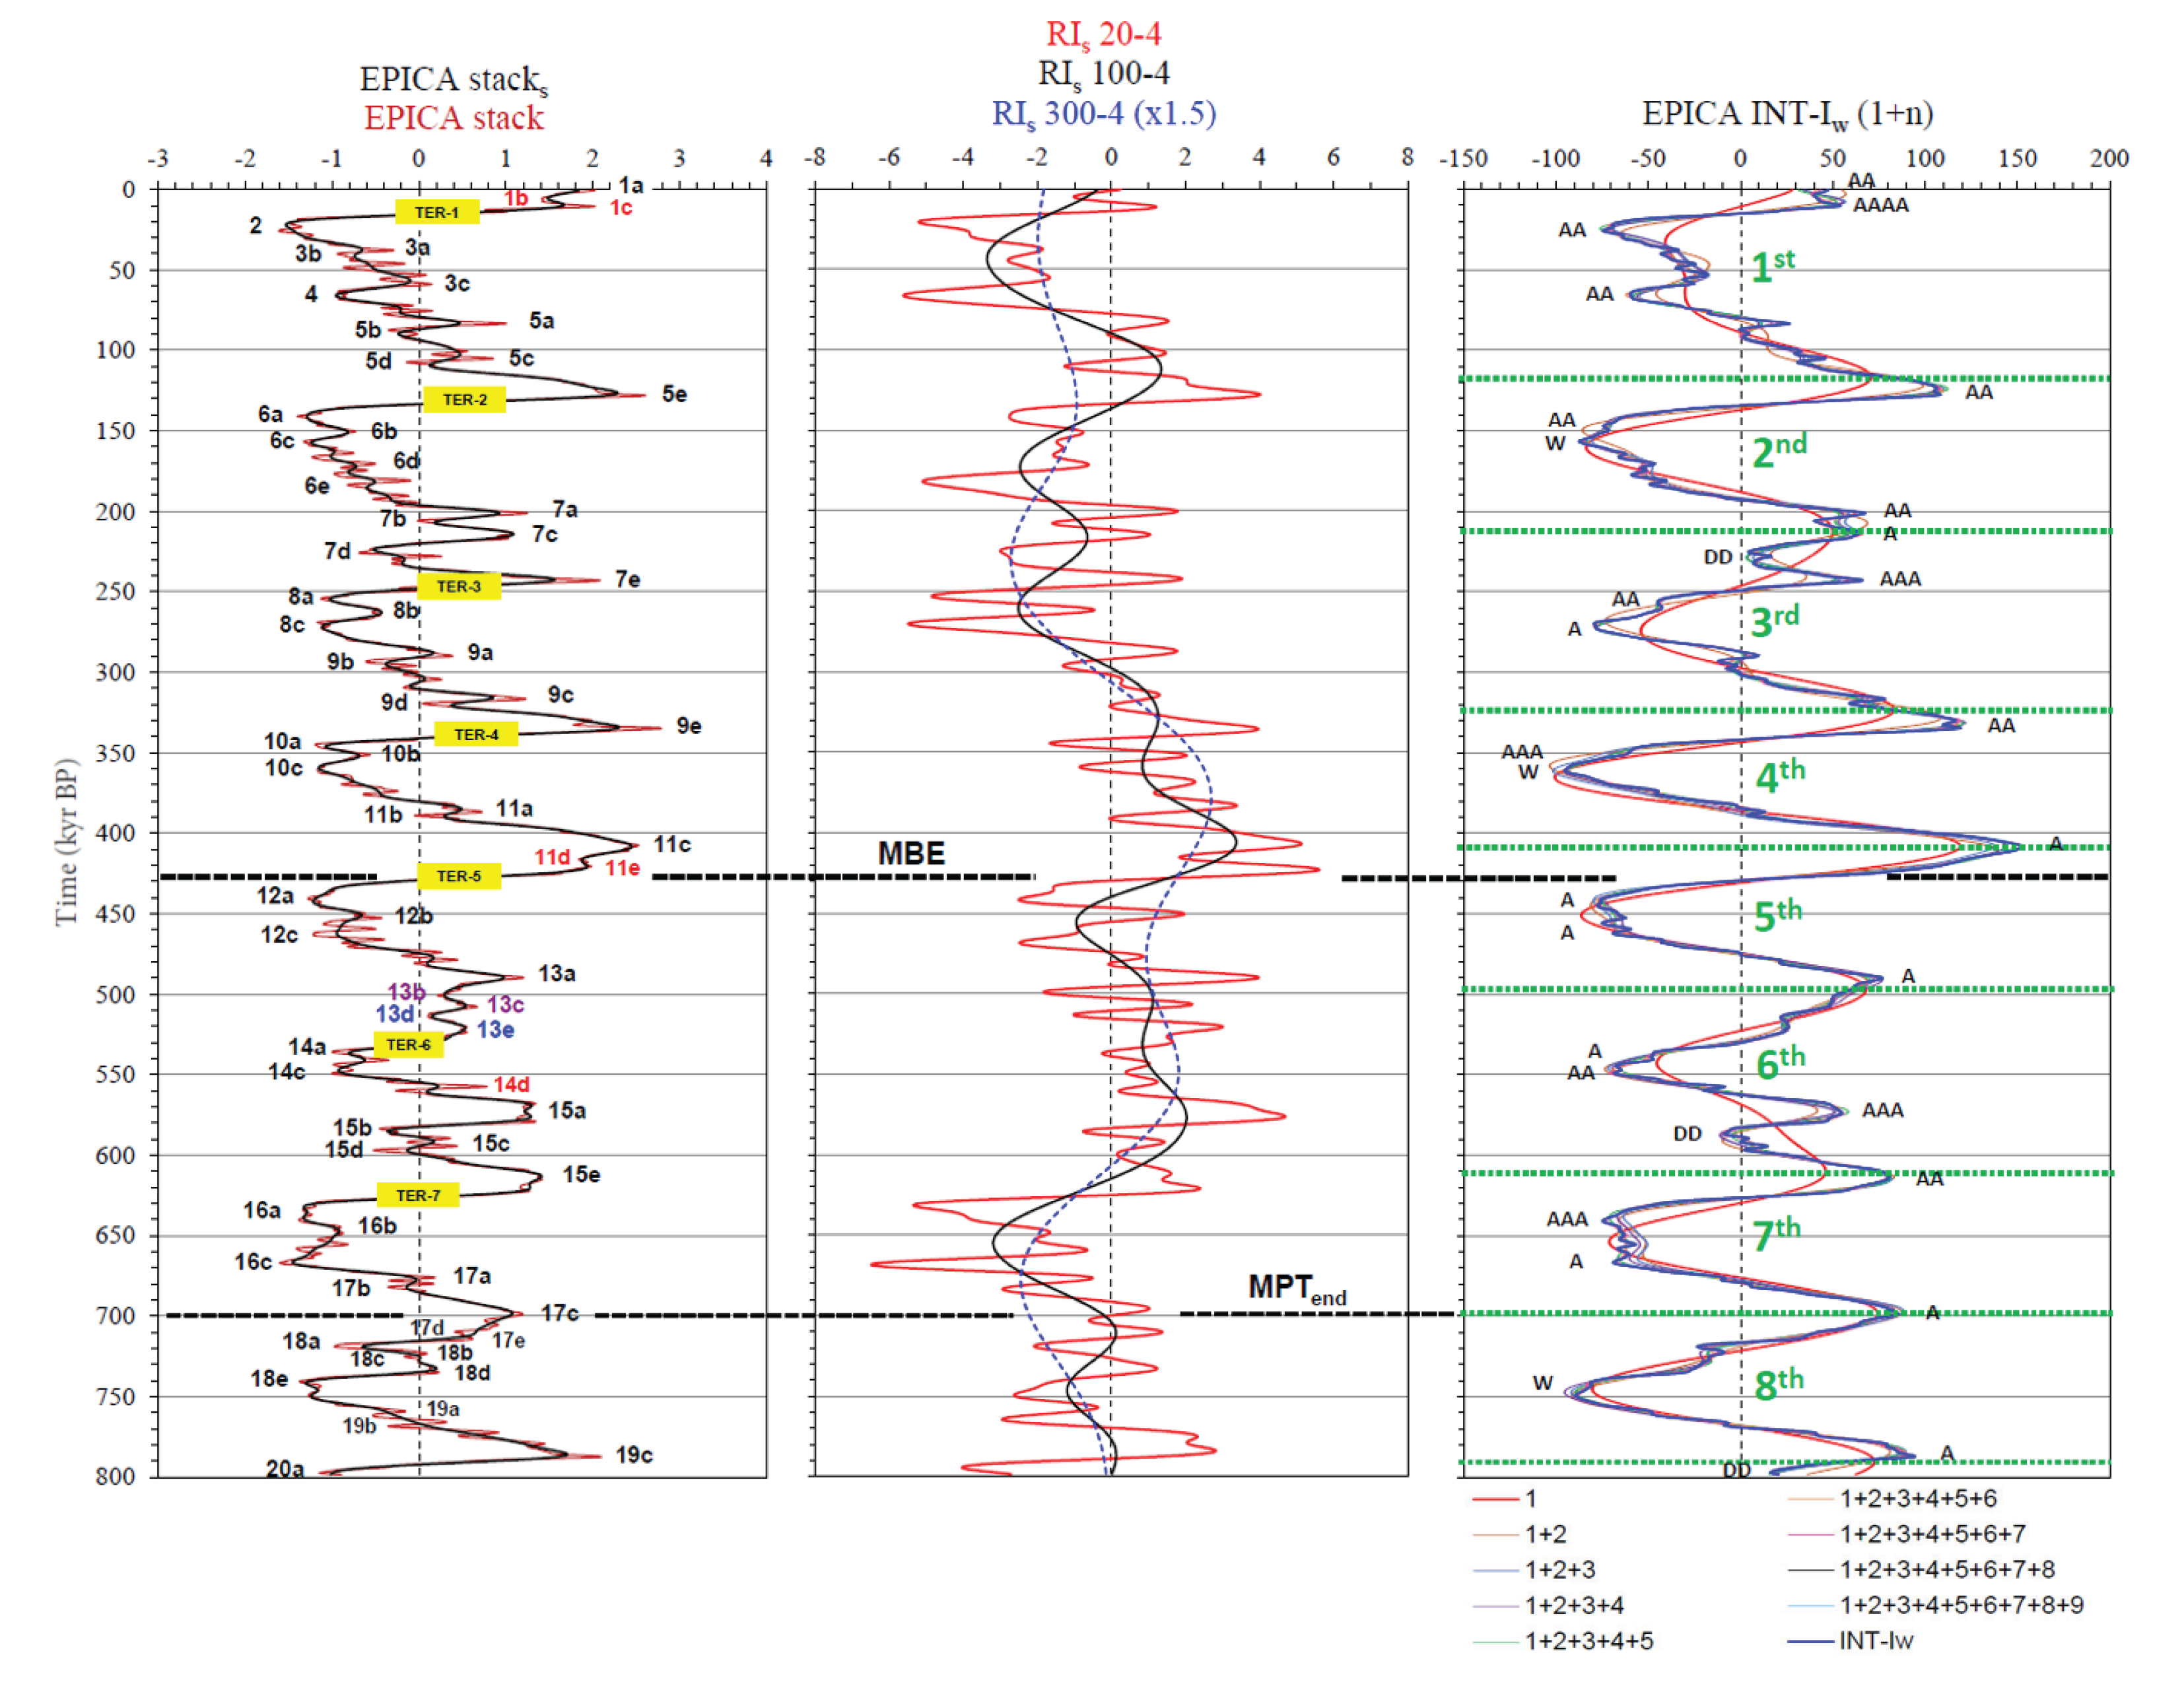
Considering the main MISs, interference acts on the structural framework of the dominant short eccentricity response, mainly in terms of bipolar intensity amplification, with a bias in the warming direction (interglacial), especially after the MBE (Figure 13, Table 6). Indeed, by measuring on the main glacial/interglacial MISs the percentage effect of interference on the short eccentricity response, an average amplification of 539% is obtained for interglacials against a value of 58% for glacials (Table 6). Indeed, of 31 major glacial/interglacial MISs, only three show a destructive interference pattern (9.7%) (MIS-7d/15b/20a). The pre-MBE interglacials exhibit a mean amplification of 117%, whereas the observed intensification for the post-MBE interglacials is 803%. The average strengthening of the pre-MBE glacials is 26% compared with 89% for the post-MBE glacials. The outstanding warming bias of the post-MBE interglacials (MIS-1a/1c/5e/7a/7c/7e/9e/11c) is due to the interference of the warming responses of the relevant mean intensity in both high-variance bands (obliquity and precession, with the exception of short eccentricity) and suborbital components. The average contribution of suborbital cycles to climate warming was more pronounced in the post-MBE interglacials (2.4) than in the pre-MBE interglacials (0.9), although weak overall. This led to the highest mean INT-Iw (84.5) with respect to the pre-MBE interglacials (78.2, MIS-13a/15a/15e/17c/19c). Surprisingly, the mean warming response of the short eccentricity was higher in the pre-MBE interglacials (51.9) than in the post-MBE interglacials (43.1). The amplification effect of the interference on major glacial MISs was more moderate than that on interglacial MISs. Post-MBE glacials (MIS-2/4/6a/6c/8a/8c/10a/10c) show a slightly colder average INT-Iw (‒68.2) than in the pre-MBE glacials (‒56.4) (MIS-12a/12c/14a/14c/16a/16c/18e/20a). Lower cooling of the pre-MBE glacial MISs occurs because all the high-variance bands (short eccentricity, obliquity, andprecession) exhibit less pronounced average cooling than the post-MBE glacials. In particular, the average cooling of the short eccentricity in the pre-MBE glacial MISs is mitigated by the robust warming during MIS-20a. If we exclude MIS-20a from the average, the difference in glacial interference between pre- and post-MBE MISs is further reduced (INT-Iw = ‒66.8 vs. ‒68.2, respectively). Unlike interglacials, the cooling caused by suborbital cycles is slightly more pronounced during the pre-MBE time (‒0.8 vs. ‒0.6). Of special interest are the MIS-7d/15b stadials, whose antipolar patterns of destructive interference (short eccentricity warming vs. obliquity/precession cooling) dampen the envelope of climate responses into the HDI class. A destructive interference pattern similar to previous patterns but with more pronounced antipolar intensities is that of MIS-20a. Here, the cooling of both robust obliquity and very strong precession is dampened by a robust heat wave with short eccentricity.
Thus, the interference model explains the key questions of why the post-MBE interglacials appear warmer than the pre-MBE ones and why the post-MBE glacials appear slightly colder than the pre-MBE glacials. However, interference acts as a process of stochastic energy redistribution of thermal responses at a given time. This, in turn, is the effect of nonlinear energisation operated by little-known intermediate feedback mechanisms [4,8,9,16,19,24,38,40,42,44,46,48,49,50]. For example, it is unclear why the climate response of the short eccentricity at ~ 400 kyr (MIS-11c) is so marked compared to that of the weakest short eccentricity nominal maximum over the last 800 kyr [36]. According to Viaggi [8,9,38] the climate system is dominated by positive feedbacks capable of making extremely strong bipolar amplification with responses of up to 5‒7 times the orbital forcings. This may explain the energy excess paradox’ of the astronomically paced signals compared to the small energy of the orbital forcing, especially with respect to the eccentricity bands [10,26,31,52,72,73]. The energy paradox of Milankovitch's theory between the power of high-latitude NH summer insolation spectra and the variance of climate proxies results from the nominal-centric versus response-centric perspective of climate interpretation, with feedback mechanisms in between [9]. The latter mechanisms make the difference because precession, although dominant in the NH summer insolation spectra, is a short cycle in which feedbacks have less time to transfer additional energy. Indeed, the Plio-Pleistocene exponential coefficient ekx for the LR04 δ18O semi-precessional component is 1.05 and increases with the orbital period; it is 1.78 for the precessional component, 1.88 for the obliquity component and 2.93 for the short eccentricity component [8]. Obliquity, although weaker in NH summer insolation with respect to precession, has a longer cycle that favours a more consistent (non-linear) feedback-mediated thermal response. Therefore, an ice sheet that manages to survive the ablation of precession and obliquity could be sensitive to feedbacks mediated by short eccentricity during the Earth’s long-term ice state (obliquity damping hypothesis) [9].

3.1.5. Time Asymmetry

The saw-tooth shape of Mid–Late Pleistocene glacial cycles is a well-known but poorly understood feature. This section investigates whether the physical interference of thermal responses plays a role in influenced this type of asymmetry during the last 800 kyr. The analysis was conducted by examining the cooling and warming durations of eight short eccentricity cycles using the EPICA stack weighed component (Figure 13). Cycles were defined between the EPICA stack short eccentricity maxima (from 1st to 8th in order of increasing age) and the La2010 eccentricity nominal solution [36] by capturing the ages of the maxima and minima with a peak detection algorithm (Table 7). The maximum of the 1st cycle of the EPICA short eccentricity stack, not yet reached at the present time, was estimated by an autoregressive linear forecast algorithm (40-order singular value decomposition) at ‒4.5 kyr in the future time. These data were compared to those obtained from structurally equivalent cycles of INT-Iw. Duration statistics were calculated for eight cycles for each record. The first unexpected result of this analysis is that the nominal short eccentricity cycles exhibit a slight mean time asymmetry, which is different from that reported in the literature [11,35]. Indeed, the nominal short eccentricity cycles show that the average duration of the cooling hemicycle (decreasing eccentricity) is 50.9 ± 14 kyr, while the warming hemicycle (increasing eccentricity) has an average time of 45.1 ± 11.2 kyr, resulting a mean time asymmetry (prolonged cooling) of 5.8 kyr. The EPICA short eccentricity stack exhibits an average cooling duration of 54 ± 14 kyr and an average warming time of 45.4 ± 7.1 kyr, with a mean time asymmetry of 8.6 kyr. Thus, the asymmetry in the time of the EPICA short eccentricity response was amplified with respect to the nominal forcing by the 48% prolonged cooling. Moreover, the effect of interference measured on the INT-Iw is to lengthen the average cooling times to 59.1 ± 19.5 kyr and to shorten the warming times to 38.0 ± 15.7 kyr, thus bringing the time difference to 21.1 kyr prolonged cooling. Notably, these data show an intrinsic temporal asymmetry in the nominal short eccentricity and its EPICA response, as well as a strong interference-induced time asymmetry that prolonged the cooling vs. short eccentricity response by 145%. The 48% increase in the duration of the cooling hemicycle of the thermal response paced by short eccentricity forcing can be attributed to feedback mechanisms induced by an already asymmetric nominal hemicycle. Indeed, a longer forcing cooling hemicycle will give rise to a more prolonged feedback mechanism compared to a shorter warming hemicycle, accentuating the intrinsic temporal asymmetry of the resulting thermal response. Thus, the overall effect of the increased temporal asymmetry (from nominal eccentricity = 5.8 kyr to INT-Iw = 21.1 kyr, i.e. 264%) which resulted in the saw-tooth shape of glacial cycles, is due to the joint action of intermediate feedback mechanisms with a strong contribution from physical interference. Finally, the average period of the short eccentricity cycle among the nominal forcing (96.0 kyr), EPICA response (99.4 kyr), and interference envelope (97.1 kyr) did not change significantly through feedback processes or the interference mechanism.

3.2. Relationships among Orbital Forcings, EPICA Responses and Interference

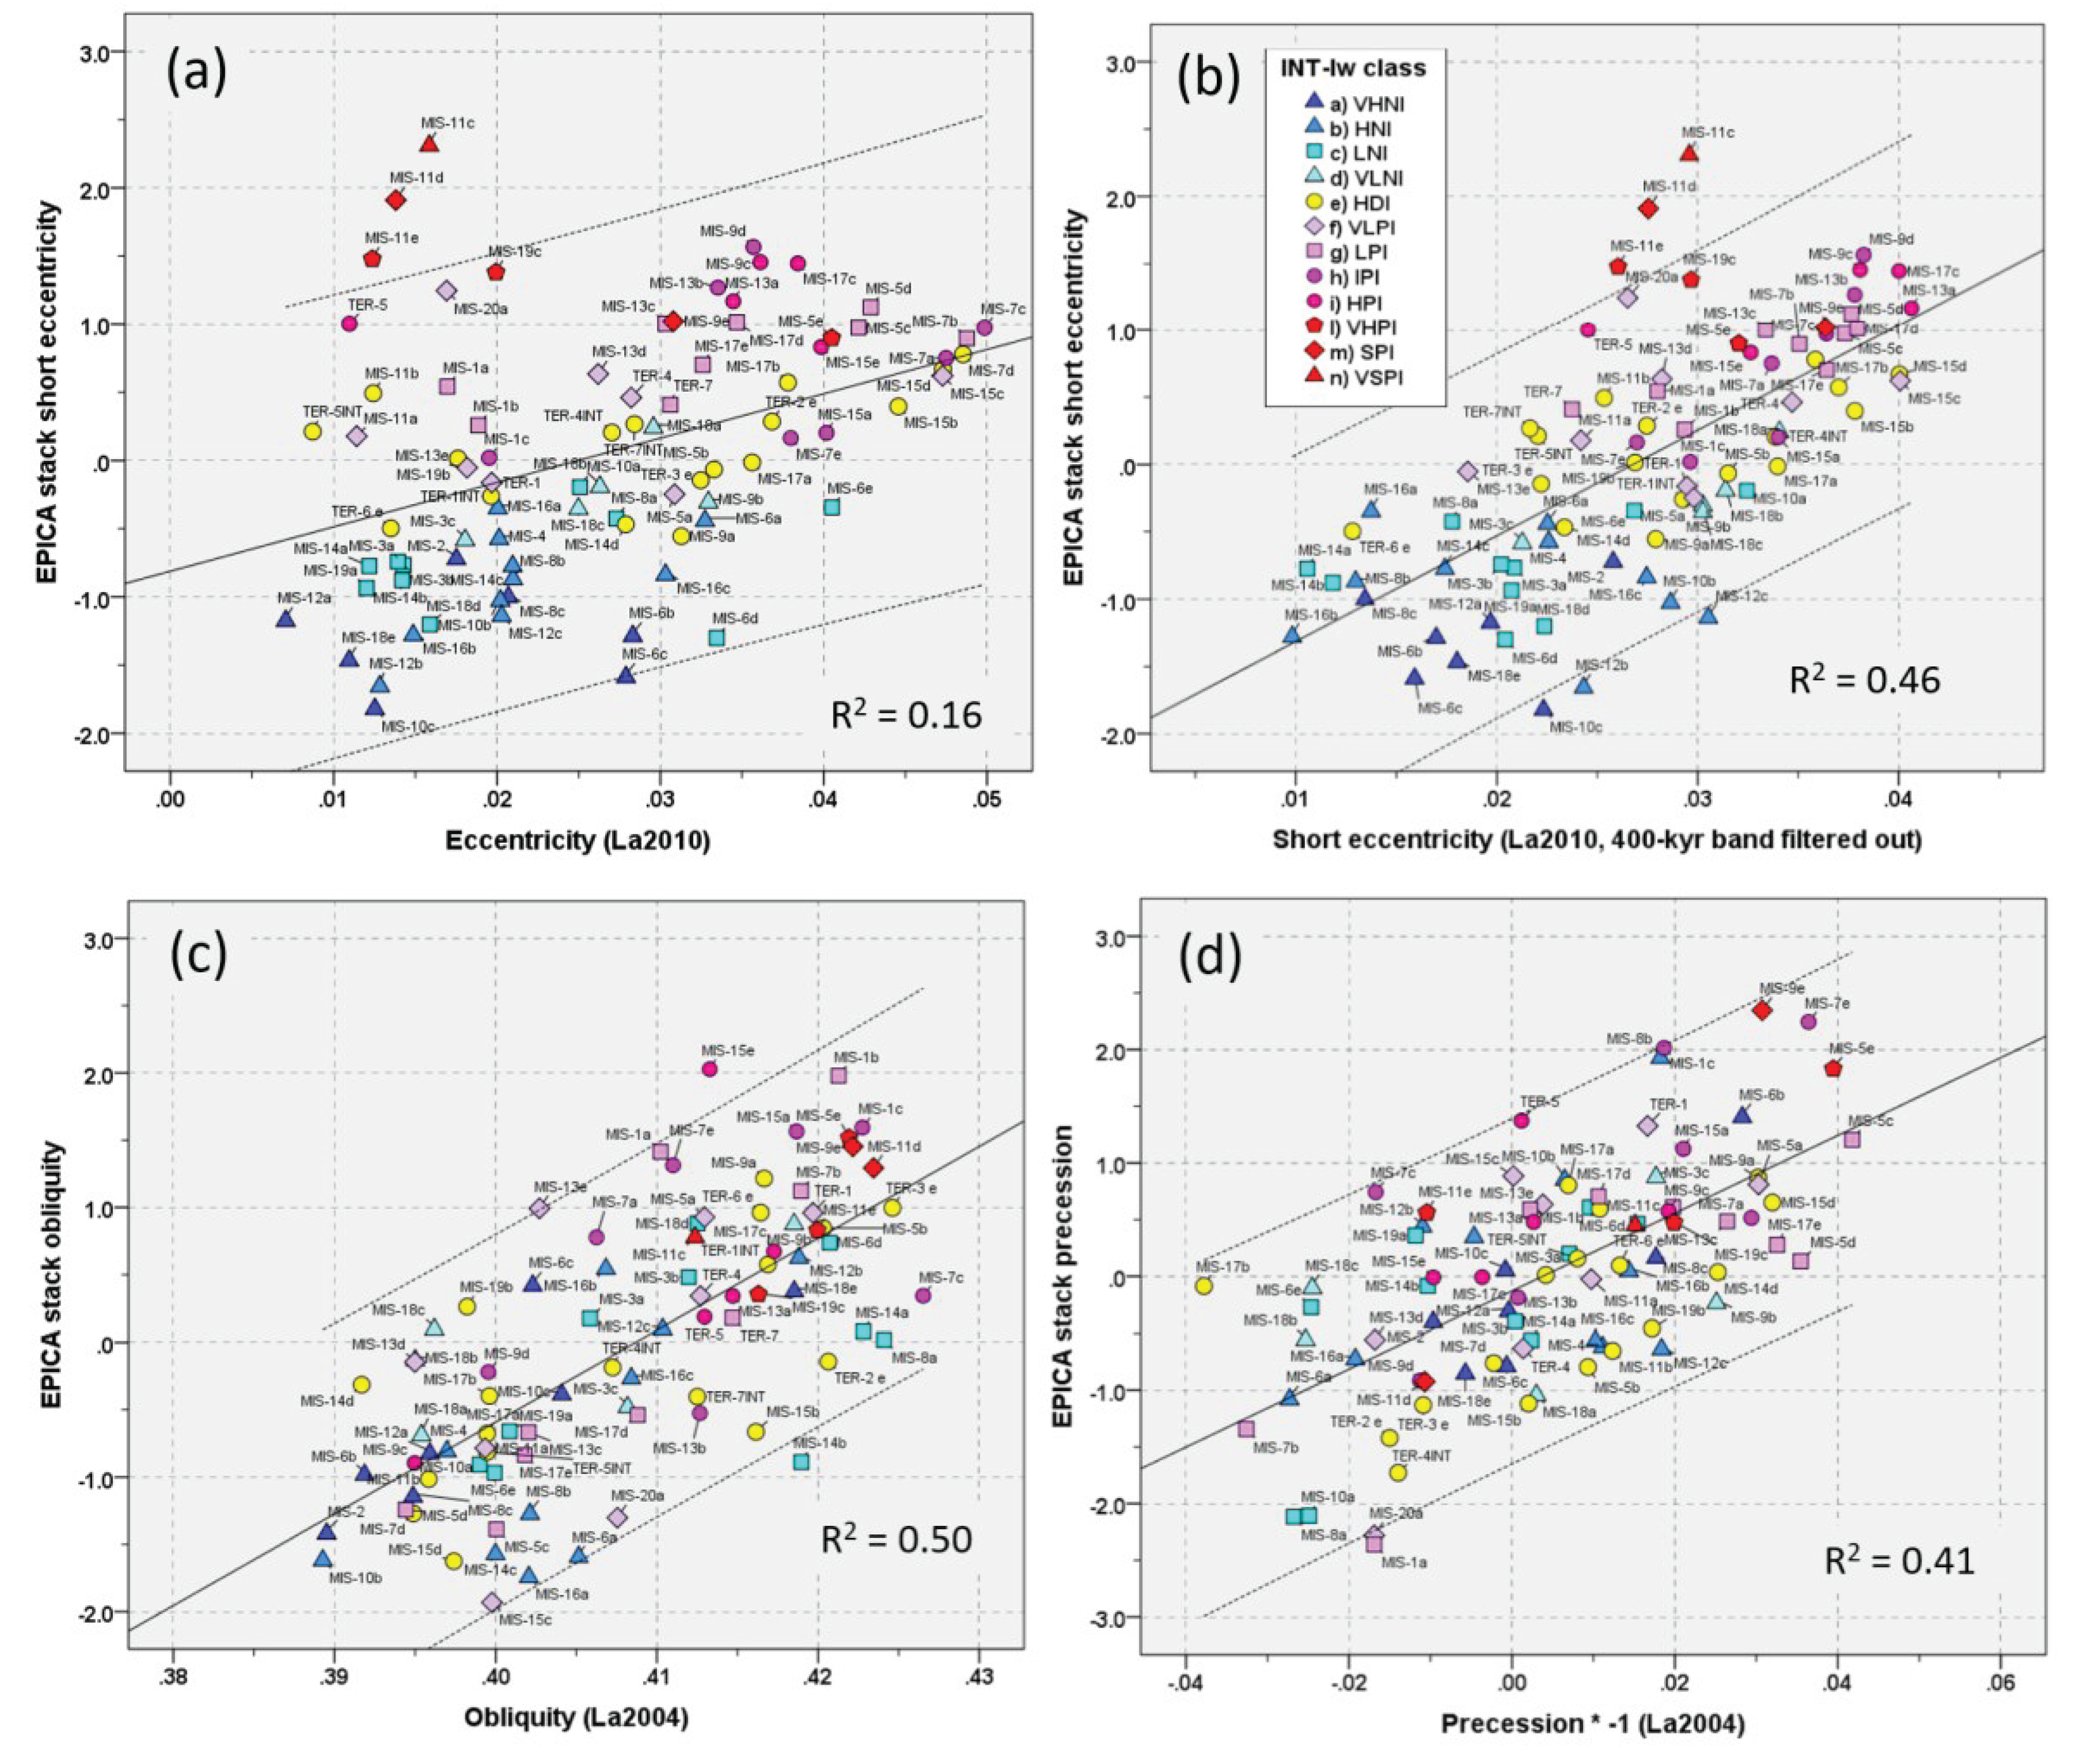
As previously stated, the climate system consists of thermal responses paced by forcings and nonlinear changes through the synergistic action of internal feedback mechanisms which are both climate state-related (initial conditions) and scale-dependent. This was probably because the determination coefficient (R2) between the nominal forcings and the related EPICA thermal responses was low (Figure 14), whereas the spectral cross-coherency relationships were more stable (Table 8). In fact, the cross-coherency was very high (eccentricity/short eccentricity = 0.94; obliquity = 0.98) or fair (precession = 0.67), whereas R2 was low (eccentricity = 0.16; short eccentricity = 0.46; obliquity = 0.50; precession = 0.41). Note the very high coherency of the eccentricity/short eccentricity and the strong difference in R2 between the nominal eccentricity (0.16) and its 400-kyr filtered-out version (0.46).
Assuming a certain margin of error due to the different age models, the phase delay of the EPICA obliquity and precession stacks with respect to nominal forcings (4.2-kyr and ~4.0-kyr, respectively) is in agreement with the putative cause-effect relationship and supports the action of feedback mechanisms that are lagged by definition [8,9,19]. On the other hand, the EPICA short eccentricity stack shows an advance of 4.3‒4.5-kyr, which seems uncredible. Instead, the phase relationships of the short eccentricity within the EPICA records (i.e. with the same age model) are consistent with an inertial climate system affected by feedbacks mechanisms since CO2 and CH4 lags δD [19]. The EPICA ‘anomalous’ result with the eccentricity nominal solution could be an artefact owing to the averaging of the lead-lag phase variability over a small number of short eccentricity peaks (16) during the last 800 kyr, perhaps in relation to possible inaccuracies in the age model and error propagation on long periodicity. Despite this inconsistency in the phase shift of the eccentricity nominal solution, and considering the very high cross-coherency, these data suggest that nominal short eccentricity played a key role in pacing the climate response over the last 800 kyr [8,9,19,24,40,49,74,75]. This is also supported by Figure 14, which shows the distribution of MIS interference classes which appear widely dispersed, especially for obliquity and precession (Figure 14c,d), but with some regularities for the short eccentricity response because of its relevant quantitative impact (MISs of the high positive interference class clustered towards high short eccentricity and viveversa; Figure 14b). On the other hand, the weaker short eccentricity external forcing should not cause any problem if the ~100-kyr response is driven primarily by internal feedbacks which transfer most of the climate system energy [8,9,19,24,40,49,52,74,75]. The absence of a univocal relationship between the strength of the astronomical forcing and the intensity of interglacials [5] can be explained and generalised to all MISs by the interference model, which shows that forcing of the same strength corresponds to MISs of even very different interference classes resulting from the stochastic redistribution of the climate system energy through the physical interference of distinct thermal waves (Figure 14). The EPICA interference model includes the most complete suite of climate forcings in play (midterm, orbitals, and suborbitals, including sun-related cycles), their nonlinear transformations through feedback mechanisms (climate responses), and their envelope by physical interference over time. If we change the interpretative paradigm from a nominal-centric view to the related climate responses (i.e. a response-centric perspective) [9], then the interference model can explain many issues of the Mid-Late Pleistocene climate variability. Climate interference is a cross-cutting theory that represents a quantitative model linking the non-linear responses of climatic components and their stochastic envelopes at a given time.

4. Conclusions

The main conclusions regarding the interference model of the EPICA thermal components are summarised as follows.
1)
The Antarctic stacked records during the last 800 kyr, which approximate global/NH atmospheric temperatures, are described by a variance-weighted interference model of independent thermal waves of different origins (midterm oscillation, orbitals, and suborbitals) that stochastically interfere at a given time according to their relative differences in frequency, intensity, and polarity.
2)
Climate interference over a short-term timescale is a Gaussian stochastic process governed by chance. At the mid-/long-term scale, the stochastic interaction of the responses increasingly deviates from normality and exhibits a multi-modal distribution that reveals patterns of time alignments, suggesting a complex interaction among the components of the climate system.
3)
Interglacial stages resulted from high to very strong (73%) and intermediate (27%) constructive interference of warming responses, and glacial stages derived by high/very high (64%) and low (36%) constructive interference of cooling responses, which are related to global δ18O depletion or enrichment, respectively.
4)
MIS substages are the result of positive (interstadial) or negative (stadial) polarisation of millennial suborbital thermal waves.
5)
Low-intensity MISs, including 90% of substages, fall in low-interference regions where dominant destructive interference minimises the thermal envelope.
6)
The interference model allows the recalibration of the TER ages according to the structural notion of ‘cancellation interference’ of the thermal envelope. For TER-1/4/5/7 dated by the midpoint criterion, unexpected constructive interference leads significantly away from the neutrality region with a relevant positive bias, which is an artefact due to the asymmetry of glacial cycles. Therefore, terminations are most appropriately dated and described by the structural criterion of null interference which is associated with destructive patterns such as TER-2/3/6.
7)
The intensity asymmetry of the EPICA stack record results from the interference process which, in turn, amplifies the bipolar envelope of the nonlinear thermal responses that interfere at a given time with a strong bias in the warming direction (interglacial, 539%), especially after the MBE (803%). This explains the key question of why the post-MBE interglacials appear warmer than the pre-MBE interglacials. However, even the post-MBE glacials appear slightly colder (89%) than the pre-MBE glacials (26%), albeit to a lesser magnitude.
8)
The duration analysis of short eccentricity hemicycles exhibits an unexpected, intrinsic mean time asymmetry (prolonged cooling) in the nominal short eccentricity (5.8 kyr) and its EPICA response (8.6 kyr, 48% variation), as well as an interference-induced asymmetry (21.1 kyr) that amplifies the cooling duration of short eccentricity response by 145%. Thus, the overall effect of the increased temporal cooling resulting in the saw-tooth shape of glacial cycles (from 5.8 kyr to 21.1 kyr, i.e. 264%) is related to the joint action of phase-locked intermediate feedback mechanisms, and especially by the strong amplification of the physical interference process.
9)
The nominal short eccentricity played a key role in pacing the feedback-amplified climate response and its central action in the interference process over the last 800 kyr.

Funding

This research did not receive any funding from funding agencies of the public, commercial, or not-for-profit sectors.

Data Availability Statement

Not applicable.

Acknowledgments

The author is grateful to the anonymous colleague for the useful suggestions and enhancements to the paper.

Conflicts of Interest

The author declare no conflicts of interest.

Abbreviations

EPICA: European Project for Ice Coring in Antarctica; HDI: High Destructive Interference; HNI: High Negative Interference; HPI: High Positive Interference; INT-I: simple interference index; INT-Iw: variance-weighted interference index; IPI: Intermediate Positive Interference; LNI: Low Negative Interference; LPI: Low Positive Interference; MBE: Mid-Brunhes Event; MBO: Mid-Brunhes Oscillation; MIS: Marine Isotope Stage; MPT: Mid-Pleistocene Transition; NH: Northern Hemisphere; NRI: negative response index; PRI: positive response index; R: Response component of the climate system; RI: response index; RIs: smoothed response index; SPI: Strong Positive Interference; SSA: Singular Spectrum Analysis; TER: glacial Termination dated by midpoint; TERINT: glacial Termination dated by ‘cancelation interference’ of thermal responses; VHNI: Very High Negative Interference; VHPI: Very High Positive Interference; VLNI: Very Low Negative Interference; VLPI: Very Low Positive Interference; VSPI: Very Strong Positive Interference.

Notes

1
The ‘mid-term’ component is the most recent portion of the Plio-Pleistocene long-term trend that cannot be documented in the EPICA record [19].

References

  1. Jouzel J. et al., 2007. Orbital and Millennial Antarctic Climate Variability over the Past 800,000 Years. Science Vol. 317, 10 August 2007, pp. 793-796. [CrossRef]
  2. Masson-Delmotte V., et al., 2010. EPICA Dome C record of glacial and interglacial intensities. Quat. Sci. Rev. 29 (2010) 113–128. [CrossRef]
  3. Lang N., Wolff E.W., 2011. Interglacial and glacial variability from the last 800 ka in marine, ice and terrestrial archives. Clim. Past, 7, 361–380, 2011. [CrossRef]
  4. Ellis R., Palmer M., 2016. Modulation of ice ages via precession and dust-albedo feedbacks. Geoscience Frontiers, v. 7 (2016), pp. 891-909. [CrossRef]
  5. Past interglacials working group of PAGES, 2016. Interglacials of the last 800,000 years. Rev. Geophys. 54:162–219. [CrossRef]
  6. Rapp D., 2019. Ice Ages and Interglacials. Measurements, Interpretation, and Models. Springer, Third Edition, pp. 362, ISBN 978-3-030-10465-8. [CrossRef]
  7. IPCC, 2013. Climate Change 2013: The Physical Science Basis. Contribution of Working Group I to the Fifth Assessment Report of the Intergovernmental Panel on Climate Change [Stocker T.F., D. Qin, Plattner G.-K., Tignor M., Allen S.K., Boschung J., Nauels A., Xia Y., Bex V., Midgley P.M. (eds.)]. Cambridge University Press, Cambridge, United Kingdom and New York, NY, USA, 1535 pp.
  8. Viaggi P., 2018. δ18O and SST signal decomposition and dynamic of the Pliocene-Pleistocene climate system: new insights on orbital nonlinear behavior vs. long-term trend. Progress in Earth and Planetary Science, 2018, 5:81, 7 December 2018. 7 December. [CrossRef]
  9. Viaggi P., 2023. Global Evidence of Obliquity Damping in Climate Proxies and Sea-Level Record during the Last 1.2 Ma: A Missing Link for the Mid-Pleistocene Transition. Geosciences 2023, 13(12), 354. [CrossRef]
  10. Clark P.U., Archer D., Pollard D., Blum J.D., Rial J.A., Brovkin V., Mix A.C., Pisias N.G., Roy M., 2006. The middle Pleistocene transition: characteristics, mechanisms, and implications for long-term changes in atmospheric pCO2. Quat. Sci. Rev. [CrossRef]
  11. Lisiecki L.E., Raymo M.E., 2007. Plio–Pleistocene climate evolution; trends and transitions in glacial cycle dynamics. Quat. Sci. Rev. 26(2007):56–69. [CrossRef]
  12. Zachos J.C., Pagani M., Sloan L., Thomas E., Billups K., 2001. Trends, rhythms, and aberrations in global climate 65 Ma to present. Science, Vol. 292, 27 April 2001. 27 April.
  13. Zachos J.C., Dickens G.R., Zeebe R.E., 2008. An early Cenozoic perspective on greenhouse warming and carbon-cycle dynamics. Nature, Vol. 451,17 January 2008. 17 January. [CrossRef]
  14. McClymont E.L., Sosdian S.M., Rosell-Melé A., Rosenthal Y., 2013. Pleistocene sea-surface temperature evolution: Early cooling, delayed glacial intensification, and implications for the mid-Pleistocene climate transition. Earth-Science Reviews, Volume 123, 173-193. [CrossRef]
  15. Kender S., Ravelo A.C., Worne S., Swann G.E.A., Leng M.J., Asahi H., Becker J., Detlef H., Aiello I.W., Andreasen D., Hall I.R., 2018. Closure of the Bering Strait caused Mid-Pleistocene Transition cooling. Nature Commun. (2018) 9:5386. 9. [CrossRef]
  16. Shoenfelt E.M., Winckler G., Lamy F., Anderson R.F., Bostick B.C., 2018. Highly bioavailable dust-borne iron delivered to the Southern Ocean during glacial periods. PNAS, 1-6.
  17. Farmer J.R., Hönisch B., Haynes L.L., Kroon D., Jung S., Ford H.L., Raymo M.E., Jaume-Seguí M., Bell D.B., Goldstein S.L., Pena L.D., Yehudai M., Kim J., 2019. Deep Atlantic Ocean carbon storage and the rise of 100,000-year glacial cycles. Nature Geosci. [CrossRef]
  18. Hasenfratz A.P., Jaccard S.L., Martínez-García A., Sigman D.M., Hodell D.A., Vance D., Bernasconi S.M., Kleiven H.F., Haumann F.A., Haug G.H., 2019. The residence time of Southern Ocean surface waters and the 100,000-year ice age cycle. Sci. 363, 1080-1084 (2019), 1-5. [CrossRef]
  19. Viaggi P., 2021a. Quantitative impact of astronomical and sun-related cycles on the Pleistocene climate system from Antarctica records. Quat. Sci. Adv., Volume 4, October 2021. 20 October. [CrossRef]
  20. Hönisch B., Hemming N.G., Archer D., Siddall M., McManus J.F., 2009. Atmospheric carbon dioxide concentration across the mid-Pleistocene transition. Science 324:1551. [CrossRef]
  21. Seki O., Foster G.L., Schmidt D.N., Mackensen A., Kawamura K., Pancost R.D., 2010. Alkenone and boron-based Pliocene pCO2 records. Earth and Planetary Science Letters, 292 (2010), 201–211. [CrossRef]
  22. Bartoli G., Hönisch B., Zeebe R. E., 2011. Atmospheric CO2 decline during the Pliocene intensification of Northern Hemisphere glaciations, Paleoceanography, 26, PA4213. [CrossRef]
  23. Martinez-Boti M.A., Foster G.L., Chalk T.B., Rohling E.J., Sexton P.F., Lunt D.J., Pancost R.D., Badger M.P.S., Schmidt D.N., 2015. Plio-Pleistocene climate sensitivity evaluated using high-resolution CO2 records. Nature 518. [CrossRef]
  24. Hays J.D., Imbrie J., Shacklton N.J., 1976. Variation in the Earth’s orbit: pacemaker of the ice ages, Science, 194, 1121–1132, 1976.
  25. Imbrie J., Boyle E.A., Clemens S.C., Duffy A., Howard W.R., Kukla G., Kutzbach J., Martinson D.G., Mclntyre A., Mix A.C., Molfino B., Morley J.J., Peterson L.C., Pisias N.G., Prell W.L., Raymo M.E., Shackleton N.J., Toggweiler J.R., 1992. On the Structure and Origin of Major Glaciation Cycles 1. Linear Responses to Milankovitch Forcing. Paleoceanography. Vol. 7, No. 6, pp 701-738, December 1992. 19 December; 6.
  26. Imbrie J., Berger A., Boyle E.A., Clemens S.C., Duffy A., Howard W.R., Kukla G., Kutzbach J., Martinson D.G., Mcintyre A., Mix A.C., Molfino B., Morley J.J., Peterson L.C., Pisias N.G., Prell W.L., Raymo M.E., Shackleton N.J., Toggweile J.R., 1993. On the Structure and Origin of Major Glaciation Cycles 2. The 100,000-Year Cycle. Paleoceanography, Vol. 8, No. 6, pp. 699-735, December 1993. 19 December; 6.
  27. Head M.J., Gibbard P.L., 2005. Early–Middle Pleistocene transitions. An overview and recommendation for the defining boundary. From: Head M.J., Gibbard P.L. (eds). Early–middle Pleistocene transitions: the land–ocean evidence. Geological Society, London, Special Publications, 247, 1–18. 0305–8719/05/$15© The Geological Society of London 2005.
  28. Head M.J., Pillans B., Farquhar S.A., 2008. The Early–Middle Pleistocene Transition: characterization and proposed guide for the defining boundary. Episodes, Vol. 31, no. 2, pp. 255-259, June 2008. 20 June.
  29. Loutre M.F., 2003. Clues from MIS 11 to predict the future climate. A modelling point of view. Earth and Planetary Science Letters 212 (2003) 213-224. [CrossRef]
  30. Berger A., Loutre M.F., 2010. Modeling the 100-kyr glacial–interglacial cycles. Global and Planetary Change 72 (2010) 275–281. [CrossRef]
  31. Berger A., Yin Q.Z., Herold N., 2012. MIS-11 and MIS-19, analogs of our Holocene interglacial. In: 3rd Int. Conf. on Earth Syst. Model., Hamburg. https://meetingorganizer.copernicus.org/3ICESM/3ICESM-11.pdf.
  32. Berger A., Yin Q., 2012. Modeling the lnterglacials of the last 1 Million Years. In: Berger et al. (eds.), Climate Change: Inferences From Paleoclimate and Regional Aspects. Springer-Verlag 2012.
  33. Yin Q.Z., Berger A., 2012. Individual contribution of insolation and CO2 to the interglacial climates of the past 800,000 years. Clim. Dyn. (2012) 38:709–724. [CrossRef]
  34. Verbitsky M.Y., Crucifix M., Volobuev D.M., 2018. A theory of Pleistocene glacial rhythmicity. Earth Syst. Dynam., 9, 1025–1043, 2018. [CrossRef]
  35. Laskar J., Robutel P., Joutel F., Gastineau M., Correia A.C.M., Levrard B., 2004. A long term numerical solution for the insolation quantities of the Earth. Astronomy & Astrophysics, 428, May 23 2004, manuscript no. La2004. 23 May.
  36. Laskar J., Fienga A., Gastineau M., Manche H., 2011. La2010: a new orbital solution for the long-term motion of the Earth. Astronomy & Astrophysics, 532, A89 (2011). [CrossRef]
  37. Broecker W.S., van Donk J., 1970. Insolation changes, ice volumes, and O18 record in deep-sea cores, Rev. Geophys. Space Phys., 8(1), 169–198. [CrossRef]
  38. Viaggi P., 2021b. Evidence of Climate Mitigation Feedbacks by Global Forest Cover Expansion during the Pliocene. Int. J. Environ. Sci. Nat. Res., 2021, 28(5), 1-5. [CrossRef]
  39. Berger A., Loutre M.F., 1997. Long-term variations in insolation and their effects on climate, the LLN experiments. Surveys in Geophysics, 18: 147–161, 1997.
  40. Shackleton N.J., 2000. The 100,000-Year Ice-Age Cycle Identified and Found to Lag Temperature, Carbon Dioxide, and Orbital Eccentricity. Science, Vol. 289, 15 September 2000. 15 September.
  41. Ruddiman W.F., 2003. Orbital insolation, ice volume, and greenhouse gases. Quat. Sci. Rev. 22, 1597–1629.
  42. Archer D., Martin P., Buffett B., Brovkin V., Rahmstorf S. & Ganopolski A., 2004. The importance of ocean temperature to global biogeochemistry. Earth and Planetary Science Letters, 222 (2004), 333–348. [CrossRef]
  43. Rial J.A., Pielke R.A. Sr, Beniston M., Claussen M., Canadell J., Cox P., Held H., deNoblet-Ducoudré N., Prinn R., Reynolds J.F., Salas J.D., 2004. Nonlinearities, feedbacks and critical thresholds within the Earth’s climate system. Clim. Chang. 65(1–2):11–38, 2004.
  44. Brovkin V., Ganopolski A., Archer D., Rahmstorf S., 2007. Lowering of glacial atmospheric CO2 in response to changes in oceanic circulation and marine biogeochemistry. Paleoceanography, 22, PA4202. [CrossRef]
  45. Hansen J., Sato M., Kharecha P., Russell G., Lea D.W., Siddall M., 2007. Climate change and trace gases. Phil. Trans. R. Soc. A (2007) 365, 1925–1954. [CrossRef]
  46. Bintanja R., van de Wal R.S.W., 2008. North American ice-sheet dynamics and the onset of 100,000-year glacial cycles. Nature, Vol 454, 14 August 2008, 869- 872. 14 August. [CrossRef]
  47. Herbert T.D., Peterson L.C., Lawrence K.T., Liu Z., 2010. Tropical ocean temperatures over the past 3.5 million years. Sci. 328:1530–1534. [CrossRef]
  48. Köhler P., Bintanja R., Fischer H., Joos F., Knutti R., Lohmann G., Masson-Delmotte V., 2010. What caused Earth’s temperature variations during the last 800,000 years? Data-based evidence on radiative forcing and constraints on climate sensitivity. Quat. Sci. Reviews 29 (2010) 129–145. [CrossRef]
  49. Lisiecki L.E., 2010. Links between eccentricity forcing and the 100,000-year glacial cycle. Nature Geoscience, vol 3, may 2010, 349-352. [CrossRef]
  50. Hansen J., Sato M., Kharecha P., von Schuckmann K., 2011. Earth’s energy imbalance and implications. Atmos. Chem. Phys. 11:13421–13449. [CrossRef]
  51. Russon T., Elliot M., Sadekov A., Cabioch G., Corrège T., De Deckker P., 2011. The mid‐Pleistocene transition in the subtropical southwest Pacific, Paleoceanography, 26, PA1211. [CrossRef]
  52. Caccamo M.T., Magazù S., 2023. Exponential feedback effects in a parametric resonance climate model. Scientific Reports (2023), 13:22984. [CrossRef]
  53. Luthi D., Le Floch M., Bereiter B., Blunier T., Barnola J.M., Siegenthaler U., Raynaud D., Jouzel J., Fischer H., Kawamura K., Stocker T.F., 2008. High-resolution carbon dioxide concentration record 650,000–800,000 years before present. Nature, Vol 453, 15 May 2008. 15 May. [CrossRef]
  54. Loulergue L., Schilt A., Spahni R., Masson-Delmotte V., Blunier T., Lemieux B., Barnola J.M., Raynaud D., Stocker T.F., Chappellaz J., 2008. Orbital and millennial-scale features of atmospheric CH4 over the past 800,000 years. Nature, Vol 453, 15 May 2008. [CrossRef]
  55. Bereiter B., Eggleston S., Schmitt J., Nehrbass-Ahles C., Stocker TF., Fischer H., Kipfstuhl S., Chappellaz J., 2015. Revision of the EPICA Dome C CO2 record from 800 to 600 kyr before present. Geophys. Res. Lett., 42, 1-8. [CrossRef]
  56. Skinner L.C., Shackleton N.J., 2005. An Atlantic lead over Pacific deep-water change across Termination I: Implications for the application of the marine isotope stage stratigraphy, Quat. Sci. Rev., 24, 571–580. [CrossRef]
  57. Lisiecki L.E., Raymo M.E., 2005. A Pliocene-Pleistocene stack of 57 globally distributed benthic δ18O records. Paleoceanogr. 20:PA1003. [CrossRef]
  58. Bazin L., Landais A., Lemieux-Dudon B., Kele H.T.M., Veres D., Parrenin F., Martinerie P., Ritz C., Capron E., Lipenkov V., et al. An optimized multi-proxy, multi-site Antarctic ice and gas orbital chronology (AICC2012): 120–800 ka. Clim. Past 2013, 9, 1715–1731. [CrossRef]
  59. Bouchet, M., Landais, A., Grisart, A., Parrenin, F., Prié, F., Jacob, R., Fourré, E., Capron, E., Raynaud, D., Lipenkov, V. Y., Loutre, M.-F., Extier, T., Svensson, A., Legrain, E., Martinerie, P., Leuenberger, M., Jiang, W., Ritterbusch, F., Lu, Z.-T., and Yang, G.-M. The Antarctic Ice Core Chronology 2023 (AICC2023) chronological framework and associated timescale for the European Project for Ice Coring in Antarctica (EPICA) Dome C ice core, Clim. Past, 19, 2257–2286. [CrossRef]
  60. Waelbroeck C., Levi C., Duplessy J.-C., Labeyrie L., Michel E., Cortijo E., Bassinot F., Guichard F., 2006. Distant origin of circulation changes in the Indian Ocean during the last deglaciation. Earth Planet. Sci. Lett., 243, 244–251.
  61. Lisiecki L.E., Raymo M.E., 2009. Diachronous benthic δ18O responses during late Pleistocene terminations, Paleoceanography, 24, PA3210. [CrossRef]
  62. Masson-Delmotte V., et al., 2006. Past and future polar amplification of climate change: climate model intercomparisons and ice-core constraints. Climate Dynamics (2006) 26: 513–529. [CrossRef]
  63. Railsback L.B., Gibbard P.L., Head M.J., Voarintsoa N.R.G., Toucanne S., 2015. An optimized scheme of lettered marine isotope substages for the last 1.0 million years, and the climatostratigraphic nature of isotope stages and substages. Quat. Sci. Rev. 111 (2015) 94-106. [CrossRef]
  64. American Commission on Stratigraphic Nomenclature, 1961. Code of stratigraphic nomenclature. Bull. Am. Assoc. Pet. Geol., 5, 645–660.
  65. Shackleton N.J., Opdyke N.D., 1973. Oxygen isotope and palaeomagnetic stratigraphy of Equatorial Pacific core V28-238: Oxygen isotope temperatures and ice volumes on a 105 year and 106 year scale, Quat. Res., 3(1), 39–55. [CrossRef]
  66. Tzedakis P.C., Raynaud D., McManus J. F., Berger A., Brovkin V., Kiefer T., 2009. Interglacial diversity, Nat. Geosci., 2(11), 751–755. [CrossRef]
  67. Cohen K., Gibbard P. (2022). Global chronostratigraphical correlation table for the last 2.7 million years v.2019 (Poster version), Mendeley Data, V5. [CrossRef]
  68. Konijnendijk T.Y.M., Ziegler M., Lourens L.J., 2015. On the timing and forcing mechanisms of late Pleistocene glacial terminations: Insights from a new high- resolution benthic stable oxygen isotope record of the eastern Mediterranean. Quat. Sci. Rev., 129 (2015), 308-320. [CrossRef]
  69. Britannica, The Editors of Encyclopaedia, 2023. "Interference". Encyclopedia Britannica, Accessed 10 June 2023. https://www.britannica.com/science/interference-physics. 10 June.
  70. Tziperman E., Raymo M.E., Huybers P.J., Wunsch C., 2006. Consequences of pacing the Pleistocene 100 kyr ice ages by nonlinear phase locking to Milankovitch forcing. Paleoceanography, Vol. 21, (PA4206): 1-11. Paleoceanography. [CrossRef]
  71. Benzi R., Parisi G., Sutera A., Vulpiani A., 1982 Stochastic resonance in climatic change. Tellus 34, 10–16. [CrossRef]
  72. Wunsch C., 2004. Quantitative estimate of the Milankovitch-forced contribution to observed Quaternary climate change. Quaternary Science Reviews, 23, (2004), pp. 1001–1012. [CrossRef]
  73. Berger A., Mélice J. L., Loutre M. F., 2005. On the origin of the 100-kyr cycles in the astronomical forcing, Paleoceanography, 20, PA4019. [CrossRef]
  74. Rial J.A., 1999. Pacemaking the Ice Ages by frequency modulation of Earth's orbital eccentricity. Science 285, 564–568.
  75. Liu Z., Cleaveland L.C., Herbert T.D., 2008. Early onset and origin of 100-kyr cycles in Pleistocene tropical SST records. Earth and Planetary Science Letters 265 (2008), 703–715. [CrossRef]
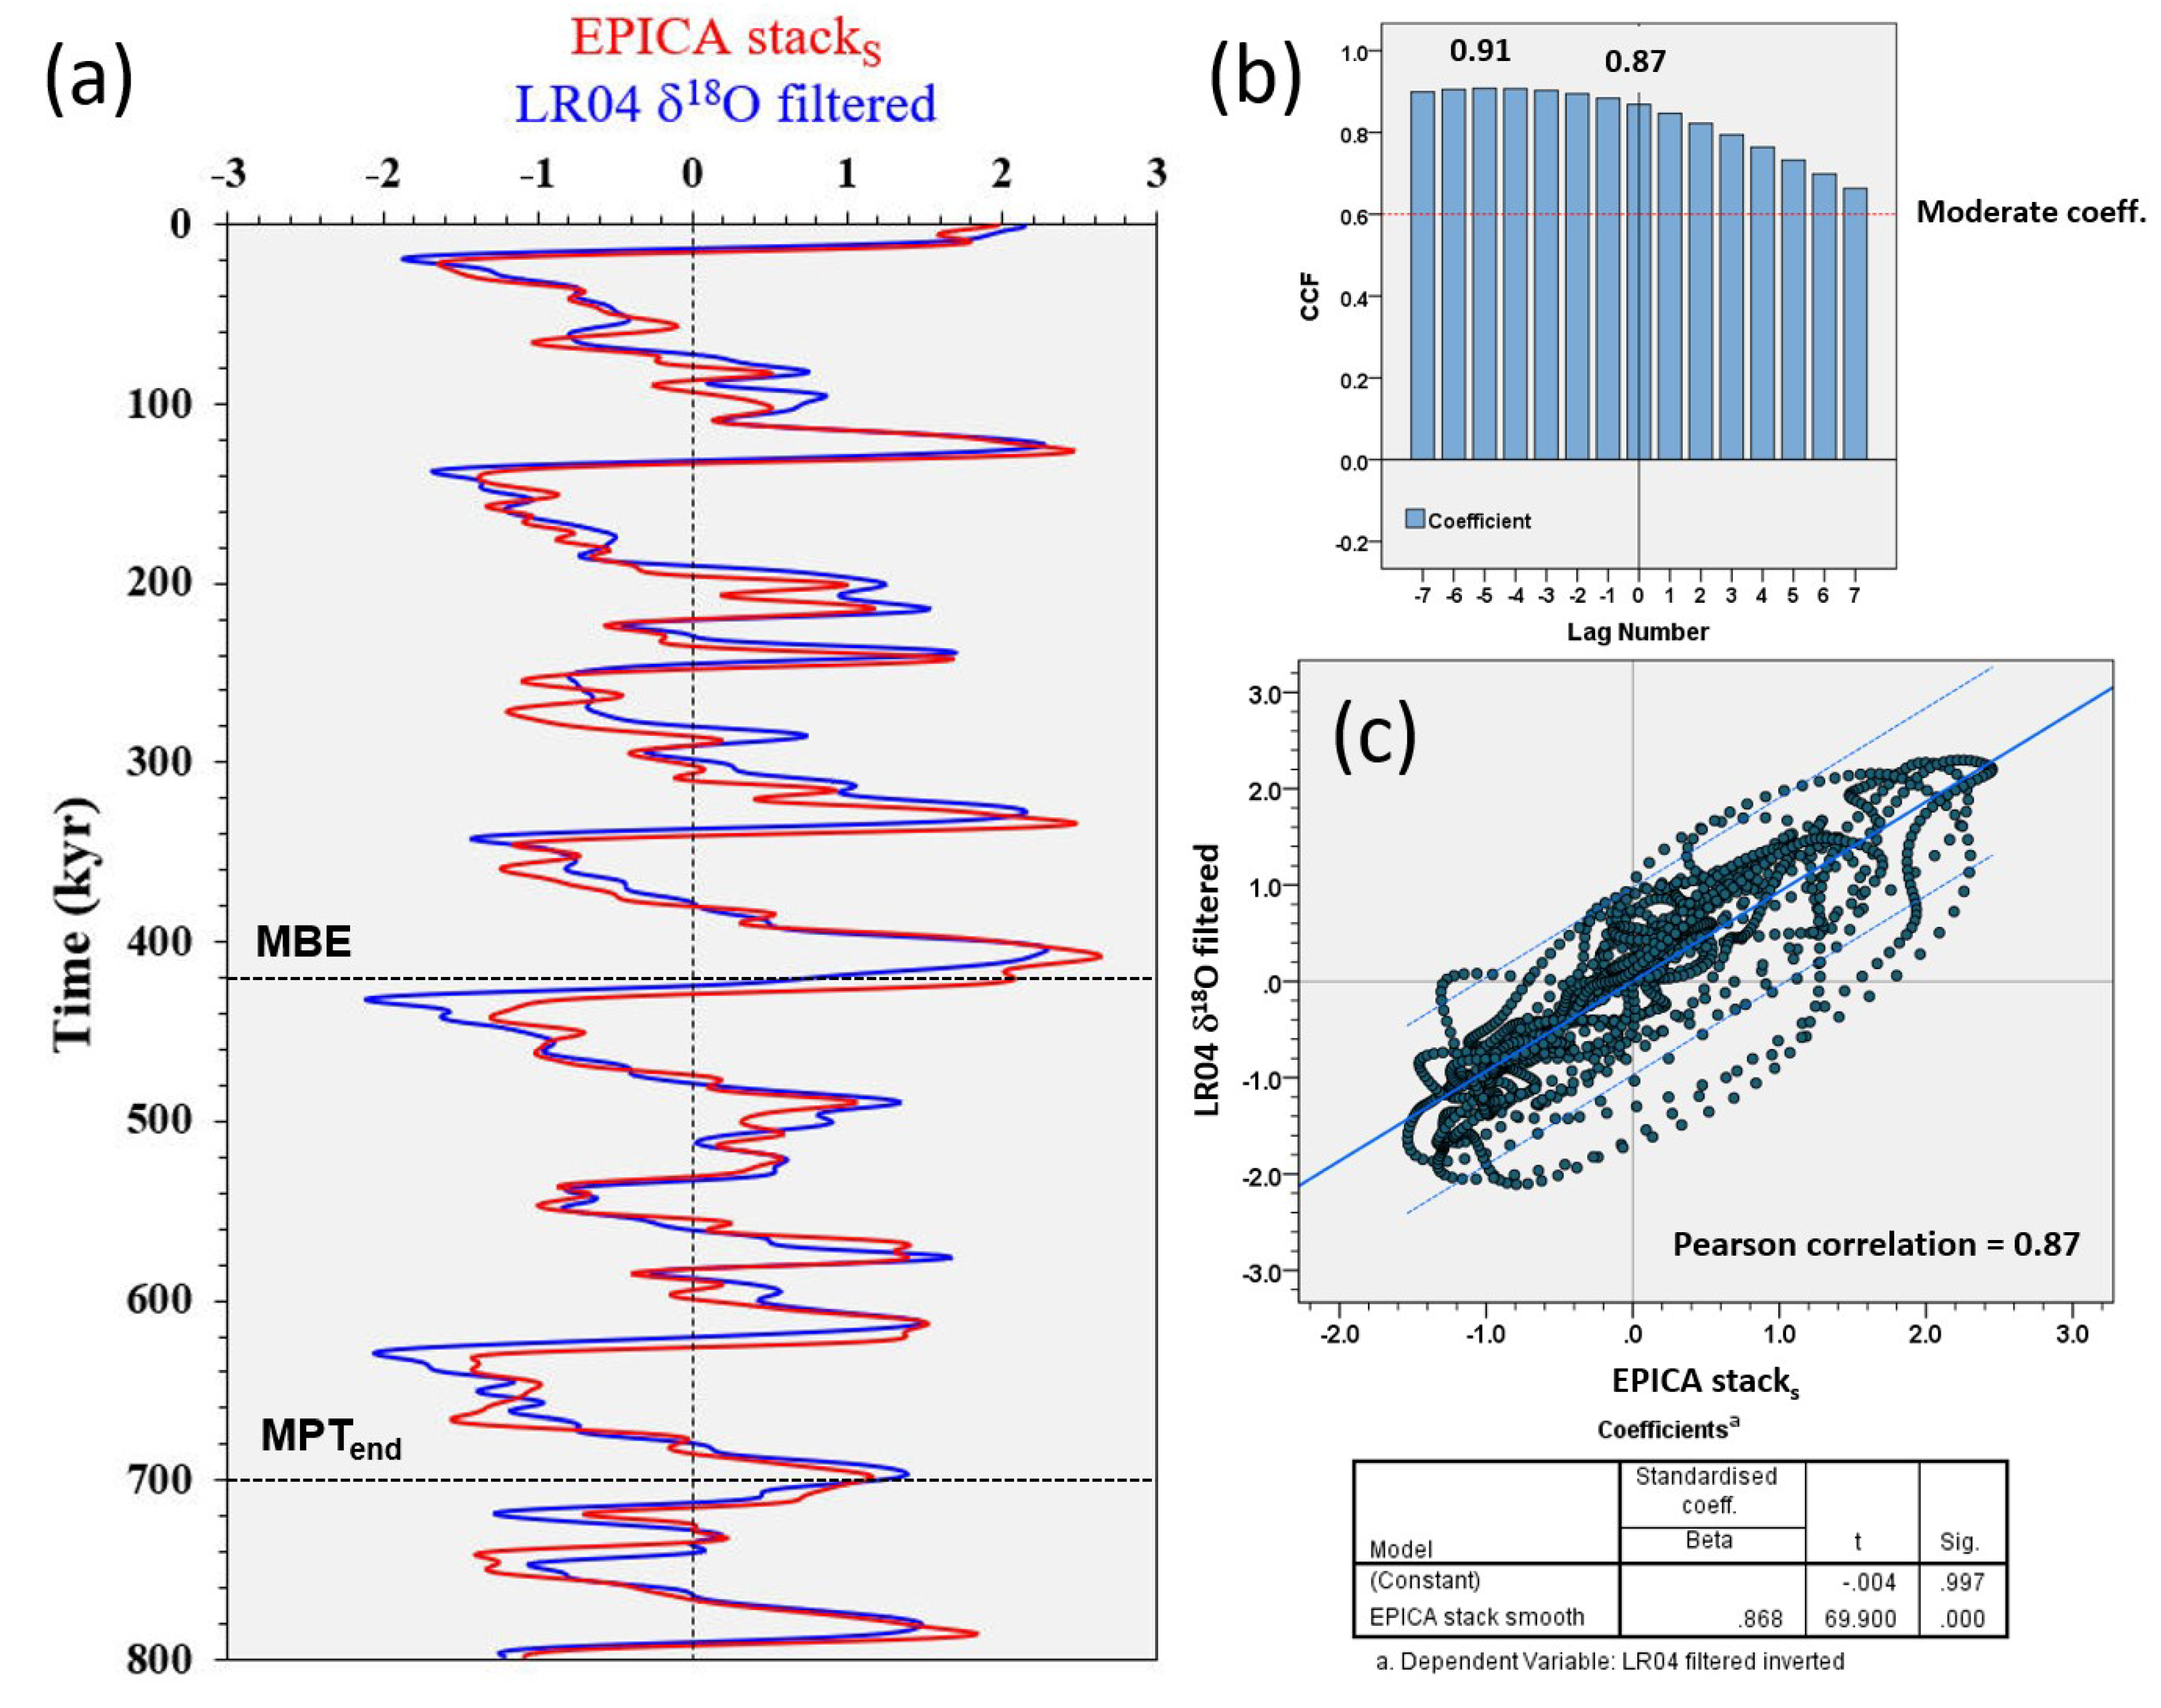
Figure 1. (a) Time series of the superposed SSA-filtered EPICA stacks (red line, [19]) and global benthic δ18O stack (blue line, [57]) that is SSA-filtered [8]. Time series are standardised (0-mean, 1-SD) and the δ18O inverted. (b) Cross-correlation analysis. CCF has the highest Pearson coefficient (0.91) at –5 lag number, equivalent to a δ18O ‘bulk’ lags of 2.5 kyr. The Pearson correlation at 0-lag is 0.87. (c) Cross-plot of the linear correlation (r = 0.87) between LR04 and EPICA stacks with 95% confidence intervals (light blue lines) and significance test of the correlation coefficient (t = 69.9; Sig. = 0.000). MPT = Mid-Pleistocene Transition; MBE = Mid-Brunhes Event. Figure is from [9].
Preprints 101426 g001
Figure 2. Correlation panel between (a) LR04 δ18O SSA-filtered record [8,57] and (b) EPICA stack/stacks [19]. (c) Original MISs nomenclature from Railsback et al. [63]. MIS nomenclature slightly modified (colored labels) for the purposes of the present study. Red label: MIS recognisable in EPICA stack and barely visible on LR04 (1b, 1c, 11d, 11e, 14d). Purple label: new informal MIS recognisable both in EPICA stack and LR04 (13b, 13c). Blue label: renamed MIS (13d, 13e). TER: glacial termination. Vertical dashed lines: records mean.
Preprints 101426 g002
Figure 3. Correlation panel among the ten EPICA stack (a) variance-weighted and (b) unweighted components of different origin, frequencies and strength compared with EPICA stack and INT-I records. Positive values of the stack components indicate warming climate polarity and vice versa. The EPICA INT-Iw (a) and INT-I (b) (blue lines) are the variance-weighted and unweighted vector sum, respectively, of the ten zero-mean stack components (light blue and black lines). The values of INT-I are multiplied by 10 to obtain a graphic scale comparable to that of INT-Iw. A simple (unweighted) interference model of the climate components fails to describe the envelope of the thermal response of EPICA stack.
Preprints 101426 g003
Figure 4. Cross-plots of the EPICA stack record vs. (a) weighted INT-Iw (R2 = 0.87), (b) unweighted INT-I (R2 = 0.61) and corresponding goodness-of-fit statistics. Chromatic scale: LR04 δ18O filtered (standardised and inverted). The INT-Iw is a good approximation of the EPICA stack record, which is related to the global δ18O. N = 1597.
Preprints 101426 g004
Figure 5. Histograms comparison among (a) EPICA stack, (b) EPICA INT-Iw (variance-weighted) and (c) EPICA INT-I (unweighted) with normal distribution curve (black line) for the last 800 kyr. The frequency distribution of the INT-Iw is very similar to that of EPICA stack, while the INT-I shows a very different pattern. The findings suggest that a weighted interference model better describes the final response of the climate system. A noteworthy feature is the strong positive asymmetry (warming) and the ‘truncation’ of negative tails (cooling) of both EPICA stack and INT-Iw. N = 1597.
Preprints 101426 g005
Figure 6. Equal 20-width segmentation of EPICA INT-Iw for the last 800 kyr. (a) Time series, (b) interference classes and (c) box plot. ‘Positive’ or ‘negative’ interference is referred to the absolute intensity (from very low to very strong) of the resulting warming or cooling thermal wave, respectively.
Preprints 101426 g006
Figure 7. Recalibration of termination (TER) ages according to the EPICA INT-Iw near-0 value (TERINT) compared with the midpoint criterion (yellow). MIS termination boundaries are in grey. Blue-red chromatic scale is related to the INT-Iw magnitude. TER-2/3/6 share common dating and structural context. For TER-1/4/5/7, the midpoint interference intensity experiences an unexpected positive bias.
Preprints 101426 g007
Figure 8. EPICA stack interference model featured by weighted interference index (INT-Iw) and response indices (RI; RIs). The INT-Iw measures the intensity of the resulting thermal wave. RIs measure the alignment by time of the thermal components regardless of their intensity. Dashed vertical lines mark the 0-mean.
Preprints 101426 g008
Figure 9. Histograms (N = 1597) with normal distribution curve (blue line) (left) and Q-Q normality plots (right) of EPICA RI and its smoothed versions for the last 800 kyr. RI shows quasi-normal distribution attested by the shape of the histogram and the high linearity of the Q-Q normality plot. Maximum probability occurs for RI = 0, which means a 50% chance of warming and cooling alignments by time. On the contrary, at the mid-term/long-term scale, the stochastic interactions among components increasingly deviate from normality.
Preprints 101426 g009
Figure 10. EPICA interference heat map of the MIS dataset (87 cases) sorted by INT-Iw class and INT-Iw. MIS category of glacial/interglacial stages highlighted in blue/red, respectively, and TERs in yellow. Blue/red chromatic scale related to the INT-Iw magnitude. Light blue/fuchsia chromatic scale related to the RIs. AICC2012 age model.
Preprints 101426 g010
Figure 11. (a–b) Cross-plots of EPICA stack vs. INT-Iw of 73 MISs and 7 TERs (14 cases dated by midpoint and near-0 criteria). Symbol shape by (a) MIS/TER and (b) constructive/destructive interference. Color superposition by INT-Iw class and symbol diameter proportional to LR04 δ18O filtered [8]. (c-d) Cumulative distribution bars within interference classes by (c) interference type and (d) RI. (e–f) Cumulative distribution bars within suborbital RI by (e) MIS rank and (f) MIS category.
Preprints 101426 g011
Figure 12. Comparison of histograms with normal distribution curve (black line) among EPICA cyclical stack components (weighted) for the last 800 kyr (N = 1597).
Preprints 101426 g012
Figure 13. Panel of EPICA stack records and interference model (RIs and INT-Iw), and the influence on intensity asymmetry. The INT-Iw (1+n) develops the INT-Iw by progressively adding weighted climate components according to their relative strength in descending order. Interference acts on the structural framework of the dominant short eccentricity response mainly in terms of bipolar intensity amplification, with a bias in the warming direction explaining EPICA stack positive skewness. Green dotted lines mark on the maxima the cycles of EPICA stack short eccentricity numbered from 1st to 8th. 1: EPICA stack short eccentricity (51.6%); 2: EPICA stack obliquity (19%); 3: EPICA stack precession (8.4%); 4: EPICA stack mid-term (4.4%); 5: EPICA stack obliquity modulation cycle (4%); 6: EPICA stack half-precession (3.8%); 7: EPICA stack sun-6.0 (2.6%); 8: EPICA stack sun-9.7 (1.8%); 9: EPICA stack unclear-3.7 (0.63%); W: weak amplification A: amplification; AA: robust amplification; AAA: strong amplification; AAAA: very strong amplification; DD: robust damping; MBE = Mid-Brunhes Event; MPT = Mid-Pleistocene transition. Dashed vertical lines mark the 0-mean. EPICA components from [19].
Preprints 101426 g013
Figure 14. Cross-plots of EPICA stack components [19] vs. orbital nominal solutions (eccentricity La2010, [36]; obliquity and precession La2004, [35]) of 73 MISs and 7 TERs (14 cases dated by midpoint and near-0 criteria). Determination coefficients R2: (a) eccentricity = 0.16. (b) short eccentricity = 0.46. (c) obliquity = 0.50. (d) precession = 0.41. Dashed bands are 95% confidence intervals. Color superposition by INT-Iw class. Nominal short eccentricity (La2010) from wavelet filtering (400-kyr band filtered out). Nominal precession inverted to align the climate polarity. Nominal solutions resampled at 0.5-kyr. Records are with their own time scale.
Preprints 101426 g014
Table 1. Termination ages (kyr) according to the literature and the present study.
Termination Glacial MIS Integlacial MIS LR041 LR042 𝛅18O eastern Mediterranean2 EPICA stack (midpoint)3
TER-1 MIS-2 MIS-1a 14 16 17.3 13.3 (13.5)
TER-2 MIS-6a MIS-5e 130 134 134.4 134.5
TER-3 MIS-8a MIS-7e 243 244 244.4 248.8 (249)
TER-4 MIS-10a MIS-9e 337 336 338.4 340
TER-5 MIS-12a MIS-11c 424 429 427.1 424
TER-6 MIS-14a MIS-13e 533 534 - 529.8 (530)
TER-7 MIS-16a MIS-15e 621 624 629.1 624.5
1 Lisiecki and Raymo [57], ratified by the International Commission on Stratigraphy [67]. 2 Konijnendijk et al. [68]. 3 This study by midpoint criterion (in brackets the approximated age for the data acquisition at 0.5-kyr resampled time-series) [19] based on the AICC2012 age model [5,58].
Table 2. Reconstruction of the EPICA stack record by multiple linear regression model of the weighted components. Goodness-of-fit statistics: R2 = 0.97; Std. err. = 0.18; F = 4528; Sig. = 0.000.
Component Variable B Std. error t Sig.
Constant 6.263E-08 0.0044 0.00 1.000
EPICA stack mid-term (4.4 × RMT) 0.0289 0.0012 24.28 0.000
EPICA stack obliquity mod. (4 × ROM) 0.0450 0.0012 38.64 0.000
EPICA stack short ecc. (51.6 × RSE) 0.0133 0.0001 152.20 0.000
EPICA stack obliquity (19 × ROB) 0.0220 0.0002 88.60 0.000
EPICA stack prec. (8.4 × RPR) 0.0317 0.0006 53.42 0.000
EPICA stack half prec. (3.8 × RHP) 0.0398 0.0015 26.84 0.000
EPICA stack sun-9.7 (1.8 × RS9.7) 0.0546 0.0037 14.86 0.000
EPICA stack sun-6.0 (2.6 × RS6.0) 0.0488 0.0023 21.15 0.000
EPICA stack unclear-3.7 (0.63 × RUC3.7) 0.1056 0.0099 10.70 0.000
EPICA stack sun-2.5 (0.12 × RS2.5) 0.1615 0.0518 3.12 0.002
Table 3. Termination (TER) ages according to the literature and the present study (EPICA midpoint and INT-Iw near-0 criteria; AICC2012 age model). TER recalibration was performed according to the structural notion of the ‘cancellation interference’ of thermal responses between glacial and interglacial peaks (INT-Iw near-0 value). For some TERs (TER-1/4/5/7) the midpoint interference intensity experience a strong positive bias.
Termination Glacial MIS Integlacial MIS LR041 (kyr) LR042 (kyr) 𝛅18O eastern Mediterranean2 (kyr) EPICA (midpoint)3 (kyr) INT-Iw (midpoint)3 (kyr) EPICA (near-0)4 (kyr) INT-Iw (near-0)4
TER-1 MIS-2 MIS-1a 14.0 16.0 17.3 13.3 (13.5) 21.2 15 2.4
TER-2 MIS-6a MIS-5e 130.0 134.0 134.4 134.5 ‒4.4 134.5 ‒4.4
TER-3 MIS-8a MIS-7e 243.0 244.0 244.4 248.8 (249) 0.4 249 0.4
TER-4 MIS-10a MIS-9e 337.0 336.0 338.4 340 24.8 342 ‒1.6
TER-5 MIS-12a MIS-11c 424.0 429.0 427.1 424 81.2 429.5 ‒0.2
TER-6 MIS-14a MIS-13e 533.0 534.0 - 529.8 (530) 0.7 530 0.7
TER-7 MIS-16a MIS-15e 621.0 624.0 629.1 624.5 34.5 626.5 0.5
1 Lisiecki and Raymo [57], ratified by the International Commission on Stratigraphy [67]. 2 Konijnendijk et al. [68]. 3 This study by midpoint criterion (in brackets the approximated age for the data acquisition at 0.5-kyr resampled time-series). 4 This study by near-0 interference index criterion.
Table 4. Asymmetry statistics of EPICA stack, INT-Iw and weighted components (N = 1597).
Signal Skewness Minimum Maximum
EPICA stack 0.56 ‒1.6 2.8
EPICA INT-Iw 0.35 ‒95.4 152.3
EPICA stack obliquity modulation 0.01 ‒6.8 6.9
EPICA stack short eccentricity 0.08 ‒100.9 119.2
EPICA stack obliquity 0.05 ‒38.3 38.6
EPICA stack precession ‒0.07 ‒20.7 20.7
EPICA stack half-precession 0.03 ‒9.3 9.4
EPICA stack sun-9.7 0.05 ‒4.8 4.9
EPICA stack sun-6.0 0.02 ‒6.6 7.2
EPICA stack unclear-3.7 0.01 ‒2.1 1.9
EPICA stack sun-2.5 0.01 ‒0.4 0.4
Table 5. Asymmetry statistics (N = 1597) of different versions of the INT-Iw as progressive summation of weighted components by descending strength (m = 1 to n = 9).
Interference index Skewness Minimum Maximum
INT-Iw (1) 0.08 ‒100.9 119.2
INT-Iw Σ (m=1;n=2) 0.23 ‒103.7 139.7
INT-Iw Σ (m=1;n=3) 0.27 ‒101.8 137.7
INT-Iw Σ (m=1;n=4) 0.32 ‒95.8 144.5
INT-Iw Σ (m=1;n=5) 0.34 ‒93.3 149.2
INT-Iw Σ (m=1;n=6) 0.35 ‒94.5 152.4
INT-Iw Σ (m=1;n=7) 0.35 ‒94.5 152.1
INT-Iw Σ (m=1;n=8) 0.35 ‒95.4 152.3
INT-Iw Σ (m=1;n=9) 0.35 ‒95.4 152.3
INT-Iw 0.35 ‒95.4 152.3
1: EPICA stack short eccentricity (51.6%); 2: EPICA stack obliquity (19%); 3: EPICA stack precession (8.4%); 4: EPICA stack mid-term (4.4%); 5: EPICA stack obliquity modulation cycle (4%); 6: EPICA stack half-precession (3.8%); 7: EPICA stack sun-6.0 (2.6%); 8: EPICA stack sun-9.7 (1.8%); 9: EPICA stack unclear-3.7 (0.63%). EPICA components from [19].
Table 6. Quantitative effect of the interference on the structural framework of the EPICA short eccentricity response (51.6%) for the main glacial/interglacial MISs of the last 800 kyr (AICC2012 age model), and average variations (%) compared to pre- and post-MBE intervals by MIS polarity. W: weak amplification A: amplification; AA: robust amplification; AAA: strong amplification; AAAA: very strong amplification; DD: robust damping.
MIS Age (kyr) EPICA short ecc. stackw EPICA INT-Iw Variation (%)1 Amplification/Damping1 Polarity Interference class Interference type
MIS-1a 0.5 28.0 47.6 70 AA Interglacial LPI Constructive
MIS-1c 10.5 1.0 53.9 5290 AAAA Interglacial IPI Constructive
MIS-2 26.0 ‒37.2 ‒74.6 101 AA Glacial VHNI Constructive
MIS-4 63.5 ‒29.7 ‒58.4 97 AA Glacial HNI Constructive
MIS-5e 128.0 46.4 106.5 130 AA Interglacial VHPI Constructive
MIS-6a 141.0 ‒22.8 ‒62.0 172 AA Glacial HNI Constructive
MIS-6c 157.0 ‒82.0 ‒87.5 7 W Glacial VHNI Constructive
MIS-7a 201.0 38.8 67.1 73 AA Interglacial IPI Constructive
MIS-7c 213.5 50.3 65.2 30 A Interglacial IPI Constructive
MIS-7d 226.0 40.3 4.5 ‒89 DD Glacial HDI Destructive
MIS-7e 243.0 8.5 66.1 678 AAA Interglacial IPI Constructive
MIS-8a 254.5 ‒22.0 ‒42.6 94 AA Glacial LNI Constructive
MIS-8c 269.0 ‒51.6 ‒79.0 53 A Glacial VHNI Constructive
MIS-9e 335.0 52.7 117.1 122 AA Interglacial SPI Constructive
MIS-10a 345.0 ‒10.0 ‒46.9 369 AAA Glacial LNI Constructive
MIS-10c 360.5 ‒94.0 ‒94.5 1 W Glacial VHNI Constructive
MIS-11c 407.5 119.1 152.3 28 A Interglacial VSPI Constructive
MBE 430.0 - - - - - - -
MIS-12a 440.5 ‒60.7 ‒74.5 23 A Glacial VHNI Constructive
MIS-12c 463.0 ‒58.8 ‒67.5 15 A Glacial HNI Constructive
MIS-13a 490.0 60.3 76.9 28 A Interglacial HPI Constructive
MIS-14a 536.0 ‒39.9 ‒47.1 18 A Glacial LNI Constructive
MIS-14c 549.5 ‒39.9 ‒67.9 70 AA Glacial HNI Constructive
MIS-15a 574.5 10.4 54.7 426 AAA Interglacial IPI Constructive
MIS-15b 583.5 20.5 ‒4.3 ‒121 DD Glacial HDI Destructive
MIS-15e 615.0 43.0 79.1 84 AA Interglacial HPI Constructive
MIS-16a 634.0 ‒18.0 ‒61.4 241 AAA Glacial HNI Constructive
MIS-16c 667.0 ‒43.3 ‒69.2 60 A Glacial HNI Constructive
MIS-17c 698.5 74.6 85.6 15 A Interglacial HPI Constructive
MIS-18e 740.5 ‒75.7 ‒79.8 5 W Glacial VHNI Constructive
MIS-19c 787.5 71.2 94.5 33 A Interglacial VHPI Constructive
MIS-20a 797.5 64.3 16.1 ‒75 DD Glacial VLPI Destructive
Mean of variation (%):
Glacials 58
Interglacials 539
Pre-MBE interglacials 117
Post-MBE interglacials 803
Pre-MBE glacials 26
Post-MBE glacials 89
1 INT-Iw vs. EPICA short eccentricity stack weighted.
Table 7. Analysis of the time asymmetry (kyr) of eight short eccentricity cycles defined on maxima of the EPICA stack component [19] and eccentricity nominal solution [36], compared with the structurally equivalent cycles of the EPICA INT-Iw (Figure 13). The maximum of the 1st cycle of the EPICA short eccentricity stack not yet reached at the present time was estimated with an autoregressive linear forecast algorithm at ‒4.5 kyr in the future time. Positive time asymmetry (cool minus warm durations) indicates prolonged cooling. EPICA original data and AICC2012 age model from [5]. EPICA stacked components from [19].
Eccentricity (La2010) EPICA stackw (short eccentricity) EPICA INT-Iw
100-kyr cycle Max Min Cooling duration Warming duration Max Min Cooling duration Warming duration Max Min Cooling duration Warming duration
1st 14.0 43.5 71.5 29.5 ‒4.5 33.0 83.5 37.5 10.0 26.0 101.5 16.0
2nd 115.0 154.5 61.5 39.5 116.5 160.0 52.5 43.5 127.5 157.0 56.5 29.5
3rd 216.0 267.5 43.5 51.5 212.5 274.0 49.5 61.5 213.5 270.0 64.5 56.5
4th 311.0 373.0 32.0 62.0 323.5 365.0 43.5 41.5 334.5 361.0 46.5 26.5
5th 405.0 438.0 54.5 33.0 408.5 451.0 46.5 42.5 407.5 445.0 45.0 37.5
6th 492.5 534.5 61.5 42.0 497.5 543.0 66.5 45.5 490.0 549.0 63.5 59.0
7th 596.0 644.0 48.5 48.0 609.5 654.0 44.5 44.5 612.5 641.0 57.5 28.5
8th 692.5 748.0 34.0 55.5 698.5 745.0 45.5 46.5 698.5 749.0 38.0 50.5
9th 782.0 - - - 790.5 - - - 787.0 - - -
Mean 50.9 45.1 54.0 45.4 59.1 38.0
SD 14.0 11.2 14.0 7.1 19.5 15.7
Time asymmetry (cool minus warm) 5.8 8.6 21.1
Prolonged cooling: 48%1 145%2
264%1
1vs. nominal ecc. 2vs. EPICA short ecc.
Table 8. Data of cross-spectral analysis (Hann window) among nominal forcings (eccentricity La2010, [36]; obliquity, precession La2004, [35]) and related EPICA stacks [19] for the last 800 kyr. Nominal precession inverted to align the climate polarity. Records rescaled in the range ‒1 to 1. Uniform sampling interval at 0.5 kyr. Negative phase values indicate that the signal lags forcing.
Forcing EPICA signal Cross-spectrum freq. (kyr-1) Cross-spectrum period (kyr) Coherency Phase shift (Deg, kyr)
Eccentricity Short ecc. stack 0.01125 88.9 0.94 17.4 4.30 EPICA signal leads
Short eccentricity1 Short ecc. stack 0.01125 88.9 0.94 18.3 4.52 EPICA signal leads
Obliquity Obliquity stack 0.025 40.0 0.98 ‒37.9 ‒4.21 EPICA signal lags
Precession Precession stack 0.0425 23.5 0.67 ‒60.8 ‒3.97 EPICA signal lags
1400-kyr band filtered out by wavelet analysis.
Disclaimer/Publisher’s Note: The statements, opinions and data contained in all publications are solely those of the individual author(s) and contributor(s) and not of MDPI and/or the editor(s). MDPI and/or the editor(s) disclaim responsibility for any injury to people or property resulting from any ideas, methods, instructions or products referred to in the content.
Copyright: This open access article is published under a Creative Commons CC BY 4.0 license, which permit the free download, distribution, and reuse, provided that the author and preprint are cited in any reuse.
Prerpints.org logo

Preprints.org is a free preprint server supported by MDPI in Basel, Switzerland.

Subscribe

© 2024 MDPI (Basel, Switzerland) unless otherwise stated