1. Introduction
AIN, a multisystem disorder that influences psychological and neurological processes resulting in discomfort by evoking a maladaptive behavior reinforced by inadequate treatment and misuse of medication [
1]. Pain due to activation of afferent nerve fibers in response to noxious thermal, chemical, or mechanical stimuli with potential to cause threatening damage to non-neural tissue is characterized as Nociceptive pain [
2,
3] and can be induced by multiple approaches some of which includes Peltier device, Cold Pressor Test and pin prick [
4,
5,
6,
7].
The interaction between pain and cognitive processes, notably attention, has gained increasing interest. Pain serves as an alarming signal and indicates an inverse relationship with stimulus related to cognitive response [
8]. Within the psychosocial context, the cognitive component of pain, represents the integration of different components, including attention, working memory, anticipation, short term and long term [
9]. It has been reported in a meta-analysis that in healthy individuals, laboratory (experimentally) induced pain degrades performance of attention demanding tasks by directing it towards pain location [
10,
11,
12]. The attention-grabbing nature of pain is highlighted in literature diminishing the overall cognitive performance by diverting from cognitive functions [
13]. A degrade cognitive performance notably attention is also highlighted when cognitive networks become overtaxed in particular with sensory stimulus of pain [
14]. Pain perception can be inhibited by engagement of cognitive tasks such as n back task, Stroop task, visual span, digit span and attention network task, thereby ensuring the optimal performance of cognitive functions such as, response time, working memory and attention/concentration in presence of pain distractors [
13,
15,
16,
17].
In order to enhance impaired cognitive functions and pain inhibition a variety of non-pharmacological neuromodulation (central and peripheral stimulation) modalities are available some of which includes Repetitive Transcranial Magnetic Stimulation (rTMS), Transcranial Direct Current Stimulation (tDCS), Transcutaneous Electrical Nerve Stimulation (TENS). Among which TENS is a peripheral nerve stimulation technique, widely known for its analgesic effects in various acute and chronic pain conditions [
18,
19,
20]. The hypoalgesic effect is produced with TENS via activation of multiple peripheral and central inhibitory mechanisms [
21,
22]. Interestingly, neurological and psychological examinations have revealed that TENS is associated with the enhancement of cognitive and executive functions by activating specific areas of brain that are involved with cognitive processing [
23,
24,
25].
tDCS, through anodal and cathodal stimulation, offers a promising solution for managing neurological and psychiatric disorders by modulating neuronal functionality in specific brain regions. [
26,
27,
28]. It is evident from prior studies that dorsolateral prefrontal cortex (DLPFC) is responsible for the circuits of pain [
29], including the attentional circuit dedicated to noxious stimuli [
30]. Previous studies performed in healthy volunteers showed that stimulation to DLPFC modulates cognitive functions by enhancing pain inhibition and reducing pain perception for experimentally induced pain [
31,
32].
Relief in cold pain perception is also noticed when anodal-tDCS is applied to left primary motor cortex [
33]. An escalated behavioral performance represented with higher efficiency and efficacy in cognitive processes is also observed when left prefrontal cortex is stimulated [
34,
35].
Studies conducted previously on pain inhibition and cognitive enhancement shows promising effects of neuromodulation modalities of TENS and tDCS utilized but lacks comparison between them. No evidence regarding the effectiveness of central stimulation over peripheral stimulation was reported in previous studies. Moreover, former studies for pain inhibition via activation of peripheral nervous system with TENS does not incorporate cognitive analysis whereas the ones representing cognitive changes does not integrate the factor of experimentally induced pain in healthy individuals.
In light of this gap in the literature, the primary aims of this study were to compare the effectiveness of central stimulation (tDCS) and peripheral stimulation (TENS) in pain inhibition during a cognitive task in healthy volunteers and to observe potential neurological and cognitive improvements. This study specifically applied tDCS in DLPFC and TENS over the median nerve. Cold Pressor Test (CPT) was used to induce thermal pain. Participants self-reported pain intensity and pain tolerance. Cognitive performance was also measured with the Stroop test.
2. Materials and Methods
2.1. Participants
A total of Eighty (80) healthy volunteers (46 males and 34 females; 20-30 years (25.20 ± 2.06 years) were recruited. Participants with any history of neurological illness and psychiatric disorders or under the influence of related medications were excluded from the study. Also, the participants under the effect of analgesic, antihypertensives and others were also eliminated. The protocols of the study were explicitly explained to all the participants and an informed consent was voluntarily signed and submitted by the participants before commencement of research experimentation. Moreover, the study conducted was in accordance and in agreement with the standards and protocols set by the University Ethical and Advanced Studies Research Committee.
2.2. Experimental Procedure
The experiment is designed to compare non-invasive peripheral and central stimulation neuromodulation modalities named TENS and tDCS (anodal-tDCS and cathodal-tDCS) on the basis of enhancement of cognitive abilities, improvement of pain tolerance level, and neurological changes.
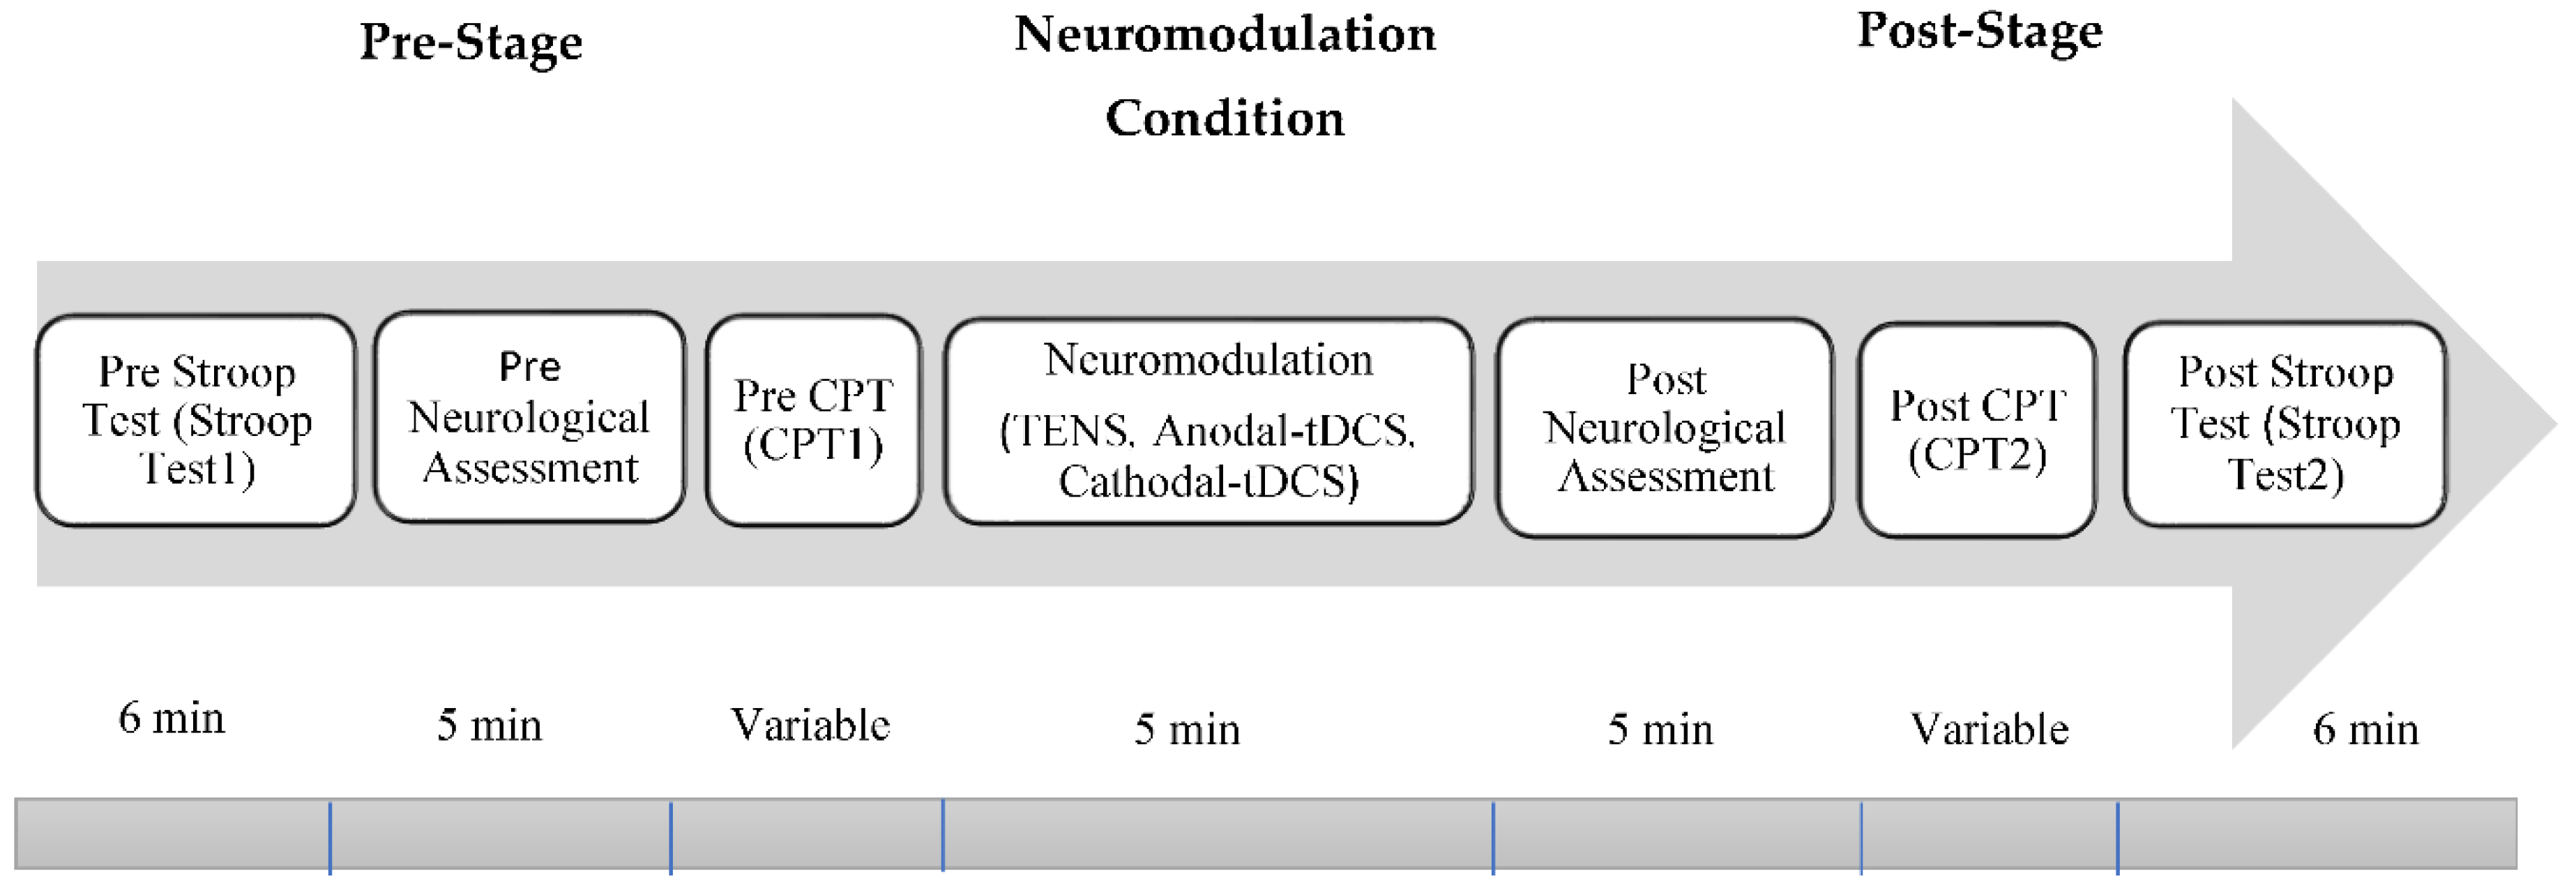
The experimental procedure for this study is categorized into four groups with an equal distribution of participants in each group. In the behavioral and psychological assessment, there were 20 participants in each group. However, in the neurological assessment, the number of participants in each group was limited to 12. Among the four group, one is control group named as G1 and does not receive any neuromodulation whereas electrical stimulation via TENS, anodal-tDCS and cathodal-tDCS were administered to each of the remaining groups and are labelled as G2, G3 and G4 respectively. The stimulation via tDCS were administered on Dorsolateral prefrontal cortex (FP1/FP2). Whereas, electrical stimulation via TENS were delivered over medial nerve. Each group undergo the seven steps/stages as shown in
Figure 1.
2.3. Cold Pressor Test/Pain Induction
Cold Pressor Test (CPT is a preferred technique for inducing nociceptive thermal pain. The experiment commenced was in accordance with the guidelines recommended in prior studies [
4], [
36,
37]. Cold pressor test was conducted in a quiet room with no visual and auditory distractions. The participants were comfortably seated in a convenient room with a temperature of 26±2 °C. Dometic Cool Fun CK 40D Hybrid employed, uses the power of compressor cooling technology and conveniently adjust the temperature of water at 1℃ to 3℃. The participants were instructed to submerge their dominant hand up to their wrist in icy cold water and a stop watch is simultaneously activated to record the pain threshold, which is the time latency to the initiation of pain sensation reported by participant. The time at which the participants withdraw their hand from the chilled water, when the intensity of pain becomes unbearable is also recorded and marked as pain tolerance.
2.4. Transcranial Direct Current Stimulation
Transcranial Direct Current Stimulation (tDCS) current was applied using a constant current stimulator (Brain Driver, Chicago, IL, USA). A pair of surface electrodes with a surface area of 20cm2 was employed for administration of direct current. These surface electrodes are soaked in saline solution to enhance conductivity. Complying with 10-20 international EEG system electrode were placed over DLPFC, which is the preferred brain area for inducing electrical stimulations Anodal-tDCS stimulation was delivered with anode positioned over Fp1 or Fp2 and cathode placed over the contralateral shoulder. This electrode placement was reversed for administration of cathodal-tDCS stimulation with cathode placed over Fp1 or Fp2 and anode placed over opposite shoulder. An offline stimulation of 2mA intensity was administered for 5 minutes indicating that tDCS was not applied during psychometric task of cognition and pain.
2.5. Transcranial Electrical Nerve Stimulation
Transcutaneous electrical nerve stimulation (TENS) was delivered using portable battery-powered TENS stimulator (InTENSity Select Combo II, USA). Symmetrical Biphasic rectangular waves TENS signal was administered via a pair of self-adhesive surface electrodes of 5 cm x 5 cm. Both electrodes were positioned over the median nerve, responsible for controlling the sensations of the dominant hand in which thermal pain is induced via CPT. The output frequency of 100 Hz, electrode impedance (below 2 KΩ) and pulse width of 100 microsecond and current intensity of 10 mA was delivered for 5 mins.
2.6. EEG Data Acquisition
For the purpose of acquiring real time EEG data, Emotive Epoc device (Emotive Inc., San Francisco, US) with a sampling frequency of 128 Hz was employed. Emotive Epoc is a wireless EEG head set comprising of 14 channel and saline based electrodes was used. The location of 14 electrodes of Emotive EPOC are in accordance with 10-20 international system of EEG montage with the electrodes placement at AF3, AF4, F3, F4, F7, F8, FC5, FC6, P7, P8, T7, T8, O1, and O2.
2.7. EEG Data Analysis
EEG signal processing was conducted offline for which fifth order High pass IIR filter was set to 1 Hz and band stop/notch filter of 49.5 to 50.5 Hz by using (1)[
38] was employed to eliminate noise from line frequency.
Welch method was applied for estimation of spectral density by using (2) [
39].
Here, k is the number of segments, and is the Fourier transform of the k-th segment. The FFT is typically used to efficiently compute the Fourier transform.
The sampled data are segmented to improve spectrum estimation. In order to conserve the quality of EEG and reduce power spectral variance a delicate balance is needed/required between segment length and overlap rate. in the current study Hanning window of length 512 samples corresponding to the data of 4 seconds with a 50% overlapping to avoid spectral variance. The resolution of 0.25 is achieved with welch method. Therefore, the mean of the power spectrum (3) [
40] was computed across five frequency bands: Delta (1–4 Hz), Theta (4–8 Hz), Alpha (8–12 Hz), Beta (13–30 Hz), and Gamma (30–40 Hz).
If you have obtained the PSD estimate
for each frequency bin or band, the mean power spectrum
can be computed as:
2.8. Behavioral Assessment/Psychometric Assessment
2.8.1. Numeric Pain Scale
Pain intensity was rated using numeric pain scale ranges from 0 to 10 where 0 represents no pain and 10 corresponds to extremely sever pain [
41] as shown in
Figure 2. During CPT, participants mark the number that represents their pain level.
2.8.2. Stroop Task
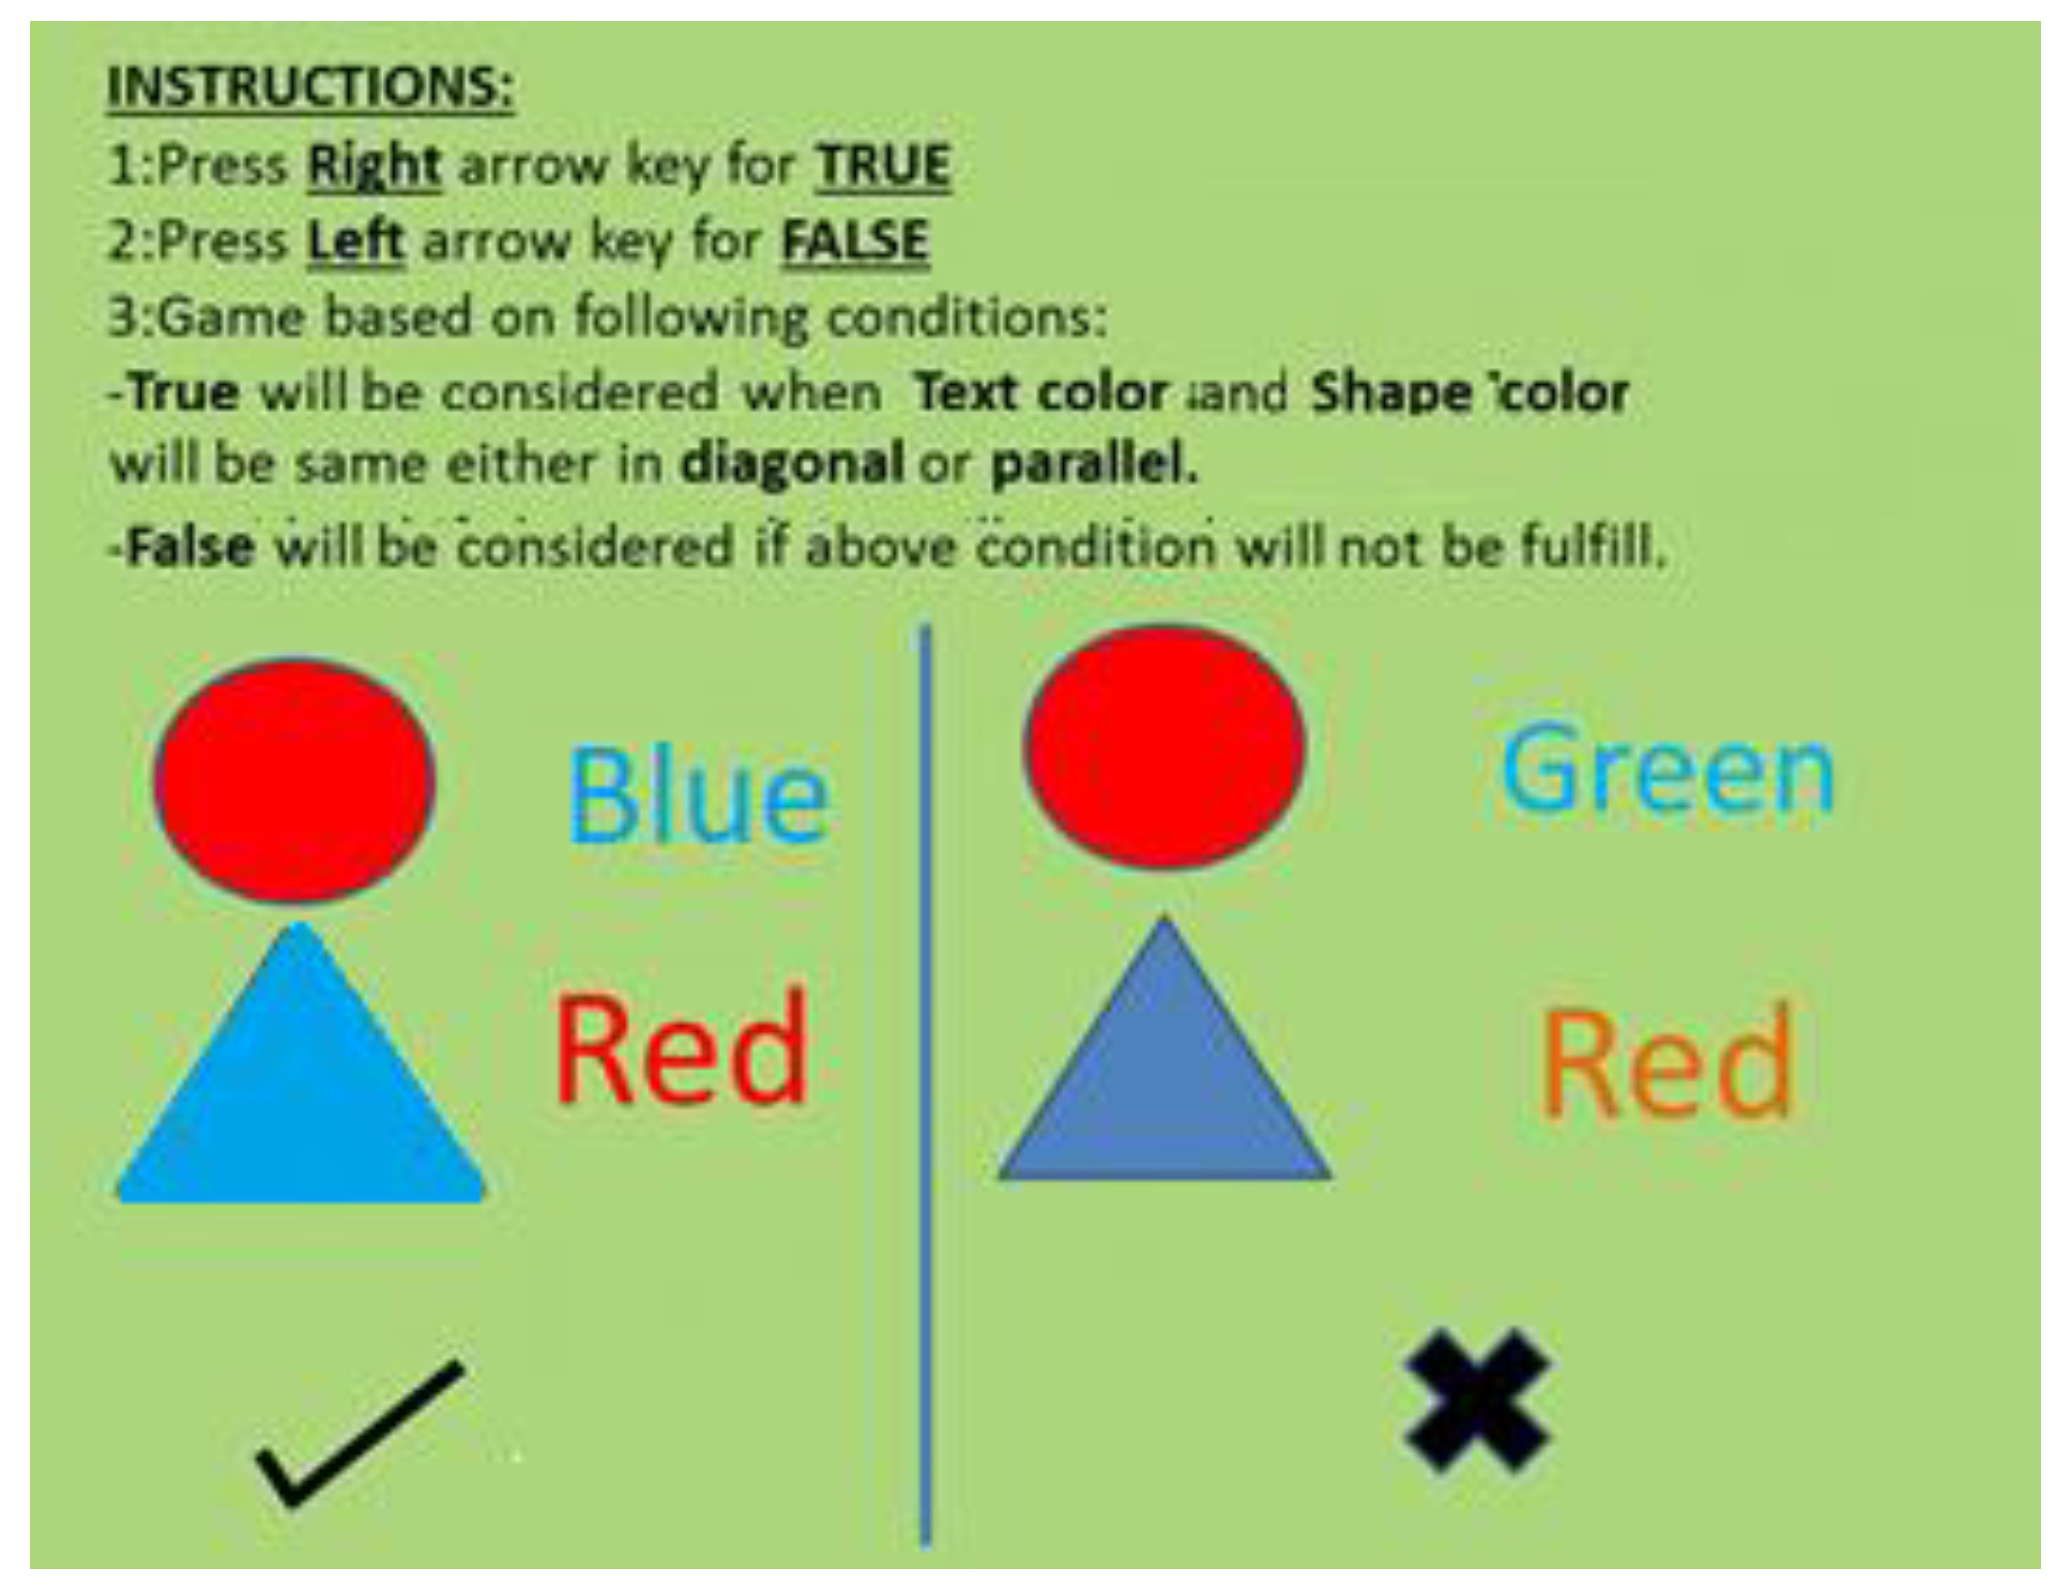
For the purpose of evaluating attentiveness Stroop task was performed for 6 minutes. A string of a consistent color word and an inconsistent color word and geometric shapes were presented at the screen as stimulus. The participants were instructed to press the right arrow key from the keyboard if the color of the geometric shape color and the color of the word matches either diagonally or in parallel, and otherwise press the left arrow key from the keyboard, as shown in
Figure 3.
The stimuli stayed on the computer screen for 3 seconds and the task participant were then allowed to respond. Since two cognitive tasks are being processed by the brain simultaneously, leads to an increase in cognitive load as a response of which response time of an participants varies. This helps to determine the cognitive speed, attentional capacity and response time of the individual. The test was administered pre and post application of tDCS. The Stroop test score was calculated by using (4).
Here, Correct Response is the number of correct responses given by the participant during the Stroop test.
Total_ Responses is the total number of trials attempted by the participant.
2.8.3. Statistical Analysis
The significant effect of neuromodulation on pain tolerance, pain inhibition and cognitive test (Stroop test score) was evaluated using Paired wise t-test for different stimulation types (anodal-tDCS, Cathodal-tDCS, TENS and Control) and stimulation condition (Pre-Stage and Post-Stage). The t-values were calculated by using (5) for Pre-Stage, Post-Stage and neuromodulation conditions All results are expressed and stated as the mean ± standard error of the mean, and p ˂0.05 was set as significance level.
Here,
and
are the sample means of the two conditions (Pre-Stage and Post-Stage)
SD is the standard deviation of the difference between the paired observations.
Np is the number of paired observations.
3. Results
All 80 participants involved in the present study. However, 32 participants chose not to wear the EEG device during the entire experiment due to discomfort, while the remaining participants completed the experiment with the EEG device worn, managing both electrical stimulations (tDCS and TENS) and experimentally induced pain via CPT with no persistent negative effects.
3.1. Psychological Analysis
3.1.1. Effects of Electrical Stimulations on Pain Perception
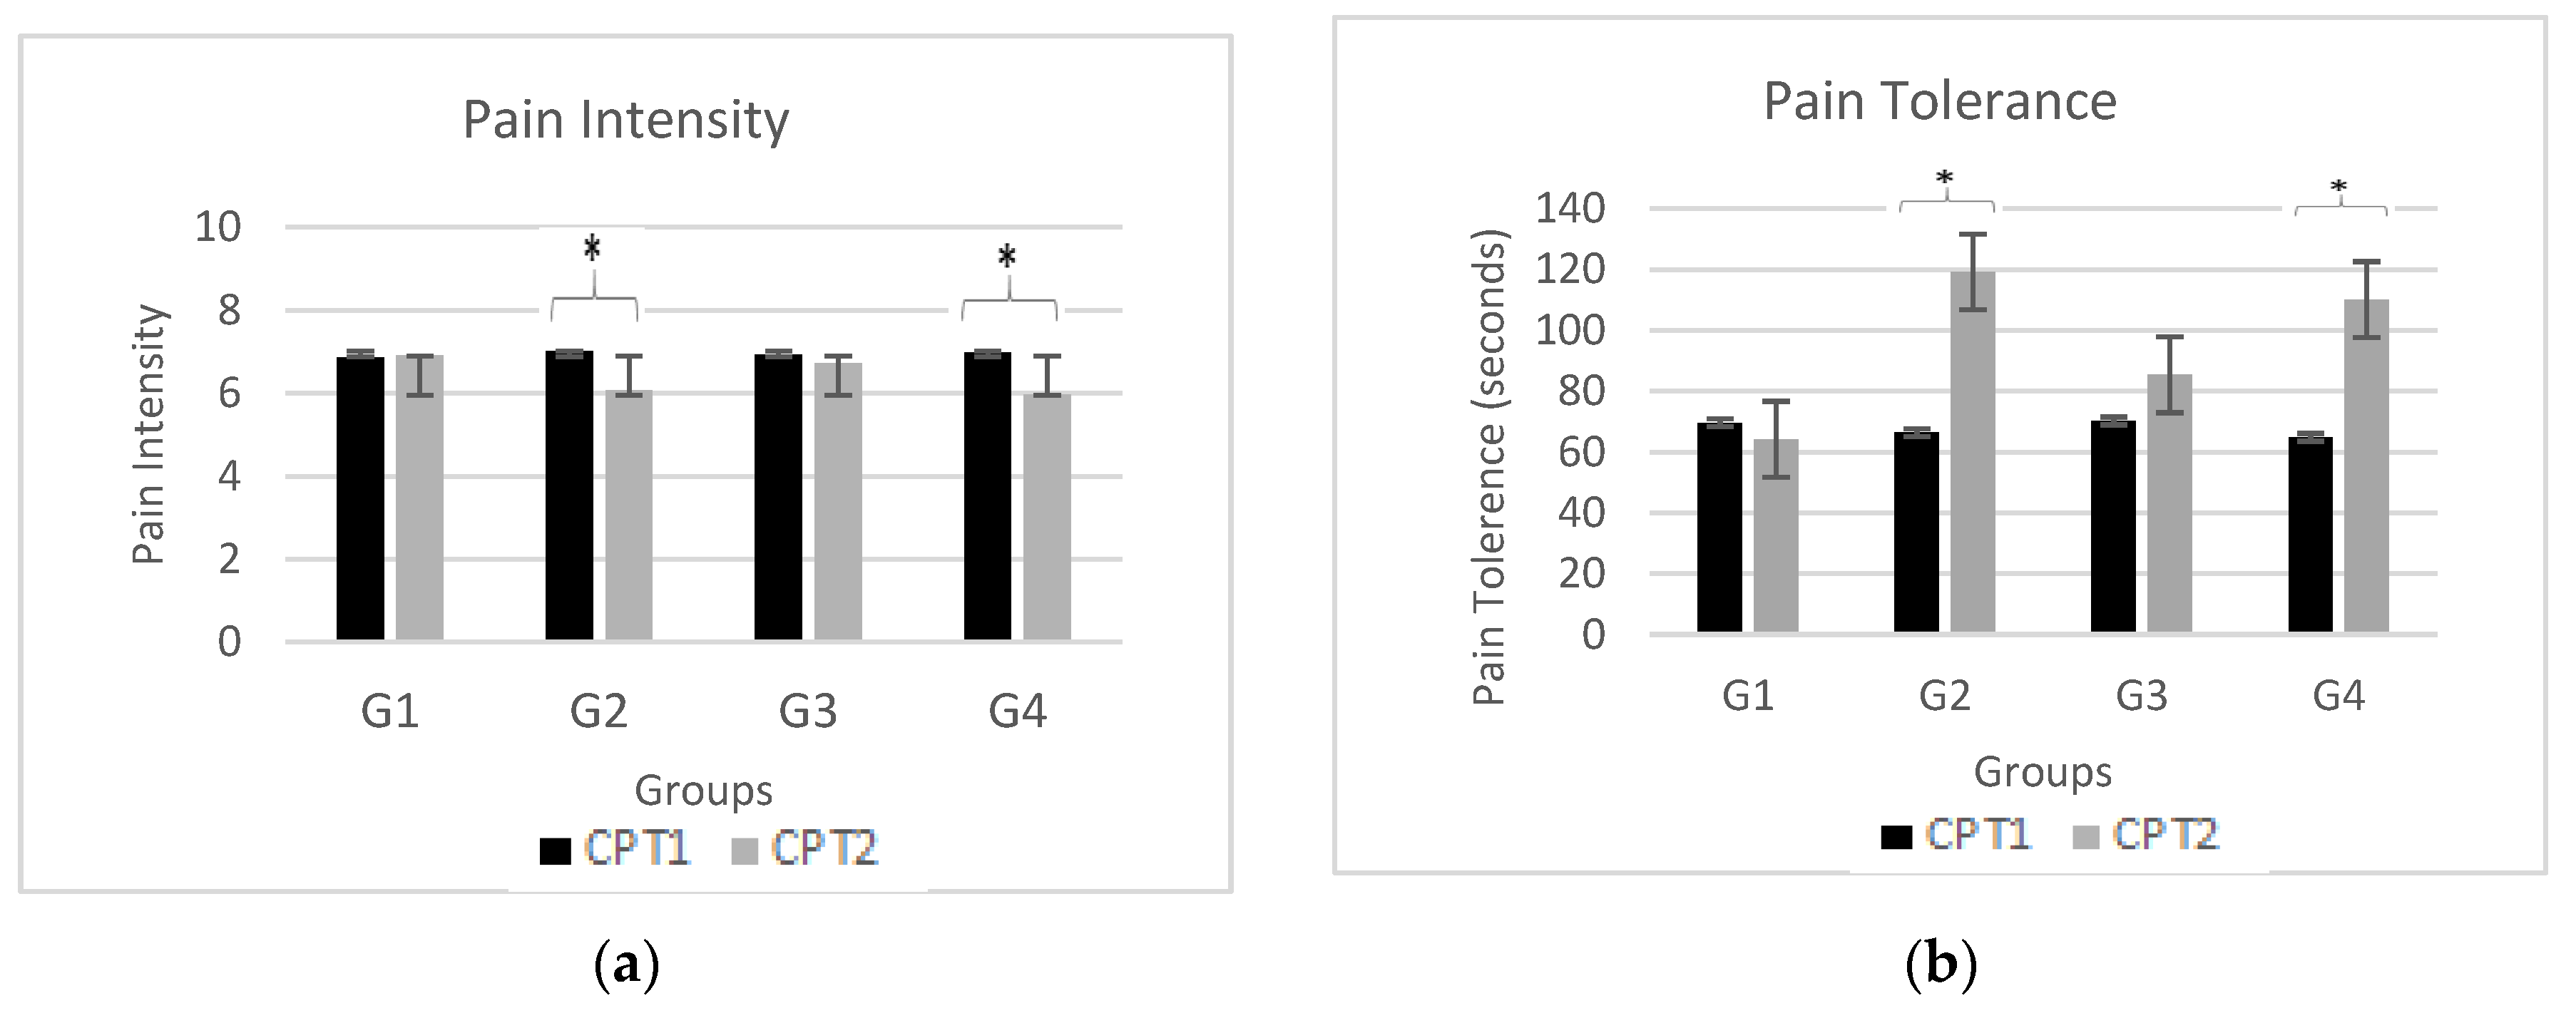
Figure 4 demonstrates effects of neuromodulation on pain perception (i.e., pain intensity and pain tolerance) for CPT1 (black bars) and CPT2 pain assessments (gray bars) for all four groups (G1, G2, G3 and G4). The subfigure (a) shows mean pain intensity level obtained by participants in both CPT1 and CPT2 while subfigure (b) shows mean pain tolerance level by participants in both CPT1 and CPT2. Also, the significant change in pain intensity and pain tolerance level in CPT2 as compared to CPT1 are marked by an asterisk (*) at the top of each bar.
Outcome of pain perception for neuromodulation modalities of tDCS (anodal and cathodal) and TENS were compared to determine their effectiveness using visual analog scale. Pain intensity scores of TENS (p = 0.002 t-value = -5.34), anodal-tDCS (p = 0.061), and cathodal-tDCS (p = 0.023 t-value = -5.08) exhibits a significant difference when compared to control group. Maximum efficacy is obtained with administration of TENS over median nerve with pain tolerance of p = 0.009 t-value = 4.98. Cathodal-tDCS (G4) over DLPFC also indicated an augmented endurance to pain with a tolerance value of p = 0.001, t-value = 5.78. However, application of anodal-tDCS over DLPFC reveals a moderate effect on pain tolerance with p = 0.082.
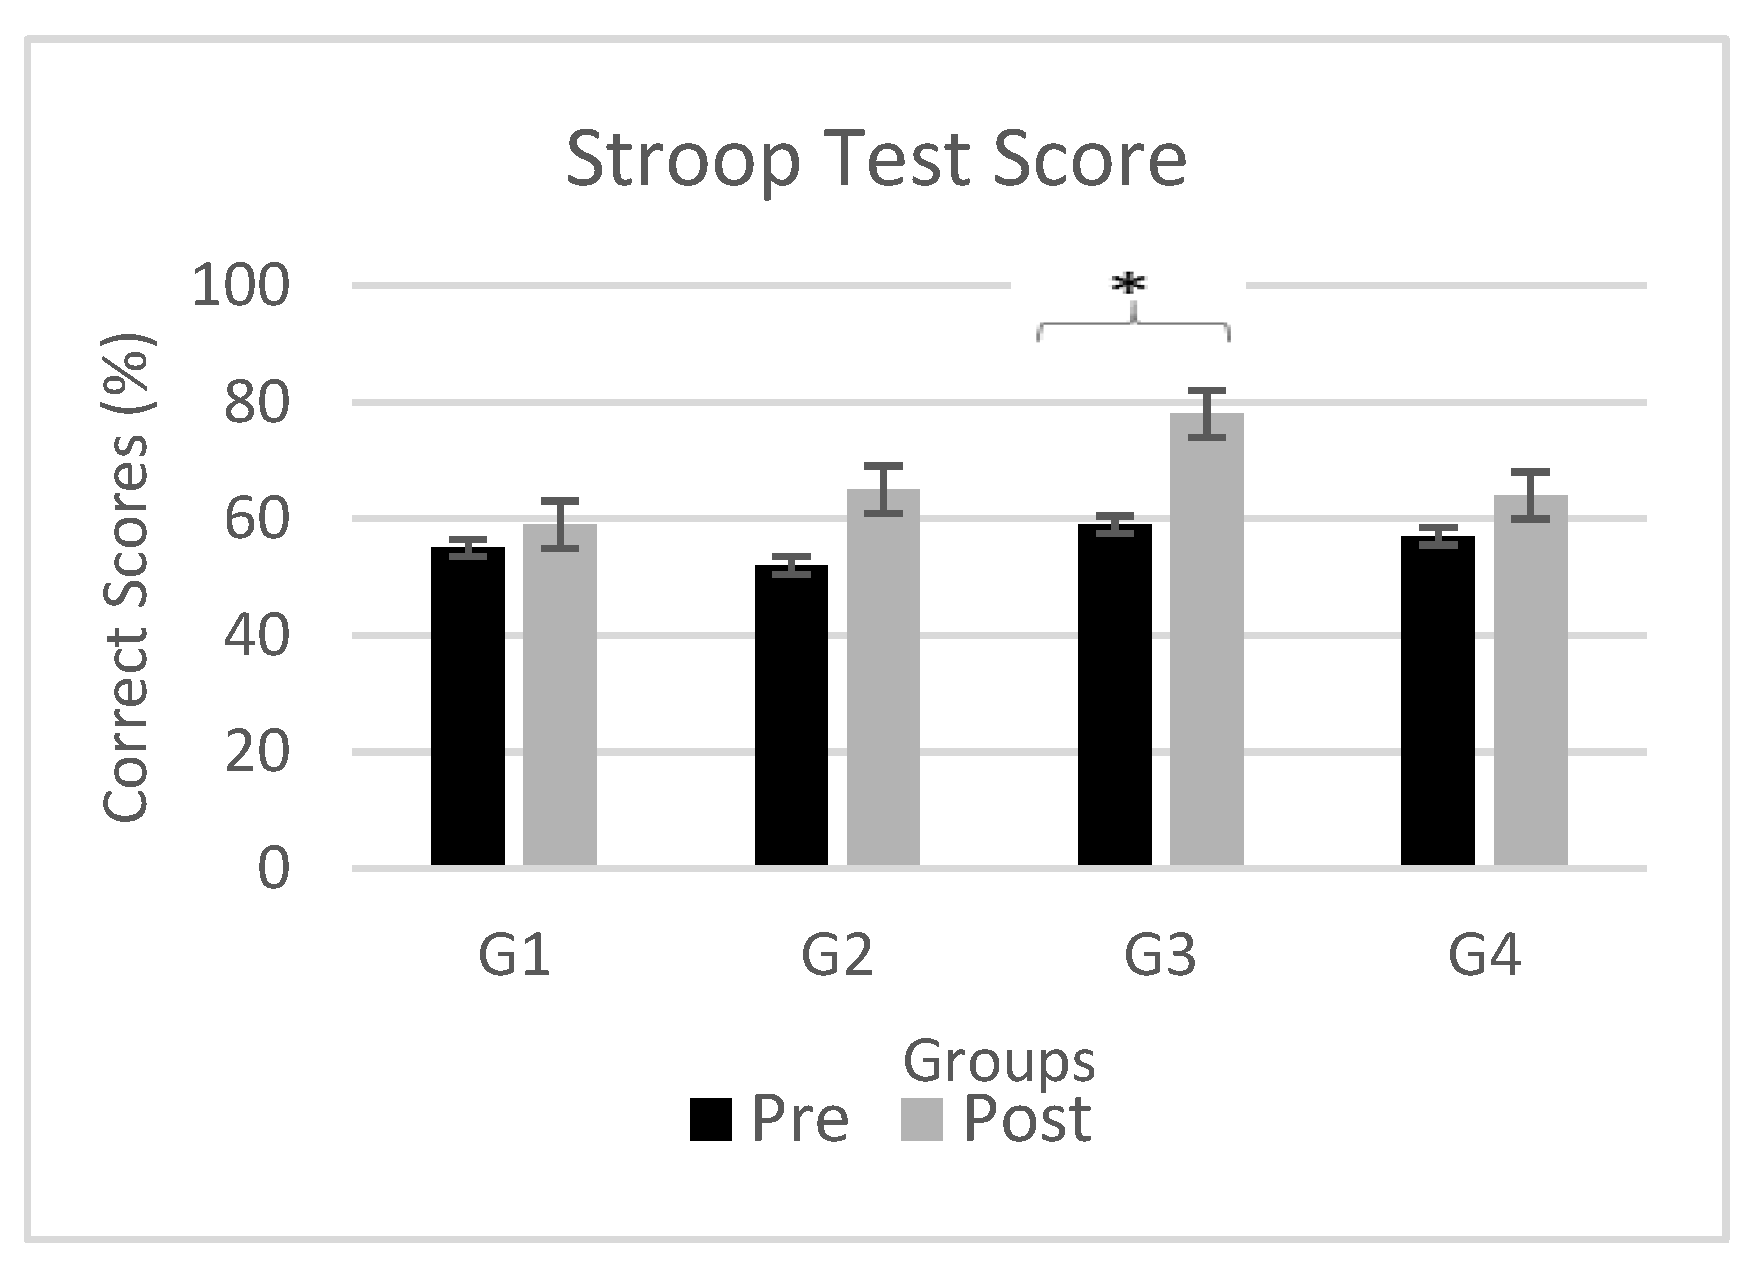
3.1.2. Influence of Electrical Stimulation on Stroop Test Task
Figure 5 demonstrates effects of neuromodulation on cognitive task (i.e. Stroop test) for Stroop Test1 (black bars) and Stroop Test2 cognitive assessments (gray bars) for all four groups (G1, G2, G3 and G4). The figure shows mean Stroop test score obtained by participants in both Stroop Test1 and Stroop Test2. Also, the significant change Stroop test score in Stroop Test2 as compared to Stroop Test1 are marked by an asterisk (*) at the top of each bar. To examine the effectiveness of non-pharmacological central and peripheral stimulant on cognition particularly attention, Stroop test was performed. An intra-group comparison reveals significant difference in cognitive performance with reduction in omission and wrong replies, indicates an overall enhancement and is most evident with administration of Anodal-tDCS with a p value of 0.041 and t-value= 4.86. Moderate beneficial effect was observed with TENS and cathodal-tDCS with p = 0.059 and 0.067 respectively.
3.2. Neurological Analysis
In this study, EEG recordings were conducted in resting state under both eyes-open and eyes-closed conditions across four different groups, with Group 1 serving as the control. Utilizing t-tests for comparison, our analysis revealed no statistically significant differences was found in Pre-Stage EEG of all four groups.
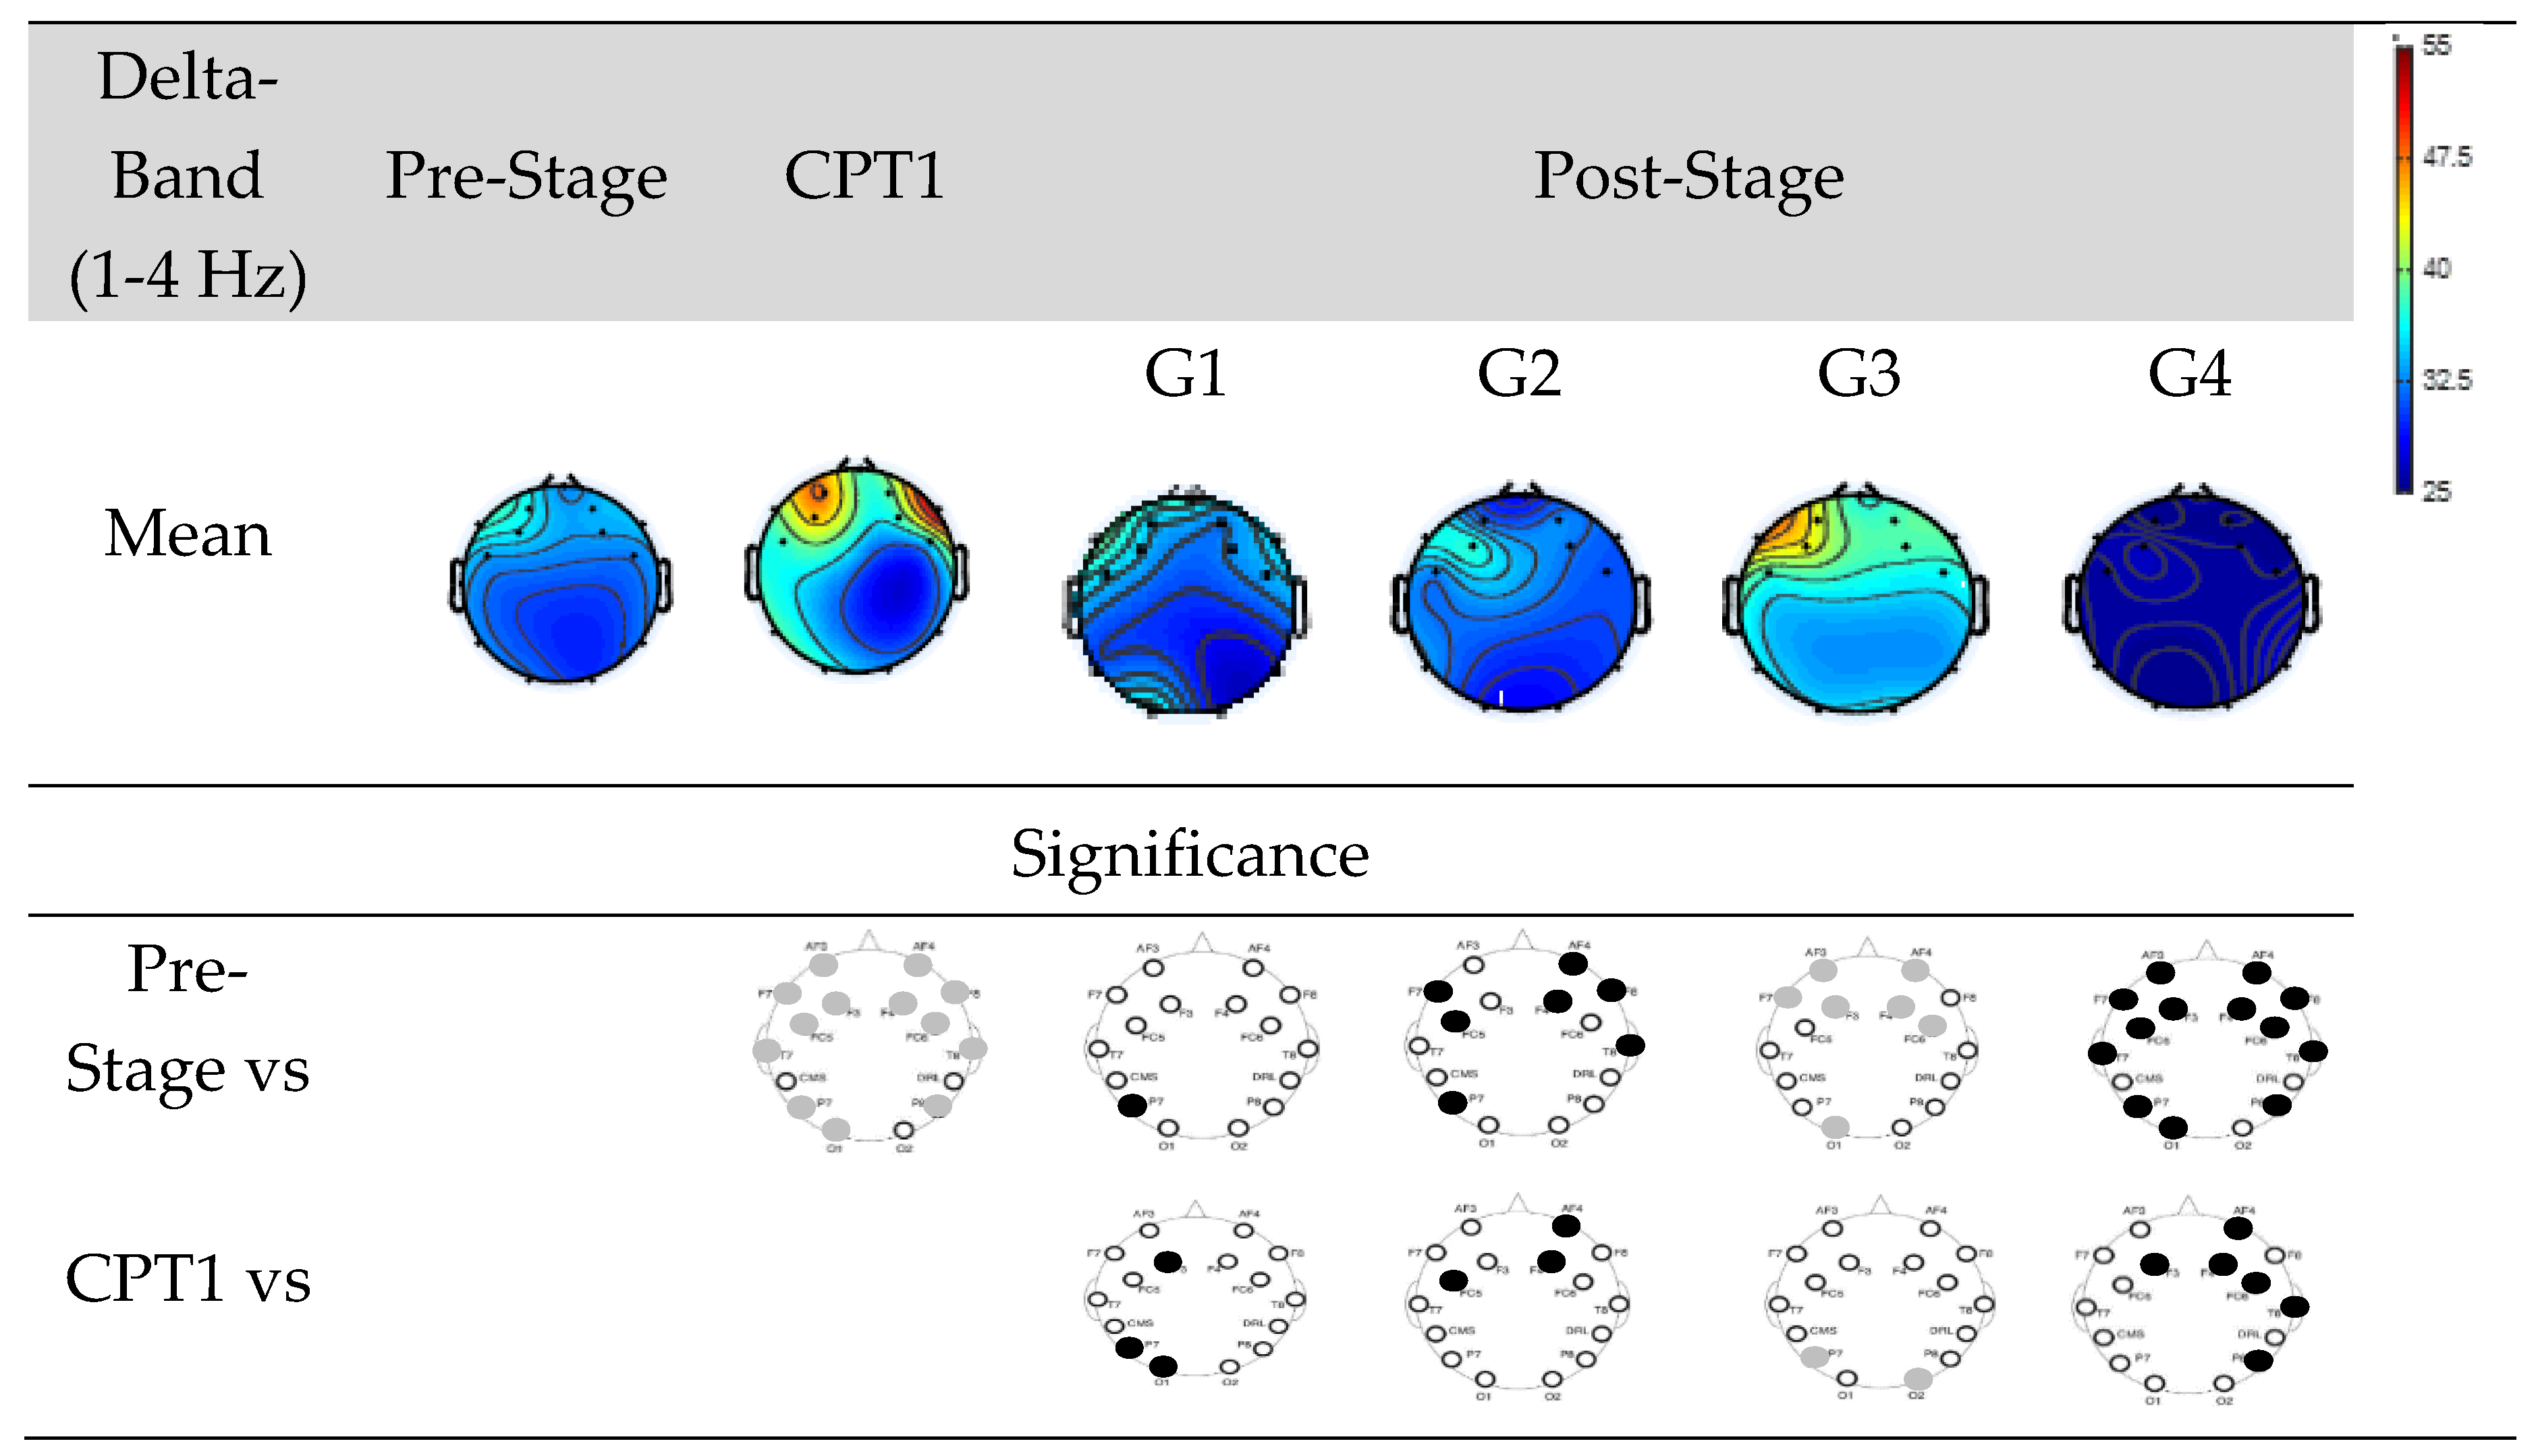
Figure 6 shows EEG power of Groups G1, G2, G3, and G4 within delta-band.
The first row shows the mean power of the Pre-Stage, CPT1, and Post-Stage EEG for each group. The second row shows significant difference between the Pre-Stage and CPT1 as well as post-stages across all groups. The third row shows the significant difference between CPT1 vs Post-Stages for all groups. Black circles indicate reductions in significant power and grey circles indicate increases. Specifically, there was a significant global increase in Delta power in the CPT1 condition, and a significant increase only in the frontal region was observed in the Post-Stage of G3 compared to the Pre-Stage EEG. Conversely, there was a significant decrease in Delta power in the Post-Stage EEG of G2 and G4 compared to the Pre-Stage. When compared to the CPT1 condition, G2 and G4 significantly decreased in the frontal region, while G3 increased in the parietal and occipital regions.
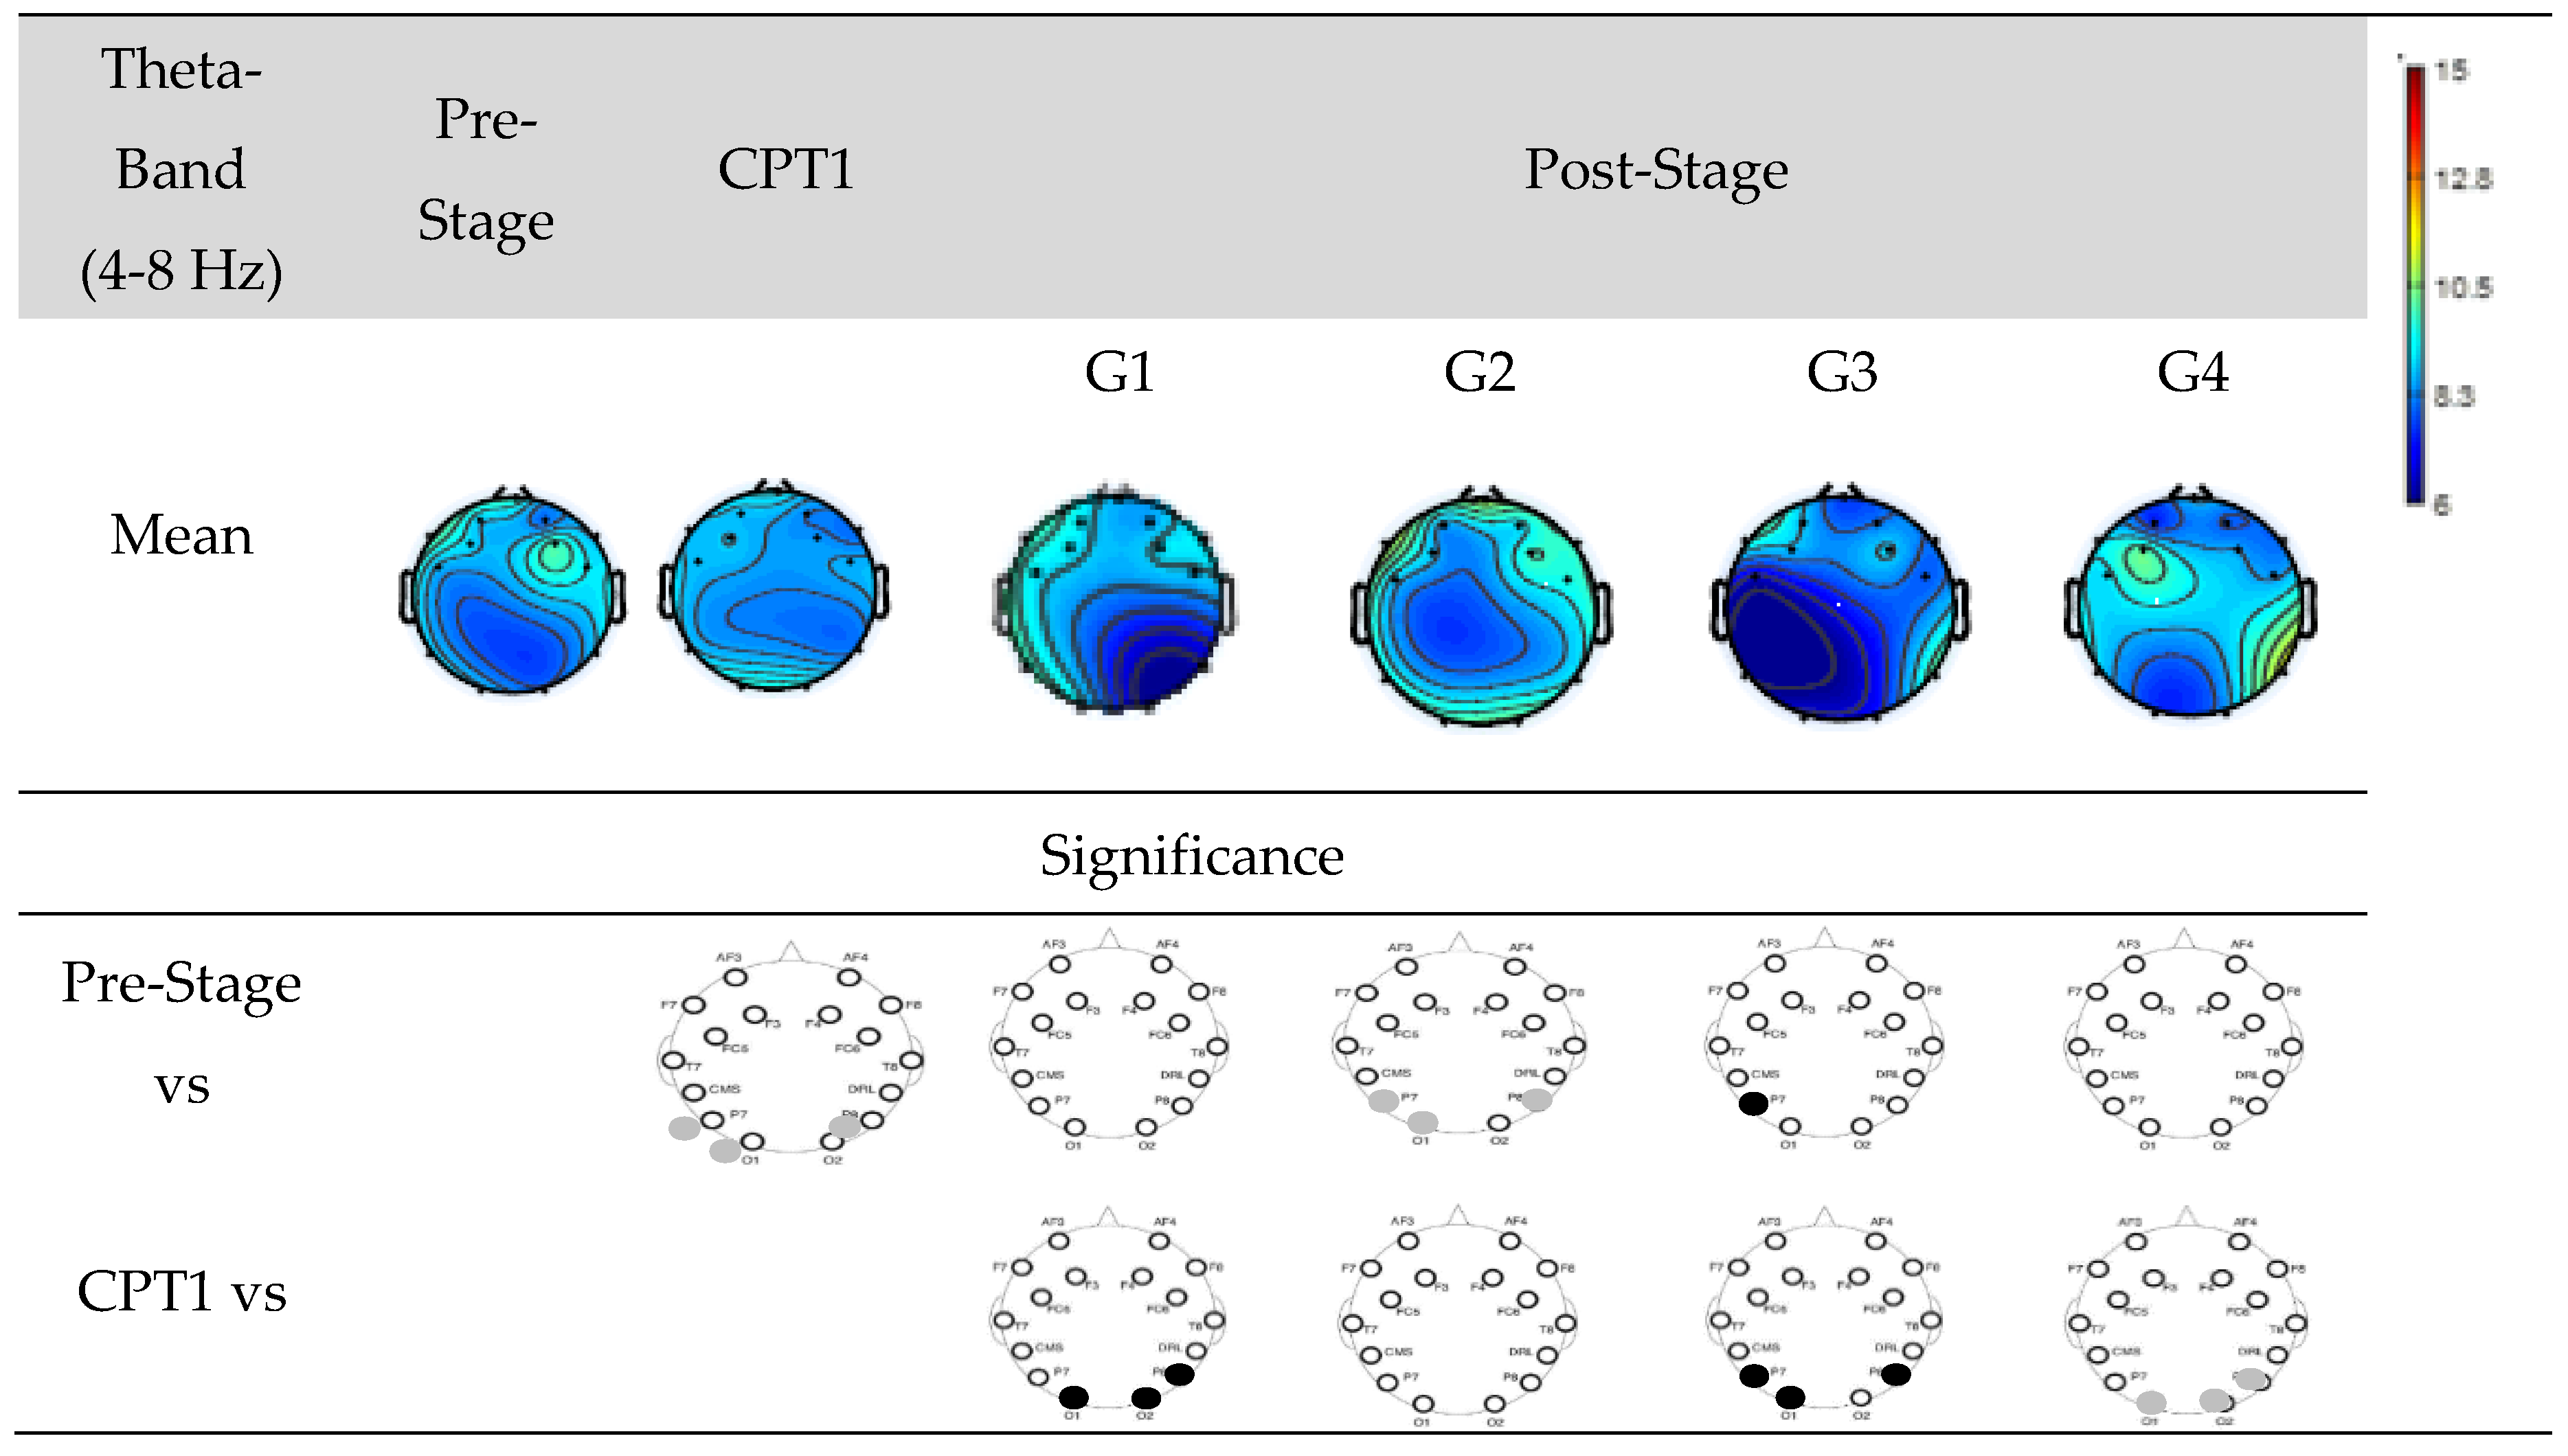
Figure 7 shows EEG power of Groups G1, G2, G3, and G4 within Theta-band. The first row shows the mean power of the Pre-Stage, CPT1, and Post-Stage for each group. The second row shows significant difference between the Pre-Stage and CPT1 as well as Post-Stage across all groups. The third row shows the significant difference between CPT1 vs Post-Stage for all groups. Black circles indicate reductions in significant power and grey circles indicate increases. Specifically, there was a significant increase in theta power in the occipital region in the CPT1 condition and Post-Stage of G2 while no significant changes observed in other groups as compared to Pre-Stage. When compared to the CPT1 condition, G1 and G3 significantly decreased in the parietal region, while G4 increased in the parietal and occipital regions.
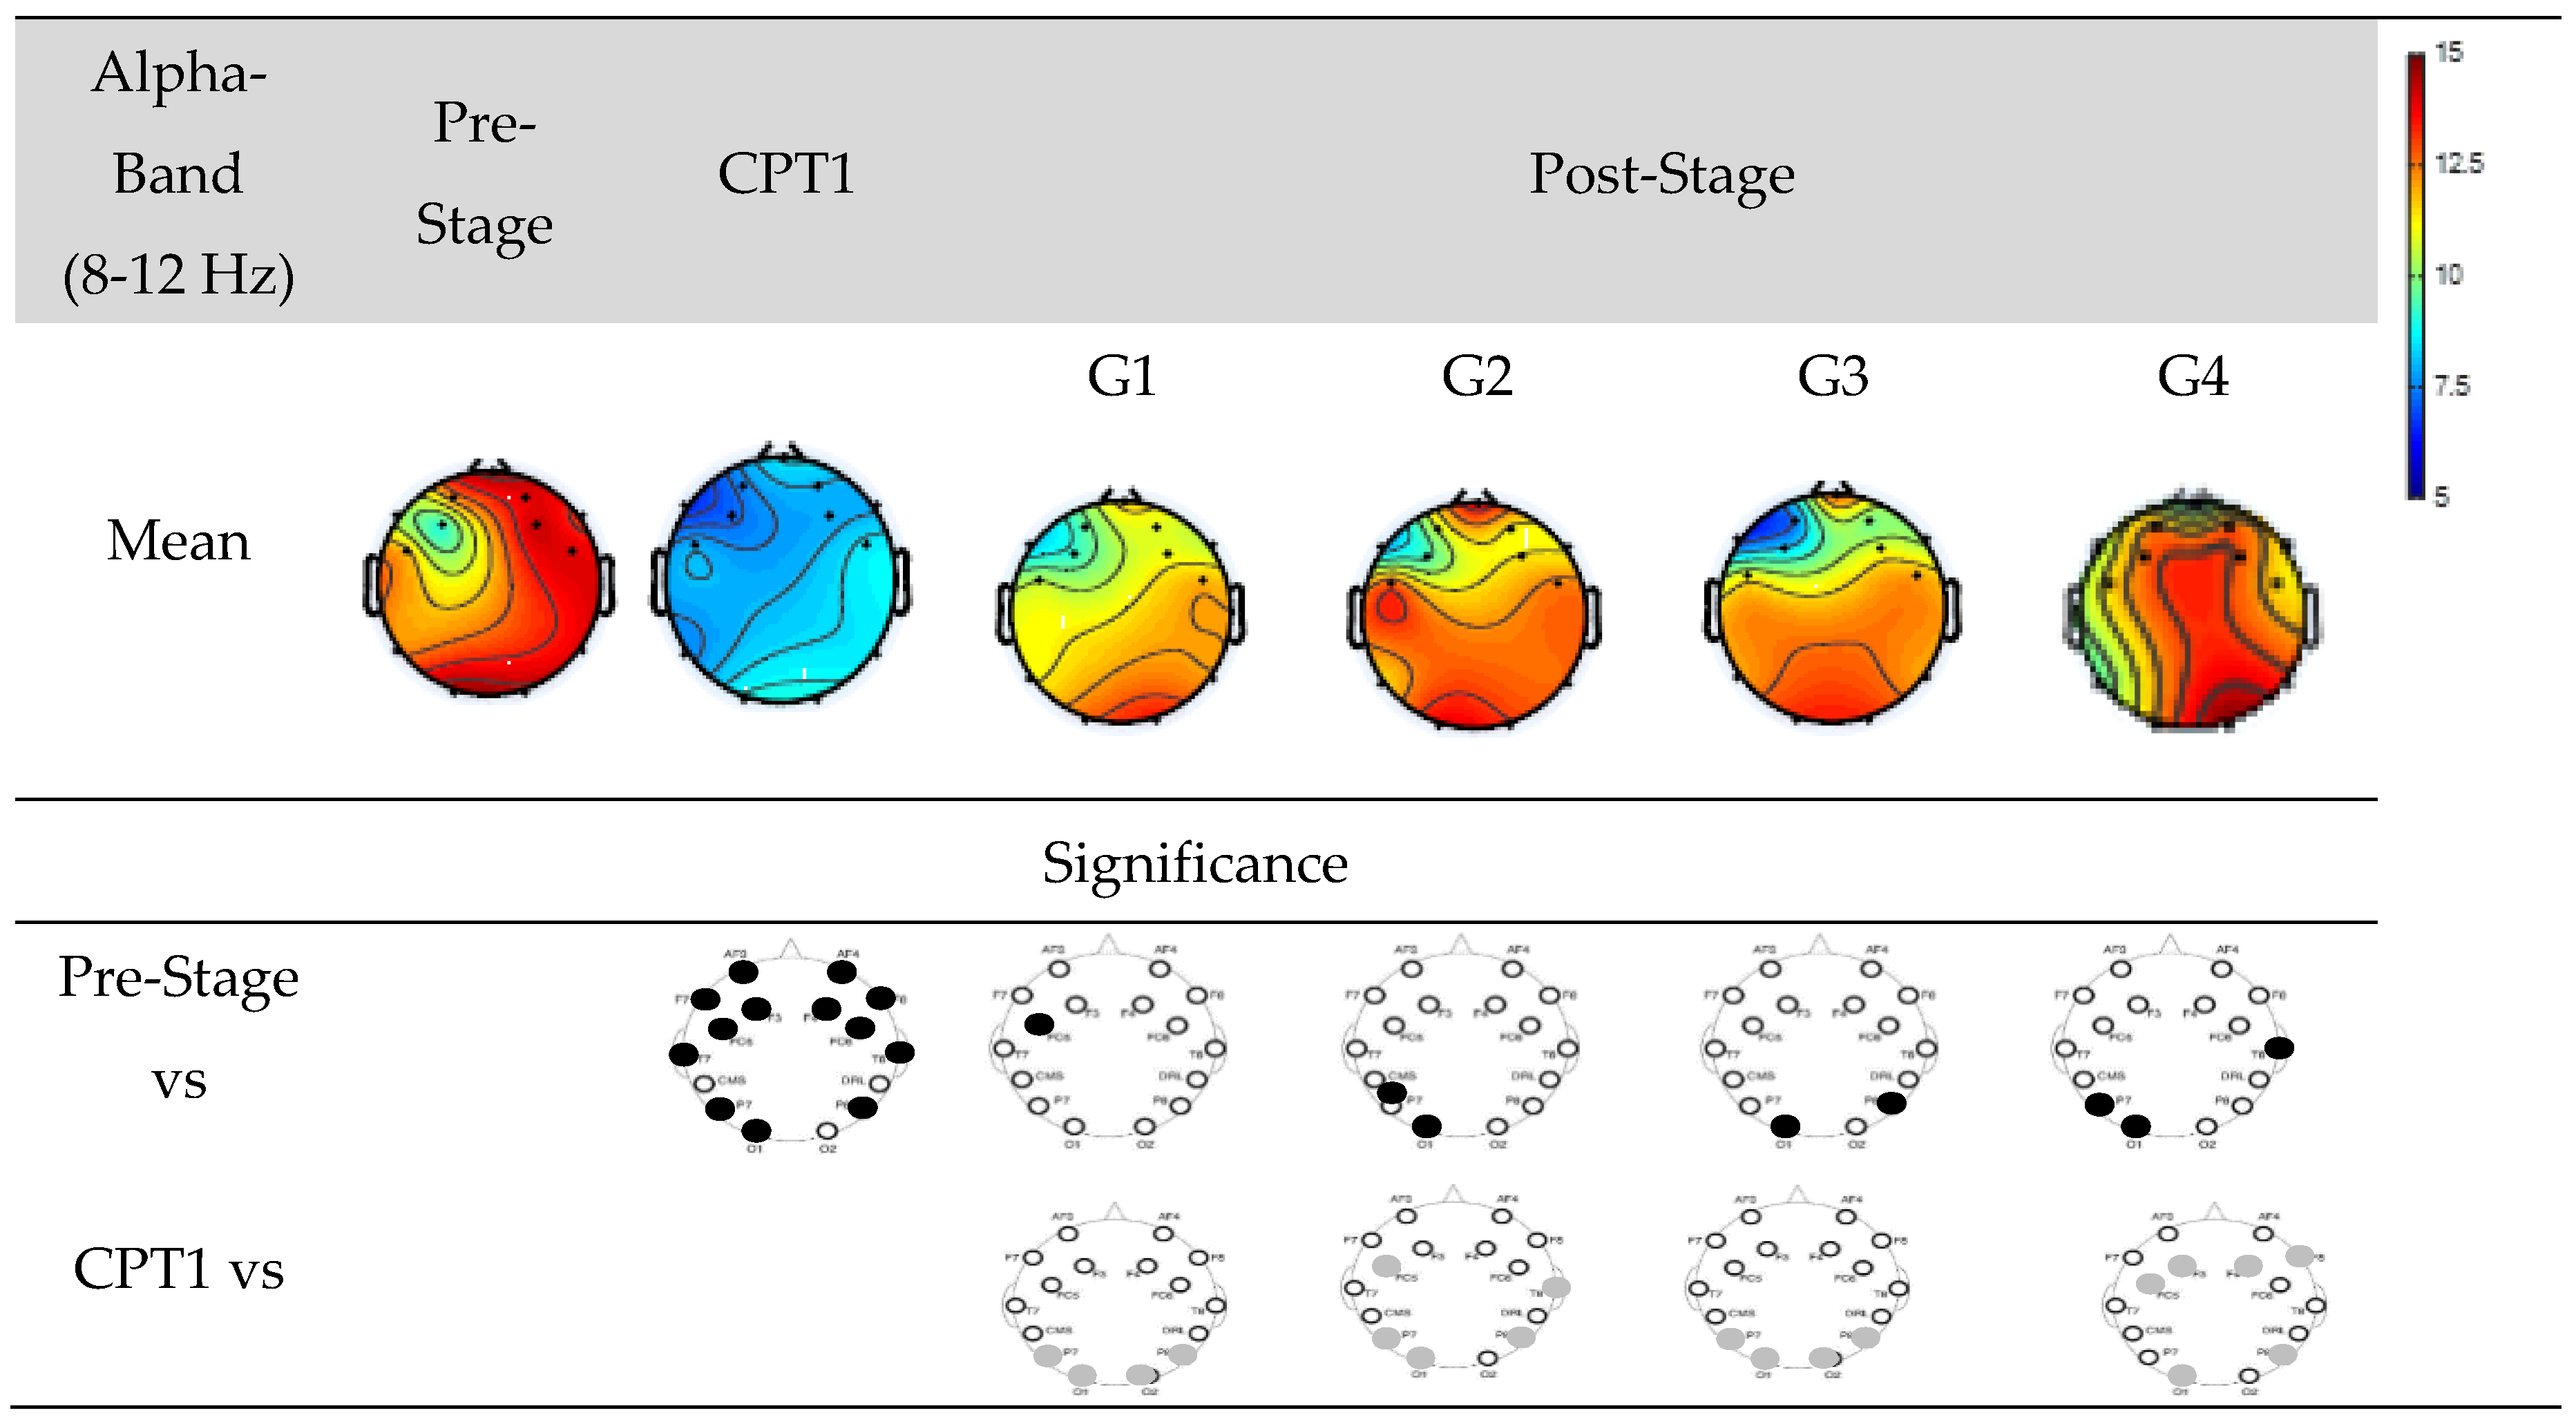
Figure 8 shows EEG power of Groups G1, G2, G3, and G4 within Alpha-band. The first row shows the mean power of the Pre-Stage, Pain-1, and Post-Stage for each group. The second row shows significant difference between the Pre-Stage and CPT1 as well as Post-Stages across all groups. The third row shows the significant difference between CPT1 vs Post-Stages for all groups. Black circles indicate reductions in significant power and grey circles indicate increases.
Specifically, there was a significant global decrease in alpha power in the CPT1 condition, and a significant decrease only in the occipital and parietal region was observed in the Post-Stage of G2, G3 and G4 compared to the Pre-Stage. Conversely, there was a significant decrease in alpha power in the post stages of G1 in the frontal region. When compared to the CPT1 condition, G1 and G3 significantly increased in the occipital and parietal region only, while G2 and G4 increased in the frontal, parietal and occipital regions.
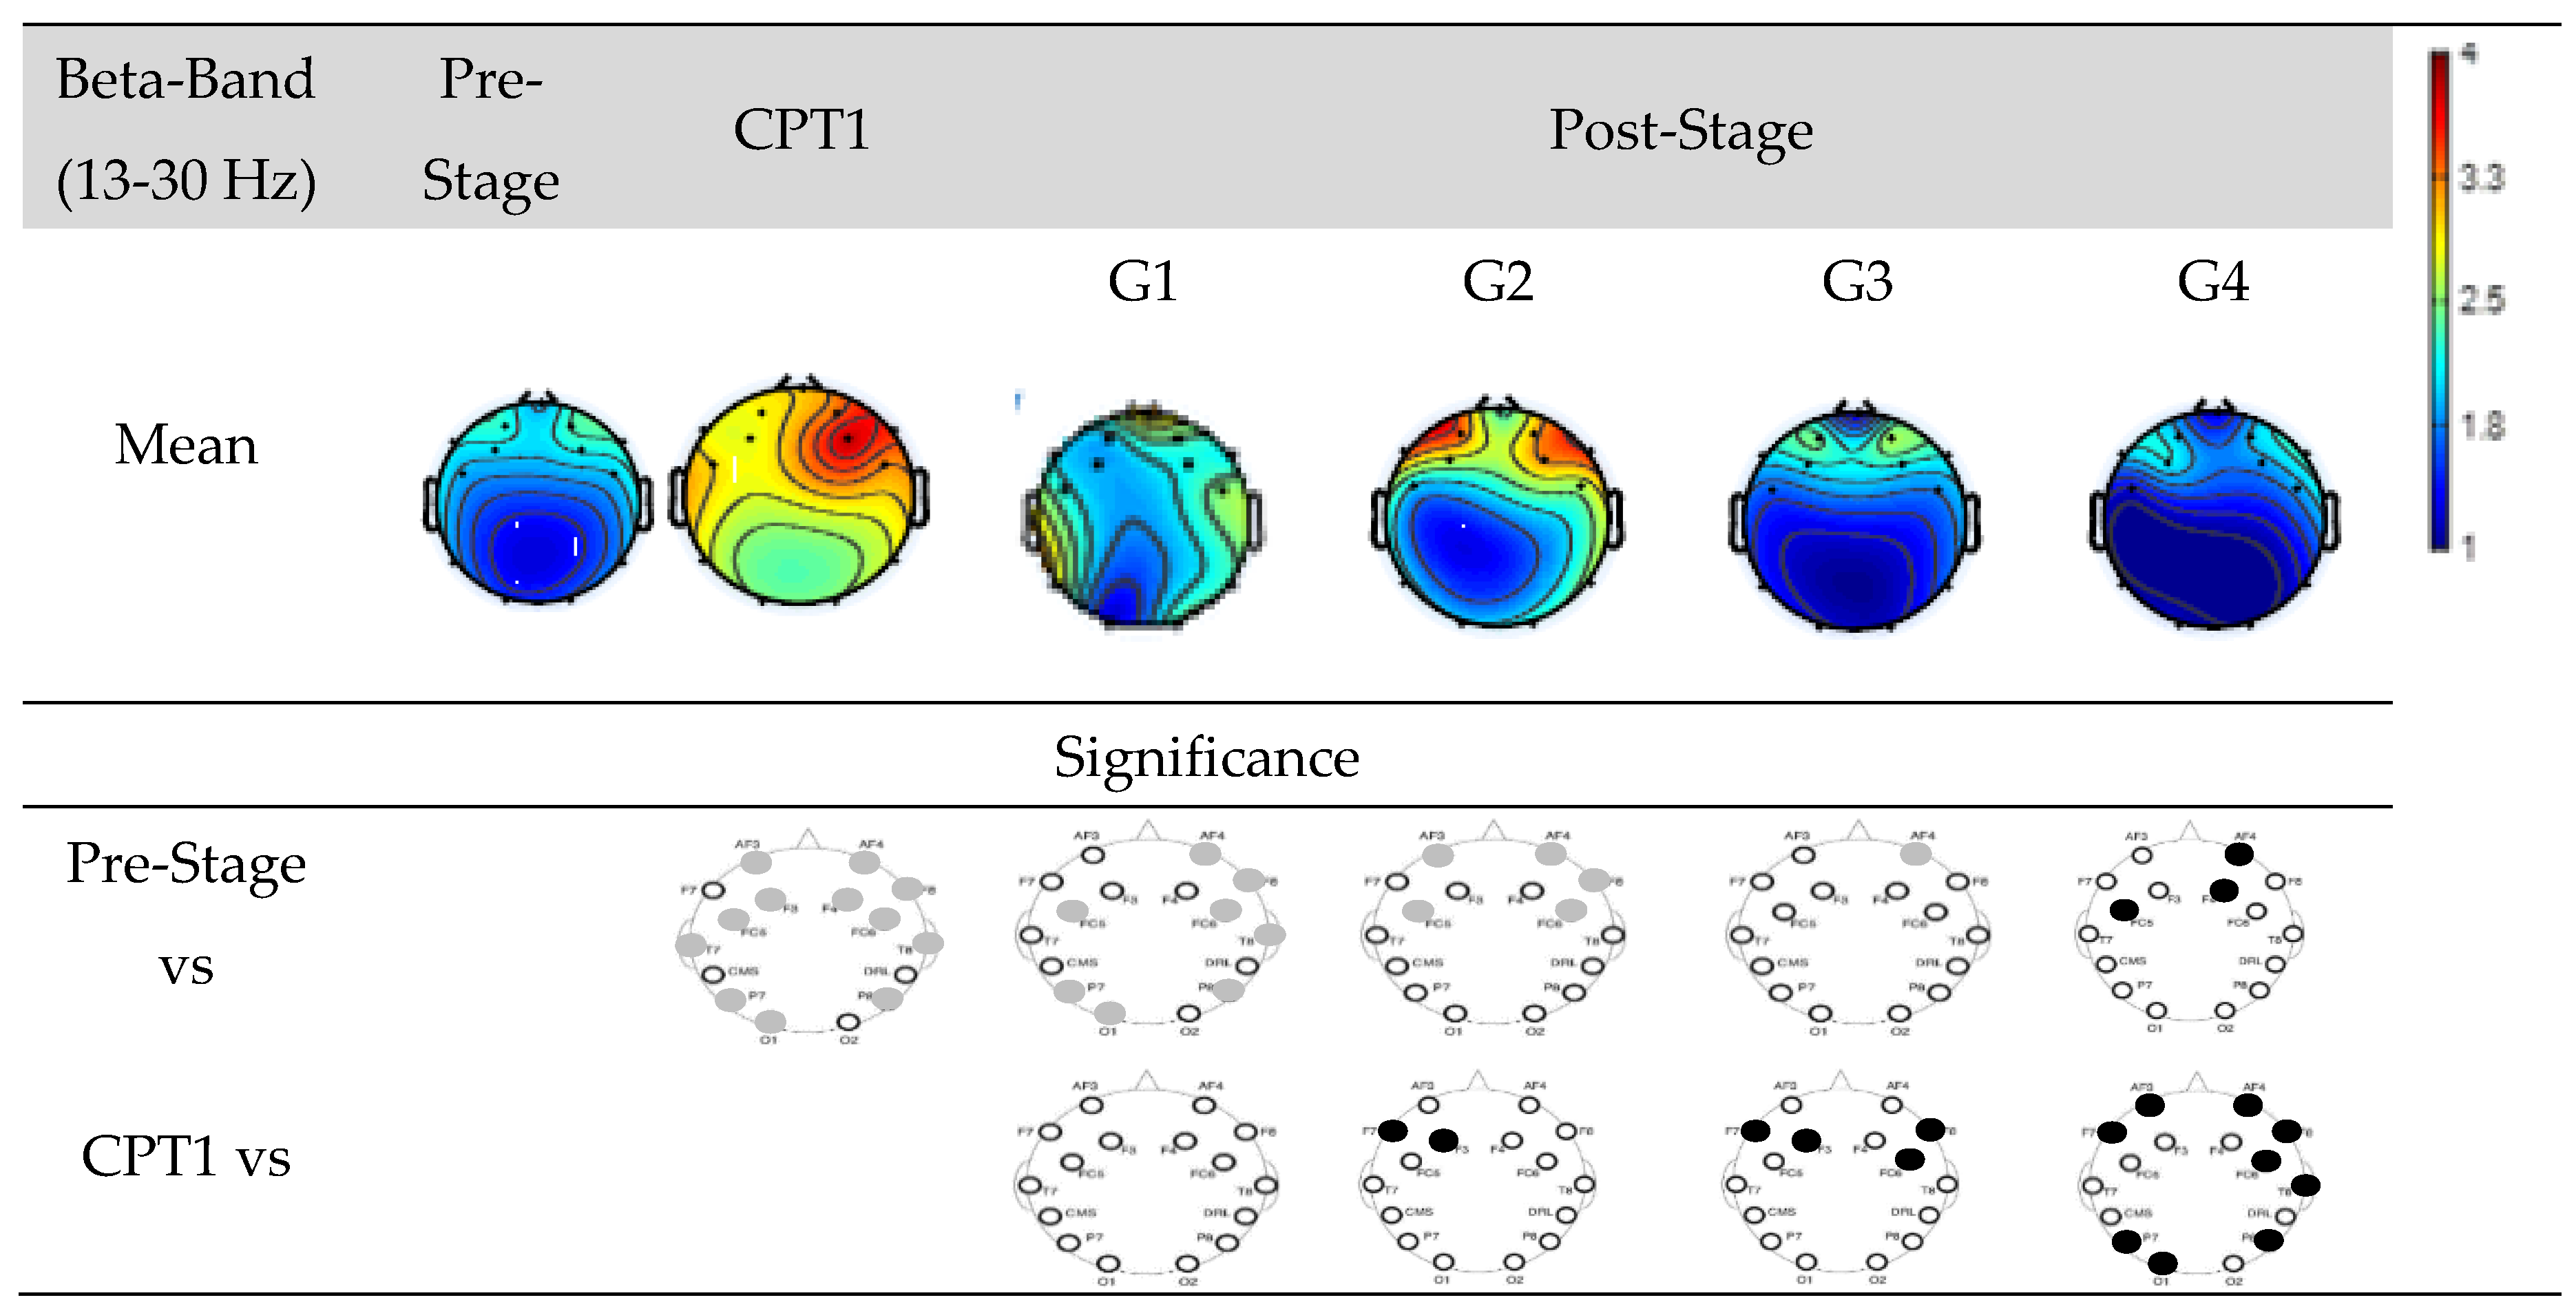
Figure 9 shows EEG power of Groups G1, G2, G3, and G4 within Beta-band. The first row shows the mean power of the Pre-Stage, CPT1, and Post-Stage for each group. The second row shows significant difference between the Pre-Stage and CPT1 as well as Post-Stage across all groups. The third row shows the significant difference between CPT1 vs Post-Stages for all groups. Black circles indicate reductions in significant power and grey circles indicate increases. Specifically, significant global increases in beta power were observed for the CPT1 condition as well as following stages of G1. Beta power also increased significantly in the frontal region on both G2 and G3 in their Post-Stage as compared to Pre-Stages. But there was a significant reduction (Post-Stage) of beta power in the frontal region observed in G4. When compared to the CPT1 condition, G2 and G3 significantly decreased in the frontal region only, while G4 globally decreased.
Figure 10 shows EEG power of Groups G1, G2, G3, and G4 within Gamma-band. The first row shows the mean power of the Pre-Stage, Pain-1, and Post-Stage for each group. The second row shows significant difference between the Pre-Stage and CPT1 as well as Post-Stage across all groups. The third row shows the significant difference between CPT1 vs Post-Stages for all groups. Black circles indicate reductions in significant power and grey circles indicate increases. Specifically, significant global increases in gamma power were observed for the CPT1 condition as compared to Pre-Stage. Gamma power also increased significantly in the parietal and occipital region in the Post-Stage of G1 as compared to Pre-Stage. But there was a significant reduction (Post-Stage) of gamma power on the same region observed in G4. When compared to the CPT1 condition, G1, G2 and G3 exhibited a significantly decrease in the frontal and occipital region only, while G4 displayed a globally decrease.
4. Discussion
The current study investigated the effectiveness of neuromodulation techniques on pain inhibition and cognitive function of attention. This study demonstrates, enhancement of attention and amelioration of pain perception when tDCS and TENS are applied to healthy participants. These improvements are evident by both behavioural/psychological and neurological assessments. Behavioural improvements are observed with improved Stroop task scores for cognition enhancement and pain inhibition noticeable by numeric pain scale ratings supported by neurological evaluation with topoplots spectral analysis.
The novel findings of the study conducted is that anodal-tDCS to DLPFC improves attention; an important fragment of cognition compared to cathodal-tDCS. In contrast, when painful stimulus is administered, cathodal-tDCS stimulations are found effective in augmenting pain inhibition. These findings are extendable to TENS which replicates the same results by supplementing attention and elevating pain perception.
The present study indicates improved Stroop task score with proper identification of geometric shapes and significant reduction of errors for incongruent colour words when anodal-tDCS on DLPFC was administered leading to the inference of enhanced attention level. An improvement of attention by anodal-tDCS was explained by considering the possibility that neuromodulation produces sensation on the scalp that may increase alertness [
40]. These findings are in line with previous studies that exhibit enhanced cognitive abilities with reduced misinterpretation of incompatible colour words [
41,
42,
43]. These results indicate involvement of DLPFC in central executive system of cognitive abilities i.e. WM and attention. In healthy young and older individuals, improved performance in tasks involving memory engagement was reported with cognitive training combined with the administration of tDCS stimulation over prefrontal cortex. Likewise, an improvement of cognitive abilities in response to anodal-tDCS regardless of its location over prefrontal, parietal, or prefrontal/parietal cortex was also demonstrated in a prior study [
44,
45]. This leads to the inference that in healthy individuals as well as in clinical conditions such as Parkinson’s disease, Alzheimer’s dementia and others where cognitive functions are compromised, anodal-tDCS of the DLPFC offers a non-invasive, medication free solution for improvement and enhancement of cognitive functions.
With TENS treatment a significant positive influence on interference score was observed when Stroop task was performed. An improved performance of verbal and visual short term and long-term memory was also experienced with administration of peripheral stimulation in patients suffering from cognitive impairment and decremental memory [
46,
47]. It is also documented in a prior study that application of TENS to median nerve is expected to stimulate brain regions associated with attention [
48,
49]. A positive effect on executive control cognitive functions of small to moderate strength is therefore obvious with TENS stimulation, as it is expected to stimulate prefrontal cortex and anterior cingulate cortex; brain regions that play a crucial role in attention.
An elevated power spectral intensity of theta frequency band accompanied with a reduction in alpha power spectral strength is an attribute of alertness and attentiveness [
50]. Raised intensity of theta frequency band is linked to processing of cognitive information particularly learning, involvement in memory encoding and creative processing [
51,
52]. In the present study power spectrum obtained immediately after Stroop test exhibits an increased theta power and degraded alpha power intensity and is possibly due to activation of definite brain regions in particular prefrontal cortex and anterior cingulate cortex; areas responsible primarily for cognitive functions as observed previously by fMRI, EEG and PET studies [
50,
53,
54,
55]. The findings of the present study are also reflected in prior studies which have reported synchronization of theta along with alpha desynchronization for memory demanding task [
56,
57].
DLPFC could be an appropriate target as indicated in previous studies for mediating the analgesic efficiency of tDCS [
58]. In the present study CPT was employed for the purpose of experimentally inducing cold sensory and painful distractors or pain stimulus. In order to reduce the influence of room temperature on the measures of pain perception it was maintained at a relatively constant level. Participants involved in the present study marked the intensity of pain at tolerance on a numerical pain scale. A reduction in subjective pain score in healthy individuals was observed, indicating improvement of pain inhibition as a result of increased pain perception threshold in post cathodal-tDCS stimulation over DLPFC compared with anodal-tDCS stimulation. This is coherent with the findings of previous studies performed on healthy participants and on patients with traumatic spinal cord injury [
59,
60]. These findings were supported with previous study that demonstrated reduced pain perception when cathodal-tDCS was delivered to somatosensory cortex [
61]. However, an unaltered subjective score of pain threshold were also reported in a previous study [
62].
Contrary to the findings of the present study, anodal-tDCS of DLPFC was reported to increase high thermal pain tolerance threshold. Analogously, an increment in electrical pain threshold was also observed in another study with anodal-tDCS without any comparison to cathodal-tDCS [
31]. Consistent with this, an increment in time latencies to pain threshold and pain tolerance was also observed for anodal-tDCS stimulation of primary motor areas resulting in increases cold pain threshold and tolerance [
63]. Among different regions of the brain, tDCS over motor cortex yields most favourable result for alleviation of chronic pain as indicated in a review of previous studies [
64]. Anodal-tDCS of M1 also exhibited ameliorated chronic pain and so was recommended as a promising method for the treatment and management of such pain specifically as fibromyalgia, neuropathic pain and back pain [
65].
Electrical stimulation to DLPFC by rTMS results in diminished sensitivity to thermal pain indicating an increased tolerance for cold-induced pain in healthy participants was reported in prior studies [
9]. However, these results were obtained with cortical stimulation by rTMS whereas in the present study these results were replicated with cathodal-tDCS.
In present study electrical stimulation with TENS is also found associated with pain relief. Somatic stimulation inhibits pain signals via activation of central and peripheral mechanisms. TENS have found to be an effective non pharmacological treatment in patients suffering from [
66]. An elevated ice pain threshold to relieve experimentally induced cold pain is also noted with conventional electrical stimulation by TENS [
67]. TENS is reported to be effective in relieving experimental and clinical pain by increasing pain threshold in healthy control individuals as well as in clinical pain population and can therefore be used as a complementary treatment to medication [
68]
Multiple studies have been conducted formerly that have employed CPT to study EEG rhythms in healthy individual. In the current study, visual inspection of EEG topographs reveals a significantly raised high frequency (beta and gamma) activity, increase low frequency (theta) activity and a degraded medium frequency (alpha) activity during CPT. These characteristics of EEG power spectrum are in line with previous studies which reflects an increased activity in beta frequency band and diminished activity in alpha frequency band in a cold pain during a comprehensive analysis of EEG power spectrum [
69,
70]. Both alpha and beta rhythms are considered to be a potential indicator of pain where decline in alpha power capacity and elevated beta power intensity constitutes an integral biomarker of pain. An enhanced beta activity has been found to be associated with an increased response in cold pain stimuli. Analogously, a reduction of activity in alpha band have been interpreted as attention processing towards nociceptive signal [
71,
72]. Evidence suggests gamma oscillation is also an indicator of pain perception and pain processing and is found to be associated with intensity of perceived pain. A significant enhancement of total gamma power post induction of pain in healthy individuals corresponds to the fact of paying more attention to pain causing stimuli [
73].
A reduced gamma activity and an increased alpha and theta activity post administration of TENS and tDCS (anodal and cathodal) is evident in present study. This is consistent with the findings of previous studies which indicates enhanced alpha power and reduced activity of gamma band, triggered when diverting attention from pain processing and thereby exhibiting effectiveness of neuromodulation in healthy participants [
74]. The efficacy of neuromodulation methods can be explained by the brain gate theory in such a way that the electrical stimulation from these modalities delivers an even stronger input to central nervous system compared to pain which in turn restrains and block transmission and processing of nociceptive stimuli from neuron to brain.
While unveiling the dual benefits of TENS and tDCS for pain relief and cognitive enhancement in healthy individuals, this study has inherent limitations. The exclusive focus on healthy participants may limit direct applicability to clinical populations. Short-term assessments might not fully capture long-term effects, and the individual comparison of anodal/cathodal-tDCS and TENS leaves questions about relative effectiveness. Moreover, the duration for which the effect of neuromodulation endured was not elucidated. Furthermore, the neurological changes in the deep cortical structures and connectivity changes in brain regions related to pain matrix and cognitive functions are not investigated [
75,
76,
77]. Notwithstanding, the findings confirm the efficacy of TENS and tDCS as possible non-drug therapeutic alternatives, for cognition as well as alleviation from pains.
Figure 1.
Experimental setup and protocols for EEG data collection. Experimental procedure is categorized into four (G1-G4), where G1 is being used as a control while G2-G4 were subjected to special neuromodulation interventions (TENS, Anodal-tDCS) and Cathodal-tDCS).
Figure 1.
Experimental setup and protocols for EEG data collection. Experimental procedure is categorized into four (G1-G4), where G1 is being used as a control while G2-G4 were subjected to special neuromodulation interventions (TENS, Anodal-tDCS) and Cathodal-tDCS).
Figure 2.
Standardized 11-point Numeric Pain Scale. ‘0’ represents no pain and ‘10’ represents to extremely sever pain.
Figure 2.
Standardized 11-point Numeric Pain Scale. ‘0’ represents no pain and ‘10’ represents to extremely sever pain.
Figure 3.
Pictorial representation of the Stroop task used in the study. For congruent pairs of geometric shapes color and Text colors, participants pressed the right arrow; for incongruent pairs, they pressed the left one.
Figure 3.
Pictorial representation of the Stroop task used in the study. For congruent pairs of geometric shapes color and Text colors, participants pressed the right arrow; for incongruent pairs, they pressed the left one.
Figure 4.
Pain Assessment. Comparison between CPT1 (black bars) and CPT1pain assessments (gray bars) for all four groups (G1, G2, G3 and G4) The subfigure (a) shows mean pain intensity level obtained by participants while subfigure (b) shows mean pain tolerance level. Significant changes (P<0.05) are marked by ‘*’ above the bars.
Figure 5.
Stroop task performance. Comparison between cognitive task (i.e. Stroop task score) for Stroop Test1 (black bars) and Stroop Test2 (gray bars) for all four groups (G1, G2, G3 and G4). Significant changes (P<0.05) are marked by ‘*’ above the bars.
Figure 5.
Stroop task performance. Comparison between cognitive task (i.e. Stroop task score) for Stroop Test1 (black bars) and Stroop Test2 (gray bars) for all four groups (G1, G2, G3 and G4). Significant changes (P<0.05) are marked by ‘*’ above the bars.
Figure 6.
EEG Power in Groups G1, G2, G3 and G4 within the delta-band. The first row shows the mean of the Pre-Stage, CPT1 and Post-Stage for each group (G1, G2, G3 and G4). The second row show the significant difference between Pre-Stage vs CPT1, and Pre-Stage vs Post-Stage across all groups. The third row show the significant difference between CPT1 vs Post-Stage for all groups. Reductions in significant power are denoted by black, while increases are represented by grey.
Figure 7.
EEG Power in Groups G1, G2, G3 and G4 within the theta-band. The first row shows the mean of the Pre-Stage, CPT1 and Post-Stage for each group (G1, G2, G3 and G4). The second row show the significant difference between Pre-Stage vs CPT1, and Pre-Stage vs Post stage across all groups. The third row show the significant difference between CPT1 vs Post-Stage for all groups. Reductions in significant power are denoted by black, while increases are represented by grey.
Figure 8.
EEG Power in Groups G1, G2, G3 and G4 within the Alpha-band. The first row shows the mean of the Pre-Stage, CPT1 and Post-Stage for each group (G1, G2, G3 and G4). The second row show the significant difference between Pre-Stage vs CPT1, and Pre-Stage vs Post-stage across all groups. The third row show the significant difference between CPT1 vs Post-Stage for all groups. Reductions in significant power are denoted by black, while increases are represented by grey.
Figure 9.
EEG Power in Groups G1, G2, G3 and G4 within the Beta-band. The first row shows the mean of the Pre-Stage, CPT1 and Post-Stage for each group (G1, G2, G3 and G4). The second row show the significant difference between Pre-Stage vs CPT1, and Pre-Stage vs Post-Stage across all groups. The third row show the significant difference between CPT1 vs Post-Stage for all groups. Reductions in significant power are denoted by black, while increases are represented by grey.
Figure 10.
EEG Power in Groups G1, G2, G3 and G4 within the Gamma-band. The first row shows the mean of the Pre-Stage, CPT1 and Post-Stage for each group (G1, G2, G3 and G4). The second row show the significant difference between Pre-Stage vs CPT1, and Pre-Stage vs post stage across all groups. The third row show the significant difference between CPT1 vs Post stage for all groups. Reductions in significant power are denoted by black, while increases are represented by grey.
