Preprint
Article

A Method to Estimate Climate Drivers of Maize Yield Predictability Leveraging Genetic-by-Environment Interactions in the US and Canada

Altmetrics

Downloads

116

Views

51

Comments

0

A peer-reviewed article of this preprint also exists.

This version is not peer-reviewed

Submitted:

15 March 2024

Posted:

18 March 2024

You are already at the latest version

Alerts
Abstract
Throughout history, the pursuit of diagnosing and predicting crop yields has evidenced genetics, environment, and management practices' intertwined roles in achieving food security. However, the sensitivity of crop phenotypes and genetic responses to weather and climate remains unclear, hampering the identification of the underlying abilities of plants to adapt to climate change. We hypothesize that the PAWN global sensitivity analysis (GSA) coupled with a genetic by environment (GxE) model -built of environmental covariance and genetic markers structures- can evidence the contributions of climate on the predictability of maize yields in the U.S. and Ontario, Canada (US-CA). The GSA-GxE modeling framework estimates the relative contribution of climate variables such as solar radiation, temperature, rainfall, and relative humidity on improving maize yield predictions in US-CA. We use an improved version of the Genomes to Fields (G2F) initiative multi-dimensional database to build the environmental covariance matrices for the proposed GSA-GxE framework. The PAWN indices show that the aggregated GxE model’s highest sensitivity levels over US-CA were attributed to solar radiation, temperature, rainfall, and relative humidity. In one-third of the locations, rainfall was the primary climate variable responsible for maize yield predictability. Also, a consistent pattern of top sensitivity indices by location indicates that Relative Humidity, Solar Radiation, and Temperature were distributed as the main or the second most relevant drivers of maize yield predictability.
Keywords: 
Subject: Biology and Life Sciences  -   Agricultural Science and Agronomy

1. Introduction

Maize (Zea mays L.) adaptability is a spatiotemporal expression of the organism’s genetic and phenotypic responses to its environment. The study of maize blends scientific and technological advancements with cultural identities, agronomic practices, and variable climate conditions, making it one of the world’s top cereals, a critical resource to meet our future food security, and a pilar of civilizations [1,2,3,4,5]. Efforts to understand crop responses to volatile climate are recorded by plant’s organic and production variables [6,7,8]. Predicting those responses requires integrating inherently uncertain genetic, climate, phenotypic and management data to elucidate the underpinning processes responsible for the plants’ abilities to adapt. While such uncertainties challenge the diagnosis and prediction of crops’ yields in a changing climate using statistical and data-driven models, they can also be used to identify the areas of model improvement and the explicit or implicit integration of OMICS and climate data [9,10,11,12,13,14,15,16,17,18,19,20,21,22].
The sensitivity of observations, numerical, and empirical estimations of crop production to climate variations have fostered human ingenuity to adapt crops to a changing environment. Environmental factors such as temperature and precipitation [23,24,25,26], temperature thresholds [27], increasing global temperature [6], and climate variability and change projections [28,29,30,31,32] affect the responses of crops to a changing climate and how we quantify them. Inherent uncertainties in climate variables also represent a challenge to identify the genomic and phenotype responses to a changing environment, propagating errors and affecting the projections of more physiologically efficient crop varieties, the expansion of agriculture, and the same sustainability of crop productivity [28,33,34,35,36,37,38,39,40,41]. Furthermore, climate variability and change continuously trigger crop performance losses, compromising food security across multiple geographic and productive scales [31,42] and challenging breeding efforts [5,13,40,41,43,44,45,46,47].
Uncertainty in model inputs can lead to estimating the relative importance of model parameters or input variations by analyzing the propagation of input errors to outputs [48,49,50,51,52,53,54,55] or implementing global sensitivity analyses [56,57,58,59,60,61]. Local and global sensitivity analyses have been coupled to multiple models, for example, local sensitivity analyses have been used to determine that the outputs vary according to changes in the inputs around a specific point of the feasible input domain. In contrast, global sensitivity analyses (GSA) cover an entire viable input space to recognize the output sensitivity level. In this study, we developed a conceptual modeling framework to estimate the global sensitivity of maize phenotype predictability to variations in climate variables.
Crop phenomics modeling studies analyze the sensitivity of crop traits to environmental and management factors using biophysical models. The authors [62] analyzed the sensitivity of CERES-Maize yield predictions to solar radiation and soil properties, showing a higher sensitivity of the model to solar radiation, and to less extent to soil properties. The authors [63] applied q-factorial design GSA method to the CSM-CROPGRO-Cotton model to rank 16 input parameters to assess the variability in cotton yields. Their results indicated that the specific leaf area of the cultivar under standard growth conditions is the most effective model parameter. However, the continuous responses of organisms to a changing environment require the implementation of sensitivity analyses that can reduce the errors in simulated phenotypes at high-frequency time steps [64], high parameter dimensionality [65], and multi-scale environmental changes [66]. While these studies use biophysical models to unveil the complexity of crop model sensitivity levels to various hydroclimatic factors, it remains unclear how climate and climate-genetic interactions affect crop phenotypes. A pertinent question for the present research endeavor is: What are the climate variables that drive improvements in the predictability of maize yields across one of the most productive agricultural systems in the world?
To answer this question, this study rests in three premises: (1) Previous studies found a high sensitivity of maize yield simulations in the U.S. to climatic drivers such as temperature, solar radiation, precipitation, and relative humidity [67,68,69,70,71]; (2) the enhancement of OMICS and climate data indicate that the associated interactions between climate variables and the genetic markers lead to improvements in maize yield predictions [17,19]; and (3) climate variation and changes are integrated into multiple environmental covariance matrices with genetic marker data to predict phenotypes [72]. Since the sensitivity of maize yields to climate variability and change is an inherent element of breeding practices and an opportunity to couple a GSA model, we hypothesize that a global sensitivity analysis (GSA) [73] coupled with integrated environmental covariance and genetic markers structures –and built in a genetic by environment (GxE) model [9] —can identify the contribution of climate uncertainties on the predictability of maize yields in the G2F area of study. The latter is a statistical modeling approach that uses the environmental covariance matrices to simulate the direct and interactive effects between genetics and the environment on crop yields. The covariance structure synthesizes the environmental co-variability among tested environments in the GxE model. A novelty of this work relies on using PAWN [74] as an efficient, easy-to-interpret, and density-based technique for identifying and prioritizing environmental factors. The PAWN technique contrasts unconditional and conditional phases to quantify the sensitivity of model outputs, indicative of model performance to the uncertainty in input climate variables.
The GSA-GxE coupling modeling system uses the environmental covariance matrices to integrate climate variables and estimate the sensitivity of maize yield predictions to uncertainties in solar radiation, temperature, rainfall, and relative humidity across the US and the province of Ontario in Canada (US-CA). We use the improved Genomes to Field (G2F) database [17,18,19,74], conformed by maize OMICs (i.e., genetic and phenotypic) and environmental datasets. This database is used to test the GSA-GxE framework, summarized in section 2.1. In section 2.2., the GxE model’s equations and the environmental covariance matrix structure to incorporate genetic and environmental interactive effects on maize yield predictability are described, respectively. Afterward, the PAWN’s technique as a GSA method and the conceptualization of the GSA-GxE framework for quantifying the GxE model predictive skill sensitivity to environmental drivers is provided in section 2.3. Next, section 3 reviews and discusses the results and findings of the study. Finally, the concluding remarks on GxE performance sensitivity to environmental factors are summarized in section 4.

2. Materials and Methods

2.1. Database and Data Availability

2.1.1. Multi-Dimensional Genomes to Field (G2F) Database

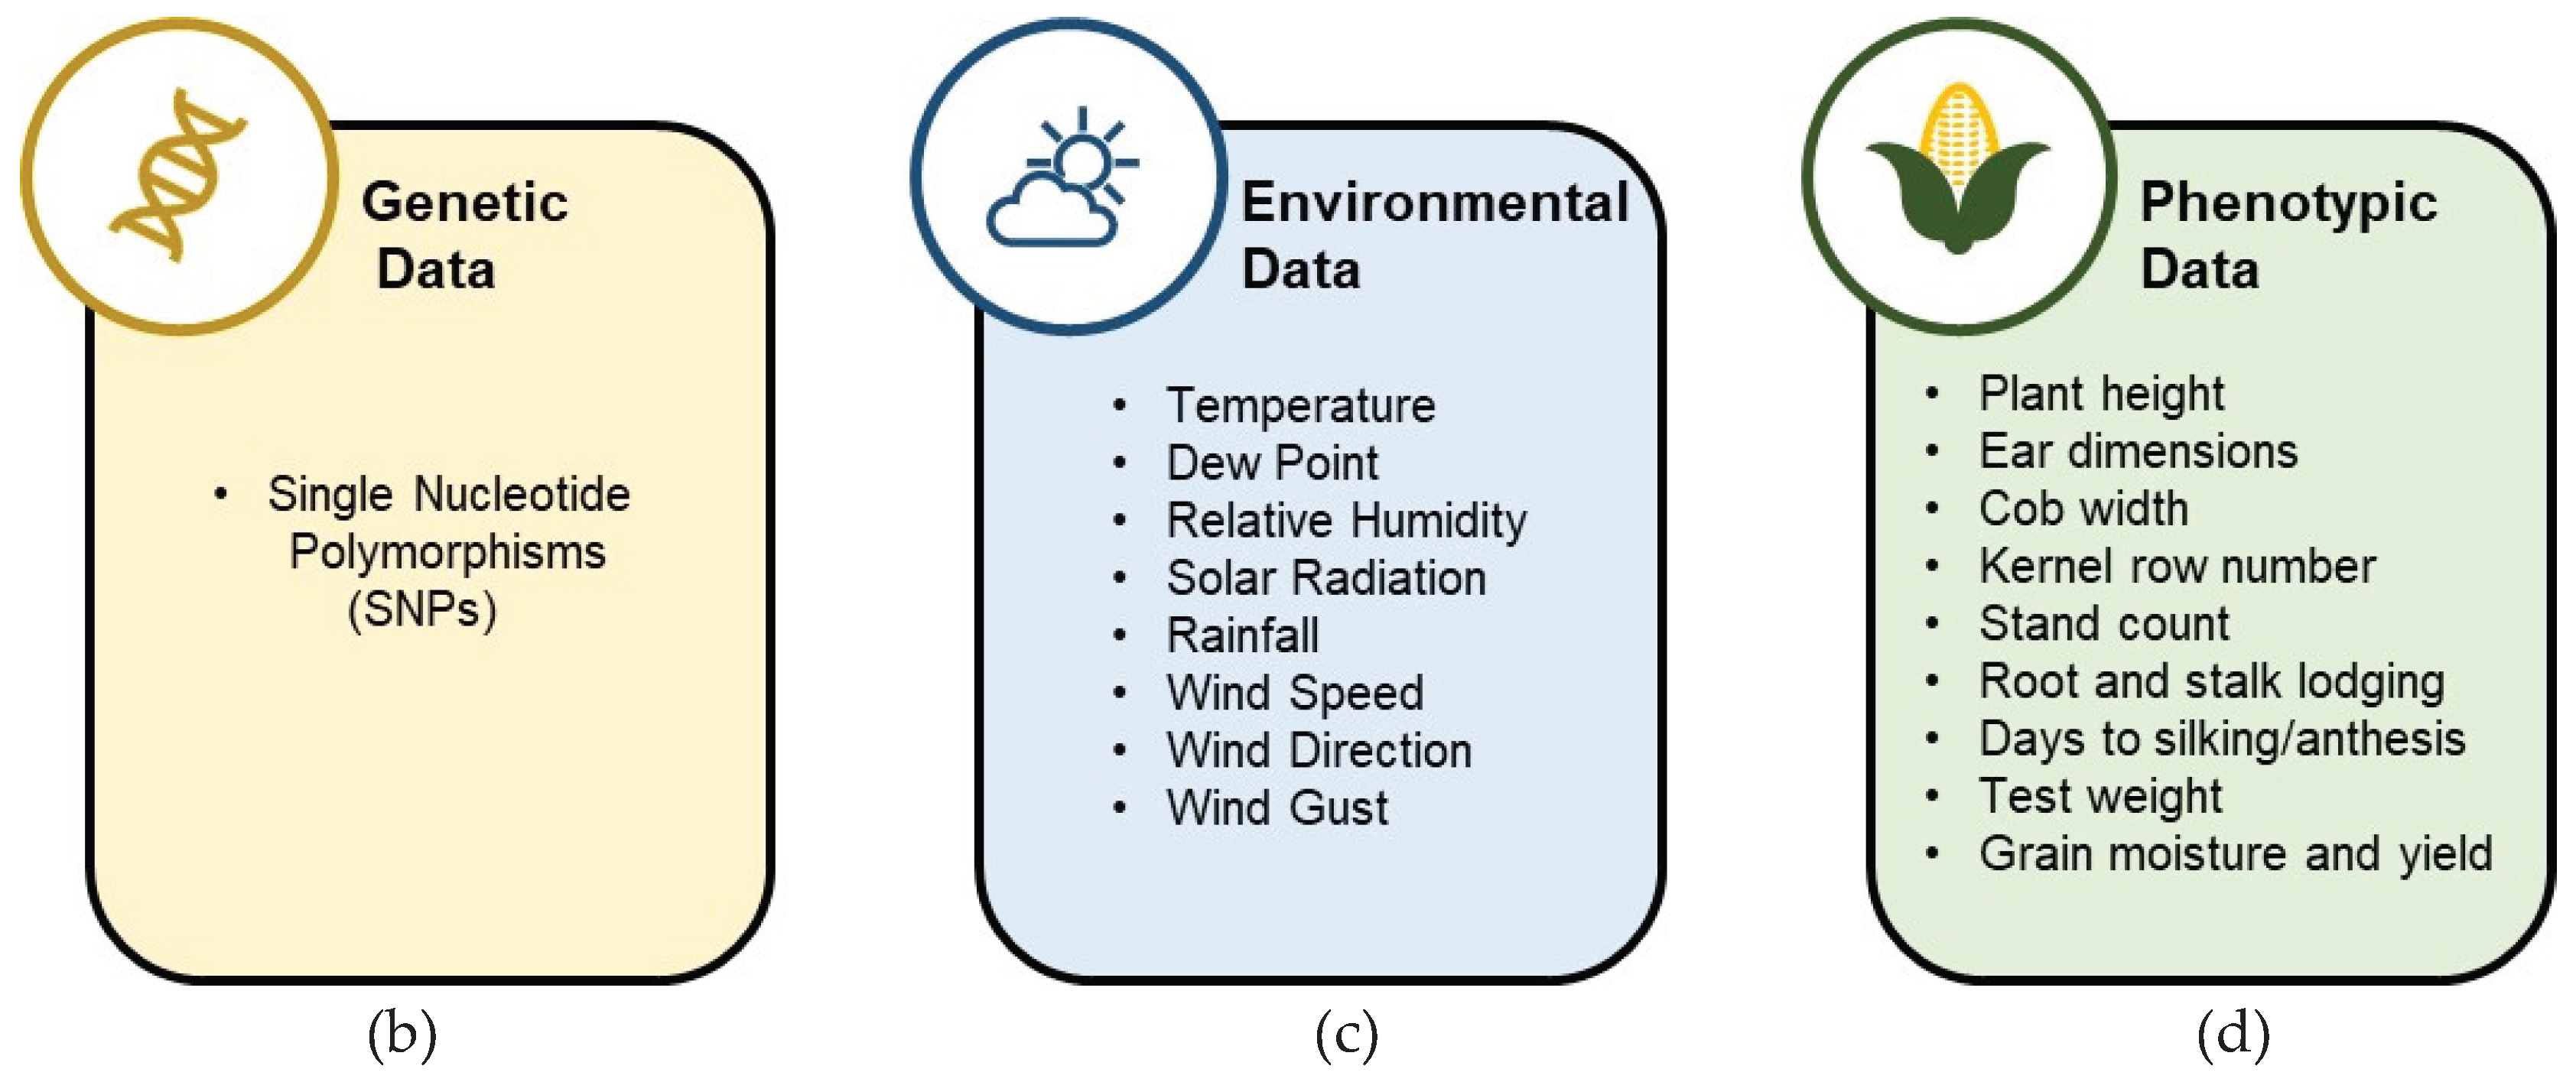
This study used an enhanced version of the Genomes to Field (G2F) initiative database [17,18,19,74] to test the proposed GSA-GxE coupling system. The G2F database comes from a public-private collaboration in North America to provide multi-dimensional data consisting of maize OMICs datasets and major environmental drivers in phenotypes [75]. The G2F initiative, initiated in 2014, implemented several maize test plots in the U.S. and the province of Ontario in Canada (see Figure 1a) to track, record, integrate, and provide large-scale, multi-year, and multi-environment information for researchers and the public. The G2F initiative releases annually three data categories, including maize genetic markers (G2F-G), phenotypic measurements (G2F-P), and environmental information (G2F-E) averaged across 25 experimental fields through its official website [75]. Figure 1 lists the observed and recorded variables in each mentioned category. Here we processed an improved version of the G2F data with 84 experimental fields between 2014 and 2017. This database is the foundation of the built and tested environmental covariance matrix used by the GSA-GxE framework.

2.1.2. G2F-E Pre-Processing

Before testing the GSA-GxE framework, the G2F database requires pre-processing to be ready for further analysis. A pre-processing methodology has been applied to assign each experiment to a unique ID. As can be seen in [17], the first four digits in each ID represent the conducted year of the experiment. The following two characters show the state of the field location, and the last two characters refer to the assigned number for the hybrid experiments. For example, “2015NEH1” represents a maize hybrid experiment called H1 located in the state of NE and conducted in 2015. Since this study focuses on yield predictive skill sensitivity to hydroclimatic drivers, the G2F-E datasets are briefly explained below. More information on G2F-G and G2F-P is provided in [17,72].
At each G2F experimental plot, eight hydroclimatic variables, including temperature (T) [°C], dew point (DP) [°C], relative humidity (RH) [%], solar radiation (SR) [W2/m], rainfaI(R) [mm], wind speed (WS) [m/s], wind direction (WD) [degrees], and wind gust (G) [m/s] have been measured and recorded in 30-min time intervals by a weather station located in the field during the maize growing season. For this study, the sensitivity analysis consists of four hydroclimatic variables including T, RH, SR, and R. For more details about the collecting techniques, see the G2F website [75]. All environmental time series released by G2F have been downloaded, analyzed, and controlled for completeness and consistency for this study. The deep learning data-driven model has imputed the gaps and missing samples explained in [17]. In many cases, more than one experiment has been conducted in the exact location. This scenario indicates that the recorded G2F-E time series is the same for such experiments at the same sites.

2.2. Modeling the GxE Interactions

Crop phenotypes are an expression of the crop’s genetics, environmental conditions, and their interactions [9,76,77]. Understanding such factors contribute to develop diagnostic and prognostic models, guiding more informed agronomic recommendations according to complex patterns of climate variability and change.
The GxE-based models use environmental covariance matrices paired with genetic markers to predict maize yields [9]. The methodology below introduces the analysis of global sensitivity of phenotype predictions for a regional experiment defining the GxE model as:
Y i j k =   μ +   w i j +   g j   +   ( g w ) i j +   ε i j k
where, Y i j k is maize phenotypic response variable (i.e., grain yield) of plant kth of genotype line j tested in environment i, μ is the overall mean from all observations, w i j is the representation of the main environmental condition effect i faced by maize line j in each enviIonment i, g j is representation of main genetic effect of maize line j, ( g w ) i j is the interaction term between maize line j and environmental conditions in envIronment i, and ε i j is error term.
The authors [9] proposed an extension of genomic-best linear unbiased predictors to incorporate genetic and environmental gradients. In this approach, the genetic and environmental gradients are defined as linear phenotypic regressions with molecular Markers Covariates (MCs) and with Environmental Covariates (ECs), respectively, as follows:
g j = m = 1 p x j m b m
w i j = q = 1 Q W i j q γ q
where, x j m is the genotype of the j t h at the m t h MC, b m is the effect of m t h MC, p is the total number of MCs, W i j q is the value of q t h EC in the i j t h environment × maize line combination, γ q is the main effet of q t h EC, and Q is the total number of ECs.
We assume both markers and environments effect ( b m and γ q ) are identically normal distributed as follows:
b m   ~ N ( 0 , σ b 2 )
γ q ~ N ( 0 , σ γ 2 )
where, N is noted as normal distribution.
The genetic and environmental main effects in Eq. (1) follow multivariate normal distribution as below:
g ~ N ( 0 , G σ g 2 )   where   G = 1 P X X '
w ~ N ( 0 , Ω σ w 2 )   where   Ω = 1 Q W W '
where, G is the covariance structure describing the similarities between each pair of maize lines and computed based on MCs. The covariance structure Ω describes the similarities between environmental conditions of each pair of environments and computed based on ECs.
Based on the above, the interaction in the covariance structure is defined in Eq. (8) as the Schur product of G and Ω :
w g = w g i j =   g j × w i   w g ~ N ( 0 , G # Ω . σ G W 2 )
Similar to other components in the modeling phenotypes described above, the error term also is normally distributed with null mean and variance σ ϵ 2 as below:
ε i j k   ~ N ( 0 , σ ϵ 2 )
The covariance matrices are the metrics of similarity for the genetic and the environment between each pair of genomes in genetic covariance matrix G and each pair of environments in the environmental covariance matrix Ω , respectively. To analyze the sensitivity of GxE performance to environmental drivers, the environmental covariance matrix represents the link between the GxE model and the GSA’s PAWN technique. The structure of the environmental covariance matrix is presented below in more detail.

2.2.1. Environmental Covariates (ECs) and Environmental Covariance Matrix Structure

The authors [9] states that there is not a linear relationship between the effects of ECs and the crop traits. As a result, ECs cannot flawlessly deliver the hydroclimate time series impacts on the yield values. Thus, they proposed incorporating the environmental covariance function and its interactive effect with genetic covariance function as environmental similarity criteria to borrow information between environments. Authors [26] also showed the combined effect of changing climatic variables, represented by the interaction among T, R, and SR, influencing maize yields. These authors suggest that in analyzing the sensitivity of crops’ yields to the variability of a single climate variable, the co-variability among the main climatic drivers should be expanded for crop growth diagnostics. That is why we have taken the advantage of the environmental covariance matrix ( Ω ) calculated from the hydroclimatic time series (ECs) to measure the environmental co-variability between G2F experiments in Equation (1). Consequently, this model incorporates a compound environmental similarity, rather than one single hydroclimate variable to simulate the crop phenotypes.
The environmental variance-covariance matrix ( Ω ) is a square matrix that provides the variances of a given random vector, which diagonal elements are the ECs time series for each G2F location. The covariances between each pair of independent random vectors (i.e., ECs) are the upper/lower off-diagonal elements of the matrix. The covariance values measure the joint variability between each pair of ECs time series. A higher covariance is a measure of the strength of the environmental relationships between G2F experiments. The environmental covariance matrix integrates multi-dimensional data from ECs of all the G2F locations in a single structure containing all the climate conditions from the entire set of experiments during the studied years.
In this study, we designed E C s m × q matrix to calculate the Ω . The E C s m × q contains 15 environmental time series from M G2F experiments including daily minimum temperature (Tmin), mean temperature (Tmean), maximum temperature (Tmax), minimum dew point (DPmin), mean dew point (DPmean), maximum dew pint (DPmax), minimum relative humidity (RHmin), mean relative humidity (RHmean), maximum relative humidity (RHmax), minimum solar radiation (SRmin = 0), mean solar radiation (SRmean), maximum solar radiation (SRmax), accumulative rainfall (Racc), mean wind speed (WSmean), and mean wind direction (WDmean), respectively. All environmental data is extracted from the enhanced G2F database [18]. The q is the length of growing season in days multiplied by the number of considered climatic variables. The general E C s and Ω matrix structures are shown below:
E C s = E C 11 E C 1 q E C m 1 E C m q m = 1 ,   ,   M
Ω = V a r E C 1 C o v   ( E C 1 ,   E C 2 ) C o v   ( E C 1 ,   E C m ) C o v   ( E C 2 , E C 1 ) V a r E C 2 C o v   ( E C 2 ,   E C m ) C o v   ( E C m ,   E C 1 ) C o v   ( E C m ,   E C 2 ) V a r E C m
where, E C m q   is the daily environmental time series observation, q is the total number of environmental covariables, V a r E C m is the variance of environmental time series in G2F experiment m , and C o v   E C 1 ,   E C 2 =   C o v   E C 2 , E C 1 is the covariance of the climate time series between the G2F experiment 1 and 2.
The elements in the E C s are standardized to calculate the variance-covariance matrix Ω , which contains the variance of each G2F environmental time series and the covariance between each pair of G2F climate time series calculated according to the following equations:
v a r   E C m =   1 n i = 1 N ( E C i E C ¯ ) 2
c o v   ( E C 1 ,   E C 2 ) = ( E C 1 E C ¯ 1 ) ( E C 2 E C ¯ 2 ) q
where, v a r   E C m is the variance of the ECs time series in G2F experiment m , c o v   ( E C 1 ,   E C 2 ) is the covariance of ECs time series in G2F experiment 1 and 2, E C i is the standardized value of ECs at day i , and E C ¯ is the average of standardized ECs in the whole time series.
We processed 84 G2F experimental locations across the US and Ontario in Canada to test the proposed GSA-GxE framework. In these locations, 372 maize lines were grown, 8,171 individuals yield measurements, and 15 climate variables were registered during 79-day long growing season between 2014 and 2017. The ECs matrices were built from the 15 climate time series (i.e., Tmin, Tmean, Tmax, DPmin, DPmean, DPmax, RHmin, RHmean, RHmax, SRmin, SRmean, SRmax, Racc, WSmean, and WDmean). The total number of environmental covariables in each G2F experiments is q = 79 × 15 = 1185 .

2.2.3. PAWN Global Sensitivity Analysis (GSA)

The PAWN GSA technique is a density-based GSA method that provides the sensitivity index of model output to input variations based on a Cumulative Distribution Function (CDF) developed by [73]. The PAWN methodology the function between output and inputs is described as Eq. (14):
Y = f ( X 1 ,   X 2 ,   ,   X i )
where Y is the output of a model, f   is the relationship between input(s) and output, and X 1 ,   X 2 ,   ,   X i are the inputs to the model.
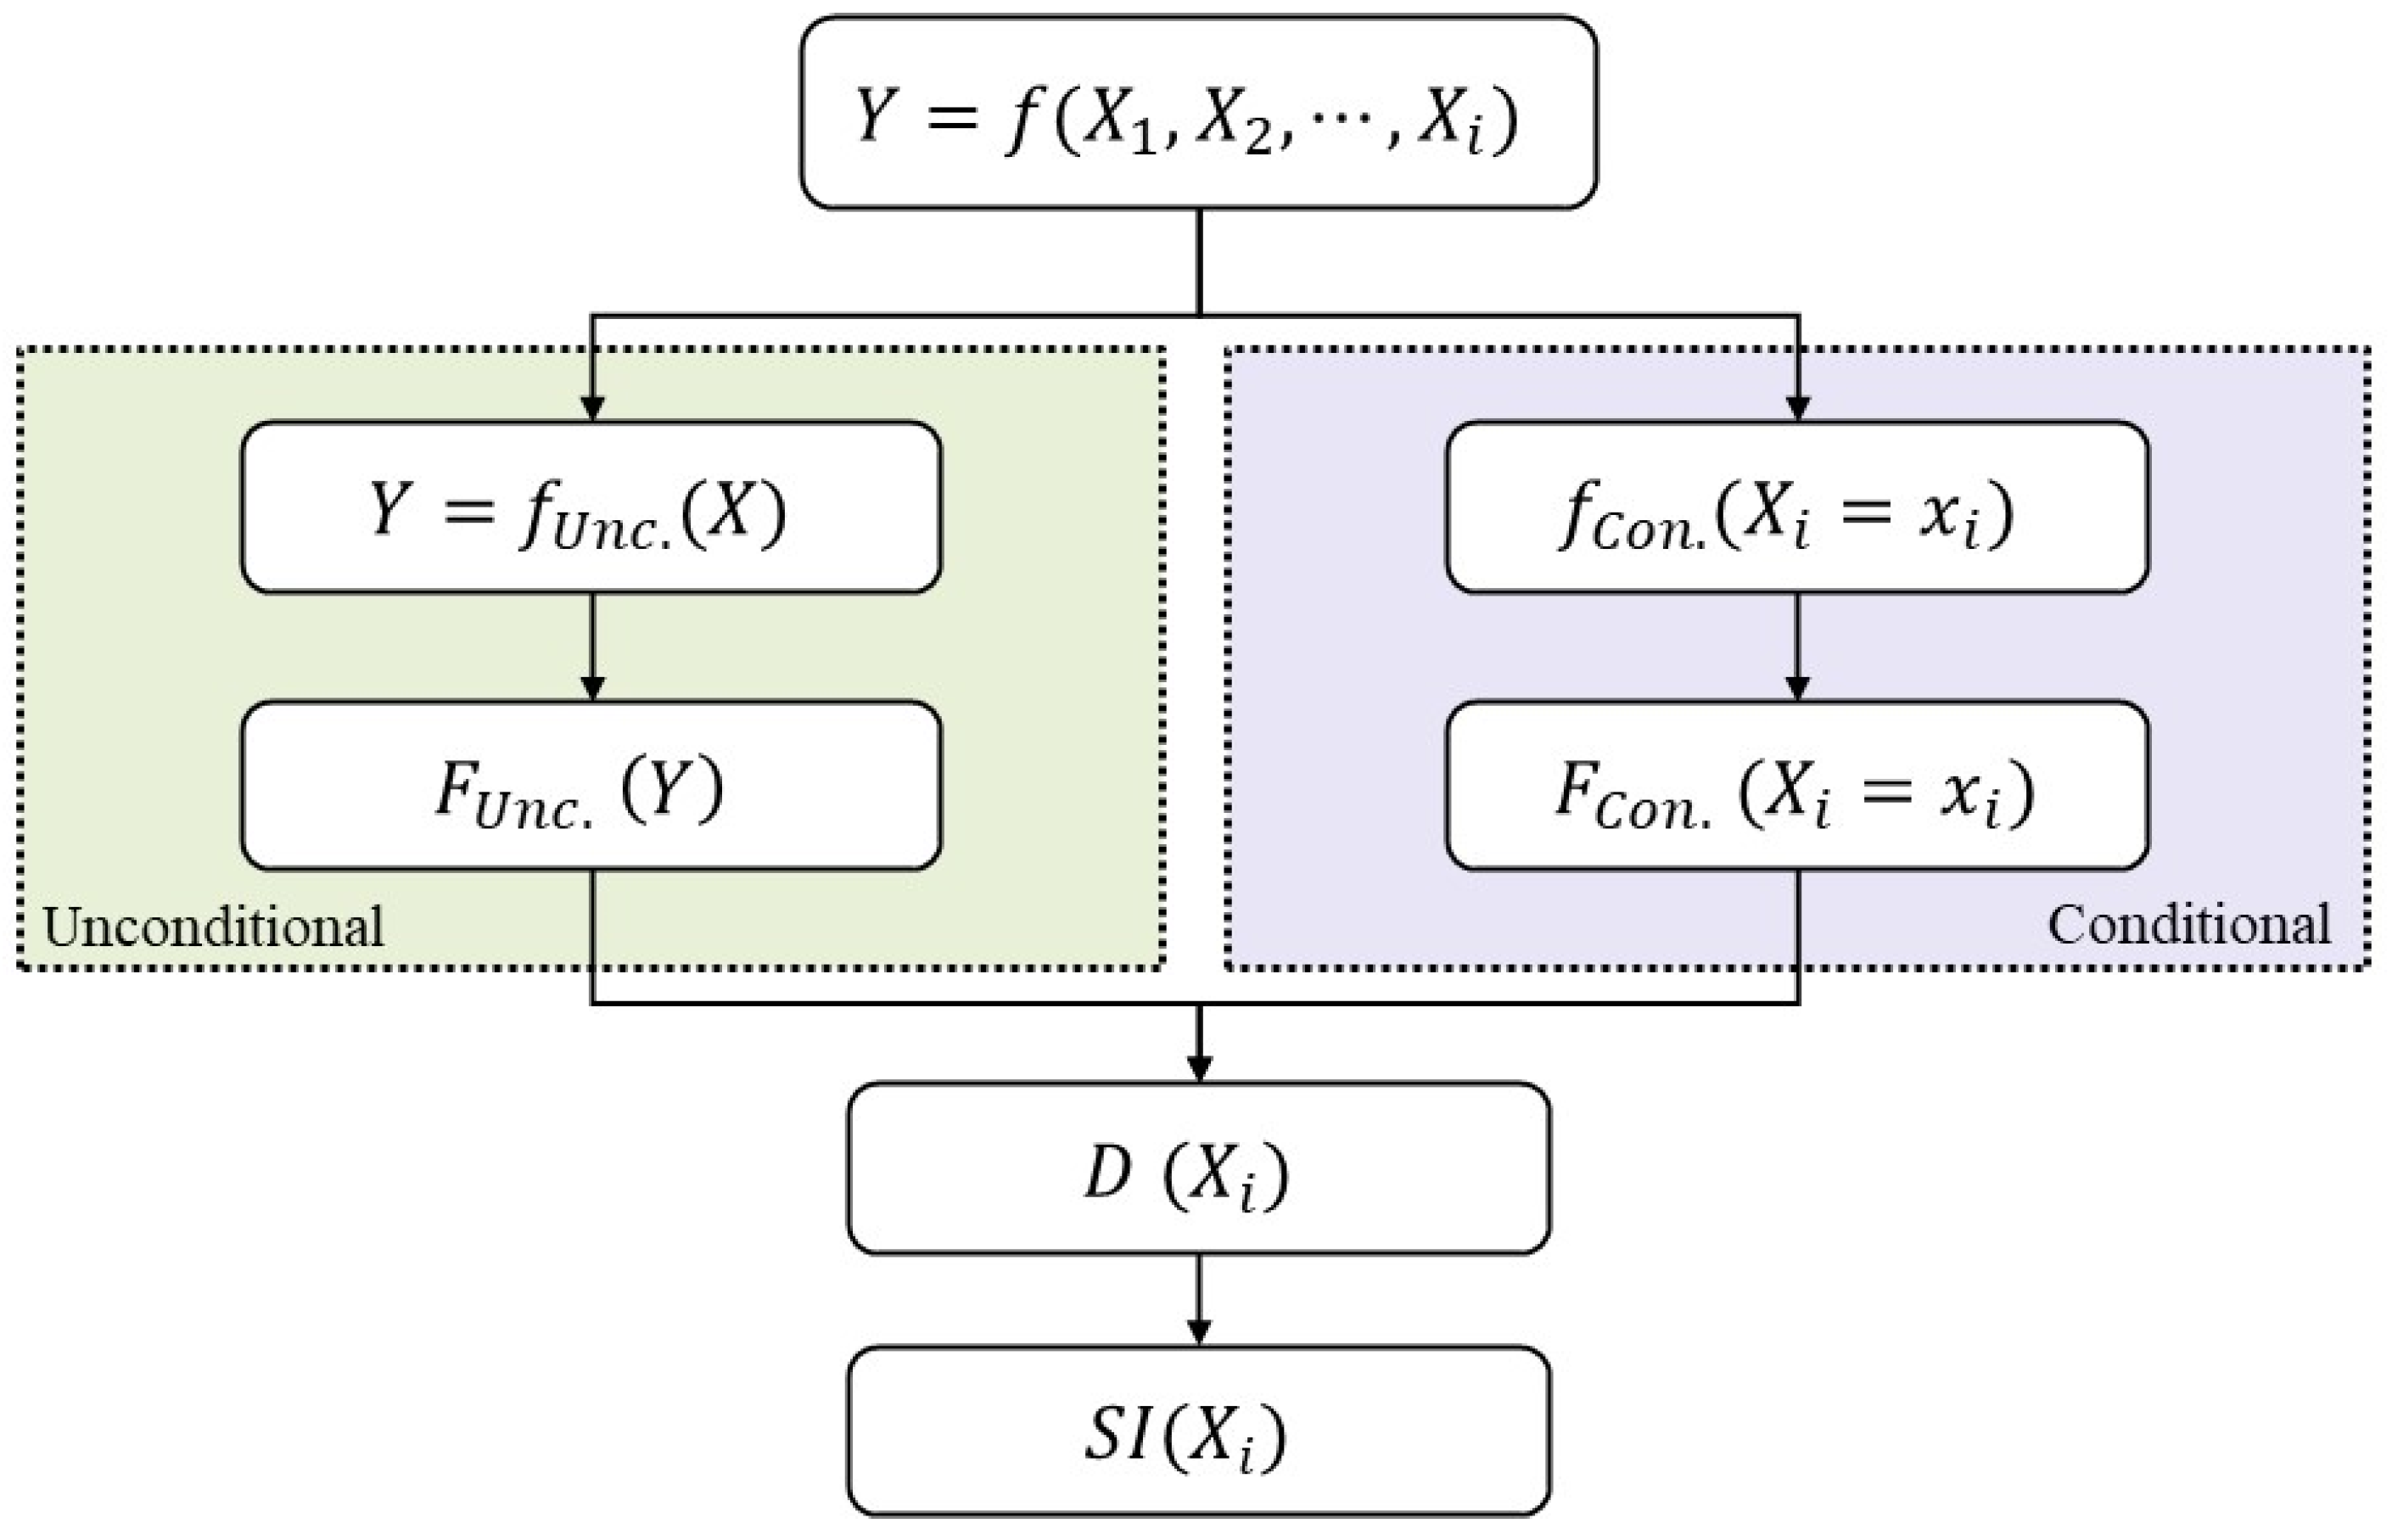
In PAWN, the Y can be the model performance metric which is calculated between the observation measurements and the simulated values like the coefficient of determination (R2). The PAWN methodology is implemented for an unconditional and conditional phase. In the unconditional phase, the model is implemented simply given inputs X 1 ,   X 2 ,   ,   X i and the output Y is generated [ Y = f U n c . ( X ) ]. Then, the empirical CDF of output Y is obtained [ F U n c .   Y ]. In the conditional phase, the model is implemented given inputs X 1 ,   X 2 ,   ,   X i , where the uncertainty of input X i is removed [ Y = f C o n . ( X i = x i ) ], and the empirical CDF of output Y is obtained [ F C o n .   ( X i = x i ) ]. In other words, one of the model’s inputs ( X i ) is kept fixed at a nominal value for the conditional phase, while all the other model’s inputs vary across a range of feasible values like in the conditional phase. Then, the largest difference between unconditional and conditional CDFs is the PAWN sensitivity index of the model output to input X i which is calculated by Kolmogorov-Smirnov (K-S) statistics [59,73]. The K-S is a non-parametric test to identify whether two independent samples (here unconditional and conditional CDFs) are following similar distributions [78]. It measures the absolute maximum difference between conditional and unconditional CDFs. The smaller K-S statistics, the more similar the CDFs are and, consequently, the lower the PAWN sensitivity index is [79]. The K-S statistics are formulated as below:
D   ( X i ) =   max Y F U n c .   Y   F C o n .   Y X i = x i )
where, D   X i   is the K-S statistics as the sensitivity index of output Y (the yield predictability in our case) to variable X i (the ECs in our case), F U n c .   Y is the empirical unconditional CDF of Y , and F C o n .   Y X i = x i ) is the empirical conditional CDF of Y when all variables vary in their feasible domain but the variable X i is kept at nominal value of x i .
The K-S statistics vary between 0 and 1. When K-S is equal to 0, there is no divergence between the CDFs of two samples, and when the value tends to 1 the difference between the CDFs becomes significant [73]. Figure 2 illustrates the flowchart of PAWN.

2.3. Coupling the GxE Model with PAWN Global Sensitivity Analysis

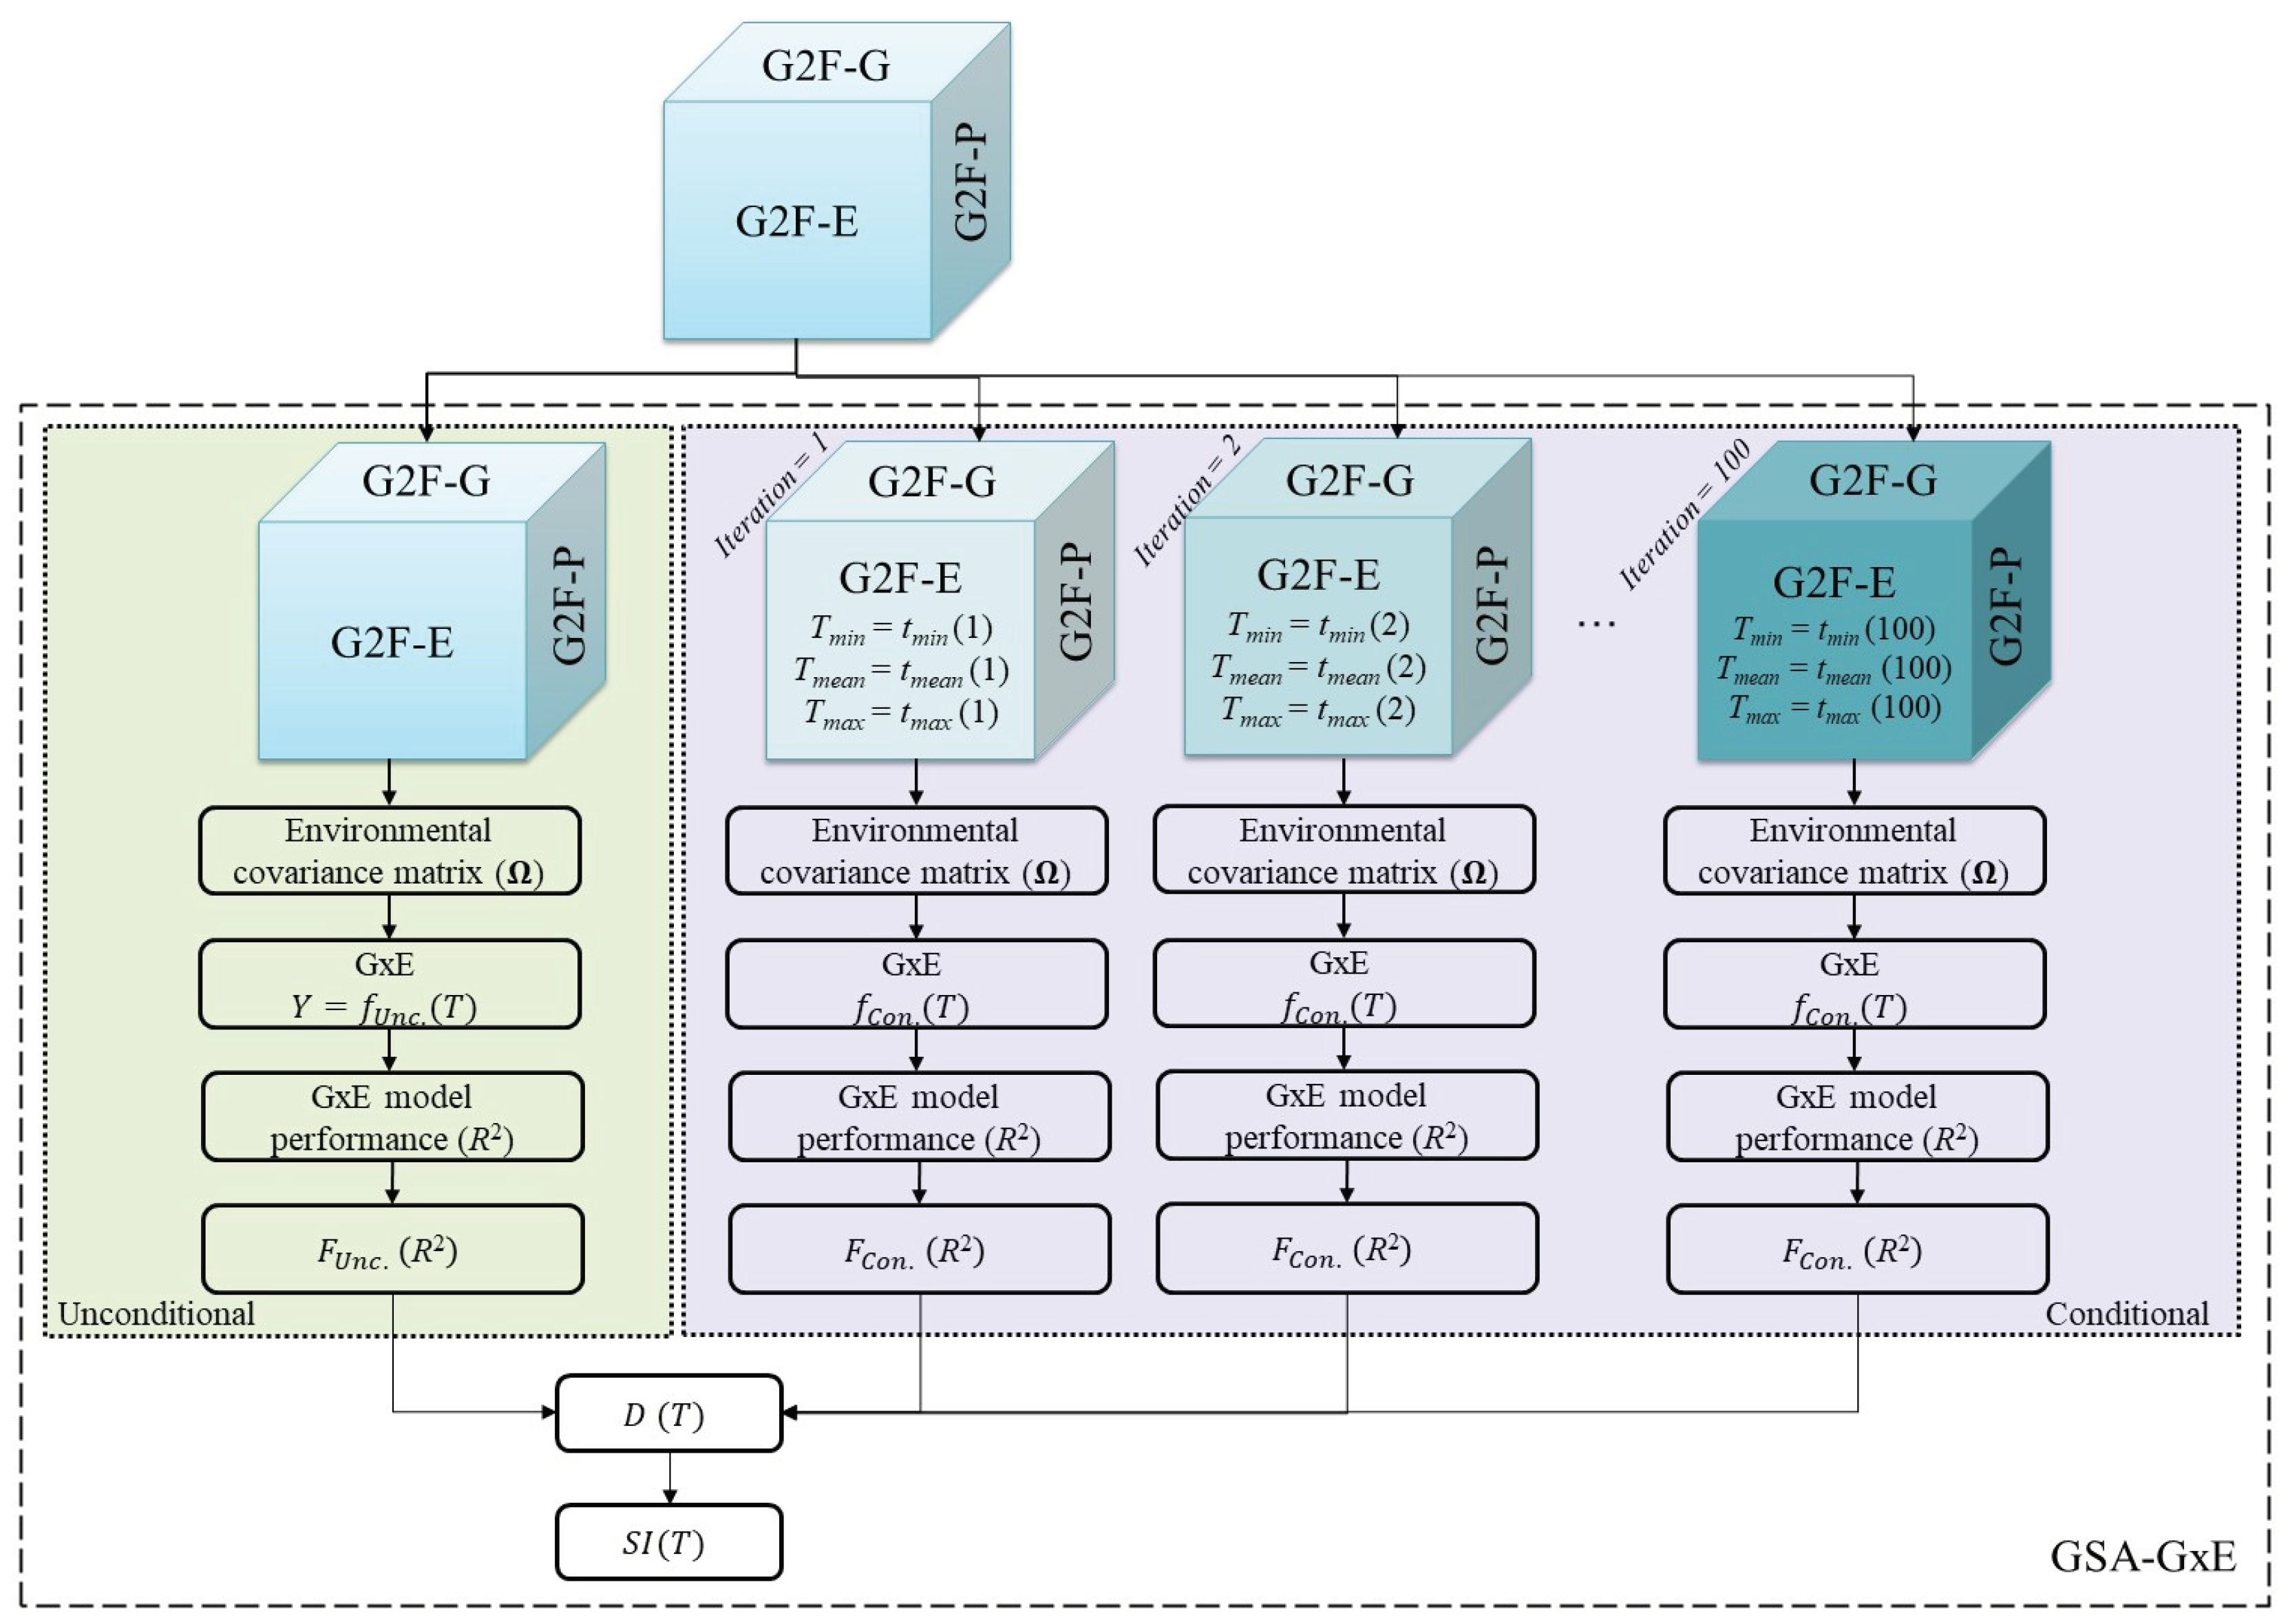
In this study, the sensitivity of phenotype predictability by the statistical GxE model to climate variables is investigated. For this purpose, we coupled GSA with GxE through the environmental covariance matrix ( Ω ) using the PAWN method. Figure 3 illustrates the conceptualization flowchart for the coupling GSA-GxE for the unconditional and conditional phases of PAWN. For the unconditional phase (the green box in Figure 3), we integrated the daily ECs from all 84 G2F experiments as described in section 2.1. All inputs were allowed to vary across their observed domain, which provides the E C matrix and then Ω matrix is calculated. The constructed Ω is an 84×84 matrix with 84 variance values in the diagonal and 3,486 covariance values in the lower/upper diagonal. Note that the lower and upper diagonal values are the same. Next, the GxE model is implemented in unconditional phase and the CDF of GxE model performance based on R2 values is computed [ F U n c .   Y ]. A similar method is used in the conditional phase (see the purple box in Figure 3), but one variable ( X i ) is kept constant at a nominal value x i . The CDF of GxE model performance evaluated by R2 is obtained [ F C o n .   Y X i = x i ) ]. In Figure 3, we represent the conditional phase of PAWN for T as an example of the conditional variable X i . Other variables, including DPmin, DPmean, DPmax, RHmin, RHmean, RHmax, SRmin, SRmean, SRmax, Racc, WSmean, and WDmean vary together in their domain, like they were in the unconditional phase, while Tmin, Tmean, and Tmax remain constant at generated nominal values in the conditional phase. Then, the K-S statistics are calculated between F U n c .   Y and F C o n .   Y X i = x i ) . To verify this methodology, we created 100 combinations of E C s by selecting different 100 samples of the nominal values for conditional variable (i.e., temperature in Figure 3) and iterated the whole conditional phase 100 times. The 100 nominal values have been generated by dividing the range of T values [Range(Tmean) = Max(Tmean) – Min(Tmean), Range(Tmin) = Max(Tmin) – Min(Tmin), and Range(Tmax) = Max(Tmax) – Min(Tmax)] from all observed G2F experiments by 100 and as a result, the 100 equal-spaced nominal values are generated. In Figure 3, T values are fixed at nominal values as follows: Tmin at tmin Nom., Tmean at tmean Nom., and Tmax at tmax Nom. time series. The same process was applied to other variables including SR and RH. In the case of the conditional variable R, the range of R-values from all G2F experiments is divided by 100. Consequently, the 100 equal-spaced nominal values produced are set to Racc for each iteration.
In the last step, after implementing all 100 iterations for a given conditional climatic variable and calculating the 100 K-S statistics, the maximum value of the calculated K-S measurements is presented as the PAWN sensitivity index. Here, the maximum K-S is the PAWN sensitivity index of GxE model performance to the given conditional variable X i (i.e., T in Figure 3) which is obtained as follows:
S I ( X i ) =   max X i [ D X i ]
where, S I X i is the PAWN sensitivity index of GxE model predictability to the conditional climatic variable X i .
The GxE model performance sensitivity to the uncertainty of the climatic input variables including T, SR, R, and RH run 100 iterations for each climate drivers of maize growth. This approach represents 400 GxE simulations conducted at the University of Nebraska High Performance Computing facility. It is noteworthy that the proposed sensitivity analysis framework is applicable for other or additional environmental variables, and as many as iterations can be explored.
The GxE model predictive skill evaluated by the R2 performance metric between observed and predicted yield values in each G2F environment is considered the output, its sensitivity is quantified to the model inputs. The R2 is defined below in Eq. (17):
R 2 G x E , n = 1   m = 1 M ( y o b s m y ^ s i m m ) 2 m = 1 M ( y o b s m y ¯   m ) 2
where, R 2 G x E ,   n is calculated GxE model R2 for environment n; y o b s   m and y ^ s i m   m is observed and simulated yield values for recorded individual genotype m in environment n, respectively; y ¯   m is the average of simulated yield of genotypes m in environment n, and M is the total number of recorded genotype m in environment n.

3. Results and Discussion

We present a modeling framework for the sensitivity of the maize yield predictions to uncertainties in climate. The framework couples a GxE model that integrates the co-variability of environmental and maize genetic molecular markers and the PAWN global sensitivity analysis. The GSA-GxE modeling framework supports the thesis that integrated genetics, climate, and their interactions contribute to identify the climate variables responsible for the improvement of the predictability of maize yields in US-CA. We consider that the effects of climate on maize predictability can shed some light on how crops respond and adapt to spatiotemporal fluctuations in climate and our abilities to capture such patterns of variability and crop responses in collected data, biophysical, statistical, and data models [8,11,12,17,80,81]. The selection of rainfall, solar radiation, temperature, and relative humidity to create the covariance matrices for the GSA’s conditional phase followed studies that indicate their influence on maize growth and production [24,26,70,82]. Table 1 illustrates the range of observed values used in the nonconditional phase, which represent the climate variations occurred between 2014 and 2017. These ranges were used to generate the 100 nominal values for the selected variables (i.e., Tmin, Tmean, Tmax, SRmin, SRmean, SRmax, Racc, RHmin, RHmean, and RHmax) in the conditional phases. It is noteworthy that the developed GSA-GxE framework can be expanded to include other climate or environmental variables released in [19] and [74].
The GSA-GxE framework expands what Leng et al. [26] studied as the contributions of covariable temperature, precipitation, and radiation to maize and soybean yields in the US. These authors also pointed out the limitations of building regression models for yield prediction where multiple variables affect the outputs. This argument suggests the use of covariance matrices for phenotype predictability proposed by [9], integrating the genomic and climate complexities to enable the identification of specific climate effects on maize yield predictions [17].

3.1. The Environmental Covariance Matrix

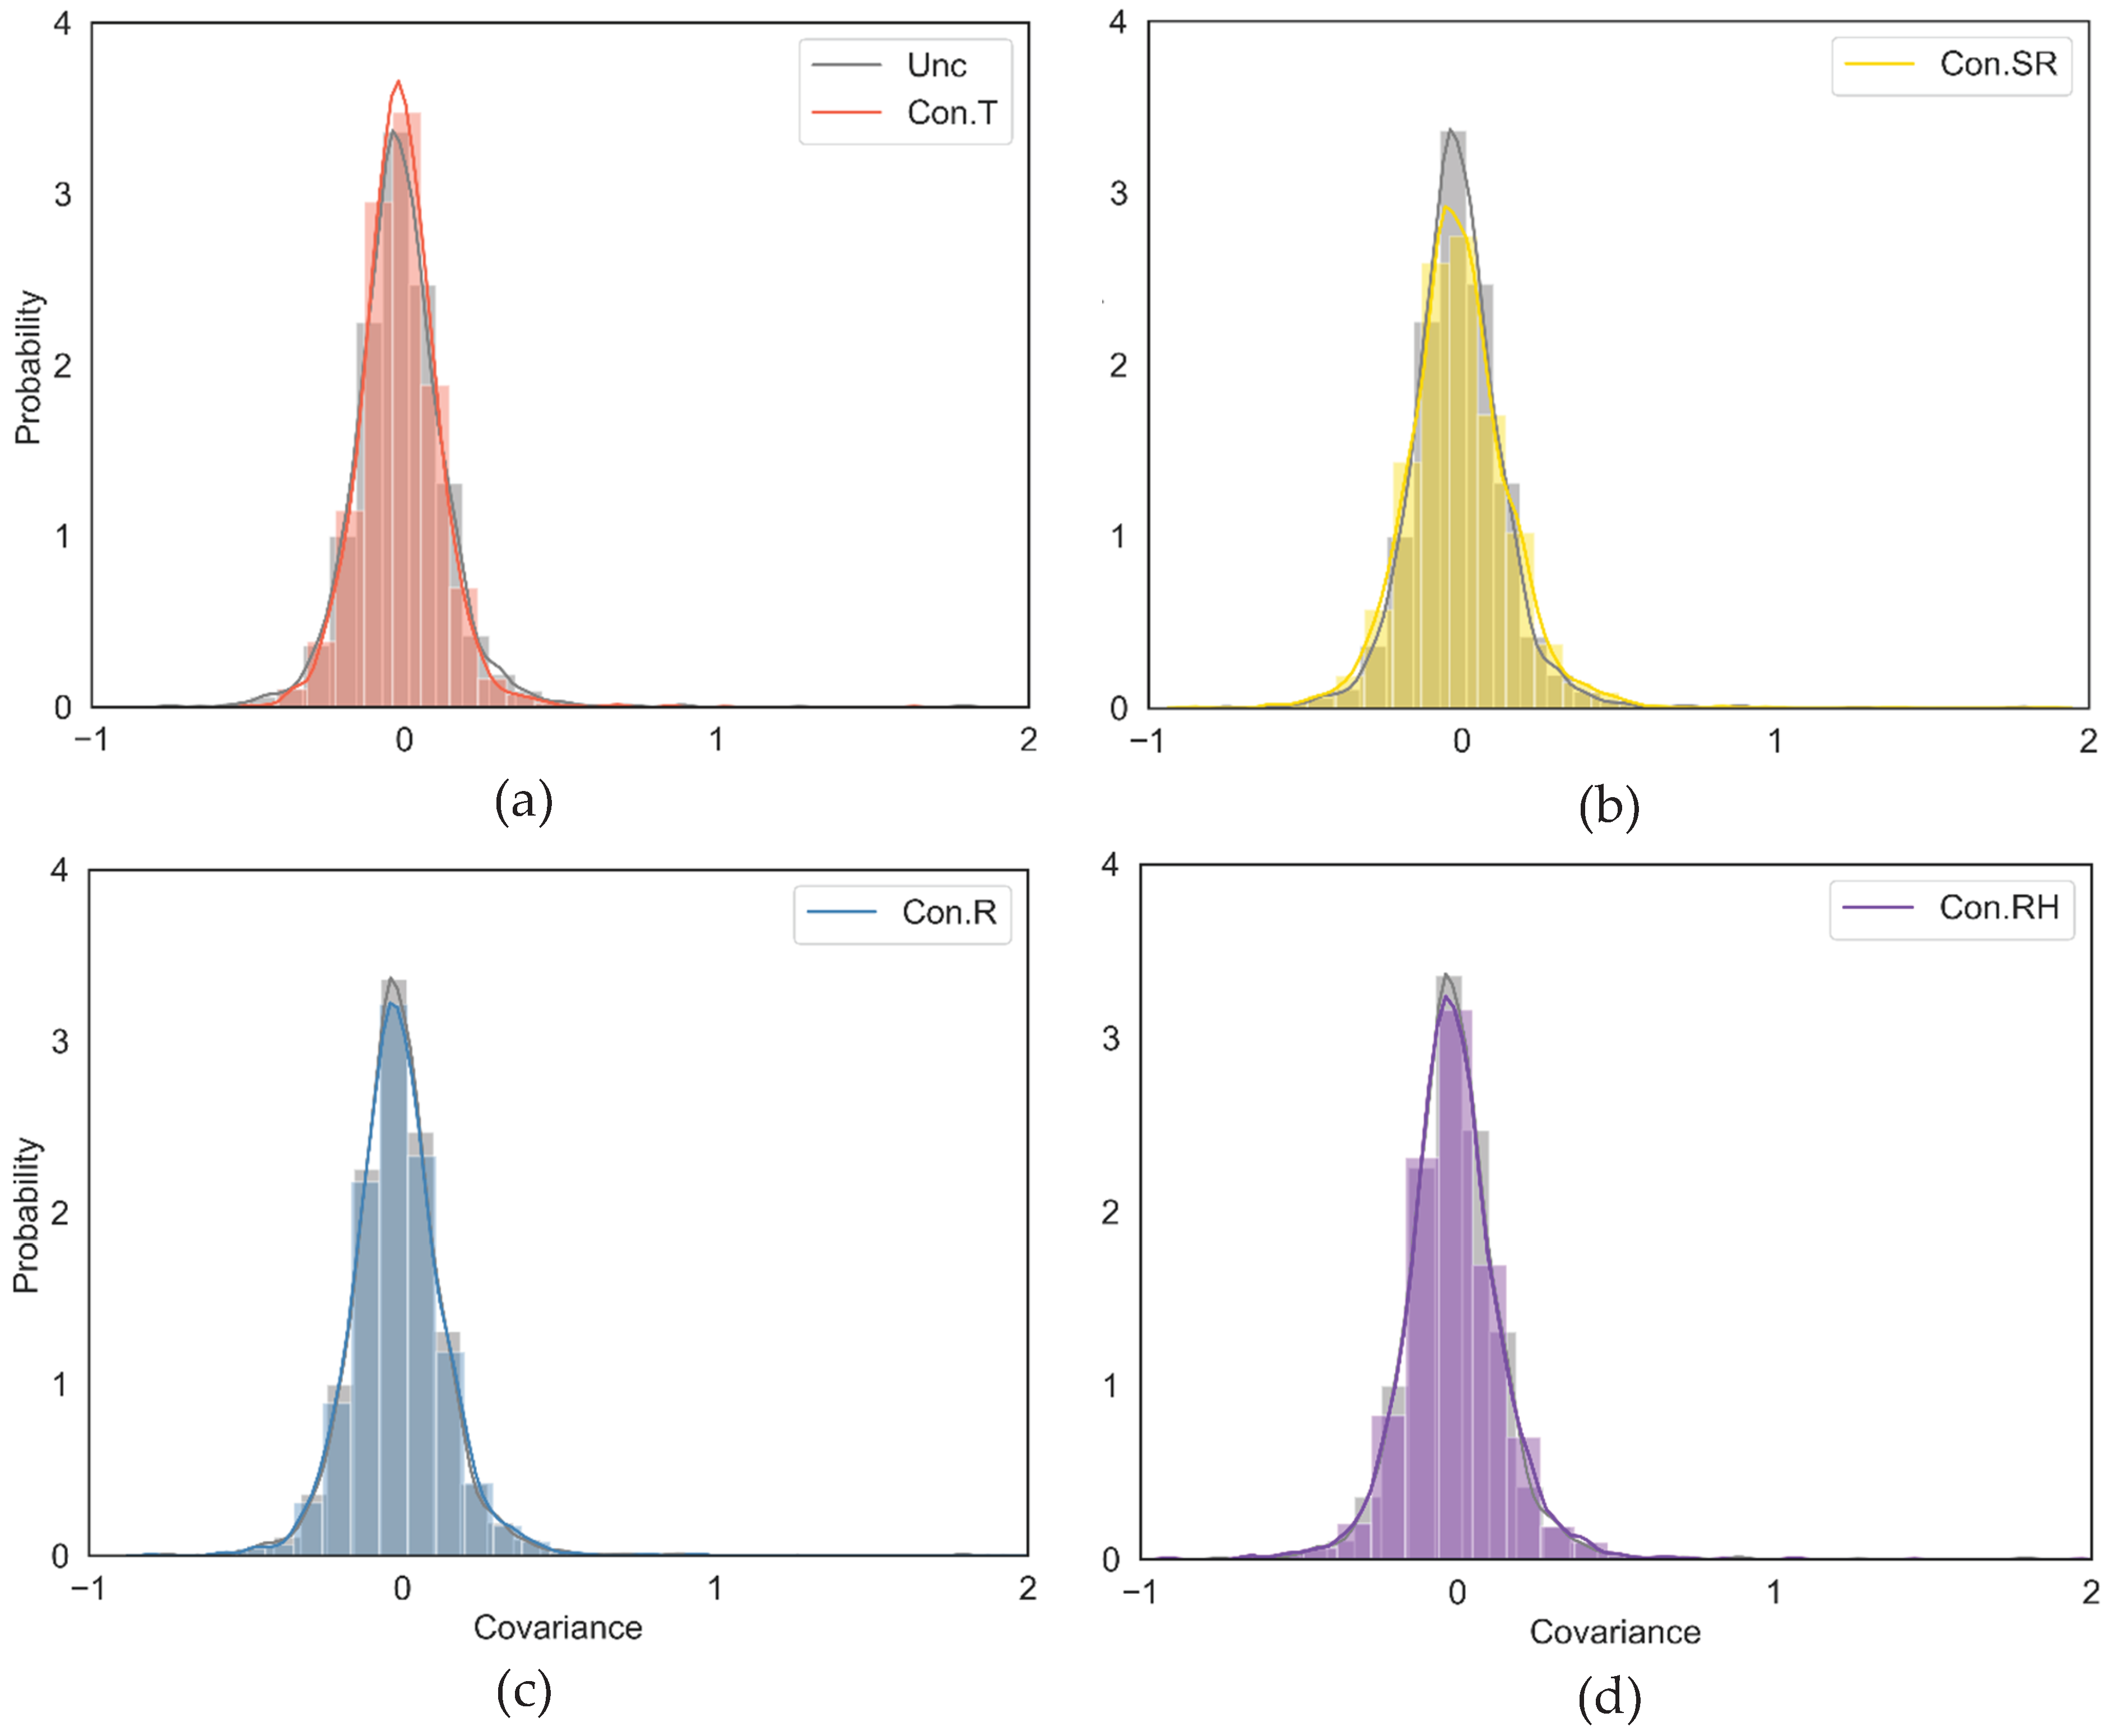
The unconditional phase of GSA-GxE has been implemented when all 15 variables are set to the observed time series at each G2F experiment, and the unconditional Ω is calculated. The conditional phase of coupled GSA-GxE framework has been iterated for each of the 100 generated nominal values, and in each iteration, the conditional Ω is computed. The covariances values quantify the environmental similarity using environmental co-variability between pairs of the G2F experiments time series. In other words, the covariance function measures the joint variability of the G2F experiments’ hydroclimatic time series by synthesizing the co-variability of 15 climatic variables. Figure 4 shows the histograms of covariance values in the unconditional phase (in gray color) and conditional phase for each conditional variable, including temperature, solar radiation, rainfall, and relative humidity.
The unconditional Ω is the same for any given variable as the conditional variable since it has been calculated based on the observed time series for all 15 hydroclimatic variables across the G2F study area. The conditional Ω for any given conditional variable is calculated in each iteration with the given generated nominal value. The selected nominal value, which remains constant in all G2F experiments in an iteration for a given conditional variable, does not change the joint variability of the time series between G2F experiments. Consequently, the calculated conditional Ω in iterations 1 through 100 remains the same since the covariance function measures how the time series of each pair of the G2F experiments covary together. Also, in Figure 4 the probabilities of unconditional and conditional covariance values are slightly different. These slight differences align with our previous study [72], where we coupled the GSA with Ω . In that study, we found the PAWN sensitivity index of Ω to T, SR, R, and RH equal 0.091, 0.084, 0.077, and 0.082, respectively. In the next step of the GSA-GxE, the observed slight contrasts between calculated unconditional and conditional Ω interacted with the genetic covariance G through the GxE model. These contrasts will be propagated by the model using the product of Ω and G and the ranked hydroclimatic variables, from the most to the least impactful to the maize yield predictability.
Phenotypes like grain yields are affected by genetics, environmental drivers, and the complex interactions between them [9], meaning that the environmental similarities are not linearly affecting the yields, the predicted values by GxE models, and the resultant errors. In a study by [83], the GxE interaction is the most important factor compared to the independent components used for maize yield predictability in the G2F layout. This complexity introduces a potential error propagation and increases the sensitivity of maize yield predictability to the GxE compared to the sensitivity of Ω to hydroclimatic variables.
Another complexity in maize phenotype predictability is that the tested maize varieties differ across the designed G2F experiments [18]. This genetic variability among the trials is considered in the GxE model through genetic covariance ( G ). Similarly, to Ω , which quantifies the similarity among the environments based on hydroclimatic time series, the calculated G measures the similarity among the maize varieties using molecular markers [83]. These variations in the molecular genetic markers lead to different phenotypic responses to climate conditions. For example, [84] showed that the responses of different maize species with different thresholds of tolerance are affected differently by temperature means and extremes. Thus, the effect of hydroclimatic variables and their interaction with genetic markers through the environmental covariance ( Ω ) and genetic covariance ( G ) on the maize yield predictability can be estimated.
As mentioned above, the study of [72] contrasted the conditional and unconditional Ω to calculate the sensitivity of covariance values to fluctuations in the hydroclimate in one iteration by coupling GSA and Ω . In the present study, we introduced the GSA-GxE coupling, extending the number of iterations for verification purposes. The test the GSA-GxE framework we used a four-year dataset with a limited number of trials, mainly over the eastern and central US. According to this testing procedure, we could miss the effects of long-term modes of climate variability and their co-variability with genetics. This data limitation can be tackled by releasing and using new hydroclimatic data in a more significant number of G2F environments over time and space scales, which may enhance the model predictability [17]. Nevertheless, the proposed GSA-GxE methodology can be expanded to other locations and tested with datasets other than G2F. Using released environmental and OMICs datasets from other crop breeding programs, such as the International Center for Maize and Wheat Improvement, is also recommended to test and enhance the proposed sensitivity analysis framework.

3.2. The GSA-GxE Framework

The sensitivity analyses have been explored from multiple perspectives [57,85], including those aimed to identify the main drivers of environmental change using physical and data driven models [58,59,60]. In crop phenotyping diagnostics and prognostics such efforts have been centered on the use of crop and Earth System models and statistical analyses of climate and crop yields [22,26,70,80,86,87,88,89,90]. Authors [72] introduced a PAWN’s GSA coupler for Ω using the G2F initiative data, which is the foundation for the GSA-GxE coupler presented here. The GSA-GxE coupler estimated the sensitivity of the GxE model performance to the constructed Ω , and account for the possible variations in climate as drivers of maize yields predictability.
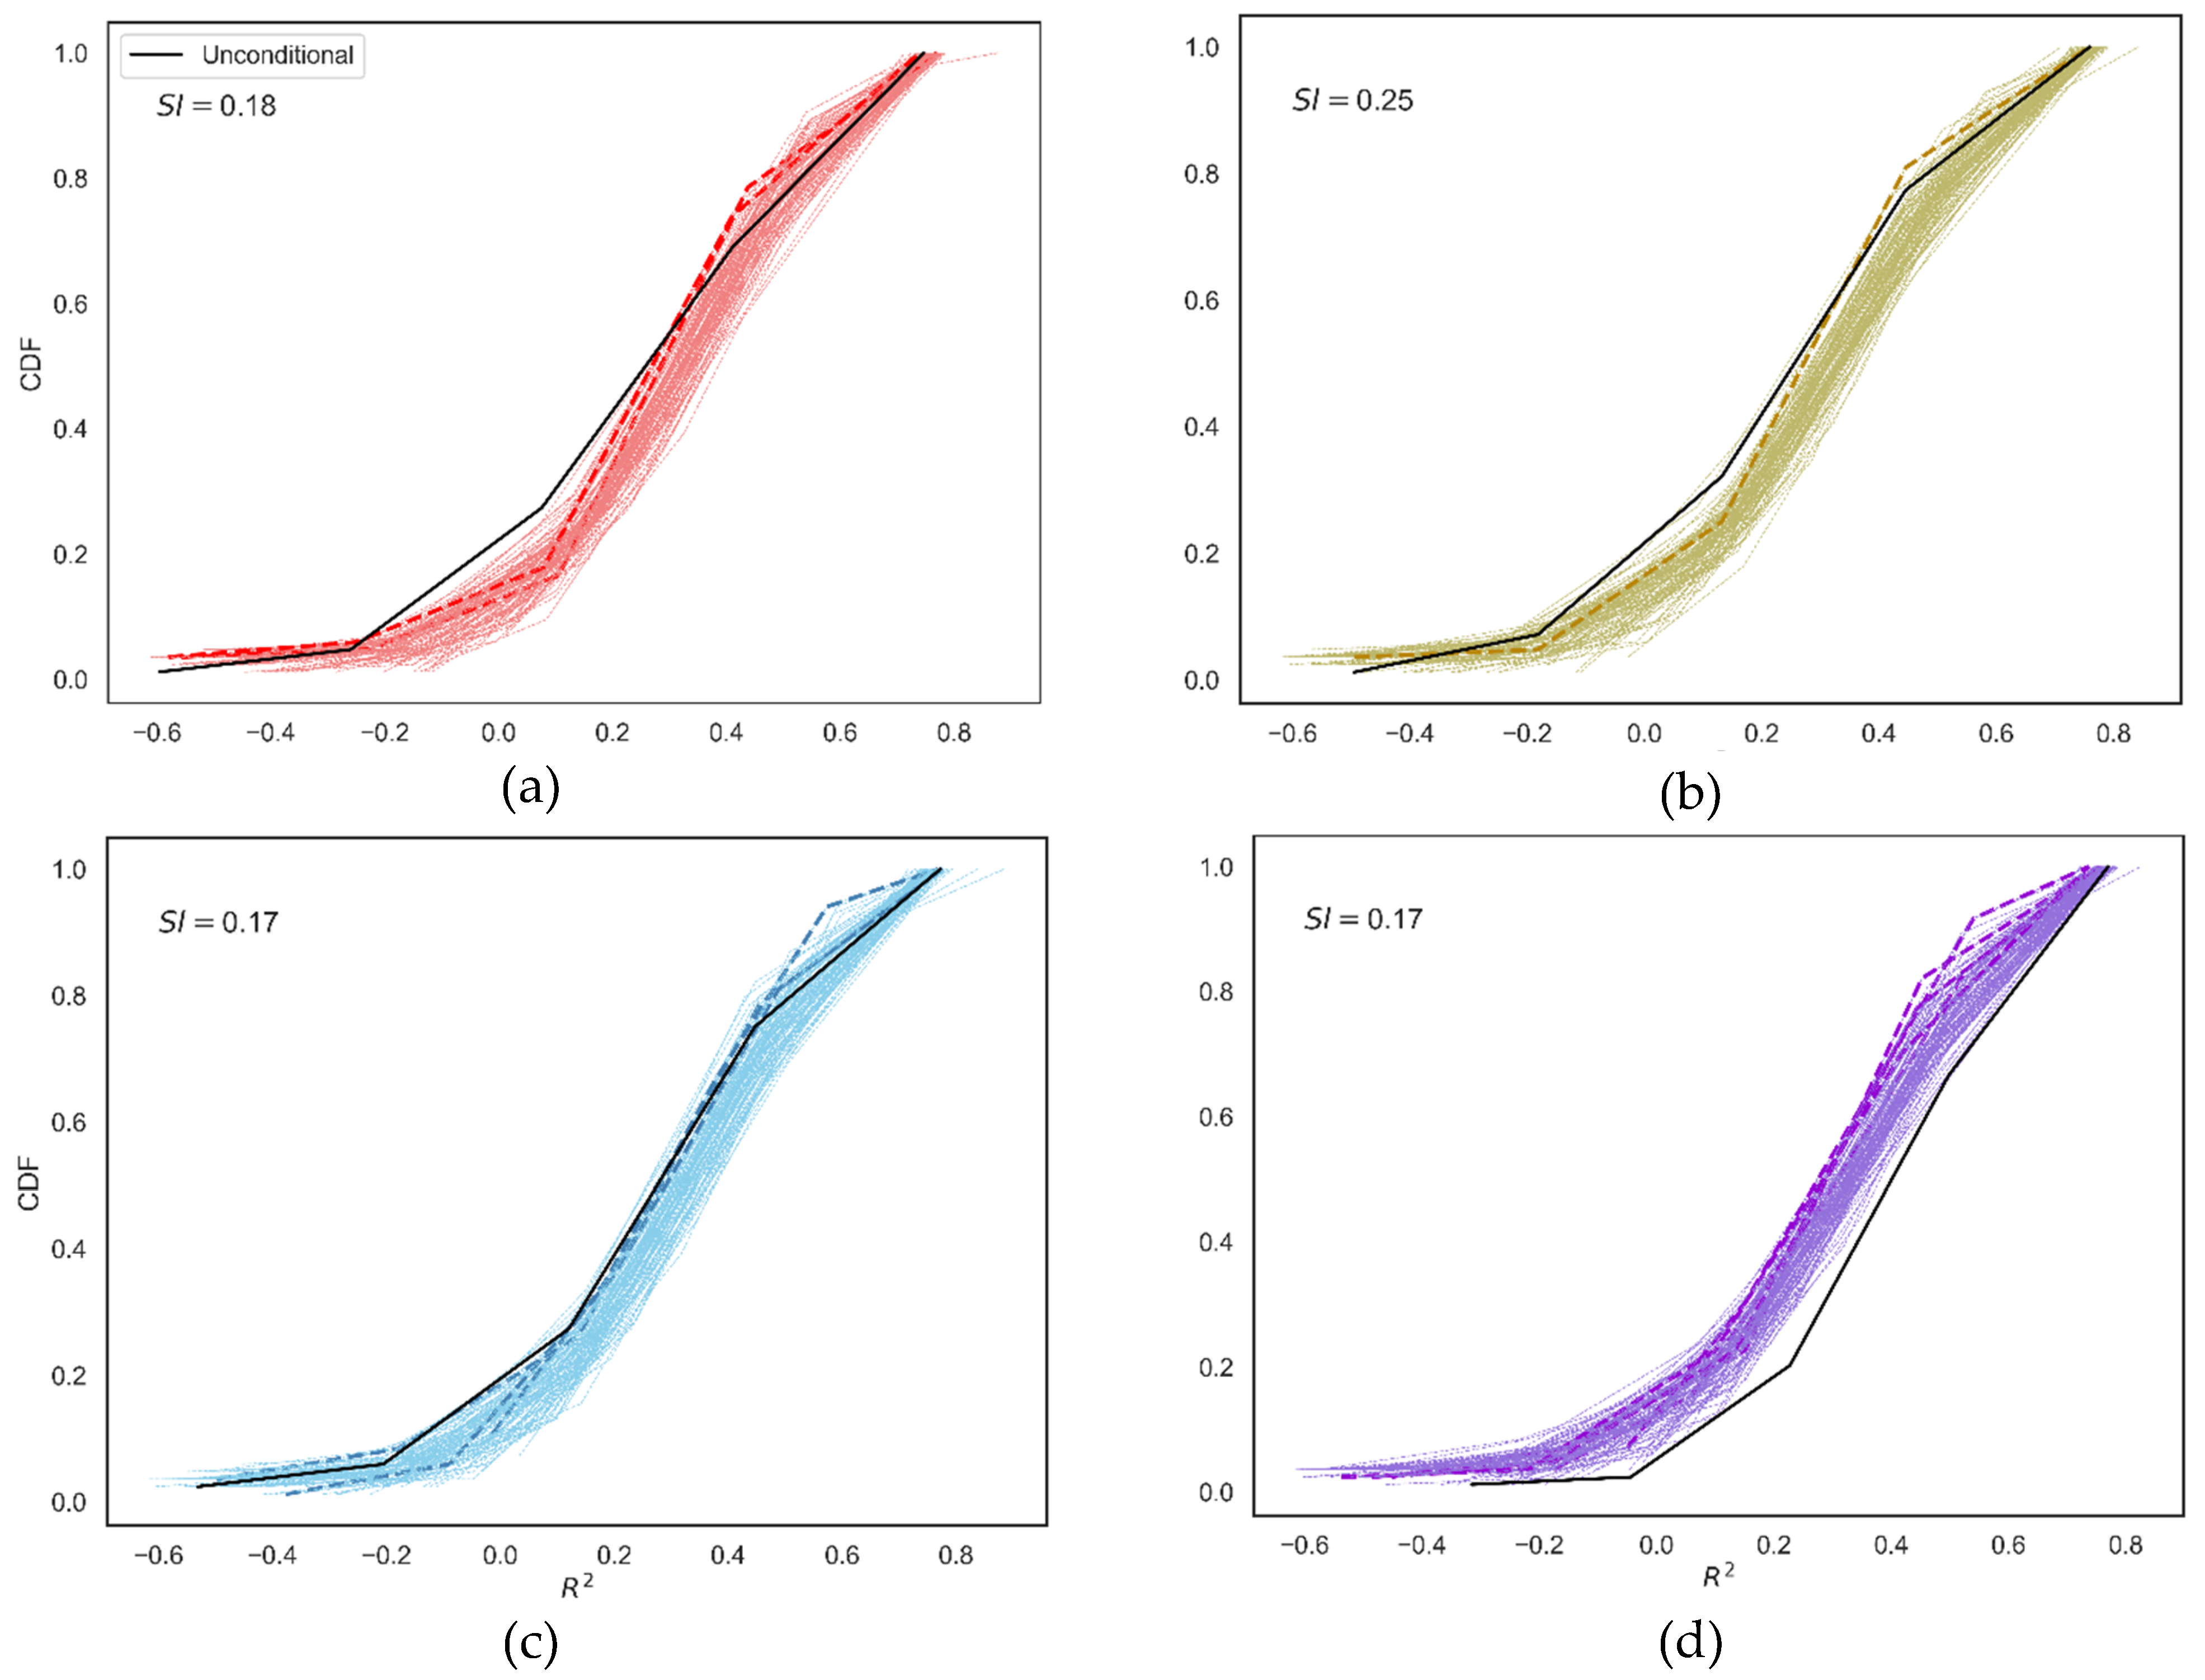
The sensitivity of the GxE model performance to the constructed conditional environmental covariance matrix has been assessed successfully for T, SR, R, and RH, which supports the central thesis of quantifying the GxE performance sensitivity to test the hydroclimatic drivers for maize yield predictability. Figure 5 illustrates the unconditional and conditional CDFs of the GxE model performance for T, SR, R, and RH. The 100 iterations for each conditional variable take approximately one month in a Windows system with an Intel Core i9 configuration. The codes made available to the public allow users to perform this methodology for as many iterations as they aim. The tested iterations in this study evidenced that the differences between the SI values for all variables were minimal, indicating that such number of iterations could be sufficient to achieve the maximum SI value. The SI values show the maximum difference between the unconditional and conditional CDFs (K-S statistics) among all iterations. After completing all 100 iterations, the maximum derived K-S has been reported as the PAWN sensitivity index ( S I X i ;   E quation 16) of the GxE model performance (R2 in Eq. (17)) for a given conditional variable.
The largest PAWN sensitivity index for the area of study is solar radiation (SISR = 0.25). After that, temperature is the most effective climatic driver in GxE model performance (SIT = 0.18). The sensitivity indices calculated for rainfall and relative humidity are the same (SIR = SIRH = 0.17). The dominance of solar radiation can be supported by biophysical crop modeling and observations. For instance, [93] suggested that solar radiation’s effects on maize yields are often overlooked compared to other climatic factors. Their study shows that 27% of the maize production growth can be attributed to increasing solar radiation in the U.S. Authors [94] also identified that the effects of solar radiation on maize yields surpassed those of temperature and rainfall. Yet other patterns emerge when solar radiation is compounded with an increasing variability of precipitation, leading to simulated less conspicuous changes in yields. On the other hand, using observations and physiological attributions between climate and crop development, [26] shed some light on how photosynthesis and solar radiation drive crop development in conterminous US. Thus, the SI-aggregates in Figure 5 are indicative of how the GSA-GxE coupler and the contrasting SR, R, RH, and T, as compound and individual feasibility spaces, evidence the contributions of climate factors to maize yield predictions in the U.S. and Canada.
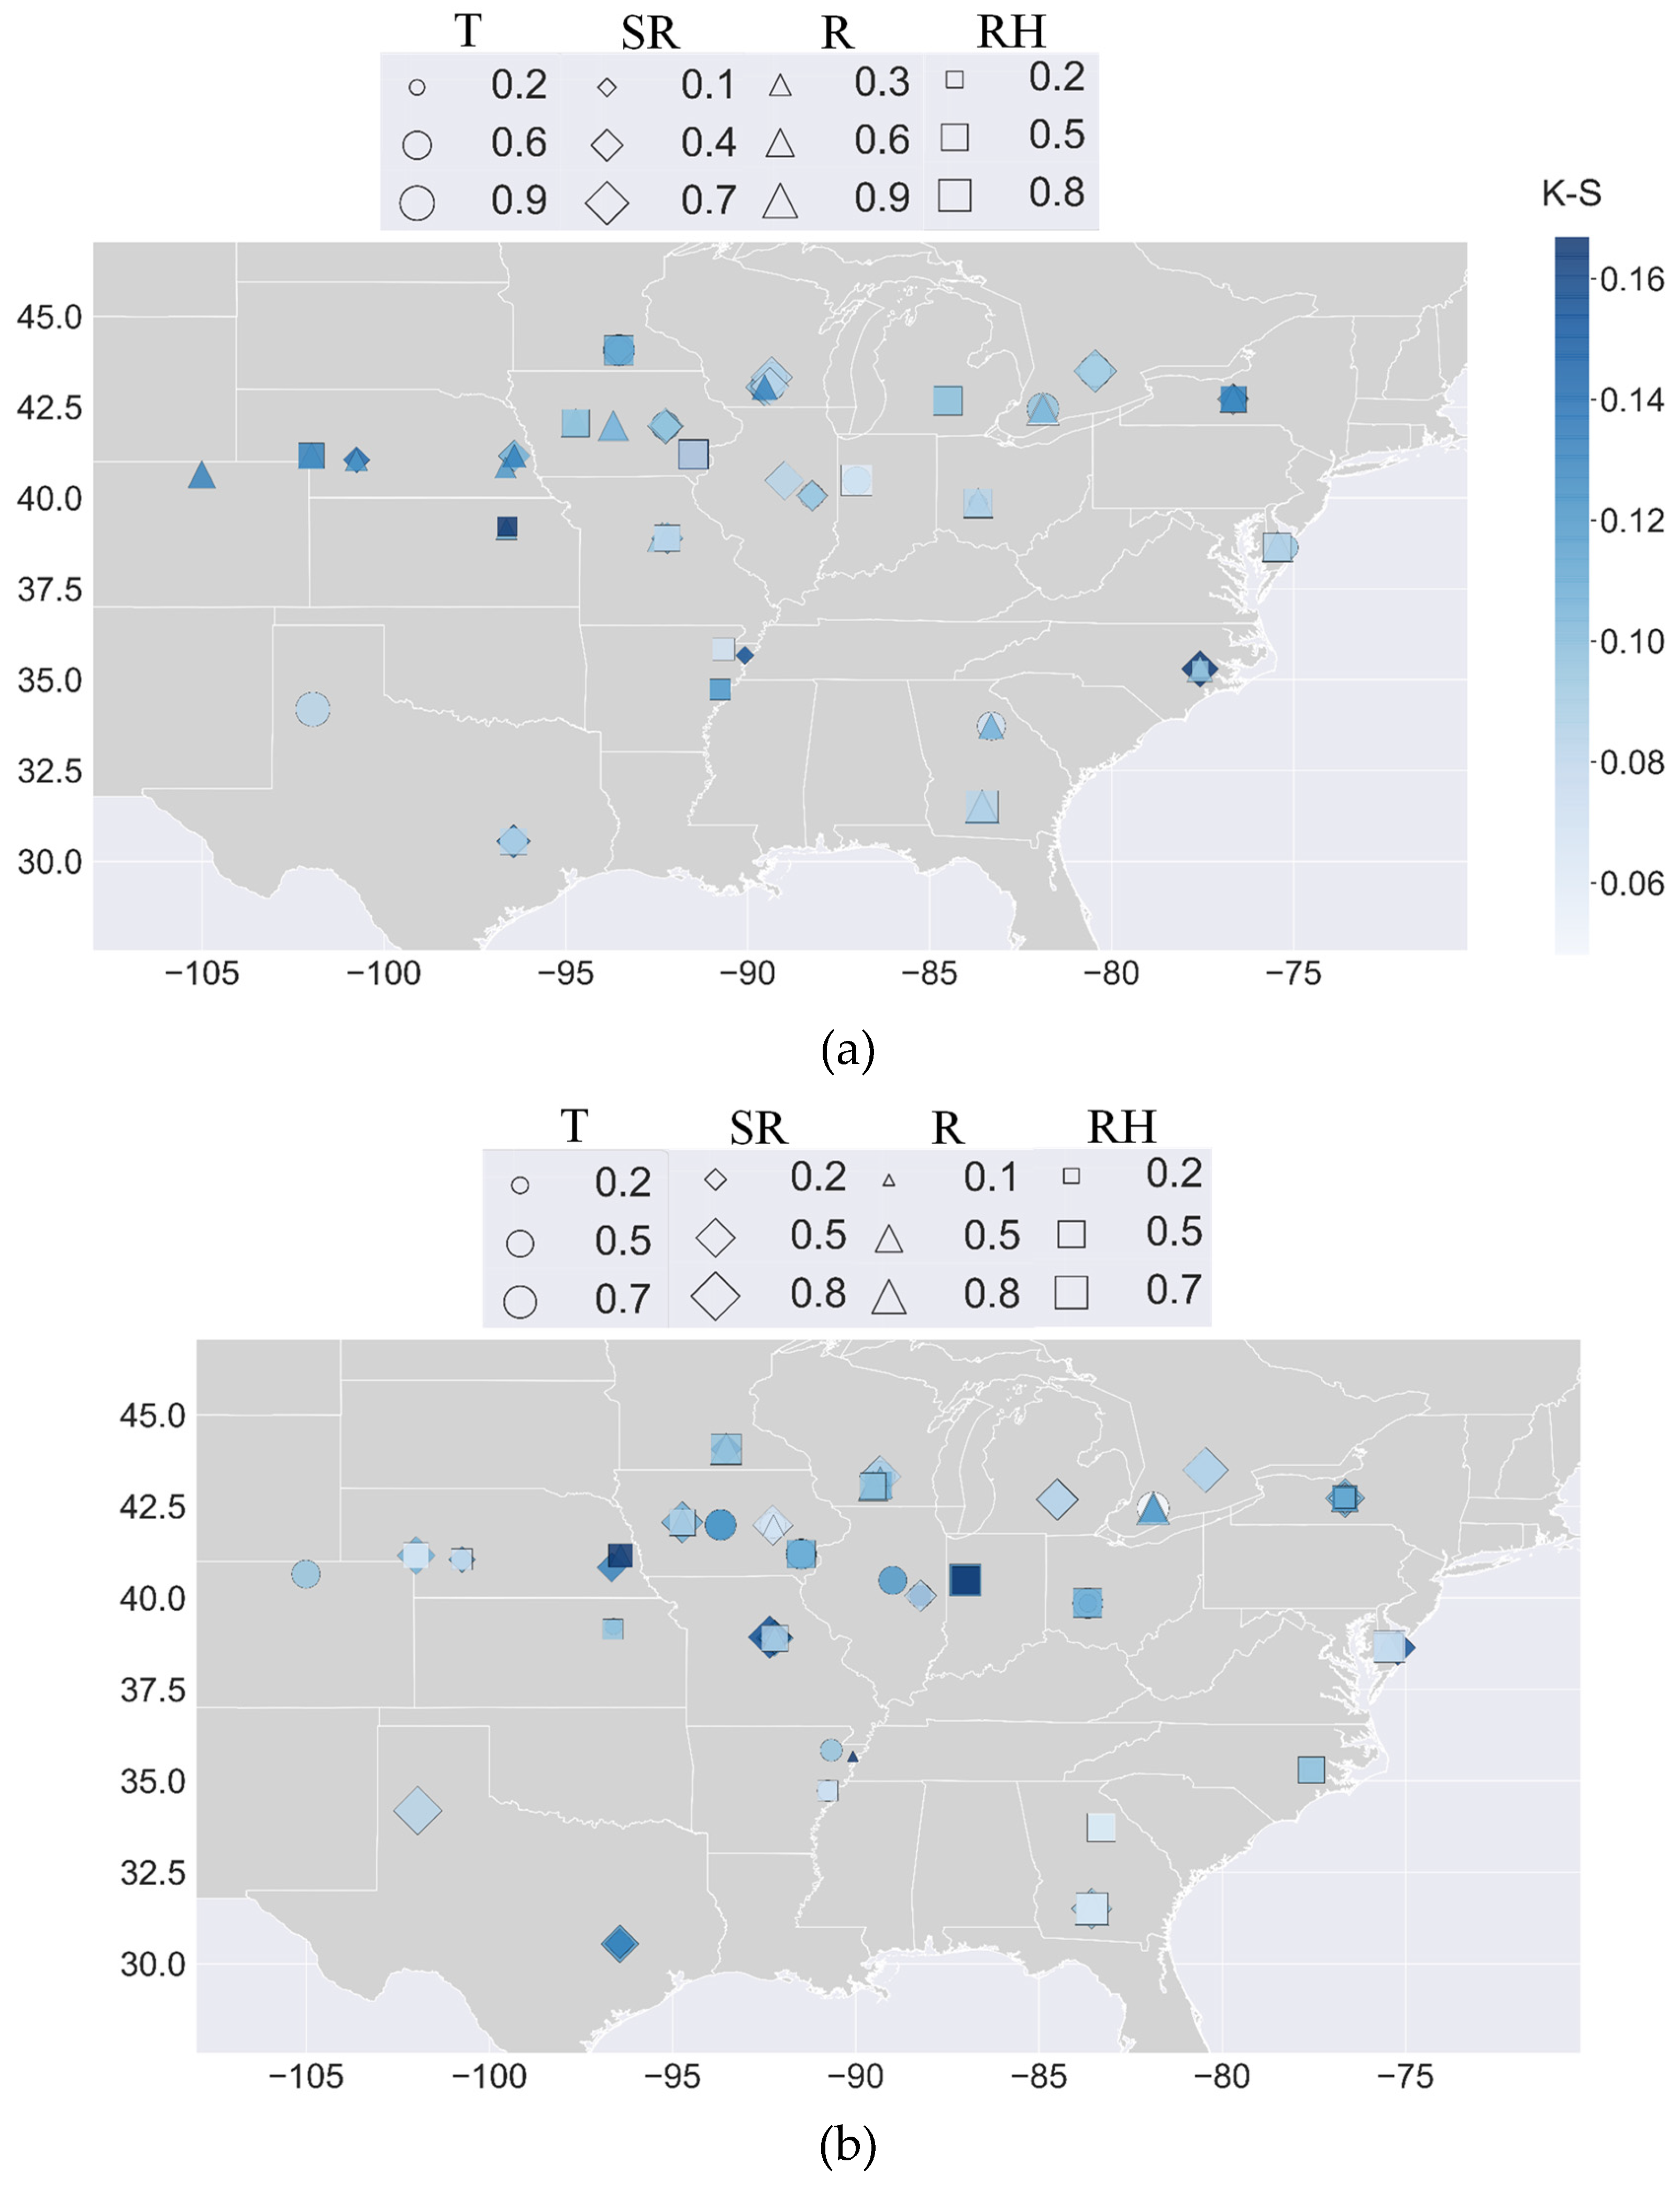
The effects of markers and environmental covariates using the covariance structures introduced by [9] and coupled to the GSA by [61] at each location illustrate the dominance of different climate variables on maize yield predictability. Figure 6 shows the spatial distribution of the most and second most effective climatic drivers for maize yield predictability and their associated GxE modeling performance (R2). The most sensitive climate drivers observed in Figure 6a indicate that R dominates in 26 sites, while RH, SR, and T are the main controls of maize predictability in 21, 20, and 17 sites, respectively. Figure 6b shows that RH dominates SR, T, and R as the second most influential driver of maize predictability in 26, 24, 19, and 15 locations, respectively. Additionally, there is a consistent pattern in the most and the second most effective predictors are the sequence RH, SR, and T. Authors [80] indicated that crop sensitivity studies have been dominated by the assessment of how temperature and, to less extent rainfall affect crop yields. Other studies have assessed the compounded effect of temperature with precipitation deficits in shortening the crop’s growing season [24,29,80,86,87,95,96,97]. While the compounded effect of temperature and precipitation on yields can be seen as a crop’s adaptive mechanism when yields are sustained, long-growing maize varieties can be sensitive to water deficits or surpluses [61,88,98]. The sequences presented here indicate the patterns of climate variability need to be further explored and explained. Authors [10] and [32] provide a framework to model the complex interactions driven agricultural land use in West Africa (i.e., climate, socioeconomic, and land use). Authors [22] also highlighted the key roles of genomics and enviromics interconnections for crops phenotyping in a changing climate. However, it remains unclear how genetics and climate will interact and lead to secure agriculture in the short and long-term future.
Another perspective on the compounding effect of climate or environmental variables on maize yields and the sequence RH, SR, and T in Figure 6 can be linked to the use of observations and crop, Earth system, statistical and data modeling [29,80,87,92]. Figure 6 illustrates how the global sensitivity analysis, and the construction of environmental covariates enable the conceptualization of compounding environmental variables and identifying their individual contributions. GSA-GxE operates within a feasibility space that captures the complexity of plants’ response to spatiotemporal environmental variations. Such variations can also reflect our abilities to capture or parameterize processes using high-dimensional ecosystems of digital resources (i.e., data, parameterizations, analytics, and conceptualizations). Authors [99] used a crop model to assess how the effects of multiple factors on crop yields are sensitive to the spatial resolution of the inputs, the parameters in the implementation of the model, and, eventually, the results. While statistical approaches have used an explicit integration of genetic-by-environment interactions into the crop yield simulations, it remains unclear how the individual factors play a role across the large-scale areas [9,13,17,92]. Authors [25] and [80] highlight the need to characterize the individual contributions of climate factors on crop yield predictions. The effort presented here addresses this point and explores the relative contribution of four climate variables, which scales up what [91], and [17] showed. Some of those changes have not been characterized in terms of the individual contributions of multiple climate factors [23] and continue the activities launched by the G2F Initiative, including the studies of [16,83,91,100]. Furthermore, the resulting crop yield sensitivities to climate factors and their distribution across US-CAN suggest the need to identify the geospatial and temporal patterns of variability in the genetic-by-climate interactions. Such patterns and additional sources of predictability could emerge from monitoring technologies that combine unmanned aerial vehicles and eddy covariance towers [101,102], co-segmentation methods that enhance current computer vision- based phenotyping [103,104], remote sensing-based modeling for diagnostics and predictions of biophysical variables [105], and technologies to improve best management practices. These advances can contribute to seeing how predicted weather and climate conditions can aid hybrid selection, manage cultivars during the growing season, and prevent or mitigate major impacts of extreme hydrometeorological and climate events.

4. Conclusions

In this study, we developed a novel methodology to couple a GSA technique called PAWN with the statistical GxE model to quantify and rank the sensitivity index of maize yields predictability to hydroclimatic drivers, including T, SR, R, and RH variables. We take advantage of the multi-dimensional G2F database, which releases environmental, genetic, molecular markers, and phenotypes for maize grain yield from 2014 to 2017 across 84 experimental fields in the North America. The PAWN technique has been linked to GxE model through constructing environmental covariance matrices ( Ω ). The covariance function enables incorporating the co-variability effect of multiple climatic variables on the maize yield predictability by the GxE model. The coupled GSA-GxE framework has been tested for T (including Tmin, Tmean, and Tmax), SR (including SRmin, SRmean, and SRmax), R (including Racc), and RH (including RHmin, RHmean, and RHmax) covariables and the PAWN SIs have been obtained based on K-S statistics. The GSA-GxE couple has been implemented in two phases of unconditional and 100 iterations of conditional phase for each given conditional variable.
In conclusion, the increase in the sensitivity of maize yield predictability by GxE model (R2) compared to the sensitivity of environmental matrices ( Ω ) to the conditional hydroclimatic variables confirmed the large effect of genetic and environments interaction effect on the model performance. This effect is conceptualized by the product of genetic molecular markers ( G ) and the environmental ( Ω ) covariances in the GxE model.
The average shows the superior sensitivity of GxE performance to SR (SISR = 0.25). Afterward, T is the most influential variable on model predictive skill (SIT = 0.18). The sensitivity level of both R and RH has been estimated to be the same and slightly smaller than T (SIR = SIRH = 0.17). These results align with several previous studies showing SR’s major impact on average maize yield predictability. However, the geospatial sensitivity analysis illustrated that R is the responsible input variable to achieve the largest R2 values in 30% of the G2F experimental sites. The next dominant variable in GxE model predictive skill is RH in 31% of the locations. These results suggest that the geospatial sensitivity analysis proposed by the GSA-GxE framework will recognize the most influential environmental variables in the GxE performance improvement by considering the tested genetic variability in each experiment.
Finally, the authors recommend the proposed GSA-GxE methodology for further studies in sensitivity analysis of crop phenotypes predictability using GxE to other possible influential environmental variabilities like wind speed and soil properties using the proposed GSA-GxE framework. In this case, the researcher would be able to rank all the effective environmental key drivers and screen the uninfluential ones. Furthermore, the GxE performance sensitivity to the hydroclimatic drivers during each of the phenological development stages can also shed light on the specific time intervals with high-level sensitivity to the environmental variation during crop growth.

Author Contributions

Conceptualization, P.S. and F.M.A.; methodology, P.S. and F.M.A.; formal analysis, P.S. and F.M.A.; data curation, P.S.; writing—original draft preparation, P.S.; writing—review and editing, P.S. and F.M.A.; visualization, P.S.; supervision, F.M.A.; funding acquisition, F.M.A. All authors have read and agreed to the published version of the manuscript.

Funding

This research was funded by the Agriculture and Food Research Initiative Grant NEB-21-176 and NEB-21-166 from the USDA National Institute of Food and Agriculture, Plant Health and Production and Plant Products: Plant Breeding for Agricultural Production. In addition, we thank the Genomes to Fields (G2F) Initiative for providing the database; and Quantifying Life Sciences Initiative at the University of Nebraska-Lincoln.

Data Availability Statement

The data that support the findings of this study has been posted in Zenodo and will be made available to the public. A quick guideline for performing the Python scripts is provided in “ReadMe.txt” file, and the required Python packages to be installed will be documented.

Acknowledgments

The authors acknowledge the support provided by the Agriculture and Food Research Initiative Grant number NEB-21-176 and NEB-21-166 from the USDA National Institute of Food and Agriculture, Plant Health and Production and Plant Products: Plant Breeding for Agricultural Production. Also, we are grateful to the UNL Holland Computer Center for access to their high-computing facilities.

Conflicts of Interest

The authors declare no conflicts of interest.

References

  1. Muñoz Orozco, A. , 2003: CENTLI MAIZ. Prehistoria e historia, Diversidad, Potencial, Origen Génetico y Geográfico, Glosario Centli-Maíz. Colegio de Postgraduados en Ciencias Agrícolas. https://search.worldcat. 6514. [Google Scholar]
  2. Wheeler, T.; Von Braun, J. Climate Change Impacts on Global Food Security. Science 2013, 341, 508–511. [Google Scholar] [CrossRef] [PubMed]
  3. FAO, 2018: The Future of Food and Agriculture: Alternative Pathways to 2050, Food and Agriculture Organization of the United Nations. https://www.fao. 1157.
  4. Intergovernmental Panel on Climate Change (IPCC). Special Report on Climate Change and Land 2019. Available online: https://www.ipcc.ch/site/assets/uploads/2019/11/SRCCL-Full-Report-Compiled-191128.pdf.
  5. Stuart, L.; Hobbins, M.; Niebuhr, E.; Ruane, A.C.; Pulwarty, R.; Hoell, A.; Thiaw, W.; Rosenzweig, C.; Muñoz-Arriola, F.; Jahn, M.; et al. Enhancing Global Food Security: Opportunities for the American Meteorological Society. Bull. Am. Meteorol. Soc. [CrossRef]
  6. Springate, D.A.; Kover, P.X. Plant responses to elevated temperatures: a field study on phenological sensitivity and fitness responses to simulated climate warming. Glob. Chang. Biol. 2013, 20, 456–465. [Google Scholar] [CrossRef] [PubMed]
  7. Zabel, F.; Müller, C.; Elliott, J.; Minoli, S.; Jägermeyr, J.; Schneider, J.M.; Franke, J.A.; Moyer, E.; Dury, M.; Francois, L.; et al. Large potential for crop production adaptation depends on available future varieties. Glob. Chang. Biol. 2021, 27, 3870–3882. [Google Scholar] [CrossRef] [PubMed]
  8. Fradgley, N.S.; Bacon, J.; Bentley, A.R.; Costa-Neto, G.; Cottrell, A.; Crossa, J.; Cuevas, J.; Kerton, M.; Pope, E.; Swarbreck, S.M.; et al. Prediction of near-term climate change impacts on UK wheat quality and the potential for adaptation through plant breeding. Glob. Chang. Biol. 2022, 29, 1296–1313. [Google Scholar] [CrossRef]
  9. Jarquín, D.; Crossa, J.; Lacaze, X.; Du Cheyron, P.; Daucourt, J.; Lorgeou, J.; Piraux, F.; Guerreiro, L.; Pérez, P.; Calus, M.; et al. A reaction norm model for genomic selection using high-dimensional genomic and environmental data. Theor. Appl. Genet. 2013, 127, 595–607. [Google Scholar] [CrossRef] [PubMed]
  10. Wang, G.L., D. G. Wang, K.E. Trenberth, A. Erfanian, M. Yu, M.G. Bosilovich, and D. Parr, 2017: Peak structure and future changes of the relationships between extreme precipitation and temperature. Nat. Climate Change 2017, 7, 268–274. [Google Scholar] [CrossRef]
  11. Crossa, J.; Pérez-Rodríguez, P.; Cuevas, J.; Montesinos-López, O.; Jarquín, D.; de los Campos, G.; Burgueño, J.; González-Camacho, J.M.; Pérez-Elizalde, S.; Beyene, Y.; et al. Genomic Selection in Plant Breeding: Methods, Models, and Perspectives. Trends Plant Sci. 2017, 22, 961–975. [Google Scholar] [CrossRef]
  12. A Montesinos-López, O.; Montesinos-López, A.; Crossa, J.; Gianola, D.; Hernández-Suárez, C.M.; Martín-Vallejo, J. Multi-trait, Multi-environment Deep Learning Modeling for Genomic-Enabled Prediction of Plant Traits. G3 Genes|Genomes|Genetics 2018, 8, 3829–3840. [Google Scholar] [CrossRef] [PubMed]
  13. Montesinos-López, O.A.; Montesinos-López, A.; Pérez-Rodríguez, P.; Barrón-López, J.A.; Martini, J.W.R.; Fajardo-Flores, S.B.; Gaytan-Lugo, L.S.; Santana-Mancilla, P.C.; Crossa, J. A review of deep learning applications for genomic selection. BMC Genom. 2021, 22, 1–23. [Google Scholar] [CrossRef]
  14. Montesinos-López, O.A.; Crespo-Herrera, L.; Pierre, C.S.; Bentley, A.R.; de la Rosa-Santamaria, R.; Ascencio-Laguna, J.A.; Agbona, A.; Gerard, G.S.; Montesinos-López, A.; Crossa, J. Do feature selection methods for selecting environmental covariables enhance genomic prediction accuracy? Front. Genet. 2023, 14, 1209275. [Google Scholar] [CrossRef]
  15. Kick, D.R.; Wallace, J.G.; Schnable, J.C.; Kolkman, J.M.; Alaca, B.; Beissinger, T.M.; Edwards, J.; Ertl, D.; Flint-Garcia, S.; Gage, J.L.; et al. Yield prediction through integration of genetic, environment, and management data through deep learning. G3 Genes|Genomes|Genetics 2023, 13. [Google Scholar] [CrossRef] [PubMed]
  16. Liu, Q.; Yang, M.; Mohammadi, K.; Song, D.; Bi, J.; Wang, G. Machine Learning Crop Yield Models Based on Meteorological Features and Comparison with a Process-Based Model. Artif. Intell. Earth Syst. 2022, 1, 1–34. [Google Scholar] [CrossRef]
  17. Sarzaeim, P.; Muñoz-Arriola, F.; Jarquín, D. Climate and genetic data enhancement using deep learning analytics to improve maize yield predictability. J. Exp. Bot. 2022, 73, 5336–5354. [Google Scholar] [CrossRef] [PubMed]
  18. Sarzaeim, P., F. Munoz-Arriola, and D. Jarquin, 2022b: Large-scale and Multi-dimensional Climate, Genetics, and Phenotypes Database for Maize Yield Predictability in the U.S. and Canada, Zenodo, accessed. 29 September. [CrossRef]
  19. Sarzaeim, P.; Muñoz-Arriola, F.; Jarquin, D.; Aslam, H.; Gatti, N.D.L. CLIM4OMICS: a geospatially comprehensive climate and multi-OMICS database for maize phenotype predictability in the United States and Canada. Earth Syst. Sci. Data 2023, 15, 3963–3990. [Google Scholar] [CrossRef]
  20. Lopez-Cruz, M.; Aguate, F.M.; Washburn, J.D.; de Leon, N.; Kaeppler, S.M.; Lima, D.C.; Tan, R.; Thompson, A.; De La Bretonne, L.W.; Campos, G.d.L. Leveraging data from the Genomes-to-Fields Initiative to investigate genotype-by-environment interactions in maize in North America. Nat. Commun. 2023, 14, 690. [Google Scholar] [CrossRef] [PubMed]
  21. van Voorn, G.A.K.; Boer, M.P.; Truong, S.H.; Friedenberg, N.A.; Gugushvili, S.; McCormick, R.; Korts, D.B.; Messina, C.D.; van Eeuwijk, F.A. A conceptual framework for the dynamic modeling of time-resolved phenotypes for sets of genotype-environment-management combinations: a model library. Front. Plant Sci. 2023, 14, 1172359. [Google Scholar] [CrossRef] [PubMed]
  22. Crossa, J.; Fritsche-Neto, R.; Montesinos-Lopez, O.A.; Costa-Neto, G.; Dreisigacker, S.; Montesinos-Lopez, A.; Bentley, A.R. The Modern Plant Breeding Triangle: Optimizing the Use of Genomics, Phenomics, and Enviromics Data. Front. Plant Sci. 2021, 12. [Google Scholar] [CrossRef]
  23. Olesen, J.E.; Jensen, T.; Petersen, J. Sensitivity of field-scale winter wheat production in Denmark to climate variability and climate change. Clim. Res. 2000, 15, 221–238. [Google Scholar] [CrossRef]
  24. Southworth, J.; Randolph, J.; Habeck, M.; Doering, O.; Pfeifer, R.; Rao, D.; Johnston, J. Consequences of future climate change and changing climate variability on maize yields in the midwestern United States. Agric. Ecosyst. Environ. 2000, 82, 139–158. [Google Scholar] [CrossRef]
  25. Lobell, D.B.; Burke, M.B. Why are agricultural impacts of climate change so uncertain? The importance of temperature relative to precipitation. Environ. Res. Lett. 2008, 3, 034007. [Google Scholar] [CrossRef]
  26. Leng, G.; Zhang, X.; Huang, M.; Asrar, G.R.; Leung, L.R. The Role of Climate Covariability on Crop Yields in the Conterminous United States. Sci. Rep. 2016, 6, 33160–33160. [Google Scholar] [CrossRef] [PubMed]
  27. Luo, Q. Temperature thresholds and crop production: a review. Clim. Chang. 2011, 109, 583–598. [Google Scholar] [CrossRef]
  28. Ray, D.K.; Gerber, J.S.; MacDonald, G.K.; West, P.C. Climate variation explains a third of global crop yield variability. Nat. Commun. 2015, 6, 5989. [Google Scholar] [CrossRef] [PubMed]
  29. Ahmed, K.F.; Wang, G.; Yu, M.; Koo, J.; You, L. Potential impact of climate change on cereal crop yield in West Africa. Clim. Chang. 2015, 133, 321–334. [Google Scholar] [CrossRef]
  30. Iizumi, T.; Ramankutty, N. Changes in yield variability of major crops for 1981–2010 explained by climate change. Environ. Res. Lett. 2016, 11, 034003. [Google Scholar] [CrossRef]
  31. Lesk, C.; Rowhani, P.; Ramankutty, N. Influence of extreme weather disasters on global crop production. Nature 2016, 529, 84–87. [Google Scholar] [CrossRef] [PubMed]
  32. Wang, G.; Ahmed, K.F.; You, L.; Yu, M.; Pal, J.; Ji, Z. Projecting regional climate and cropland changes using a linked biogeophysical-socioeconomic modeling framework: 1. Model description and an equilibrium application over West Africa. Geosci. Model Dev. 2017, 9, 354–376. [Google Scholar] [CrossRef]
  33. Adams, M.W. Principles of Plant Breeding. Agron. J. 1962, 54, 372–372. [Google Scholar] [CrossRef]
  34. Evans, L.T. , 1993: Crop Evolution, Adaptation and Yield. University of Cambridge, New York, 514 pp.
  35. Duvick, D.N.; Cassman, K.G. Post–Green Revolution Trends in Yield Potential of Temperate Maize in the North-Central United States. Crop. Sci. 1999, 39, 1622–1630. [Google Scholar] [CrossRef]
  36. Ben Miflin, B. Crop improvement in the 21st century. J. Exp. Bot. 2000, 51, 1–8. [Google Scholar] [CrossRef]
  37. Howden, S.M.; Soussana, J.-F.; Tubiello, F.N.; Chhetri, N.; Dunlop, M.; Meinke, H. Adapting agriculture to climate change. Proc. Natl. Acad. Sci. USA 2007, 104, 19691–19696. [Google Scholar] [CrossRef] [PubMed]
  38. Brown, M.E. , and C.C. Funk, 2008: Climate: Food Security under Climate Change.
  39. Li, T.; Hasegawa, T.; Yin, X.; Zhu, Y.; Boote, K.; Adam, M.; Bregaglio, S.; Buis, S.; Confalonieri, R.; Fumoto, T.; et al. Uncertainties in predicting rice yield by current crop models under a wide range of climatic conditions. Glob. Chang. Biol. 2014, 21, 1328–1341. [Google Scholar] [CrossRef] [PubMed]
  40. Varshney, R.K.; Bohra, A.; Roorkiwal, M.; Barmukh, R.; Cowling, W.A.; Chitikineni, A.; Lam, H.-M.; Hickey, L.T.; Croser, J.S.; Bayer, P.E.; et al. Fast-forward breeding for a food-secure world. Trends Genet. 2021, 37, 1124–1136. [Google Scholar] [CrossRef] [PubMed]
  41. Reynolds, M.P.; Lewis, J.M.; Ammar, K.; Basnet, B.R.; Crespo-Herrera, L.; Crossa, J.; Dhugga, K.S.; Dreisigacker, S.; Juliana, P.; Karwat, H.; et al. Harnessing translational research in wheat for climate resilience. J. Exp. Bot. 2021, 72, 5134–5157. [Google Scholar] [CrossRef] [PubMed]
  42. Kang, Y.; Khan, S.; Ma, X. Climate change impacts on crop yield, crop water productivity and food security – A review. Prog. Nat. Sci. 2009, 19, 1665–1674. [Google Scholar] [CrossRef]
  43. Asseng, S.; Ewert, F.; Rosenzweig, C.; Jones, J.W.; Hatfield, J.L.; Ruane, A.C.; Boote, K.J.; Thorburn, P.J.; Rötter, R.P.; Cammarano, D.; et al. Uncertainty in simulating wheat yields under climate change. Nat. Clim. Chang. 2013, 3, 827–832. [Google Scholar] [CrossRef]
  44. Cammarano, D.; Rötter, R.P.; Asseng, S.; Ewert, F.; Wallach, D.; Martre, P.; Hatfield, J.L.; Jones, J.W.; Rosenzweig, C.; Ruane, A.C.; et al. Uncertainty of wheat water use: Simulated patterns and sensitivity to temperature and CO2. Field Crop. Res. 2016, 198, 80–92. [Google Scholar] [CrossRef]
  45. Jones, J.W.; Antle, J.M.; Basso, B.; Boote, K.J.; Conant, R.T.; Foster, I.; Godfray, H.C.J.; Herrero, M.; Howitt, R.E.; Janssen, S.; et al. Toward a new generation of agricultural system data, models, and knowledge products: State of agricultural systems science. Agric. Syst. 2016, 155, 269–288. [Google Scholar] [CrossRef] [PubMed]
  46. Shekhar, S., J. Colletti, F. Muñoz-Arriola, L. Ramaswamy, C. Krintz, B.L. Varshney, and D. Richardson, 2017: Preprint Intelligent Infrastructure for Smart Agriculture: An Integrated Food, Energy and Water System. [CrossRef]
  47. Rosenzweig, C.; Mbow, C.; Barioni, L.G.; Benton, T.G.; Herrero, M.; Krishnapillai, M.; Liwenga, E.T.; Pradhan, P.; Rivera-Ferre, M.G.; Sapkota, T.; et al. Climate change responses benefit from a global food system approach. Nat. Food 2020, 1, 94–97. [Google Scholar] [CrossRef]
  48. Demaria, E.M.; Nijssen, B.; Wagener, T. Monte Carlo sensitivity analysis of land surface parameters using the Variable Infiltration Capacity model. 112. [CrossRef]
  49. Muñoz-Arriola, F.; Avissar, R.; Zhu, C.; Lettenmaier, D.P. Sensitivity of the water resources of Rio Yaqui Basin, Mexico, to agriculture extensification under multiscale climate conditions. Water Resour. Res. 2009, 45. [Google Scholar] [CrossRef]
  50. Zhang, D.; Zhang, L.; Guan, Y.; Chen, X.; Chen, X. Sensitivity analysis of Xinanjiang rainfall–runoff model parameters: a case study in Lianghui, Zhejiang province, China. Hydrol. Res. 2012, 43, 123–134. [Google Scholar] [CrossRef]
  51. Dzotsi, K.; Basso, B.; Jones, J. Development, uncertainty and sensitivity analysis of the simple SALUS crop model in DSSAT. Ecol. Model. 2013, 260, 62–76. [Google Scholar] [CrossRef]
  52. Merchant, C.J.; Paul, F.; Popp, T.; Ablain, M.; Bontemps, S.; Defourny, P.; Hollmann, R.; Lavergne, T.; Laeng, A.; de Leeuw, G.; et al. Uncertainty information in climate data records from Earth observation. Earth Syst. Sci. Data 2017, 9, 511–527. [Google Scholar] [CrossRef]
  53. Khatun, S.; Sahana, M.; Jain, S.K.; Jain, N. Simulation of surface runoff using semi distributed hydrological model for a part of Satluj Basin: parameterization and global sensitivity analysis using SWAT CUP. Model. Earth Syst. Environ. 2018, 4, 1111–1124. [Google Scholar] [CrossRef]
  54. Wang, A.; Solomatine, D.P. Practical Experience of Sensitivity Analysis: Comparing Six Methods, on Three Hydrological Models, with Three Performance Criteria. Water 2019, 11, 1062. [Google Scholar] [CrossRef]
  55. Jaimes-Correa, J.C.; Muñoz-Arriola, F.; Bartelt-Hunt, S. Modeling Water Quantity and Quality Nonlinearities for Watershed Adaptability to Hydroclimate Extremes in Agricultural Landscapes. Hydrology 2022, 9, 80. [Google Scholar] [CrossRef]
  56. Song, X.; Zhang, J.; Zhan, C.; Xuan, Y.; Ye, M.; Xu, C. Global sensitivity analysis in hydrological modeling: Review of concepts, methods, theoretical framework, and applications. J. Hydrol. 2015, 523, 739–757. [Google Scholar] [CrossRef]
  57. Pianosi, F.; Beven, K.; Freer, J.; Hall, J.W.; Rougier, J.; Stephenson, D.B.; Wagener, T. Sensitivity analysis of environmental models: A systematic review with practical workflow. Environ. Model. Softw. 2016, 79, 214–232. [Google Scholar] [CrossRef]
  58. Pianosi, F.; Wagener, T. Understanding the time-varying importance of different uncertainty sources in hydrological modelling using global sensitivity analysis. Hydrol. Process. 2016, 30, 3991–4003. [Google Scholar] [CrossRef]
  59. Amaranto, A.; Pianosi, F.; Solomatine, D.; Corzo, G.; Muñoz-Arriola, F. Sensitivity analysis of data-driven groundwater forecasts to hydroclimatic controls in irrigated croplands. J. Hydrol. 2020, 587. [Google Scholar] [CrossRef]
  60. Amaranto, A.; Juizo, D.; Castelletti, A. Disentangling sources of future uncertainties for water management in sub-Saharan river basins. Hydrol. Earth Syst. Sci. 2022, 26, 245–263. [Google Scholar] [CrossRef]
  61. Sarzaeim, P.; Ou, W.; de Oliveira, L.A.; Munoz-Arriola, F. Flood-Risk Analytics for Climate-Resilient Agriculture Using Remote Sensing in the Northern High Plains. Geo-Extreme 2021. LOCATION OF CONFERENCE, GeorgiaDATE OF CONFERENCE; pp. 234–244.
  62. Bert, F.E.; Laciana, C.E.; Podestá, G.P.; Satorre, E.H.; Menéndez, A.N. Sensitivity of CERES-Maize simulated yields to uncertainty in soil properties and daily solar radiation. Agric. Syst. 2007, 94, 141–150. [Google Scholar] [CrossRef]
  63. Pathak, T.B.; Fraisse, C.W.; Jones, J.W.; Messina, C.D.; Hoogenboom, G. Use of Global Sensitivity Analysis for CROPGRO Cotton Model Development. Trans. ASABE 2007, 50, 2295–2302. [Google Scholar] [CrossRef]
  64. Lamboni, M.; Makowski, D.; Lehuger, S.; Gabrielle, B.; Monod, H. Multivariate global sensitivity analysis for dynamic crop models. Field Crop. Res. 2009, 113, 312–320. [Google Scholar] [CrossRef]
  65. Casadebaig, P.; Zheng, B.; Chapman, S.; Huth, N.; Faivre, R.; Chenu, K. Assessment of the Potential Impacts of Wheat Plant Traits across Environments by Combining Crop Modeling and Global Sensitivity Analysis. PLOS ONE 2016, 11, e0146385–e0146385. [Google Scholar] [CrossRef]
  66. Lu, Y.; Chibarabada, T.P.; McCabe, M.F.; De Lannoy, G.J.; Sheffield, J. Global sensitivity analysis of crop yield and transpiration from the FAO-AquaCrop model for dryland environments. Field Crop. Res. 2021, 269, 108182. [Google Scholar] [CrossRef]
  67. Jong, S.K.; Brewbaker, J.L.; Lee, C.H. Effects of Solar Radiation on the Performance of Maize in 41 Successive Monthly Plantings in Hawaii 1. Crop. Sci. 1982, 22, 13–18. [Google Scholar] [CrossRef]
  68. Muchow, R.C.; Sinclair, T.R.; Bennett, J.M. Temperature and Solar Radiation Effects on Potential Maize Yield across Locations. Agron. J. 1990, 82, 338–343. [Google Scholar] [CrossRef]
  69. Li, X.; Takahashi, T.; Suzuki, N.; Kaiser, H.M. The impact of climate change on maize yields in the United States and China. Agric. Syst. 2011, 104, 348–353. [Google Scholar] [CrossRef]
  70. Lobell, D.B.; Roberts, M.J.; Schlenker, W.; Braun, N.; Little, B.B.; Rejesus, R.M.; Hammer, G.L. Greater Sensitivity to Drought Accompanies Maize Yield Increase in the U.S. Midwest. Science 2014, 344, 516–519. [Google Scholar] [CrossRef]
  71. Johnston, R.Z.; Sandefur, H.N.; Bandekar, P.; Matlock, M.D.; Haggard, B.E.; Thoma, G. Predicting changes in yield and water use in the production of corn in the United States under climate change scenarios. Ecol. Eng. 2015, 82, 555–565. [Google Scholar] [CrossRef]
  72. Sarzaeim, P.; Muñoz-Arriola, F.; Jarquin, D. Analytics for climate-uncertainty estimation and propagation in maize-phenotype predictions. 2020 ASABE Annual International Virtual Meeting, -15, 2020. LOCATION OF CONFERENCE, COUNTRYDATE OF CONFERENCE; p. 1. 13 July.
  73. Pianosi, F.; Wagener, T. A simple and efficient method for global sensitivity analysis based on cumulative distribution functions. Environ. Model. Softw. 2015, 67, 1–11. [Google Scholar] [CrossRef]
  74. Aslam, H., P. Sarzaeim, and F. Munoz-Arriola, 2023: CLImate-for-Maize-OMICS_CLIM4OMICS-Analytics-and-Database: CLImate-for-Maize-OMICS_CLIM4OMICS-Analytics-and-Database Code, version 2., Zenodo, accessed. 29 September. [CrossRef]
  75. The Genomes To Fields (G2F) Initiative, 2013: Project: Genomes by Environment (GxE). Accessed . https://www.genomes2fields.org/home/#project-gxe. 21 November.
  76. van Eeuwijk, F.A.; Bustos-Korts, D.V.; Malosetti, M. What Should Students in Plant Breeding Know About the Statistical Aspects of Genotype × Environment Interactions? Crop. Sci. 2016, 56, 2119–2140. [Google Scholar] [CrossRef]
  77. Bustos-Korts, D., I. Romagosa, G. Borràs-Gelonch, A.M. Casas, G.A. Slafer, and F.V. Eeuwijk, 2018: Genotype by Environment Interaction and Adaptation. -44. [CrossRef]
  78. dos Reis, D.M.; Flach, P.; Matwin, S.; Batista, G. Fast Unsupervised Online Drift Detection Using Incremental Kolmogorov-Smirnov Test. KDD '16: The 22nd ACM SIGKDD International Conference on Knowledge Discovery and Data Mining. LOCATION OF CONFERENCE, United StatesDATE OF CONFERENCE;
  79. Moghim, S.; Bras, R.L. Bias Correction of Climate Modeled Temperature and Precipitation Using Artificial Neural Networks. J. Hydrometeorol. 2017, 18, 1867–1884. [Google Scholar] [CrossRef]
  80. Lobell, D.B.; Asseng, S. Comparing estimates of climate change impacts from process-based and statistical crop models. Environ. Res. Lett. 2017, 12, 015001. [Google Scholar] [CrossRef]
  81. Jägermeyr, J.; Müller, C.; Ruane, A.C.; Elliott, J.; Balkovic, J.; Castillo, O.; Faye, B.; Foster, I.; Folberth, C.; Franke, J.A.; et al. Climate impacts on global agriculture emerge earlier in new generation of climate and crop models. Nat. Food 2021, 2, 873–885. [Google Scholar] [CrossRef]
  82. Schwalbert, R.; Amado, T.; Nieto, L.; Corassa, G.; Rice, C.; Peralta, N.; Schauberger, B.; Gornott, C.; Ciampitti, I. Mid-season county-level corn yield forecast for US Corn Belt integrating satellite imagery and weather variables. Crop. Sci. 2020, 60, 739–750. [Google Scholar] [CrossRef]
  83. Rogers, A.R.; Holland, J.B. Environment-specific genomic prediction ability in maize using environmental covariates depends on environmental similarity to training data. G3 Genes|Genomes|Genetics 2021, 12. [Google Scholar] [CrossRef]
  84. Parent, B.; Tardieu, F. Temperature responses of developmental processes have not been affected by breeding in different ecological areas for 17 crop species. New Phytol. 2012, 194, 760–774. [Google Scholar] [CrossRef]
  85. Frey, H.C.; Patil, S.R. Identification and Review of Sensitivity Analysis Methods. Risk Anal. 2002, 22, 553–578. [Google Scholar] [CrossRef]
  86. Brown, R.A.; Rosenberg, N.J. Sensitivity of crop yield and water use to change in a range of climatic factors and CO2 concentrations: a simulation study applying EPIC to the central USA. Agric. For. Meteorol. 1997, 83, 171–203. [Google Scholar] [CrossRef]
  87. Ruane, A.C.; Cecil, L.D.; Horton, R.M.; Gordón, R.; McCollum, R.; Brown, D.; Killough, B.; Goldberg, R.; Greeley, A.P.; Rosenzweig, C. Climate change impact uncertainties for maize in Panama: Farm information, climate projections, and yield sensitivities. Agric. For. Meteorol. 2013, 170, 132–145. [Google Scholar] [CrossRef]
  88. Meng, Q.; Chen, X.; Lobell, D.B.; Cui, Z.; Zhang, Y.; Yang, H.; Zhang, F. Growing sensitivity of maize to water scarcity under climate change. Sci. Rep. 2016, 6, 19605–19605. [Google Scholar] [CrossRef]
  89. Silvestro, P.C.; Pignatti, S.; Yang, H.; Yang, G.; Pascucci, S.; Castaldi, F.; Casa, R. Sensitivity analysis of the Aquacrop and SAFYE crop models for the assessment of water limited winter wheat yield in regional scale applications. PLOS ONE 2017, 12, e0187485. [Google Scholar] [CrossRef]
  90. Fronzek, S.; Pirttioja, N.; Carter, T.R.; Bindi, M.; Hoffmann, H.; Palosuo, T.; Ruiz-Ramos, M.; Tao, F.; Trnka, M.; Acutis, M.; et al. Classifying multi-model wheat yield impact response surfaces showing sensitivity to temperature and precipitation change. Agric. Syst. 2018, 159, 209–224. [Google Scholar] [CrossRef]
  91. Jarquin, D.; de Leon, N.; Romay, C.; Bohn, M.; Buckler, E.S.; Ciampitti, I.; Edwards, J.; Ertl, D.; Flint-Garcia, S.; Gore, M.A.; et al. Utility of Climatic Information via Combining Ability Models to Improve Genomic Prediction for Yield Within the Genomes to Fields Maize Project. Front. Genet. 2021, 11. [Google Scholar] [CrossRef]
  92. Crossa, J. , and Coauthors, 2022: Genome and environment based prediction models and methods of complex traits incorporating genotype× environment interaction. Methods Mol. Biol., 2467, 245-283. [CrossRef]
  93. Tollenaar, M.; Fridgen, J.; Tyagi, P.; Jr, P.W.S.; Kumudini, S. The contribution of solar brightening to the US maize yield trend. Nat. Clim. Chang. 2017, 7, 275–278. [Google Scholar] [CrossRef]
  94. Chen, C.; Baethgen, W.E.; Robertson, A. Contributions of individual variation in temperature, solar radiation and precipitation to crop yield in the North China Plain, 1961–2003. Clim. Chang. 2012, 116, 767–788. [Google Scholar] [CrossRef]
  95. Bruce, W.B.; Edmeades, G.O.; Barker, T.C. Molecular and physiological approaches to maize improvement for drought tolerance. J. Exp. Bot. 2002, 53, 13–25. [Google Scholar] [CrossRef]
  96. Schlenker, W.; Roberts, M.J. Nonlinear temperature effects indicate severe damages to U.S. crop yields under climate change. Proc. Natl. Acad. Sci. 2009, 106, 15594–15598. [Google Scholar] [CrossRef]
  97. Maltais-Landry, G.; Lobell, D.B. Evaluating the Contribution of Weather to Maize and Wheat Yield Trends in 12 U.S. Counties. Agron. J. 2012, 104, 301–311. [Google Scholar] [CrossRef]
  98. Carrillo, C.M.; Muñoz-Arriola, F.; Chen, L. Multi-scale Sources of Precipitation Predictability in the Northern Great Plains, 2023120362, preprint 2023. [CrossRef]
  99. Priya, S.; Shibasaki, R. National spatial crop yield simulation using GIS-based crop production model. Ecol. Model. 2001, 136, 113–129. [Google Scholar] [CrossRef]
  100. Rogers, A.R.; Dunne, J.C.; Romay, C.; Bohn, M.; Buckler, E.S.; A Ciampitti, I.; Edwards, J.; Ertl, D.; Flint-Garcia, S.; A Gore, M.; et al. The importance of dominance and genotype-by-environment interactions on grain yield variation in a large-scale public cooperative maize experiment. G3 Genes|Genomes|Genetics 2021, 11. [Google Scholar] [CrossRef]
  101. Rico, D.A.; Munoz-Arriola, F.; Detweiler, C. Trajectory Selection for Power-over-Tether Atmospheric Sensing UAS. 2021 IEEE/RSJ International Conference on Intelligent Robots and Systems (IROS). LOCATION OF CONFERENCE, Czech RepublicDATE OF CONFERENCE; pp. 2321–2328.
  102. Rico, D.A.; Detweiler, C.J.; Muñoz-Arriola, F. Power-over-Tether UAS Leveraged for Nearly-Indefinite Meteorological Data Acquisition. 2020 ASABE Annual International Virtual Meeting, -15, 2020. LOCATION OF CONFERENCE, COUNTRYDATE OF CONFERENCE; p. 1. 13 July.
  103. Quiñones, R.; Samal, A.; Das Choudhury, S.; Muñoz-Arriola, F. OSC-CO2: coattention and cosegmentation framework for plant state change with multiple features. Front. Plant Sci. 2023, 14, 1211409. [Google Scholar] [CrossRef]
  104. Quiñones, R.; Munoz-Arriola, F.; Das Choudhury, S.; Samal, A. Multi-feature data repository development and analytics for image cosegmentation in high-throughput plant phenotyping. PLOS ONE 2021, 16, e0257001. [Google Scholar] [CrossRef]
  105. Volk, J.M.; Huntington, J.L.; Melton, F.S.; Allen, R.; Anderson, M.; Fisher, J.B.; Kilic, A.; Ruhoff, A.; Senay, G.B.; Minor, B.; et al. Assessing the accuracy of OpenET satellite-based evapotranspiration data to support water resource and land management applications. Nat. Water 2024, 2, 193–205. [Google Scholar] [CrossRef]
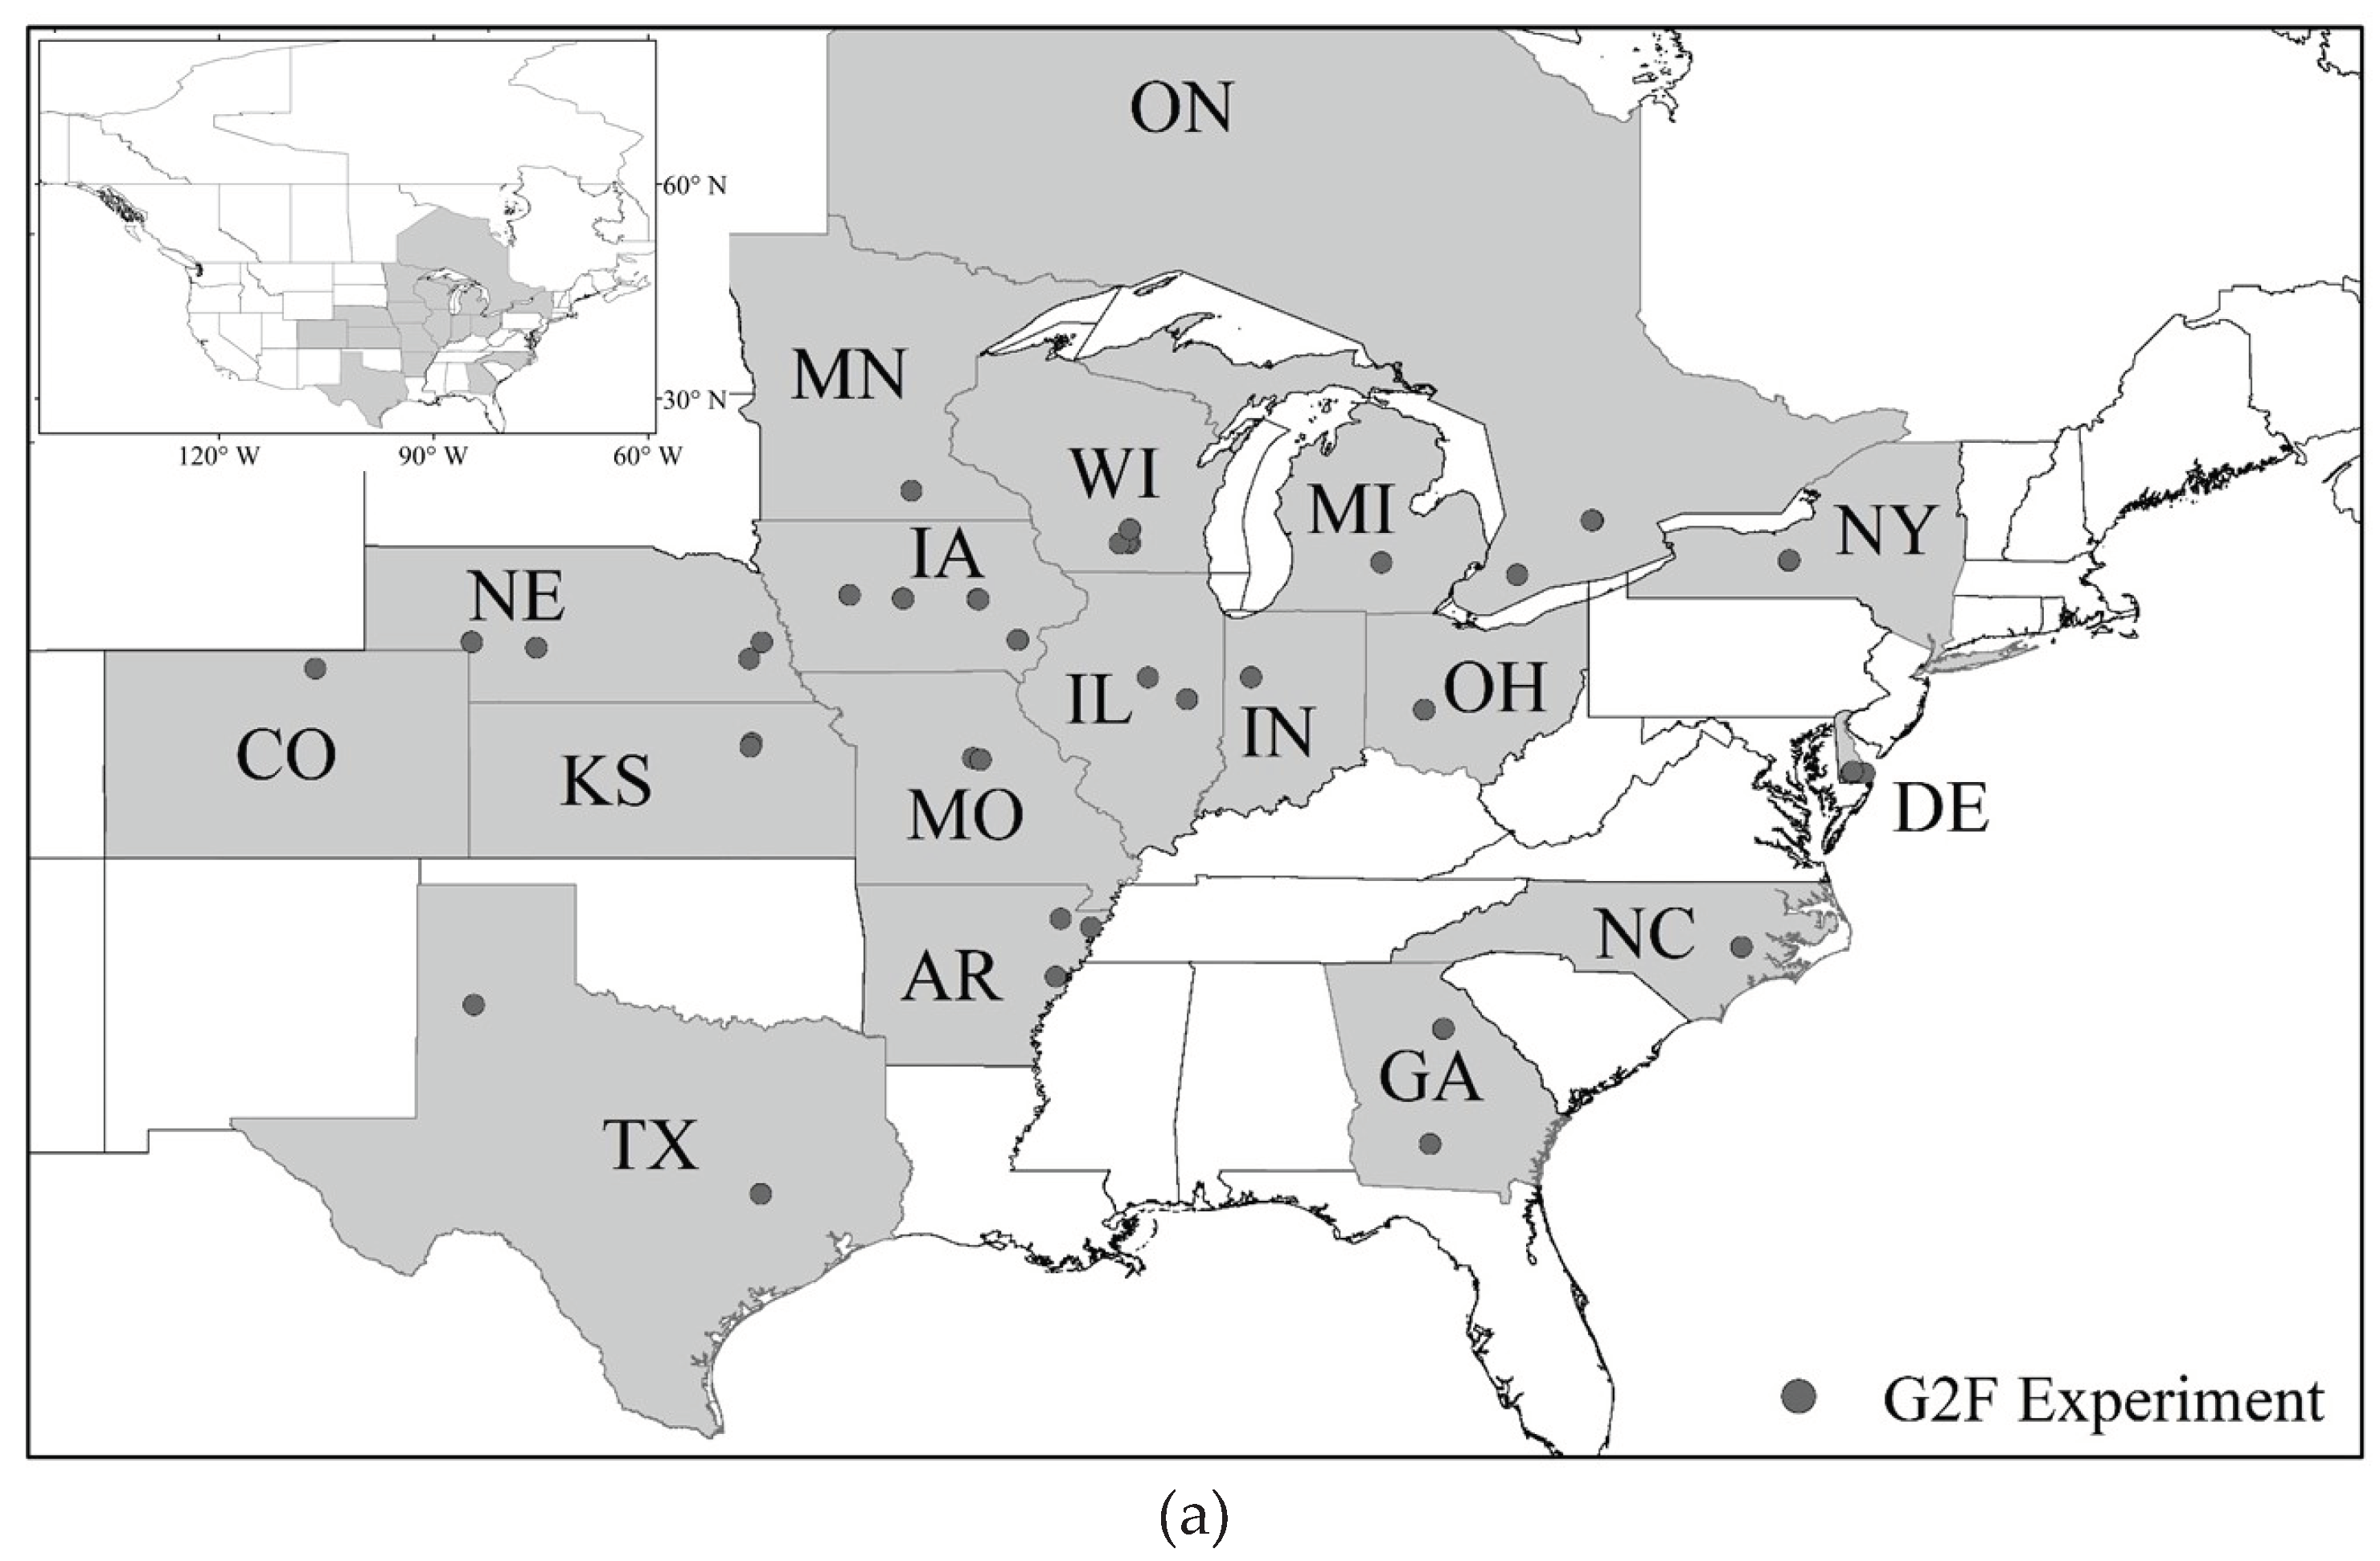
Figure 1. The spatial distribution of Genome to Field (G2F) experiments across the U.S. and Canada in (a). The collected genetic (G2F-G) dataset in (b), environmental (G2F-E) time series in (c), and phenotypic (G2F-P) observations in (d) in each of the G2F experimental maize plots are listed.
Preprints 101414 g001aPreprints 101414 g001b
Figure 2. The flowchart of PAWN technique in unconditional and conditional phases. If the function between inputs X 1 , X 2 , , X i and output Y is f , the model is implemented in unconditional ( Y = f U n c . ( X ) ) and conditional phases ( f C o n . ( X i = x i ) ). The Cumulative Distribution Functions are obtained in unconditional phase ( F U n c . Y ) and conditional phase ( F C o n . ( X i = x i ) ). The D X i is the Kolmogorov-Smirnov statistics and S I X i is the PAWN sensitivity index of model f to variable X i .
Preprints 101414 g002
Figure 3. The flowchart of coupled GSA-GxE framework through environmental covariance matrix ( Ω ) in unconditional and conditional phases for temperature. In unconditional phase all variables including minimum temperature (Tmin), mean temperature (Tmean), maximum temperature (Tmax), minimum dew point (DPmin), mean dew point (DPmean), maximum dew point (DPmax), minimum relative humidity (RHmin), mean relative humidity (RHmean), maximum relative humidity (RHmax), minimum solar radiation (SRmin), mean solar radiation (SRmean), maximum solar radiation (SRmax); accumulative rainfall (Racc), mean wind speed (WSmean), and mean wind direction (WDmean) vary all together in their observed domain and the GxE model is implemented ( Y = f U n c . ( T ) ). While in conditional phase, all variables vary in their observed domain but Tmin, Tmean and Tmax remain constant at a nominal value of tmin(n), tmean(n), and tmax(n), respectively, where n is the number of iterations (n = 1, …, 100). The conditional model ( f C o n . ( X i = x i ) ) is implemented in each iteration. The Cumulative Distribution Function of the output Y is obtained in unconditional ( F U n c . Y ) and each iteration of conditional phase ( F C o n . ( X i = x i ) ). The D X i is the Kolmogorov-Smirnov statistics and S I X i is the PAWN sensitivity index of GxE model to temperature. The similar methodology has been created and implemented for solar radiation (SRmin, SRmean, and SRmax) with nominal values of srmin, srmean, and srmax, accumulative rainfall (Racc) with nominal values of racc, and relative humidity (RHmin, RHmean, and RHmax) with nominal values of rhmin, rhmean, and rhmax, respectively. G2F-G, G2F-E, and G2F-P represent the G2F genetic, environmental, and phenotypic datasets, respectively.
Preprints 101414 g003
Figure 4. The histograms of environmental covariance values between each pair of 84 G2F experiments in (a) conditional phase for temperature (Con.T), (b) conditional phase for solar radiation (Con.SR), (c) conditional phase for rainfall (Con.R), and (d) conditional phase for relative humidity (Con.RH).
Preprints 101414 g004
Figure 5. The Cumulative Distribution Function (CDF) of coefficient of determination (R2) of GxE performance for conditional variable (a) temperature, (b) solar radiation, (c) rainfall, and (d) relative humidity. The solid black line represents the CDF of unconditional phase, and the red lines are the CDFs of conditional phase for temperature in (a), the yellow lines are the CDFs of conditional phase for solar radiation in (b), the blue lines are the CDFs of conditional phase for rainfall in (c), and the purple lines are the CDFs of conditional phase for relative humidity in (d) for all 100 iterations. Each line corresponds to a unique generated nominal value. The dashed lines represent the CDF of PAWN sensitivity index (SI). In (a) the four red dashed lines represent the SI = 0.18 to temperature, in (b) the yellow dashed line represents the SI = 0.25 to solar radiation, in (c) the three blue dashed lines represents the SI = 0.17 to rainfall, and in (d) five purple dashed lines represent the SI = 0.17 to relative humidity.
Preprints 101414 g005
Figure 6. The spatial distribution of the (a) largest (maximum of R2), and the second largest GxE model performance in the G2F area of study extracted from the analysis of years 2014-2017. The color represents the calculated Kolmogorov-Smirnov statistics, and the size of markers represents the size of R2. The minimum, median, and maximum R2 values and their associated sizes for each marker have been selected to be shown in the legend. The circle marker represents the sites where temperature (T), the diamond marker represents the sites where solar radiation (SR), the triangle marker represents the sites where rainfall (R), and the square marker represents the sites where relative humidity (RH) is the most important hydroclimatic variable.
Preprints 101414 g006
Table 1. The observed daily minimum, daily maximum, and range of conditional variables in all 84 G2F experiments. The G2F experiment in the parenthesis is the experiment that the minimum or maximum values is observed in.
Conditional variable Min Max Range
Tmin (°C) -10.7 (2014NYH1) 30.5 (2017ARH2) 41.2
Tmean (°C) -6.4 (2014NYH2) 32.5 (2017ARH2) 38.9
Tmax (°C) -5.7 (2014NYH2) 51.4 (2016IAH2) 57.1
SRmin (W/m2) 0 (All) 0 (All) 0
SRmean (W/m2) 0 (2017IAH4) 1168.3 (2017TXH1) 1168.3
SRmax (W/m2) 0 (2017IAH1, 2017IAH2, 2017IAH3, 2017IAH4) 1507.0 (2017MOH1) 1507.0
Racc (mm) 0 (All) 451.8 (2016IAH1) 451.8
RHmin (%) 0 (2016NCH1, 2017ARH2) 99.5 (2014IAH3) 99.5
RHmean (%) 10.2 (2017WIH1) 99.9 (2014IAH3) 89.7
RHmax (%) 11.2 (2017IAH3) 100.0 (All except 2016GAH2 and 2017NYH1) 88.8
Disclaimer/Publisher’s Note: The statements, opinions and data contained in all publications are solely those of the individual author(s) and contributor(s) and not of MDPI and/or the editor(s). MDPI and/or the editor(s) disclaim responsibility for any injury to people or property resulting from any ideas, methods, instructions or products referred to in the content.
Copyright: This open access article is published under a Creative Commons CC BY 4.0 license, which permit the free download, distribution, and reuse, provided that the author and preprint are cited in any reuse.
Prerpints.org logo

Preprints.org is a free preprint server supported by MDPI in Basel, Switzerland.

Subscribe

© 2024 MDPI (Basel, Switzerland) unless otherwise stated