1. Introduction
Fiber optic instrumentation, with its unique properties like multiplexing, electromagnetic immunity, compact size, long-distance data transmission, and electrical isolation [
1,
2,
3], presents several advantages over traditional electronics. In today's context, custom-designed fiber sensors are easily attainable, with notable applications spanning sectors such as aerospace [
4] environmental pollutant detection [
5], and high-temperature measurement in demanding conditions [
6]. These sensors not only outperform conventional electronic devices but also demonstrate their versatility across a diverse array of scenarios, particularly in compact or miniaturized sensor applications [
7,
8].
For temperature measurement, various approaches have garnered significant technological interest and have been subject to extensive study using a variety of techniques [
9,
10,
11]. Among the most widely utilized techniques for temperature measurement are fiber-based sensors, with the Fiber Bragg Grating (FBG) standing out. The spectral response of FBGs can be affected by direct changes in mechanical or thermal conditions [
12]. However, the high cost, complexity, and size of spectral interrogation systems for FBGs can be limiting, particularly for applications that demand compact and cost-effective sensing solutions.
In response to the challenges posed by FBGs, interest in studying fiber sensors based on modal interference has increased. In this configuration, when a laser beam travels through a multi-mode fiber, a speckle pattern appears at the output of the fiber [
16]. These patterns provide valuable insights into the spatial configuration of the fiber, allowing for the manipulation of energy distribution within the propagation modes when an external disturbance is applied to the fiber [
17]. Analyzing these patterns makes it possible to understand how the fiber responds and adapts to external influences. Furthermore, according to the physical and geometric characteristics of the optical fiber and the laser wavelength employed, different modes are excited. Thus, the statistical properties of the specklegram at the output of the fiber can be defined for a specific configuration based on these characteristics. Fiber speckle patterns can be represented mathematically by a sum of multiple random phasors, known as a "random walk", where each characteristic amplitude and phase can be represented in the complex plane. A resultant phasor describes constructive or destructive interference at each point, which implies a bright or dark zone [
16]. Supported on this phenomenon, it is possible to configure different sensing schemes giving rise to the Fiber Specklegram Sensors (FSS).
Different techniques have been reported to take advantage of the FSSs, from holographic to non-holographic techniques [
18,
19,
20,
21,
22,
23], some using correlation or amplitude analysis for the registered patterns by digital cameras [
21,
24,
25,
26], while others utilize variations in light intensity or optical power within the speckle pattern [
27,
28,
29,
30]. In specific cases, FSS have demonstrated the same or superior resolution compared to spectral analysis [
31,
32].
The latter proposals can be further developed using direct optical power interrogation systems. These systems enhance the intrinsic qualities of FSSs by offering simplicity in detection when connected to a photodetector, as well as stability and cost-effectiveness. In prior research contributions, it has been established that selecting optical properties for the specklegram and the filtering fiber is critical in configuring suitable optical power interrogation systems. This careful selection enables the designing of sensing systems characterized by a linear response. [
18,
19,
20,
21,
22,
23,
26,
33,
34].
This work reports an alternative portable-oriented FSS interrogated through optical power detection to evaluate its performance in a temperature measurement scheme as the sensing region length is modified. For comparative purposes, this work incorporates a parallel temperature sensing system utilizing an FBG, and the outcomes of both approaches are presented. This paper is organized as follows.
Section 2 explains the underlying principles, the significance of appropriate component selection, and the methodology for assessing the FSS's performance. In section 3, the characterization of the proposed scheme is reported. The experimental validation of the proposal is reported in
Section 4. The text finishes with conclusions summarizing findings and future work.
2. FSS Scheme For Temperature Measurements
2.1. Modal Analysis of the Speckle Pattern
When laser light with a wavelength (λ) propagates through a multi-mode fiber (MMF), the spatial intensity distribution at its output results from the combination of several optical modes traveling through it. The number of modes (M) in the fiber can be derived from the normalized frequency of the fiber V [
16],
In Eq. (1) NA is the numerical aperture of the fiber, a is the core radius, and is the wavenumber of light in vacuum given by .
In the case of a step profile optical fiber, when the radius of the fiber is much greater than the wavelength of laser radiation, M can be approximated as
Additionally, in the near-field approximation, the average grain size of the speckle pattern Ds is given by [
16,
22]:
For the proposed Fiber Speckle Sensing (FSS) system, both the choice of optical fibers and the laser wavelength are crucial. Specifically, these components are selected so that the average grain size is approximately equal to the diameter of the filtering optical fiber. This careful selection ensures optimal interaction between the speckle pattern and the filtering optical fiber, enhancing the sensitivity and performance of the FSS system.
The total power that is filtered on the core area A of the single-mode fiber can be expressed as
where
, is the intensity of the speckle pattern as a function of the electric field
of the optical mode superposition [
23].
2.2. FSS Scheme and Experimental Setup
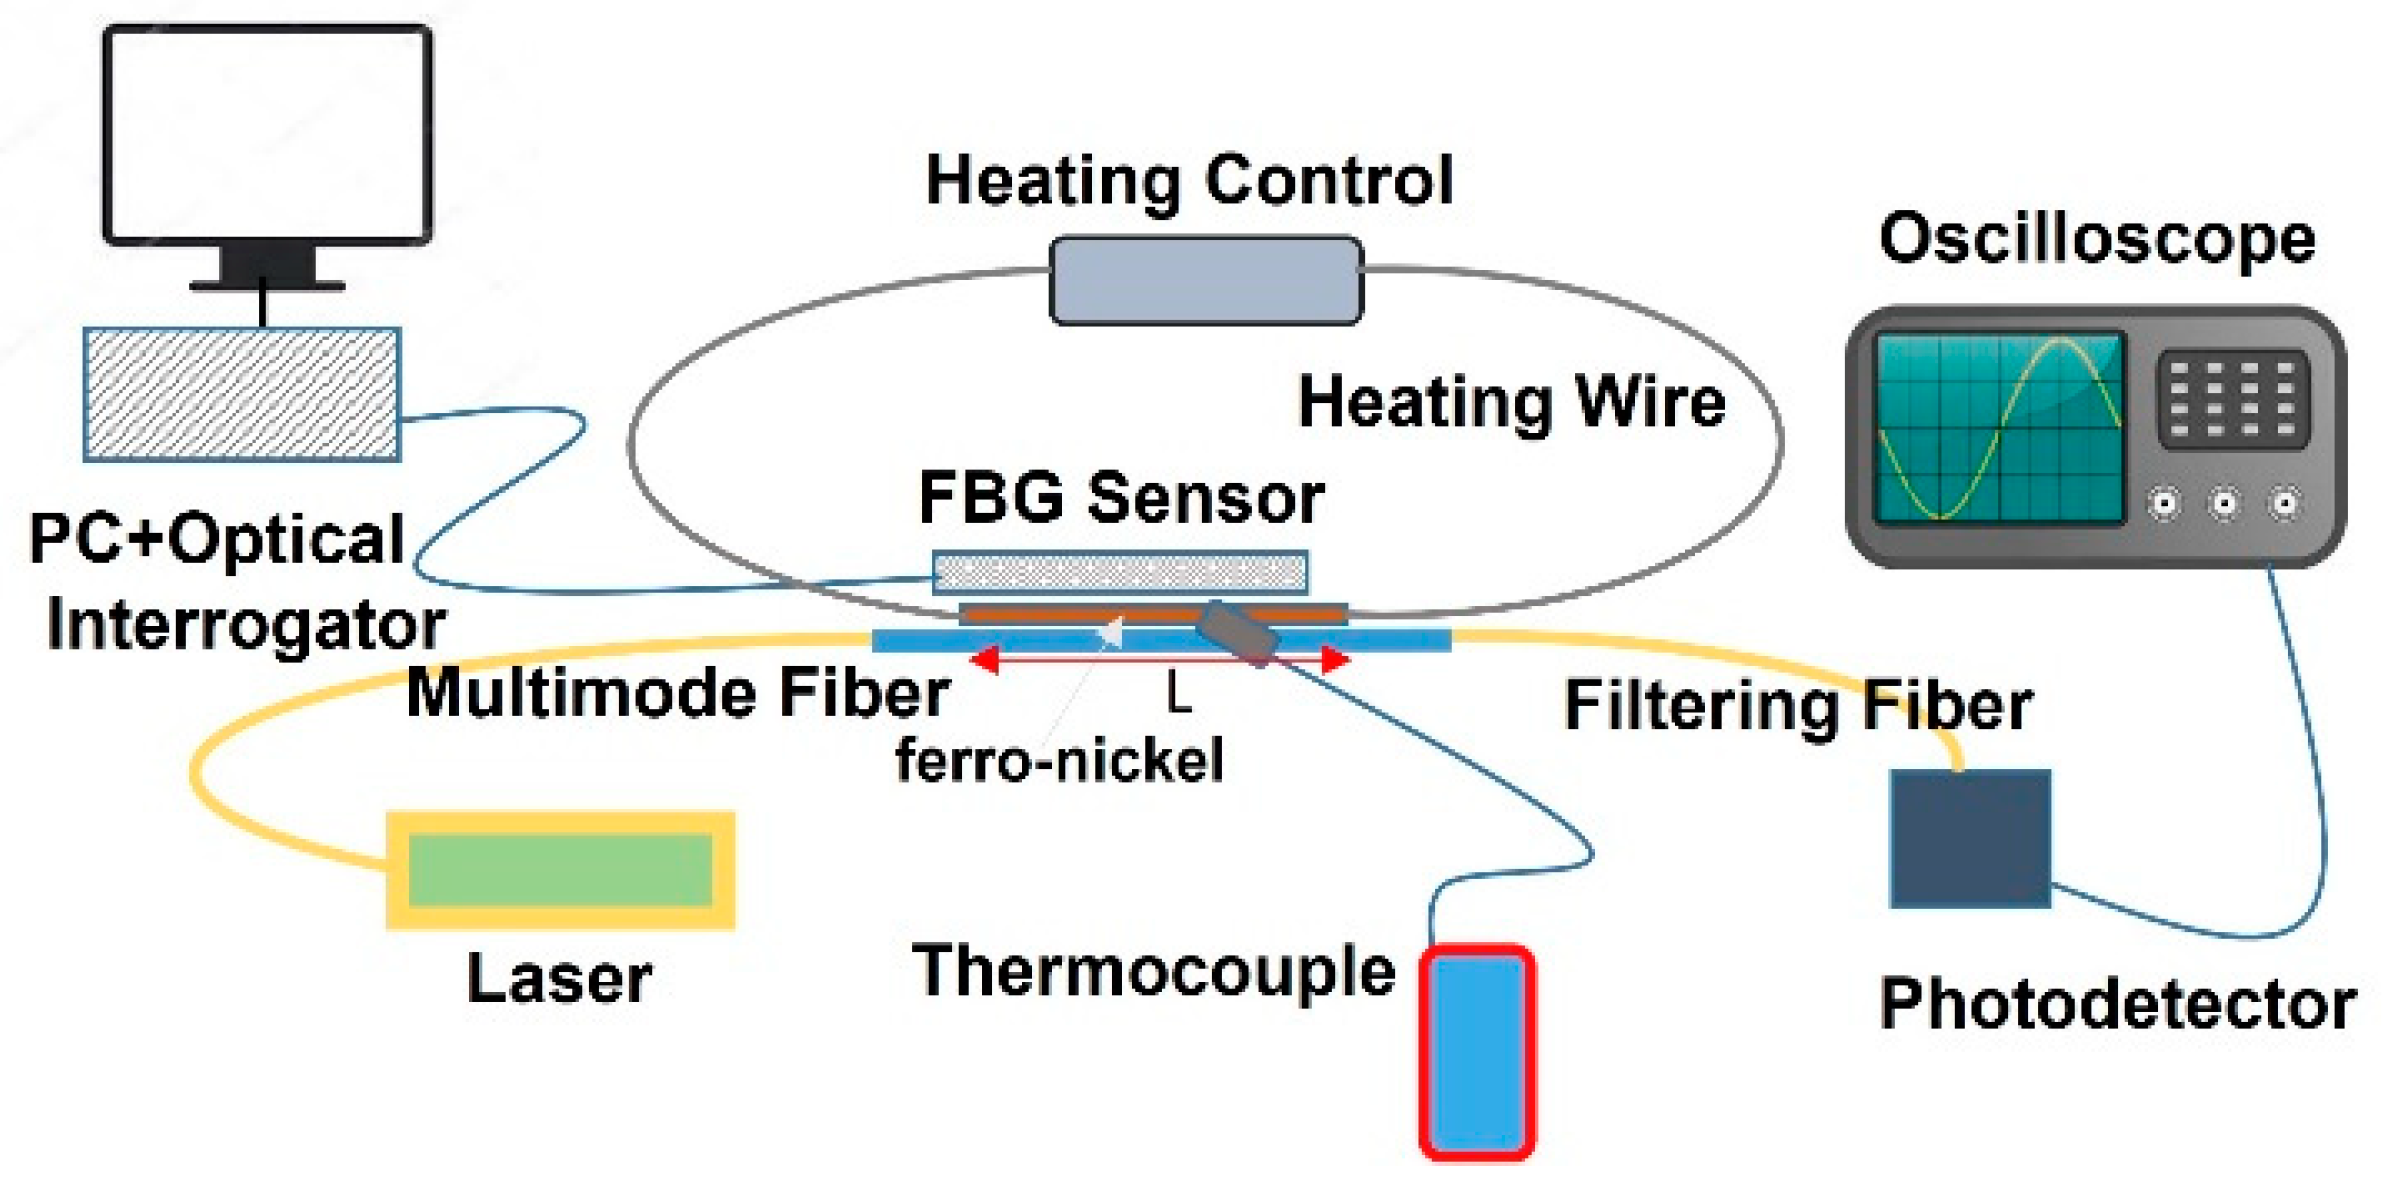
A filtering configuration of fibers that converts thermal variations into changes in optical power has been considered to develop a sensing scheme for optical fibers as a function of the local changes in the specklegram spatial distribution. The setup has been engineered with portability in mind, allowing for easy deployment in various environments. This can be achieved by placing a short (<20cm) and lightweight (<100 grams) single-mode fiber (SMF) after the speckle is generated at the output of the multi-mode fiber (MMF), which serves as a test filter tip. In this way, when the speckle is disturbed, the SMF detects a change in light from the specklegram, which is converted into a voltage signal by a photodetector. These temperature variations, produced by the heating mechanism, are indirectly measured by monitoring changes in the optical power registered by the photodetector at the fiber sensing scheme (FSS) output.
This proposal uses a standard SMF as a filter to measure the changes in light intensity of the speckle pattern grains formed by the propagation modes in an MMF. In the proposed setup, a 12 cm multi-mode fiber (MMF) (Thorlabs model FG050LGA, with NA 0.22, 50 μm core diameter) is seamlessly connected between two 15 cm segments of standard single-mode fiber (SMF) (Thorlabs model 1550-BHP, 9 μm core diameter). In this configuration, the fiber structure is illuminated using a 1490 nm fiber laser (Promax PROLITE-105), and at the output, a photodetector (Thorlabs DET01CFC), sensitive in the range of 800-1700 nm, is positioned. Although this laser has been selected for validation purposes, standard diode lasers can be readily incorporated into the system to achieve comparable measurements. Furthermore, the design's modularity allows for easy integration of portable power sources, such as battery packs or compact power supplies, enabling seamless operation in remote or off-grid locations.
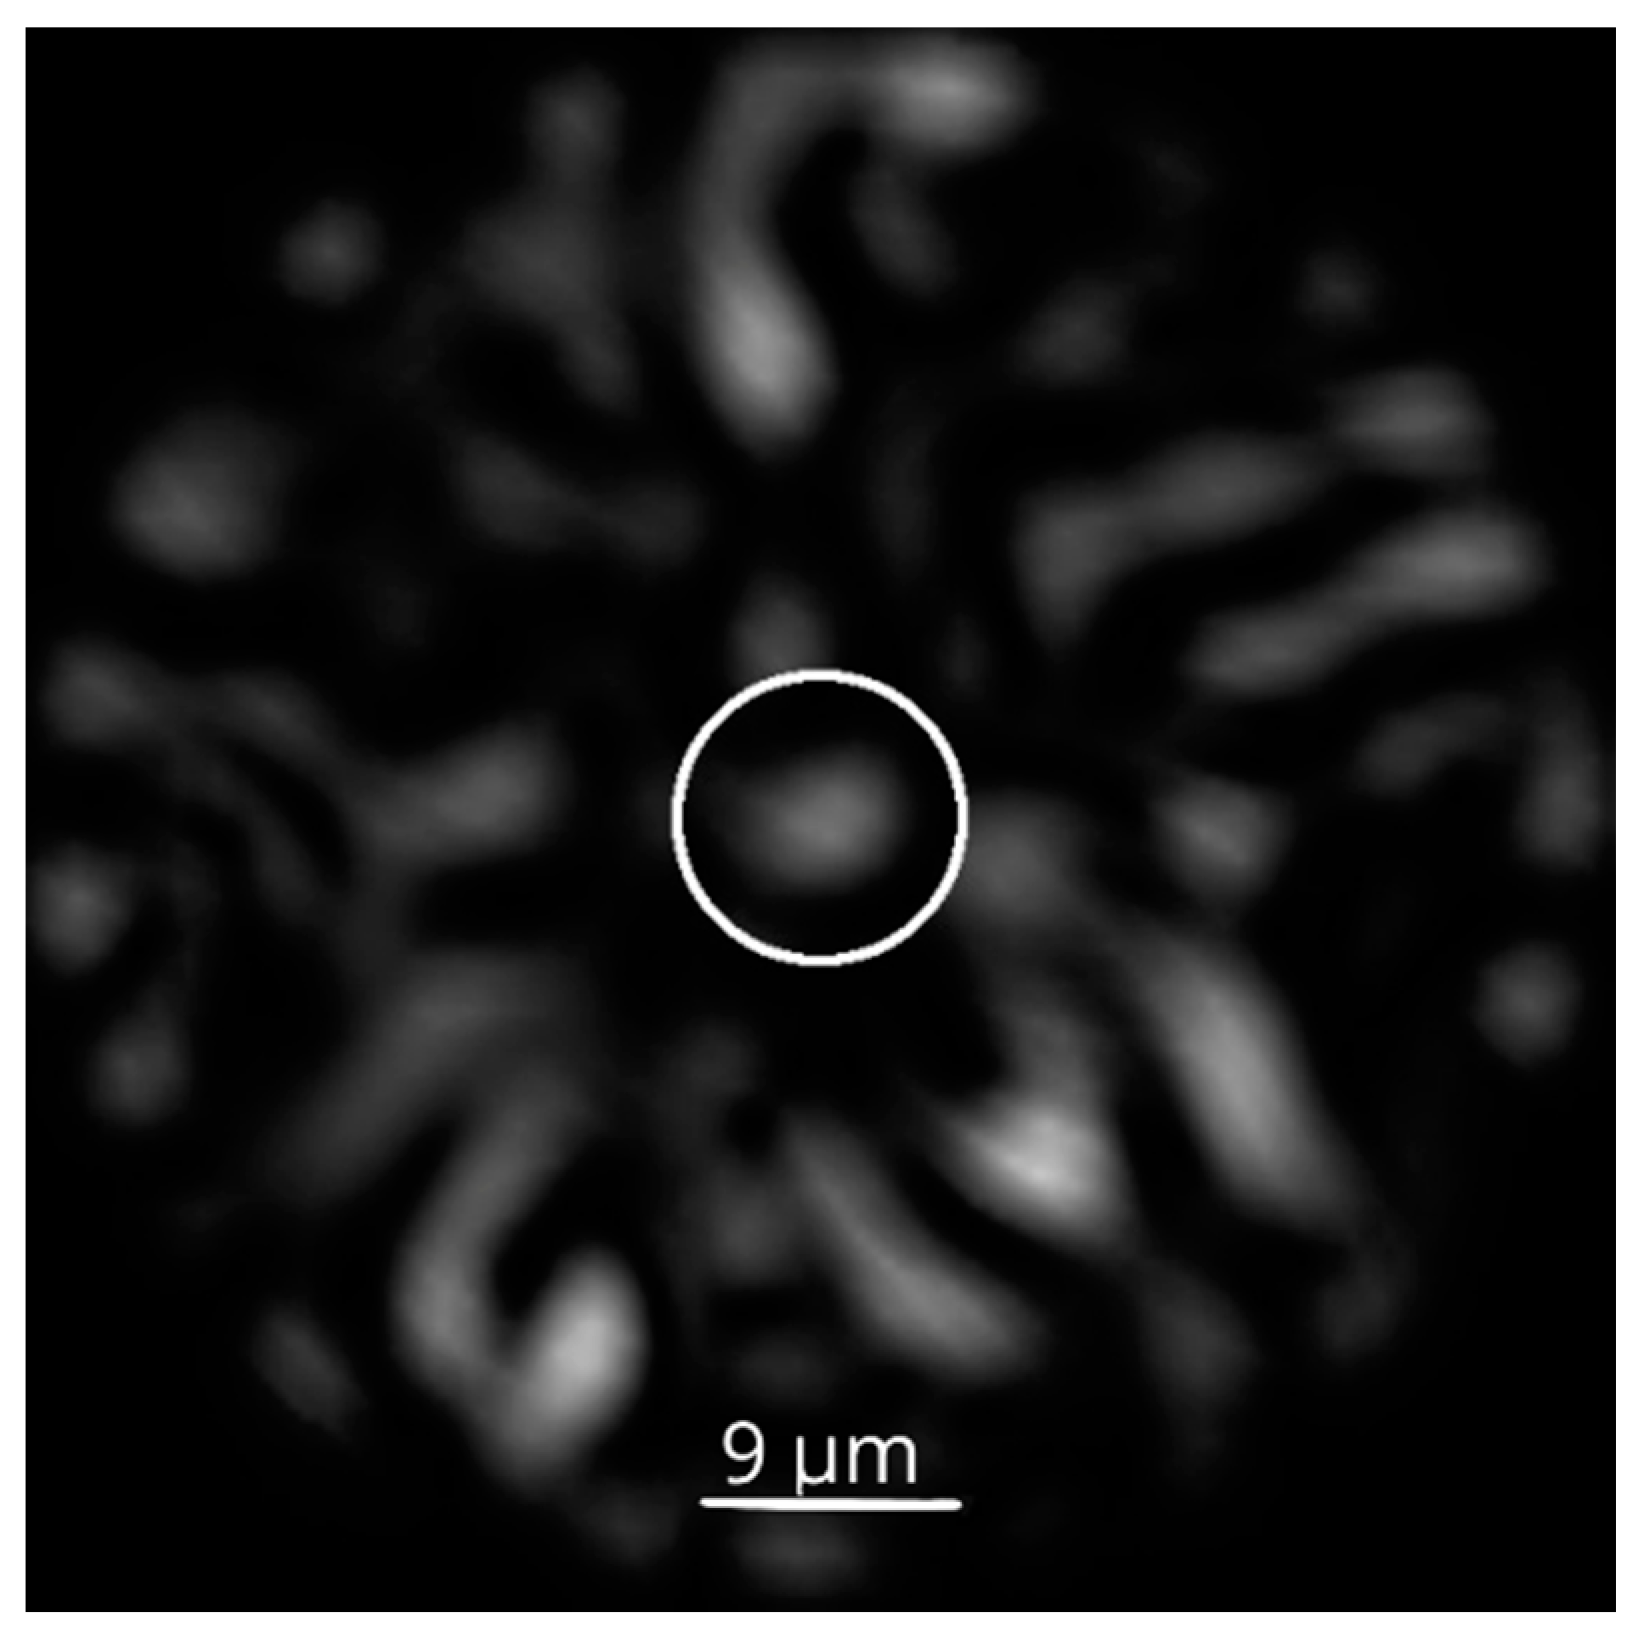
Considering equation (3), the optical parameters of the laser wavelength and the numerical aperture of the multi-mode fiber yield an average grain size of 6.8 μm, which is lower but comparable to the core diameter of the filtering single-mode fiber (9 μm). Therefore, the process of power capture by the filtering fiber can exhibit a significant variation under thermal perturbation.
Given that the laser light falls in the near-infrared range, the speckle pattern is not directly registered. Instead, a simulated specklegram generated by the Finite Element Method (FEM) has been used [
23]. The geometrical relation between the filtering fiber and the grain size in the multi-mode speckle pattern can be observed in
Figure 1, where a simulated specklegram for the considered optical parameters includes grains in a few modes condition with an average size around the estimated value (6.8 μm). The size of the core of the filtering single-mode fiber (9 μm in diameter) is represented as a white circle in the middle of the speckle pattern.
In the initial study of the proposed FSS, a thermal perturbation is introduced to evaluate the system's performance and metrological characteristics [
35]. This is achieved by bringing the detection zone in contact with an electric heater mechanism, which consists of a current-controlled ferro-nickel wire of length L. This setup enables precise control over both temperature and the length of the sensing area, facilitating a thorough assessment of the FSS's response to thermal changes.
To validate the accuracy of the temperature measurements obtained through the optical sensing system, a standard thermocouple is employed as a reference (see
Figure 2).
3. Characterization of the FSS Scheme
The characterization of the proposed FSS scheme provides valuable insights into its performance and metrological characteristics. Heating from room temperature (≈25℃) to 152℃ is initially conducted.
Figure 3 displays the voltage difference of the photodetector for different lengths L of the sensing area of the FSS plotted against the temperature reported by the thermocouple. As demonstrated in this figure, the response of the FSS exhibits a noticeable correlation with the length L of the sensing area.
The increasing trend of the response with rising temperature signifies its sensitivity to thermal changes. This behavior can be attributed to optical power alteration traversing the filtering fiber. These changes likely reflect variations in the size, intensity, or displacements of speckle pattern grains outside the filtering zone, as supported by previous studies [
18,
25]. Notably, the FSS response maintains a high level of linearity across the studied temperature range, showcasing its precision and reliability.
The fundamental metrological characteristics of the FSS proposed are now discussed.
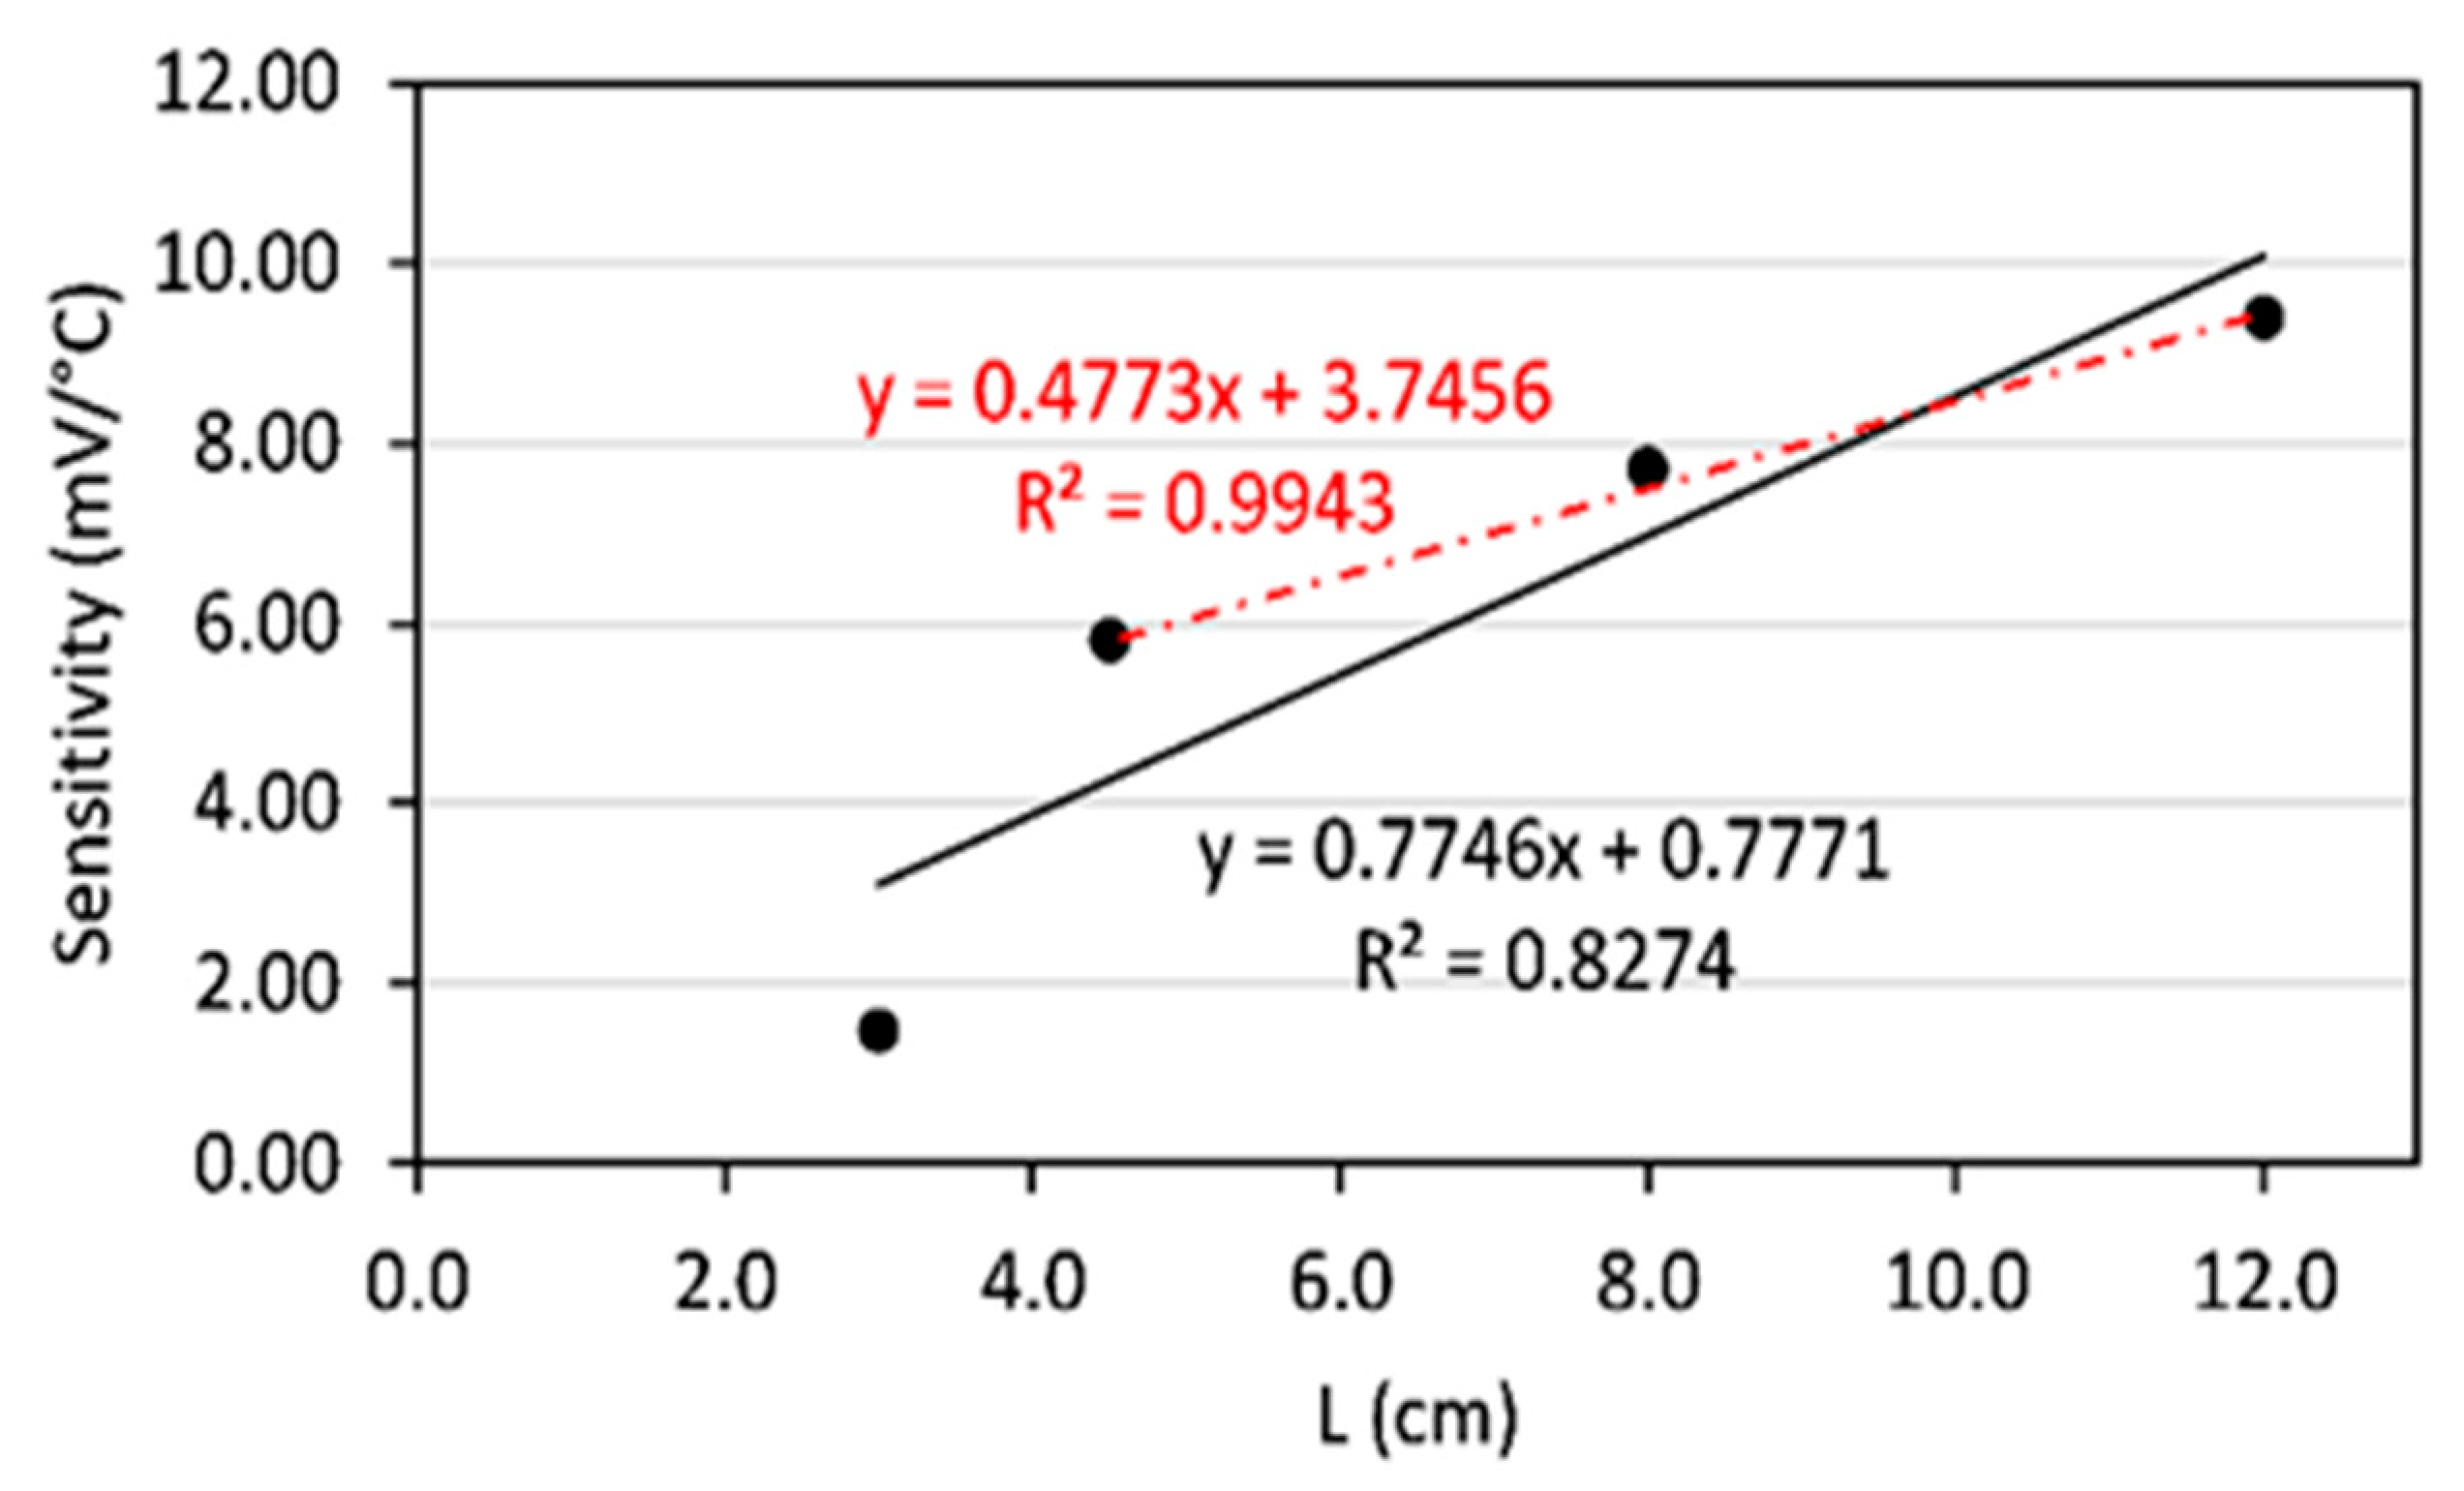
Figure 4 illustrates the proposed FSS's sensitivity, representing the calibration curve's slope. The sensitivity is maximized for the sensor with a sensing length of 12 cm. This indicates that longer sensing regions provide a more pronounced response to temperature fluctuations, making them a preferred choice for applications requiring high sensitivity.
In
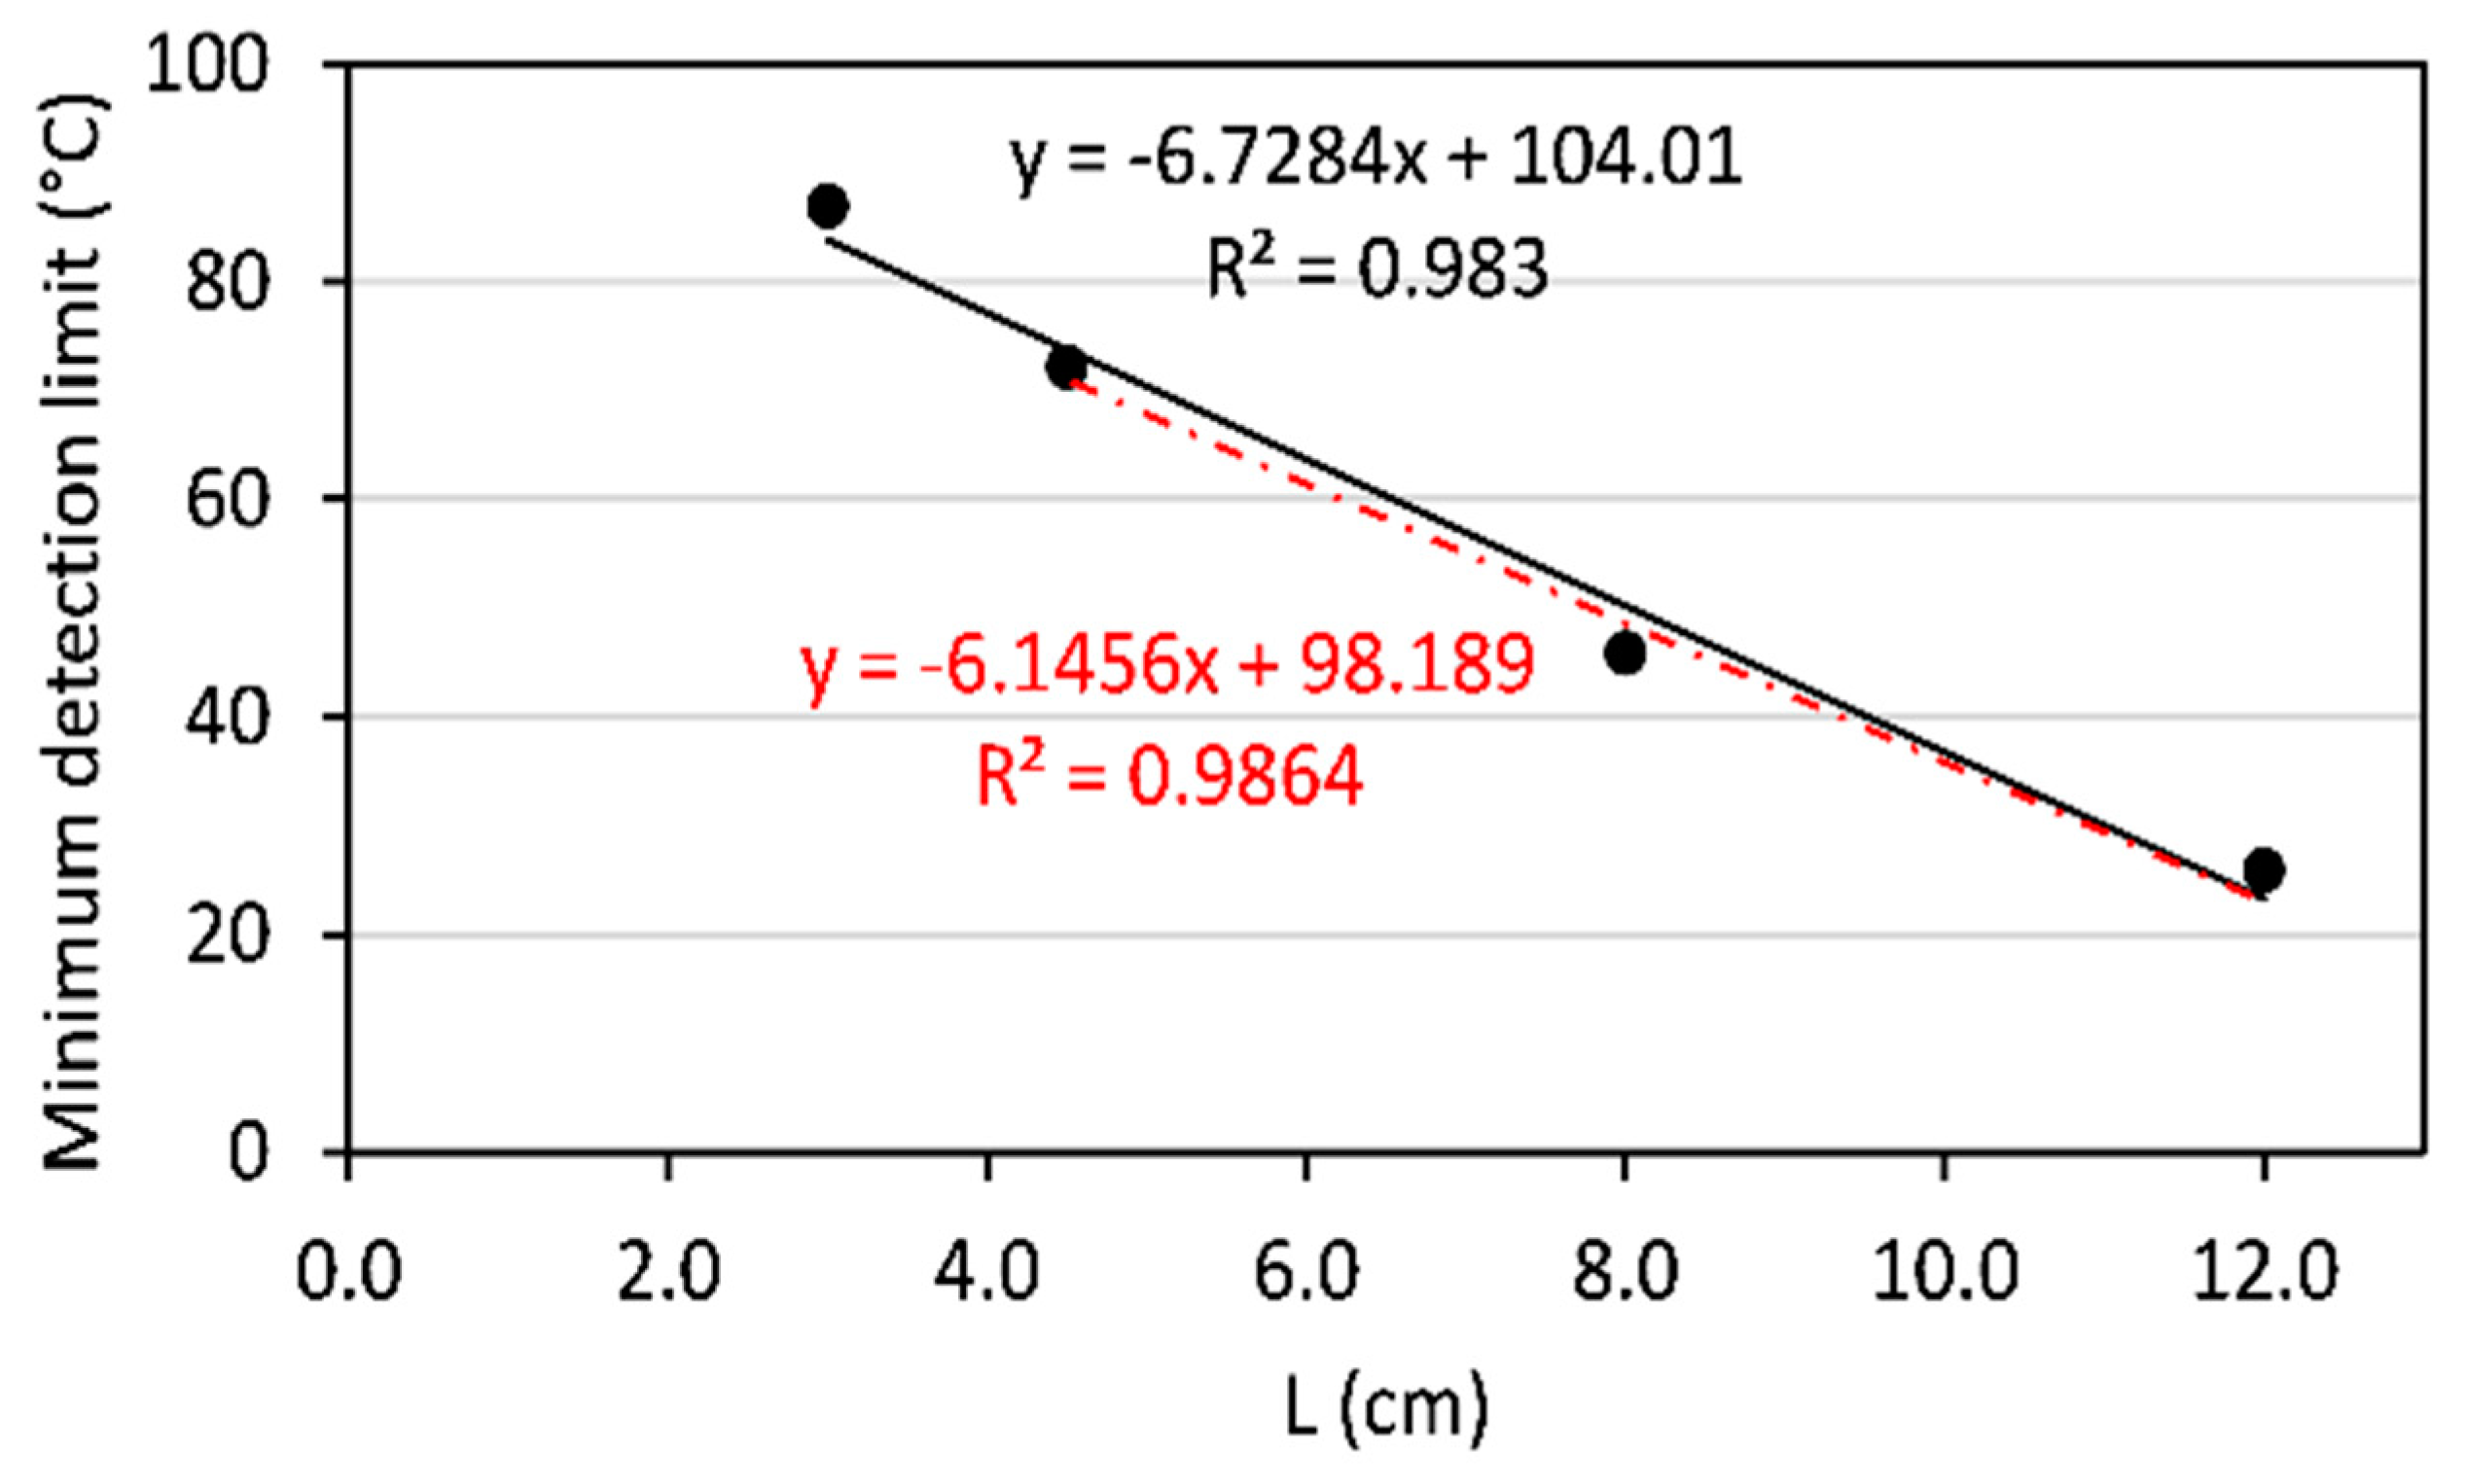
Figure 5, the minimum detection limit of the FSS for different lengths of the sensing region is detailed. The minimum detection limit defines the smallest temperature variation that can be accurately measured within a predefined level of precision or reproducibility while remaining within the system's linear dynamic range. Notably, the sensor with a sensing length of 12 cm exhibits the best performance in this aspect, signifying its capability to detect minute temperature changes with superior accuracy.
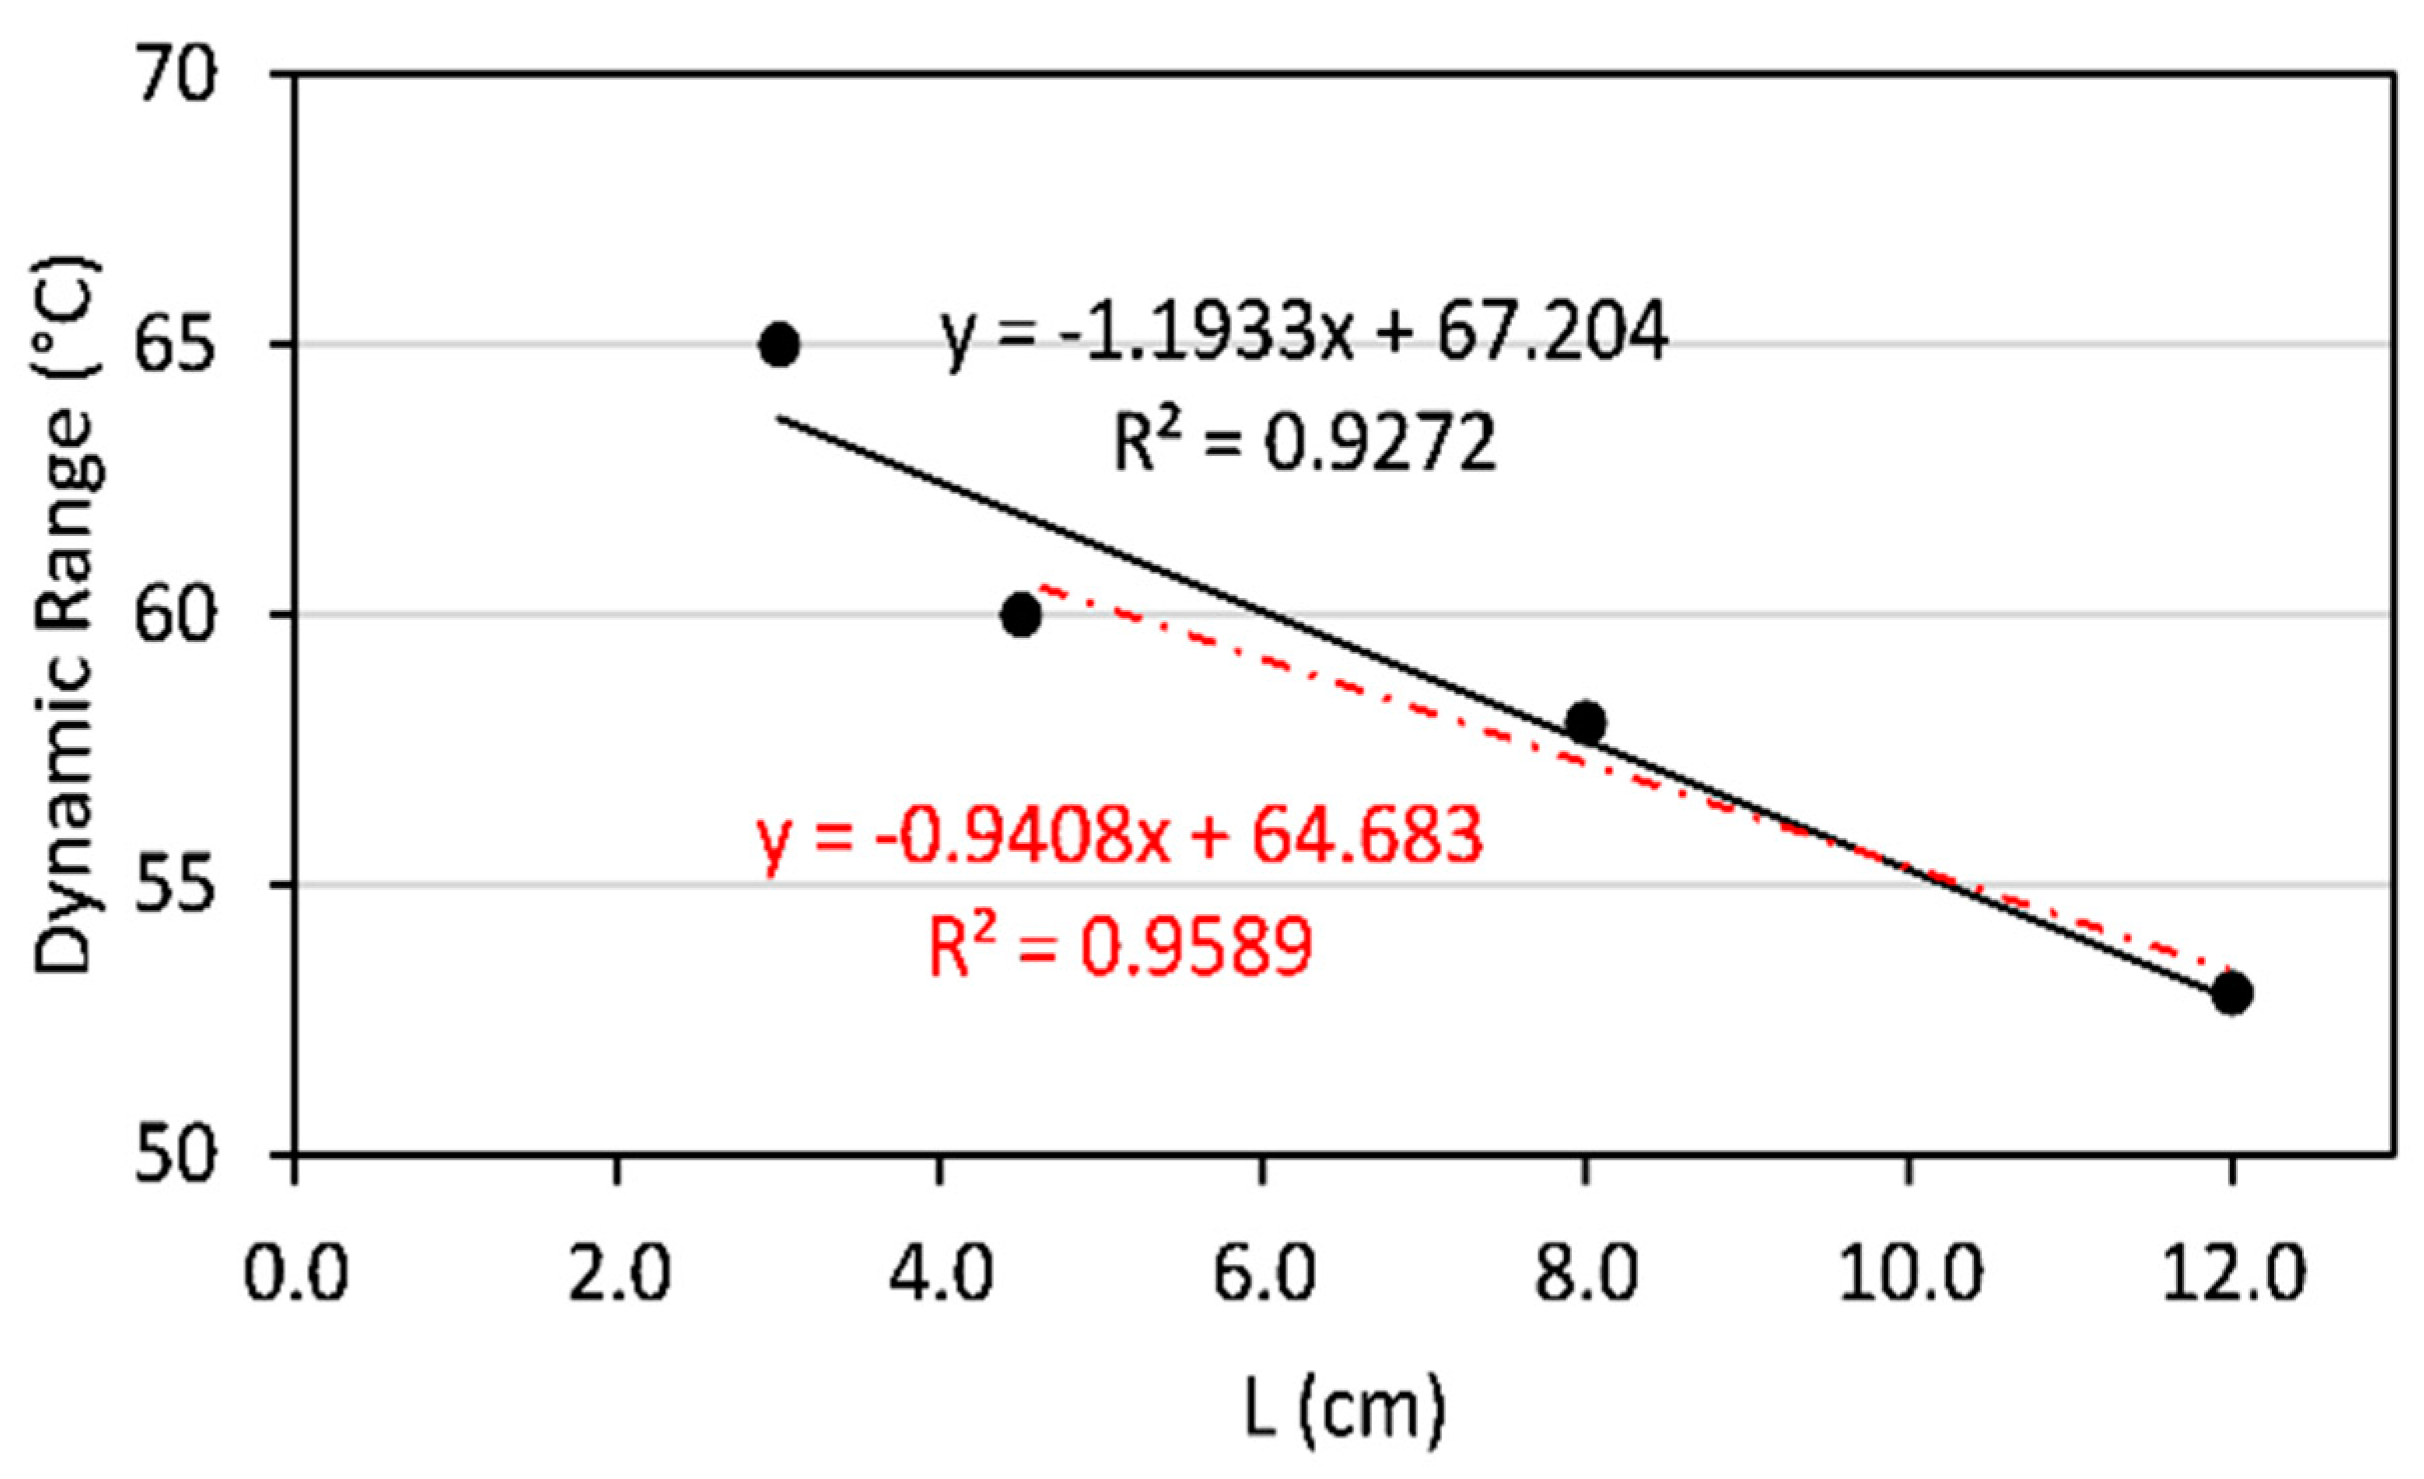
The dynamic range of the proposed FSS, illustrated in
Figure 6, provides insight into the system's capacity to measure a wide range of temperatures. As expected, the dynamic range decreases for sensors with longer sensing regions, primarily due to the increasing sensitivity, which can result in saturation at higher temperatures.
The solid black and red dash-dotted lines represent the linear regressions for all experimental points and the last three experimental points, respectively. The latter indicates high linearity starting from a sensing region length of 4.5 cm. These findings collectively emphasize the trade-off between sensitivity and dynamic range, with longer sensing regions delivering heightened sensitivity but potentially limiting the system's ability to measure extreme temperatures. The results highlight the importance of carefully selecting the sensing region length based on the specific requirements of the temperature measurement application, ensuring optimal performance while balancing the need for a broad dynamic range.
4. Validation with an FBG Sensor
The proposed FSS scheme experimental validation is pivotal in establishing its reliability and metrological performance. The FSS is compared with a well-established spectrally characterized FBG sensor to assess its capabilities.
The experimental setup involves optical power/voltage measurement with the FSS scheme and a spectral temperature measurement with the FBG sensor using an optical interrogator. The calibration function obtained in
Figure 3, for an L of 12 cm, is used to calculate the temperature as a function of the voltage difference provided by the photodetector in the second experimental setup. The calculation is given by
, where x represents the calculated temperature, and y is the measured voltage difference of the photodetector.
In this setup, the proposed FSS is subjected to thermal perturbations, while simultaneously, a commercially available spectrally characterized FBG fiber optic sensor (sensor: JPFBGT-300 Jphotonics, Inc. with a temperature range from -40°C to +85°C and a dynamic range of 125°C; interrogator: JPFBG-3500 Jphotonics, Inc.) is used as a comparative reference to validate and draw conclusions about the metrological performance of the FSS scheme. The FSS and FBG sensors are connected to an electrically controlled heating mechanism based on a ferronickel wire subjected to a controlled current. The FSS scheme and the FBG sensor induce the resulting temperature changes. A standard thermocouple is used as a common reference for both optical sensing systems.
The temperature variation for the proposed FSS and the FBG sensor, as compared to the temperature recorded by the thermocouple, is shown in
Figure 7. It can be observed that the FSS with a sensing region length of 12.0 cm and the FBG sensor demonstrate highly comparable performance yielding and root mean square difference in the measurements of 0.5°C. These results demonstrate the FSS's correct metrological performance and capacity to deliver temperature measurements that closely agree with the established FBG sensor, validating its potential as a reliable and accurate temperature sensing system.
5. Conclusions
This study introduces a temperature sensing scheme based on a Fiber Speckle Sensor (FSS). The FSS scheme proposed in this study has demonstrated linearity across various temperature ranges. The characterization of the FSS has revealed the significant impact of the sensing region's length on both sensitivity and the minimum detection limit. Notably, the FSS, particularly with a 12.0 cm sensing region, has shown performance comparable to that of a spectrally characterized Fiber Bragg Grating (FBG) fiber optic sensor, with an error of around 0.5°C.
This alternative scheme shows significant potential for developing compact and cost-effective sensing devices that deliver performance levels similar to their commercial optical counterparts. To realize this potential, it is recommended to explore longer sensing region lengths and investigate filter fibers with smaller core diameters. These research directions have the potential to enhance the FSS's sensitivity and linearity, improving its ability to accurately detect subtle temperature variations. Additionally, fine-tuning the illumination wavelength to limit propagation modes may significantly broaden the dynamic range and further improve the minimum detection limits. These envisioned advancements contribute to enhancing the versatility and reliability of the proposed FSS, suggesting a promising direction for future research efforts.
Author Contributions
F.V. and V.A. were responsible for developing the experimental setup, data acquisition, and representation. J.Q. and J.G. provided assistance in the validation process using an FBG sensor. C.T. and J.H. contributed to the Modal Analysis of the Speckle Pattern and the general Methodology.
Funding
Universidad Cooperativa de Colombia (UCC) (INV3612); Instituto Tecnológico Metropolitano (ITM) (P20215), Politécnico Colombiano Jaime Isaza Cadavid (P17217), and MINCIENCIAS National Doctorates program.
Acknowledgments
The authors acknowledge the technical assistance provided by Luis C. Gutiérrez and Luis F. Castaño.
Conflicts of Interest
The authors declare no conflicts of interest.
References
- Gåsvik, K.J. Optical metrology. J. Wiley & Sons, 2002.
- Yin, S.; Yu, F.T.S. Fiber optic sensors. Marcel Dekker, 2002.
- Ecke, W.; Chen, K.; Leng, J. Fiber optic sensors. Journal of Sensors 2012, 2012. [Google Scholar] [CrossRef]
- Rovera, A.; Tancau, A.; Boetti, N.; Dalla Vedova, M.D.L.; Maggiore, P.; Janner, D. Fiber Optic Sensors for Harsh and High Radiation Environments in Aerospace Applications. Sensors 2023, 23. [Google Scholar] [CrossRef] [PubMed]
- Yuan, Y.; Jia, H.; Xu, D.Y.; Wang, J. Novel method in emerging environmental contaminants detection: Fiber optic sensors based on microfluidic chips. Sci. Total Environ. 2023, 857, 159563. [Google Scholar] [CrossRef] [PubMed]
- Lin, S.; Qu, Y.; Zhang, H.; Wang, F.; Han, X.; Zhang, Y. Tip-Packaged High-Temperature Fiber-Optic Sensor Based on Parallel Fabry-Perot Interferometers and the Vernier Effect. IEEE Sens. J. 2023, 23, 19351–19358. [Google Scholar] [CrossRef]
- Dong, Y.; Zhang, J.; Zhang, C.; Fu, H.; Li, W.; Luo, W.; Hu, P. Analysis and Design of Fiber Microprobe Displacement Sensors Including Collimated Type and Convergent Type for Ultra-Precision Displacement Measurement. Micromachines 2024, 15, 224. [Google Scholar] [CrossRef] [PubMed]
- Ye, Y.; Zhao, C.; Wang, Z.; Teng, C.; Marques, C.; Min, R. Portable Multihole Plastic Optical Fiber Sensor for Liquid-Level and Refractive Index Monitoring. in IEEE Sensors Journal 2023, 23, 2161–2168. [Google Scholar] [CrossRef]
- Peng, Y.; Hou, J.; Huang, Z.; Lu, Q. Temperature sensor based on surface plasmon resonance within selectively coated photonic crystal fiber. Appl. Opt. 2012, 51, 6361. [Google Scholar] [CrossRef]
- Stolarczyk, A.; Jarosz, T.; Szczerska, M. Temperature Sensors Based on Polymer Fiber Optic Interferometer. Chemosens. 2022, 10, 228. [Google Scholar] [CrossRef]
- des Tombe, B.; Schilperoort, B.; Bakker, M. Estimation of Temperature and Associated Uncertainty from Fiber-Optic Raman-Spectrum Distributed Temperature Sensing. Sensors 2020, 20, 2235. [Google Scholar] [CrossRef]
- Zheng, Y.; Yu, J.; Yi, X. Design and investigation of a novel vector displacement sensor using fiber Bragg grating technology. Opt. Fiber Technol. 80, 103424.
- Campanella, C.; et al. Fibre Bragg Grating Based Strain Sensors: Review of Technology and Applications. Sensors. 2018, 18, 3115. [Google Scholar] [CrossRef]
- Huang, J.; et al. A Fiber Bragg Grating Pressure Sensor and Its Application to Pipeline Leakage Detection. Adv. Mech. Eng. 2013. [Google Scholar] [CrossRef]
- Sahota, J.K.; Gupta, N.; Dhawan, D. Fiber Bragg grating sensors for monitoring of physical parameters: a comprehensive review. https://iopscience.iop.org/article/10.1088/0957-0233/8/4/002 , vol. 59, no. 6, p. 060901, Jun. 2020. [CrossRef]
- Goodman, J.W. Speckle phenomena in optics : theory and applications. Roberts & Co, 2007.
- Yu, F.T.S. Fiber Specklegram Sensors. Fiber Opt. Sensors 2018, 201–252. [Google Scholar] [CrossRef]
- Leal-Junior, A.G.; Frizera, A., Marques. Optical Fiber Specklegram Sensors for Mechanical Measurements: A Review. IEEE Sens. J. 2020, 20, 569–576. [Google Scholar] [CrossRef]
- Gómez, N. Darío, and Gómez, J.A. Effects of the speckle size on non-holographic fiber specklegram sensors. Opt. Lasers Eng. 2013, 51, 1291–1295. [Google Scholar] [CrossRef]
- Fujiwara, E. , Marques dos Santos, M.F.; Suzuki, C.K. Optical fiber specklegram sensor analysis by speckle pattern division. Appl. Opt. 2017, 56, 1585. [CrossRef]
- Gutiérrez, L.C. et al. Specklegramas de fibra óptica analizados mediante procesamiento digital de imágenes. Rev. la Acad. Colomb. Ciencias Exactas, Físicas y Nat 2018, 42, 182. [Google Scholar] [CrossRef]
- Aristizabal, V.H.; et al. Effect of wavelength on metrological characteristics of non-holographic fiber specklegram sensor. Photonic Sensors 2015, 5, 1–5. [Google Scholar] [CrossRef]
- Arístizabal, V.H.; et al. Numerical modeling of fiber specklegram sensors by using finite element method (FEM). Opt. Express 2016, 24, 27225. [Google Scholar] [CrossRef] [PubMed]
- Al Zain, M. A High-Sensitive Fiber Specklegram Refractive Index Sensor with Microfiber Adjustable Sensing Area. IEEE Sens. J. 23, 15570. [CrossRef]
- Fujiwara, E.; et al. Optical fiber specklegram sensor for multi-point curvature measurements. Appl. Opt. 2022, 61, 6787–6794. [Google Scholar] [CrossRef]
- Gubarev, F.; et al. Speckle pattern processing by digital image correlation.
- Arístizabal, V.H.; et al. Numerical modeling of fiber specklegram sensors by using finite element method (FEM). Opt. Express 2016, 24, 27225. [Google Scholar] [CrossRef]
- Wang, J.-J. “Fiber-Optic Point-Based Sensor Using Specklegram Measurement. Sensors 2017, 17, 2429. [Google Scholar] [CrossRef] [PubMed]
- Arístizabal, V.H. Numerical analysis of Fiber Specklegram stress sensors. Opt. InfoBase Conf. Pap. 2016, 7–9. [Google Scholar] [CrossRef]
- Efendioglu, H.S. A Review of Fiber-Optic Modal Modulated Sensors: Specklegram and Modal Power Distribution Sensing. IEEE Sens. J. 2017, 17, 2055–2064. [Google Scholar] [CrossRef]
- Cai, L.; Wang, M.; Zhao, Y. Investigation on refractive index sensing characteristics based on multimode fiber specklegram. Meas. Sci. Technol. 2022, 34, 015125. [Google Scholar] [CrossRef]
- Lu, S.; Tan, Z.; Ji, W.; Zhang, D. A spatial domain multiplexing technology for fiber specklegram sensor. Opt. Fiber Technol. 2023, 81, 103505. [Google Scholar] [CrossRef]
- Herrera-Ramirez, J.; et al. Modeling Temperature Response of a Fiber Specklegram Sensor by Using Finite Element Method. in Latin America Optics and Photonics Conference, Nov. 2018, p. Tu4A.36. [CrossRef]
- Castaño, L.F.; et al. Temperature measurement by means of fiber specklegram sensors (FSS). Opt. Pura y Apl. 2018, 51, 1–7. [Google Scholar] [CrossRef]
- Arango, J.D. Numerical study using finite element method for the thermal response of fiber specklegram sensors with changes in the length of the sensing zone. Comput. Opt. 45, 534–540. [CrossRef]
|
Disclaimer/Publisher’s Note: The statements, opinions and data contained in all publications are solely those of the individual author(s) and contributor(s) and not of MDPI and/or the editor(s). MDPI and/or the editor(s) disclaim responsibility for any injury to people or property resulting from any ideas, methods, instructions or products referred to in the content. |
© 2024 by the authors. Licensee MDPI, Basel, Switzerland. This article is an open access article distributed under the terms and conditions of the Creative Commons Attribution (CC BY) license (http://creativecommons.org/licenses/by/4.0/).
