
Submitted:
19 March 2024
Posted:
19 March 2024
You are already at the latest version
Abstract
A case of low level windshear at Beijing Daxing International Airport is studied in the present pa-per. It is related to the synoptic scale/mesoscale changes of the airflow pattern over northern China. The shear was captured well by the Doppler LIDAR at the airport and timely alerts had been issued. This study considers the technical feasibility of forecasting the shear feature using a high resolution numerical weather prediction model with a lead time of several hours. It turns out that the shear feature could be forecast well, and is generally consistent with the actual observations. However, there are still discrepancies between reality and the simulation, such as the strength of the shear and persistency of the feature. More cases of windshear at Daxing airport would be studied in the fu-ture in order to understand the nature of windshear over there.
Keywords:
numerical simulation
; windshear
; Daxing International Airport
Introduction
Beijing Daxing International Airport was opened in 2019. It is the second airport at the capital city of China. It has been equipped with sophisticated engineering systems (Wang and Wang, 2023). In particular, the airport has been equipped with Doppler Light Detection And Ranging (LIDAR) systems for detection of low level windshear. The operation of LIDAR has been documented, e.g., in Yuan et al. (2022).
In the existing literature, some case studies of low level windshear at Daxing Airport have been briefly described. However, no in-depth investigation of the windshear cases has been conducted. The paper discusses in some details about a case of low level windshear at Daxing airport. Apart from observation of LIDAR in the alerting of windshear, the possibility of forecasting the windshear case has also been investigated using a high resolution numerical weather prediction (NWP) model, namely, based on Regional Atmospheric Modelling System (RAMS) version 6.3 (https://vandenheever.atmos.colostate.edu/vdhpage/rams.php) using large eddy simulation mode based on Deardorff (1980) turbulence parameterization scheme (Deardorff 1980). Similar studies of windshear cases based on RAMS 6.3 have been conducted for Hong Kong International Airport (Chan et al., 2021) and an airport on plateau in China (Chan et al., 2024). The objectives of the study are to document the wind case and to explore the technical feasibility of forecasting this case several hours in advance.
Synoptic Pattern
The windshear case occurs at the night time of 8 January 2023, namely, around 15 UTC (or 23H Beijing Standard Time, BST which is 8 hours ahead of UTC). The surface synoptic patterns at 12 UTC (20H, 8 January 2023) and 18 UTC (02H, 9 January 2023) are shown in Figure 1a,b respectively. Northern China was basically under the influence of a broad area of high pressure. This area moved eastwards gradually in this period of 6 hours. Over Beijing, it was under the influence of northeastely winds. However, the easterly flow associated with the southern frank of the high pressure area spread into the Beijing area gradually.
The above evolution of low level winds are also depicted clearly in the analysis if winds within the atmospheric boundary layer, e.g., at 925 hPa (Figure 2). At an earlier time (Figure 2a), the Beijing area was under the northeasterly flow associated with a broad anticyclone, which corresponded to the surface area of high pressure. As the anticyclone moved eastwards, a couple of grid points to the south of Beijing were analysed to have southeasterly and even southerly flow.
As a result of the above evolution of airflow, convergence between the background northeasterly flow and the southeasterly/easterly flow at the southern frank of the anticyclone/surface area of high pressure may result in a shear line in synoptic scale/mesoscale. The convergence of the two airflows may bring about low level windshear to Daxing airport.
Along with the surface analysis and wind analysis at 925 hPa level, vertical wind profiles detected by the wind profilers operated by the China Meteorological Administration near Daxing area were also studied. Taking into account the availability of data and locations of wind profilers with respect to Daxing airport, wind data from two wind profilers near Daxing as depicted in Figure 3 were studied. Wind profiler 54399 is located in Haidian at around 70 km north of the Daxing airport while the another one in Tangshan, with station code 54534, is around 200 km to the east of Daxing. Figure 3 also shows the location of radiosonde station at Beijing Capital International Airport (station code 54511).
In the evening of 8 January (20H) to early morning of 9 January (02H), low level winds (up to around 1 km) recorded by 54399 (Figure 4a) revealed that northeasterlies prevailed during the period concerned. At the same time, wind profile at 54534 (Figure 4b), located east of Daxing, reflected the penetration and strengthening of easterly wind with northeasterlies turned to easterlies in the atmospheric boundary layer. The information further supported the convergence of the northeasterlies at Haidian with the easterlies from Tangshan at low levels around Daxing airport, which in turn result in low level windshear.
Under the influence of anticyclonic flow, the near surface atmosphere over Beijing area was rather stable in the night time of 8 January as evidenced by the tephigram for 54511 (Figure 5), and such condition also conducive to the formation of windshear in the vicinity of the Daxing airport.
Doppler LIDAR
The Doppler LIDAR in use at Daxing airport has a wavelength of 1550 nm and pulse repetition frequency of 1000. The time window of the pulse is 400 ns.
The LIDAR is configured to make a number of scans in each cycle. It firstly measures the noise floor, followed by 3-degree Plan Position Indicator (PPI) scan for measuring wind shear at arrival runway corridors, and a 45-degree PPI scan for upper air wind measurements. Then it performs a glide-path scan (Shun and Chan, 2008) at 01L run-way and then another glide-path scan at 19R runway. It takes a few minutes for each scan cycle to complete.
LIDAR Observation
The 3-degree plan position indicator (PPI) scans of the Doppler LIDAR at Daxing airport are considered. Only the velocity imageries are used.
At around 15 UTC, strong northeasterly flow prevailed over the airport area (Figure 6a). At around 16 UTC (Figure 6b), east-northeasterly flow/easterly flow began to appear to the south of the LIDAR. A shearline was detected automatically by the windshear algorithm of the airport (Yuan et al., 2022).
Between around 16:03 UTC and 16:14 UTC, low level windshear alerts associated with the shearline were issued automatically based on the LIDAR data. The windshear event was rather transient but was successfully captured by the LIDAR. As the windshear event was rather short and occurred in the night-time, its impact on the airport operation turned out to be rather minimal. Yet low level windshear is a hazardous weather to aviation and the Doppler LIDAR performs very well in capturing its occurrence. The question is whether the windshear event could be forecast, e.g., using high resolution NWP model.
Numerical Simulation
As in the previous studies of low level windshear in Hong Kong and the plateau in China, a high resolution NWP model is used by nesting with the 0.25 degree forecast from National Centers for Environmental Prediction (NCEP) global model of the U.S. Five nests are performed with spatial resolutions of 25 km, 5 km, 1 km, 200 m and 40 m. Deardorff (1980) turbulence parameterization scheme is adopted in the innermost three nests. The model domains are shown in Figure 7. They are centred at the location of the Doppler LIDAR at Daxing airport. The model simulation results are interpolated at the 3-degree PPI scans of the LIDAR to produce the simulated LIDAR velocity imageries. The model is initialized at 12 UTC, 8 January 2023 and run for 6 hours.
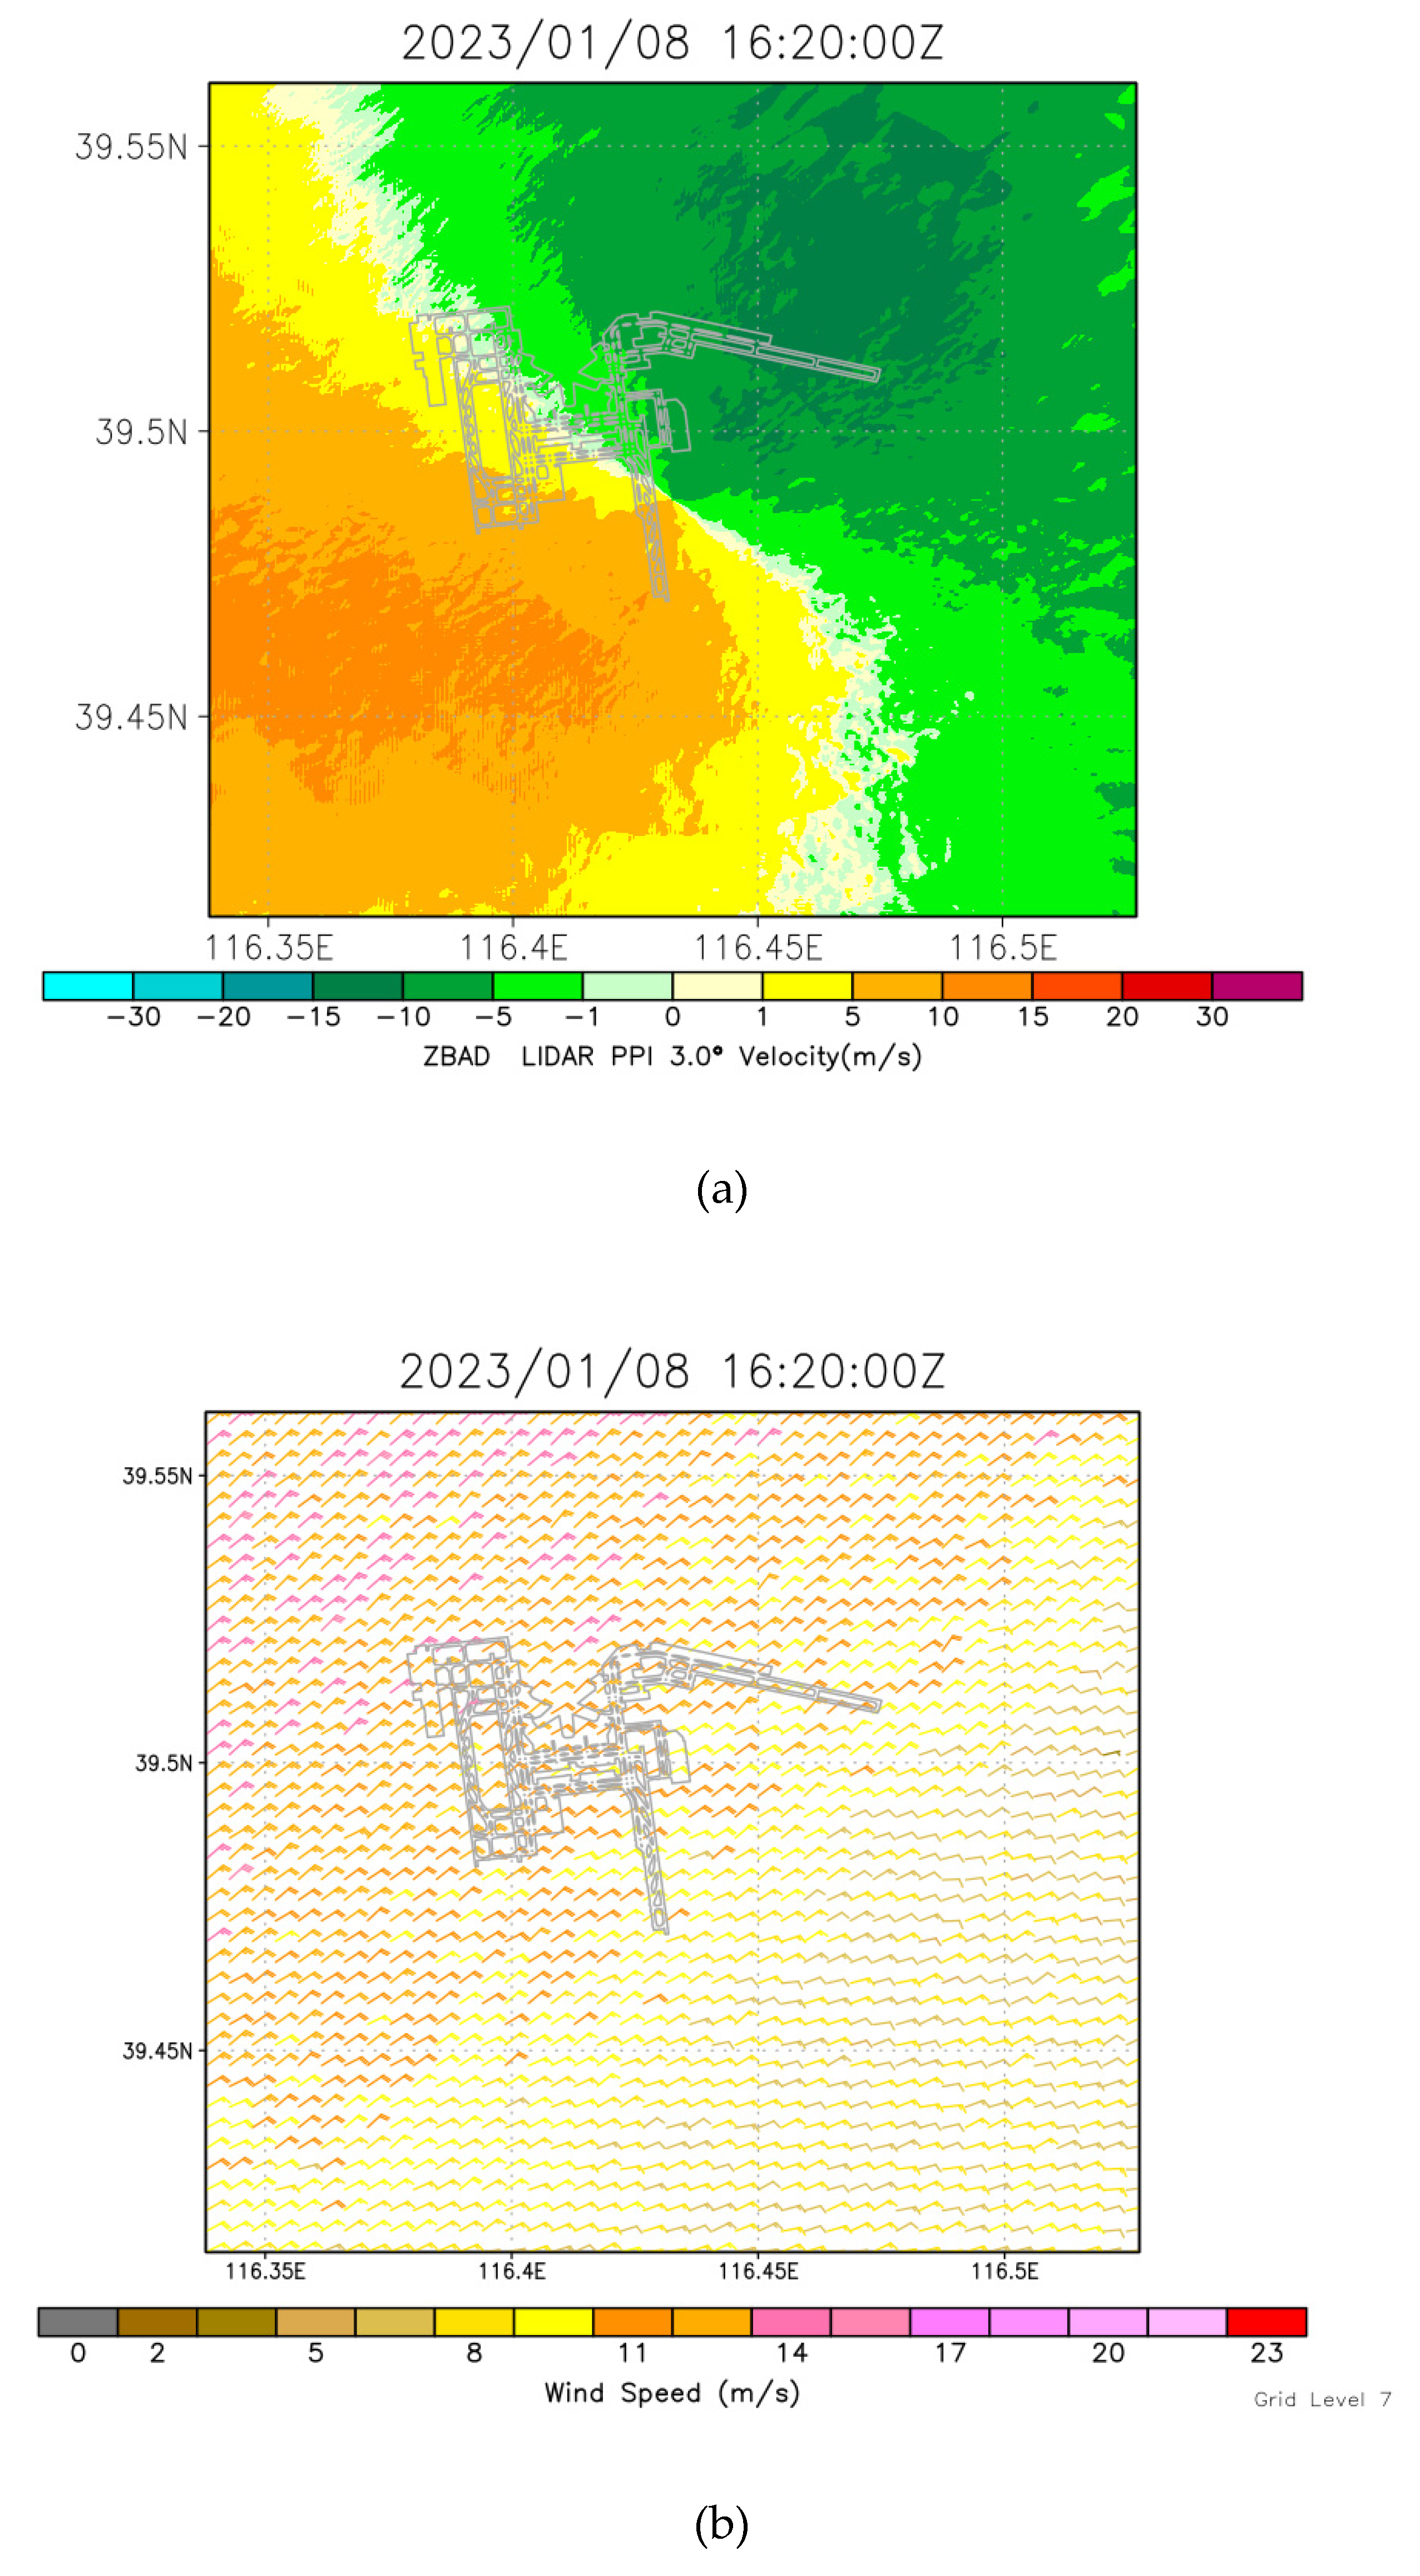
Starting at around 15:30 UTC, whilst northeasterly winds are forecast to prevail over the airport, easterly winds begin to appear at about 2-3 km to the southeast of the LIDAR (not shown). The easterly flow gradually spreads westwards and becomes rather close to the LIDAR location (Figure 8a). Convergence between northeasterly winds and easterly winds remain stationary at around 2 km to the south of the airport (Figure 8b) until the northeasterly winds moderate (not shown). The occurrence of the convergence line (Figure 8a) is rather consistent with the shearline as shown in the real Doppler LIDAR imagery (Figure 6b).
However, the following discrepancies between the real LIDAR images and the simulated LIDAR are observed:
- Location of the shearline – in reality, the shearline was right over the airport, whereas in the simulation it is located to the south of the airport, at a distance of around 2 km, which is considered to be reasonably given that the present simulation is pure dynamic downscaling without assimilation of any additional data;
- Strength of the shearing – the real shearline has greater convergence whereas the simulated convergence turns out to be weaker than reality;
- Timing of the shearline – there is a difference of around half an hour about the occurrence of shearing near the airport, namely, the simulation is about half an hour later than reality, which is considered to be reasonable given the dynamic downscaling nature of the simulation;
- Persistence of the shearline – in reality, the shearline occurred over the airport for around 10 minutes only and passed to the west at the end; however, in the simulation, the shearing is rather stationary to the south of the airport and weaken gradually with the weakening of the northeasterly flow to the north.
Conclusions
A case of low level windshear at Daxing airport is studied in detail in the present paper. It appears to be related to synoptic change of the pressure/wind patterns, and occurs over the airport for a short period of time (around 10 minutes) only. However, it is captured well by the LIDAR at the airport and timely alerts could be provided.
The technical feasibility of forecasting the windshear case is studied using a high resolution NWP model. It turns out that the event may be forecast a few hours in advance. The occurrence of the convergence between northeasterly wind and easterly wind could be captured by the model. However, there are some discrepancies between the reality and the simulation, such as strength of the shearing and persistency of the feature.
More windshear cases at Daxing airport could be studied in the future, to understand more about the nature of windshear over there and to explore the feasibility of forecasting the shear features several hours in advance.
References
- Chan, P.W.; Lai, K.K.; Li, Q.S. High-resolution (40 m) simulation of a severe case of low-level windshear at the Hong Kong International Airport—Comparison with observations and skills in windshear alerting. Meteorological Applications 2021, 28, e2020. [Google Scholar] [CrossRef]
- Chan, P.W.; et al. Observation and numerical simulation of a windshear case at an airport in the Qinghai-Tibet Plateau. 2024. under review of Atmospheric Science Letters. [Google Scholar]
- Deardorff, J.W. Stratocumulus-capped mixed layers derived from a three-dimensional model. Boundary Layer Meteorology 1980, 18, 495–527. [Google Scholar] [CrossRef]
- Shun, C.M.; Chan, P.W. Applications of an Infrared Doppler Lidar in Detection of Wind Shear. Journal of Atmospheric and Oceanic Technology 2008, 25, 637–655. [Google Scholar] [CrossRef]
- Wang, Y.; Wang, D. How Digital Technology Can Reshape the Trust System of Engineering—Taking Beijing Daxing International Airport as an Example. Computer Sciences & Mathematics Forum 2023, 8, 91. [Google Scholar] [CrossRef]
- Yuan, J.; Su, L.; Xia, H.; Li, Y.; Zhang, M.; Zhen, G.; Li, J. Microburst, Windshear, Gust Front, and Vortex Detection in Mega Airport Using a Single Coherent Doppler Wind Lidar. Remote Sensing 2022, 14, 1626. [Google Scholar] [CrossRef]
Figure 1.
The surface isobaric chart at 12 UTC (a) and 18 UTC (b) of 8 January 2023.
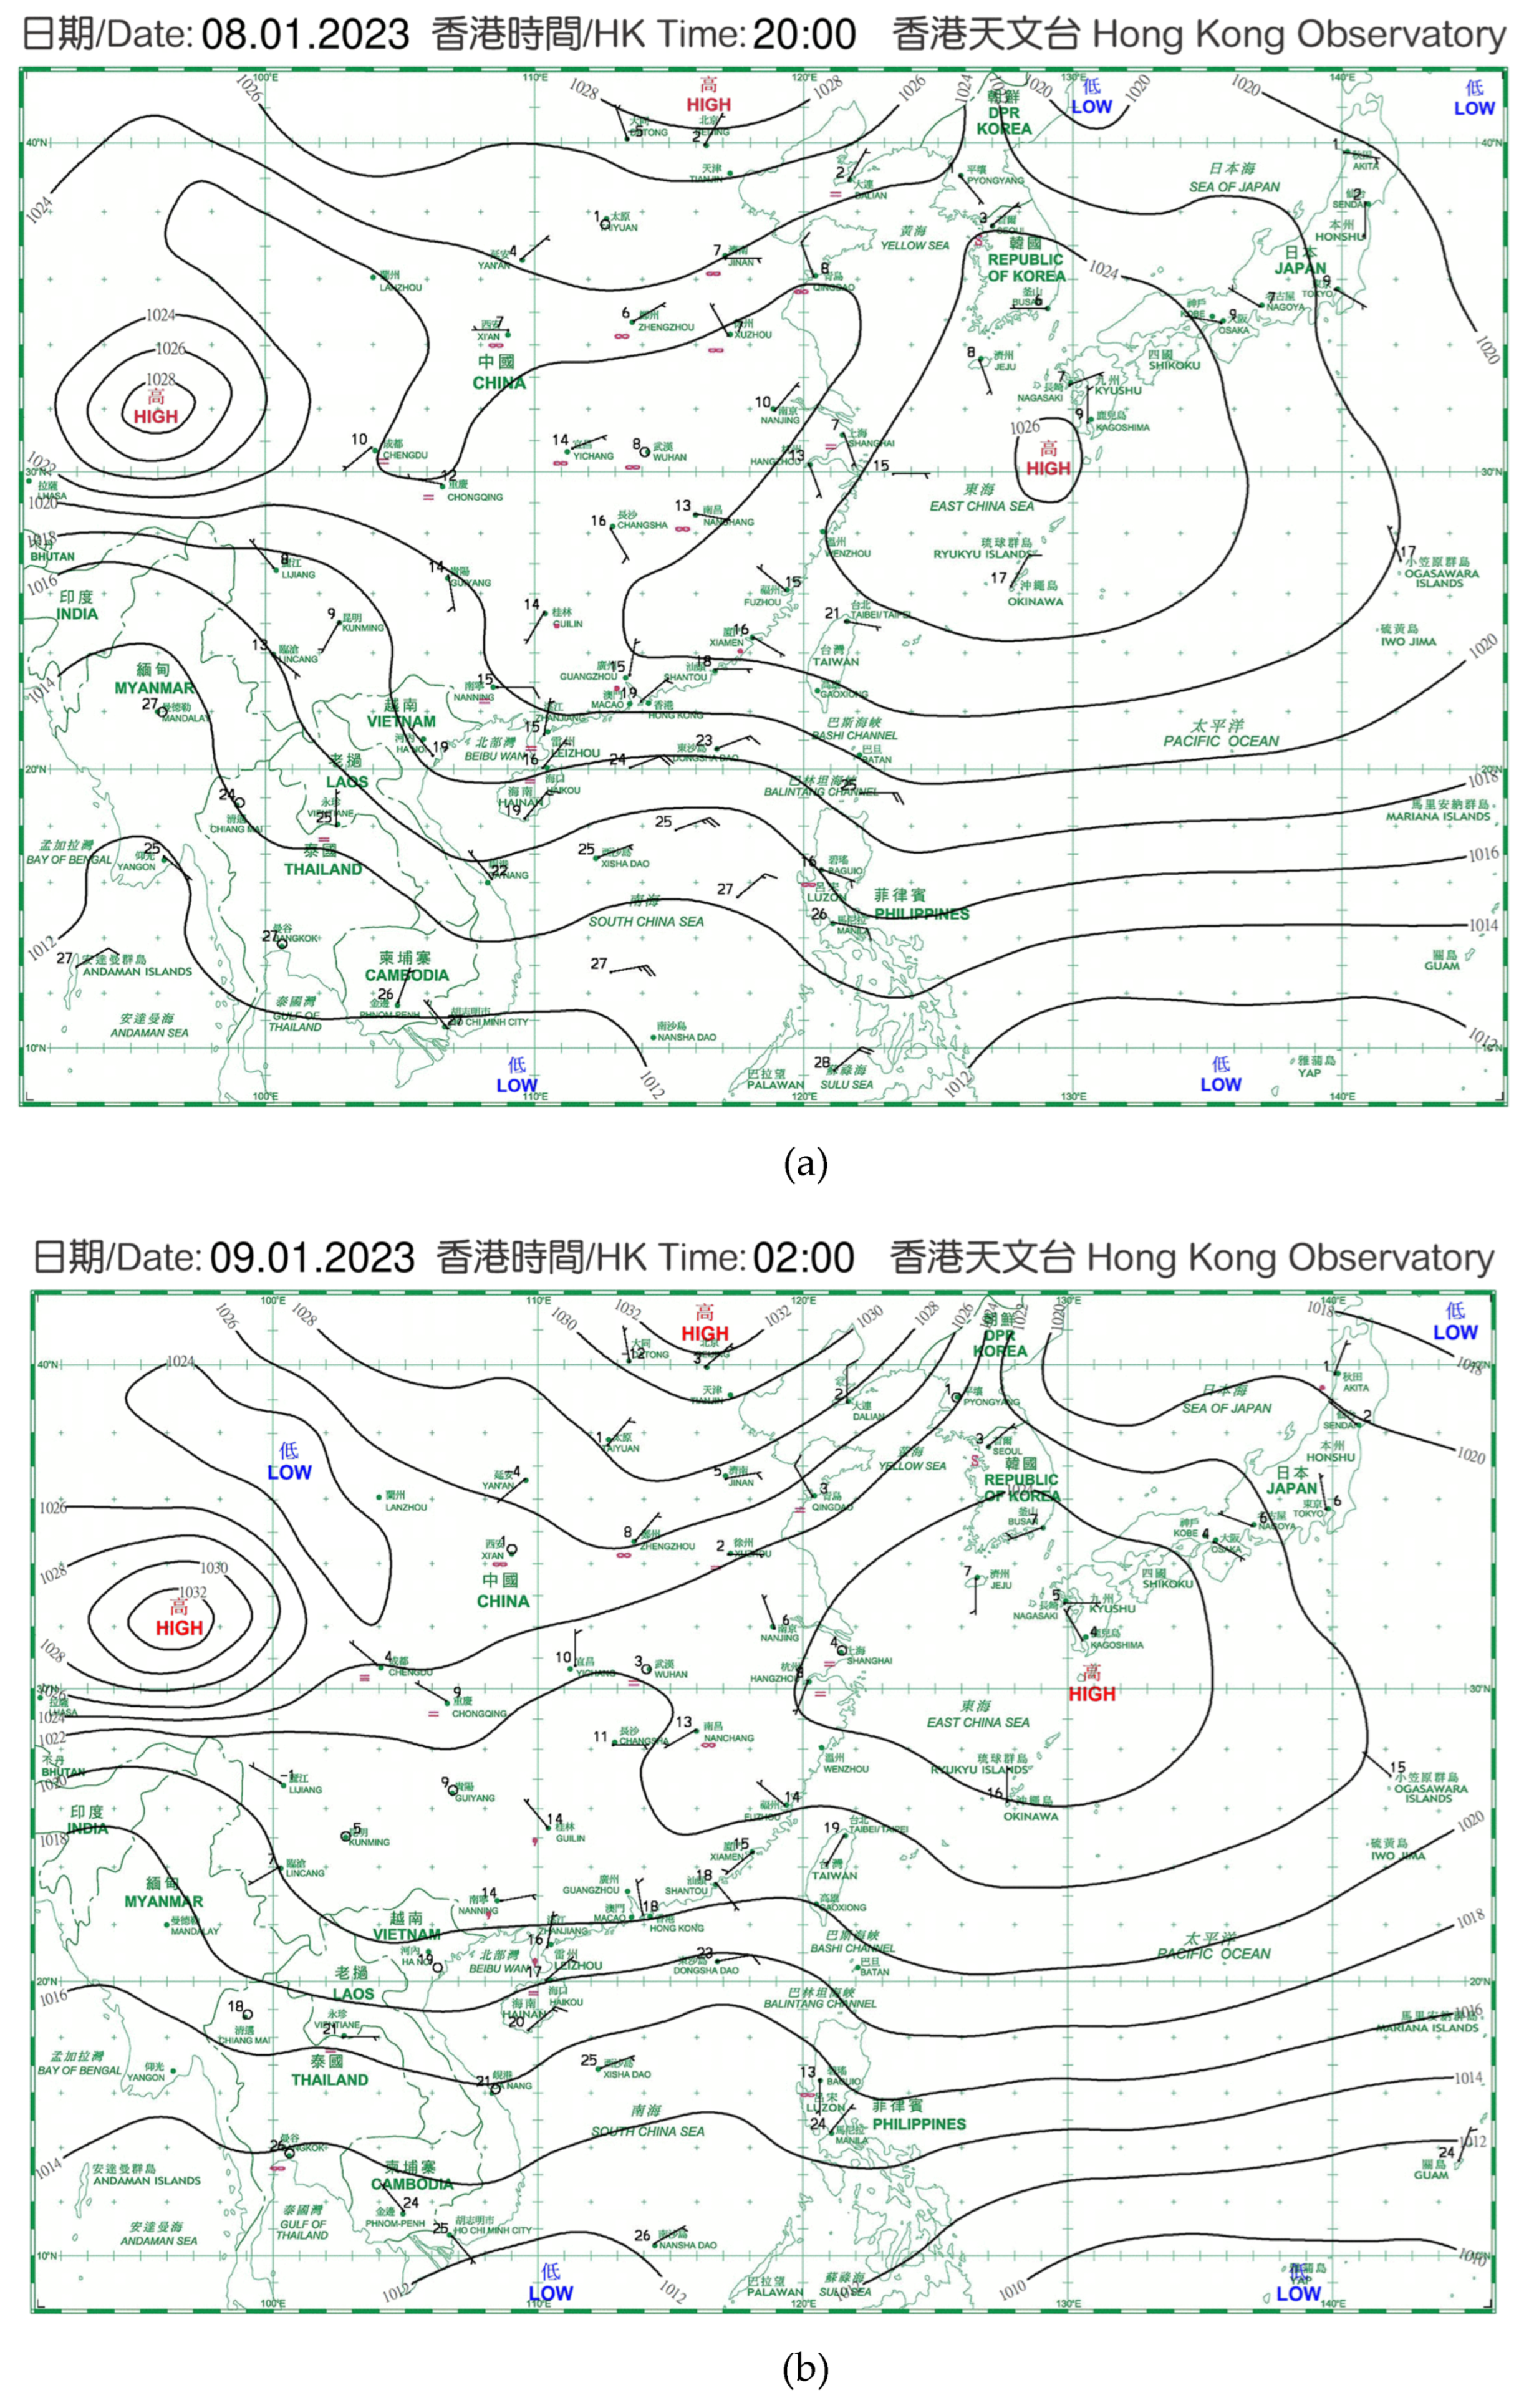
Figure 2.
The analysed 925 hPa wind field and humidity field at 12 UTC (a) and 18 UTC (b) of 8 January 2023.
Figure 2.
The analysed 925 hPa wind field and humidity field at 12 UTC (a) and 18 UTC (b) of 8 January 2023.
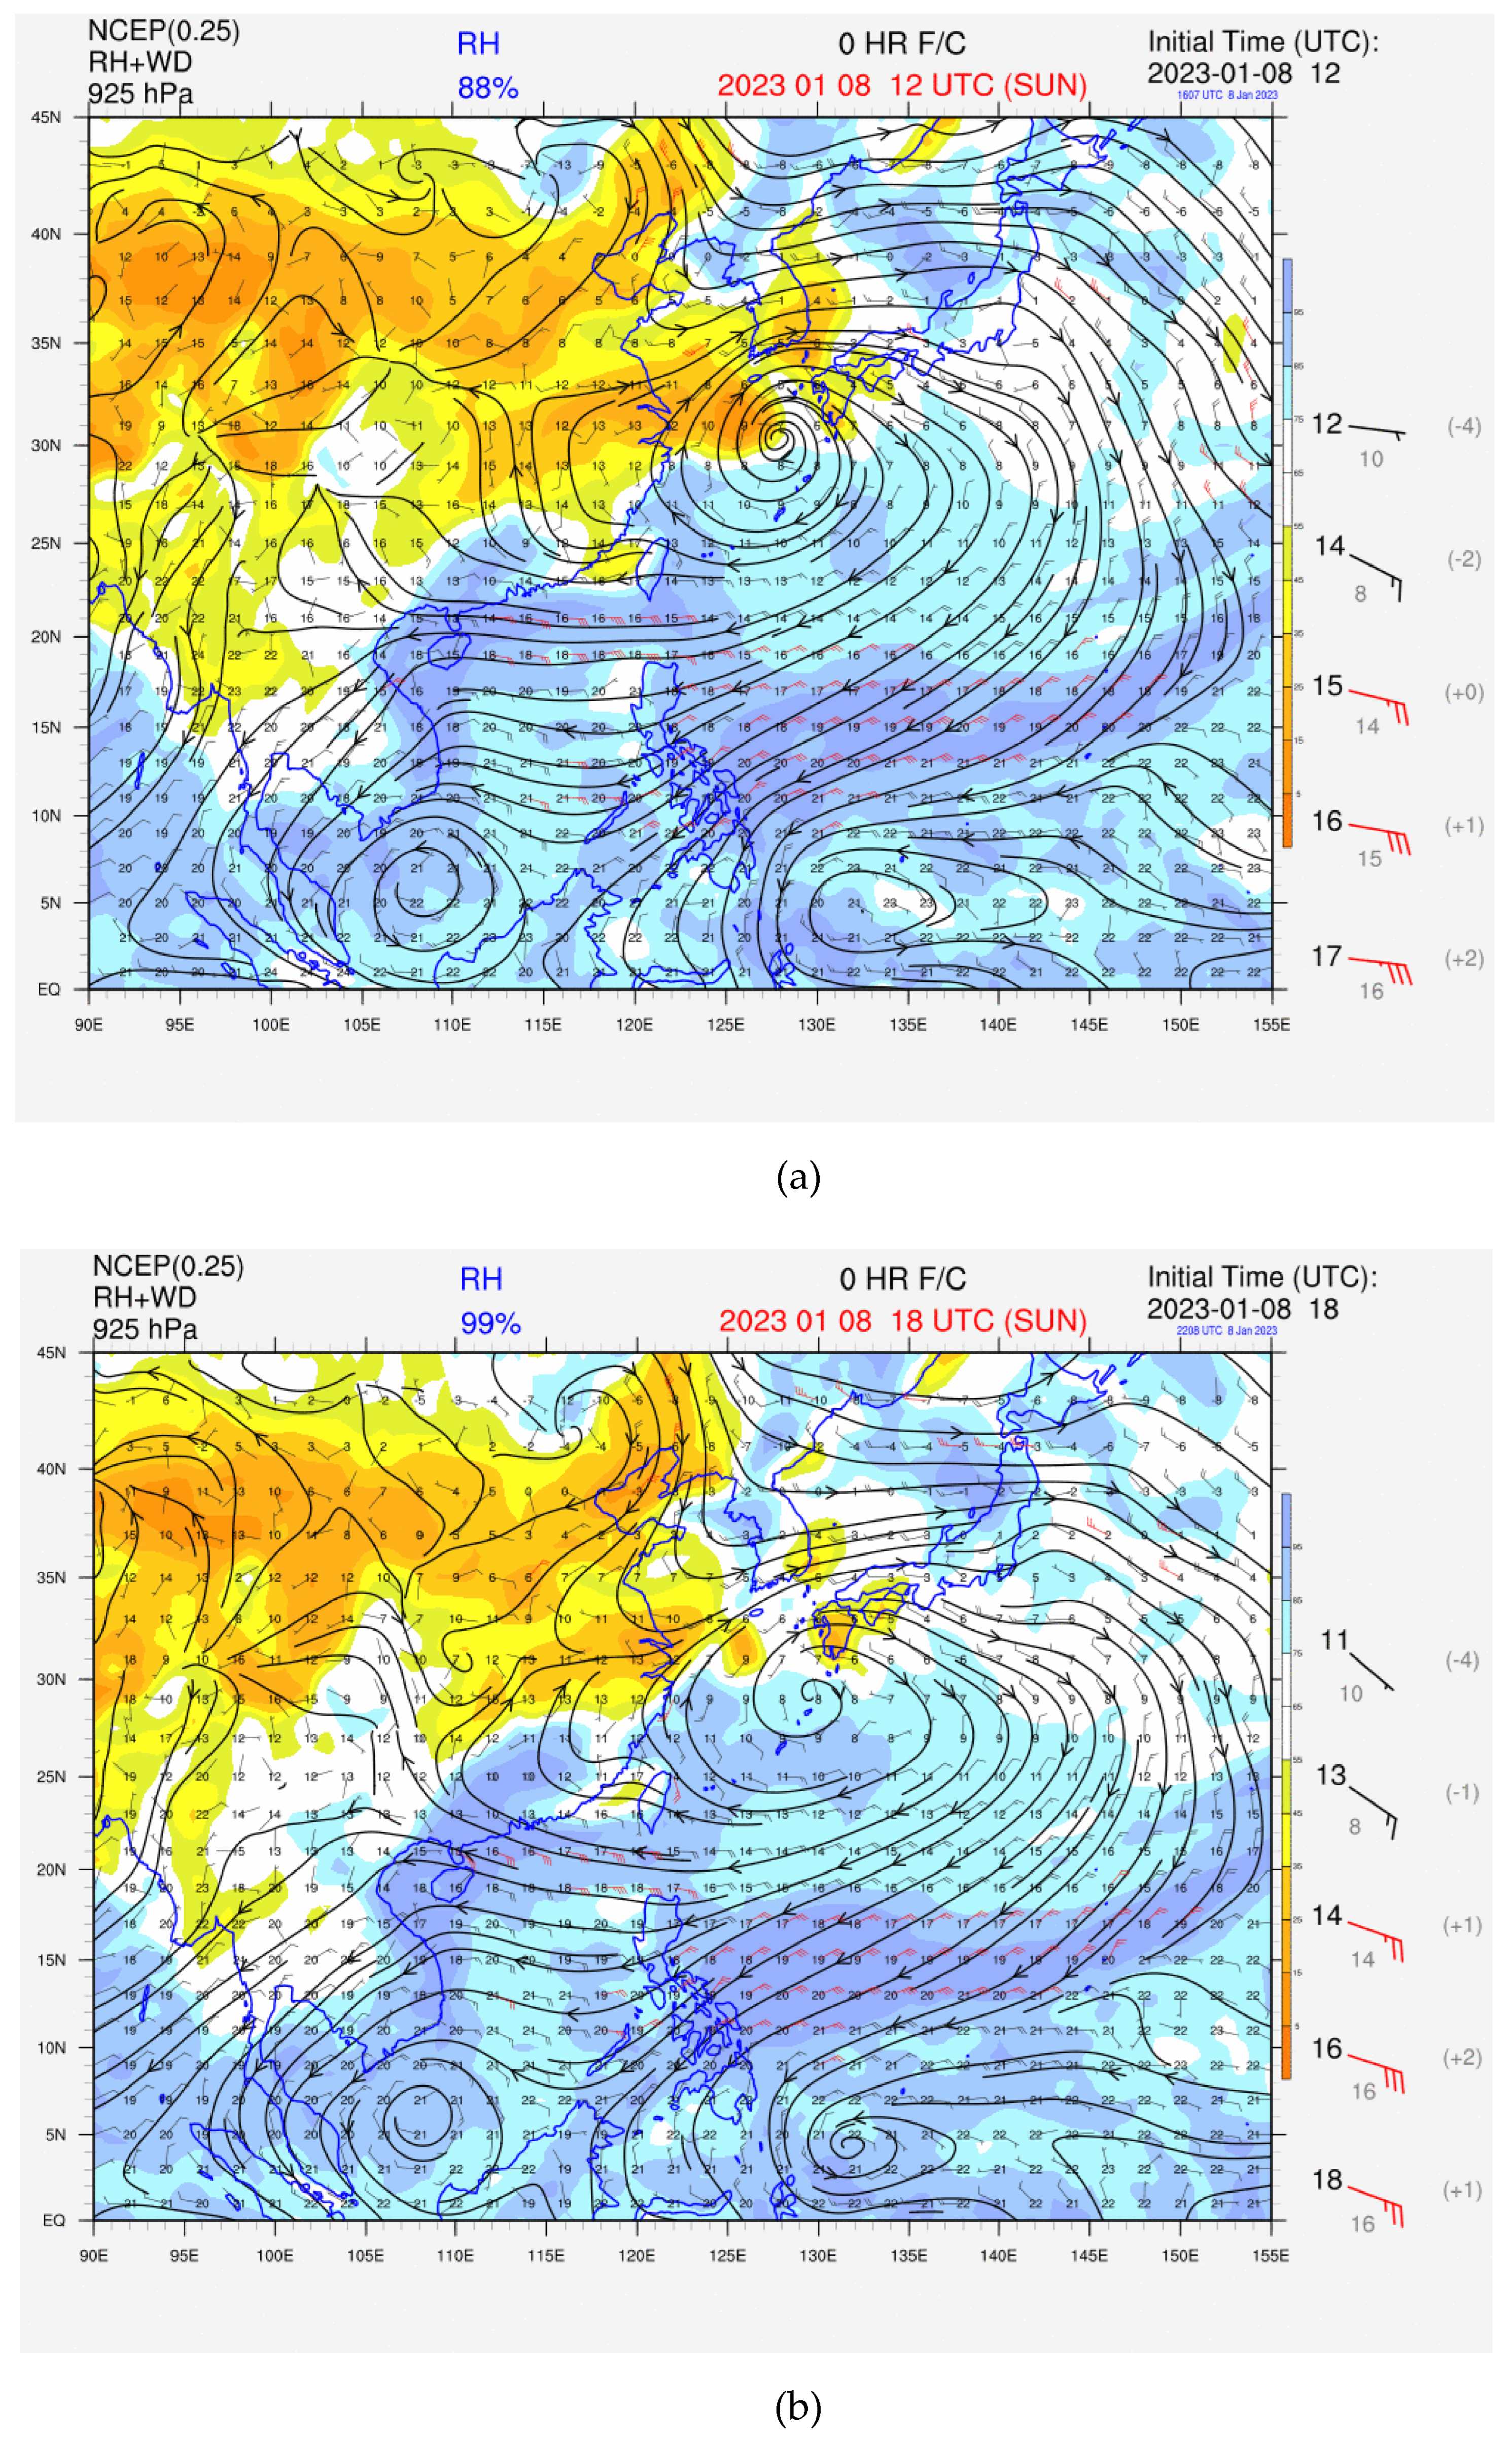
Figure 3.
Locations of wind profilers 54399 (Haidian) and 54534 (Tangshan), and radiosonde station 54511 (Beijing Capital International Airport).
Figure 3.
Locations of wind profilers 54399 (Haidian) and 54534 (Tangshan), and radiosonde station 54511 (Beijing Capital International Airport).
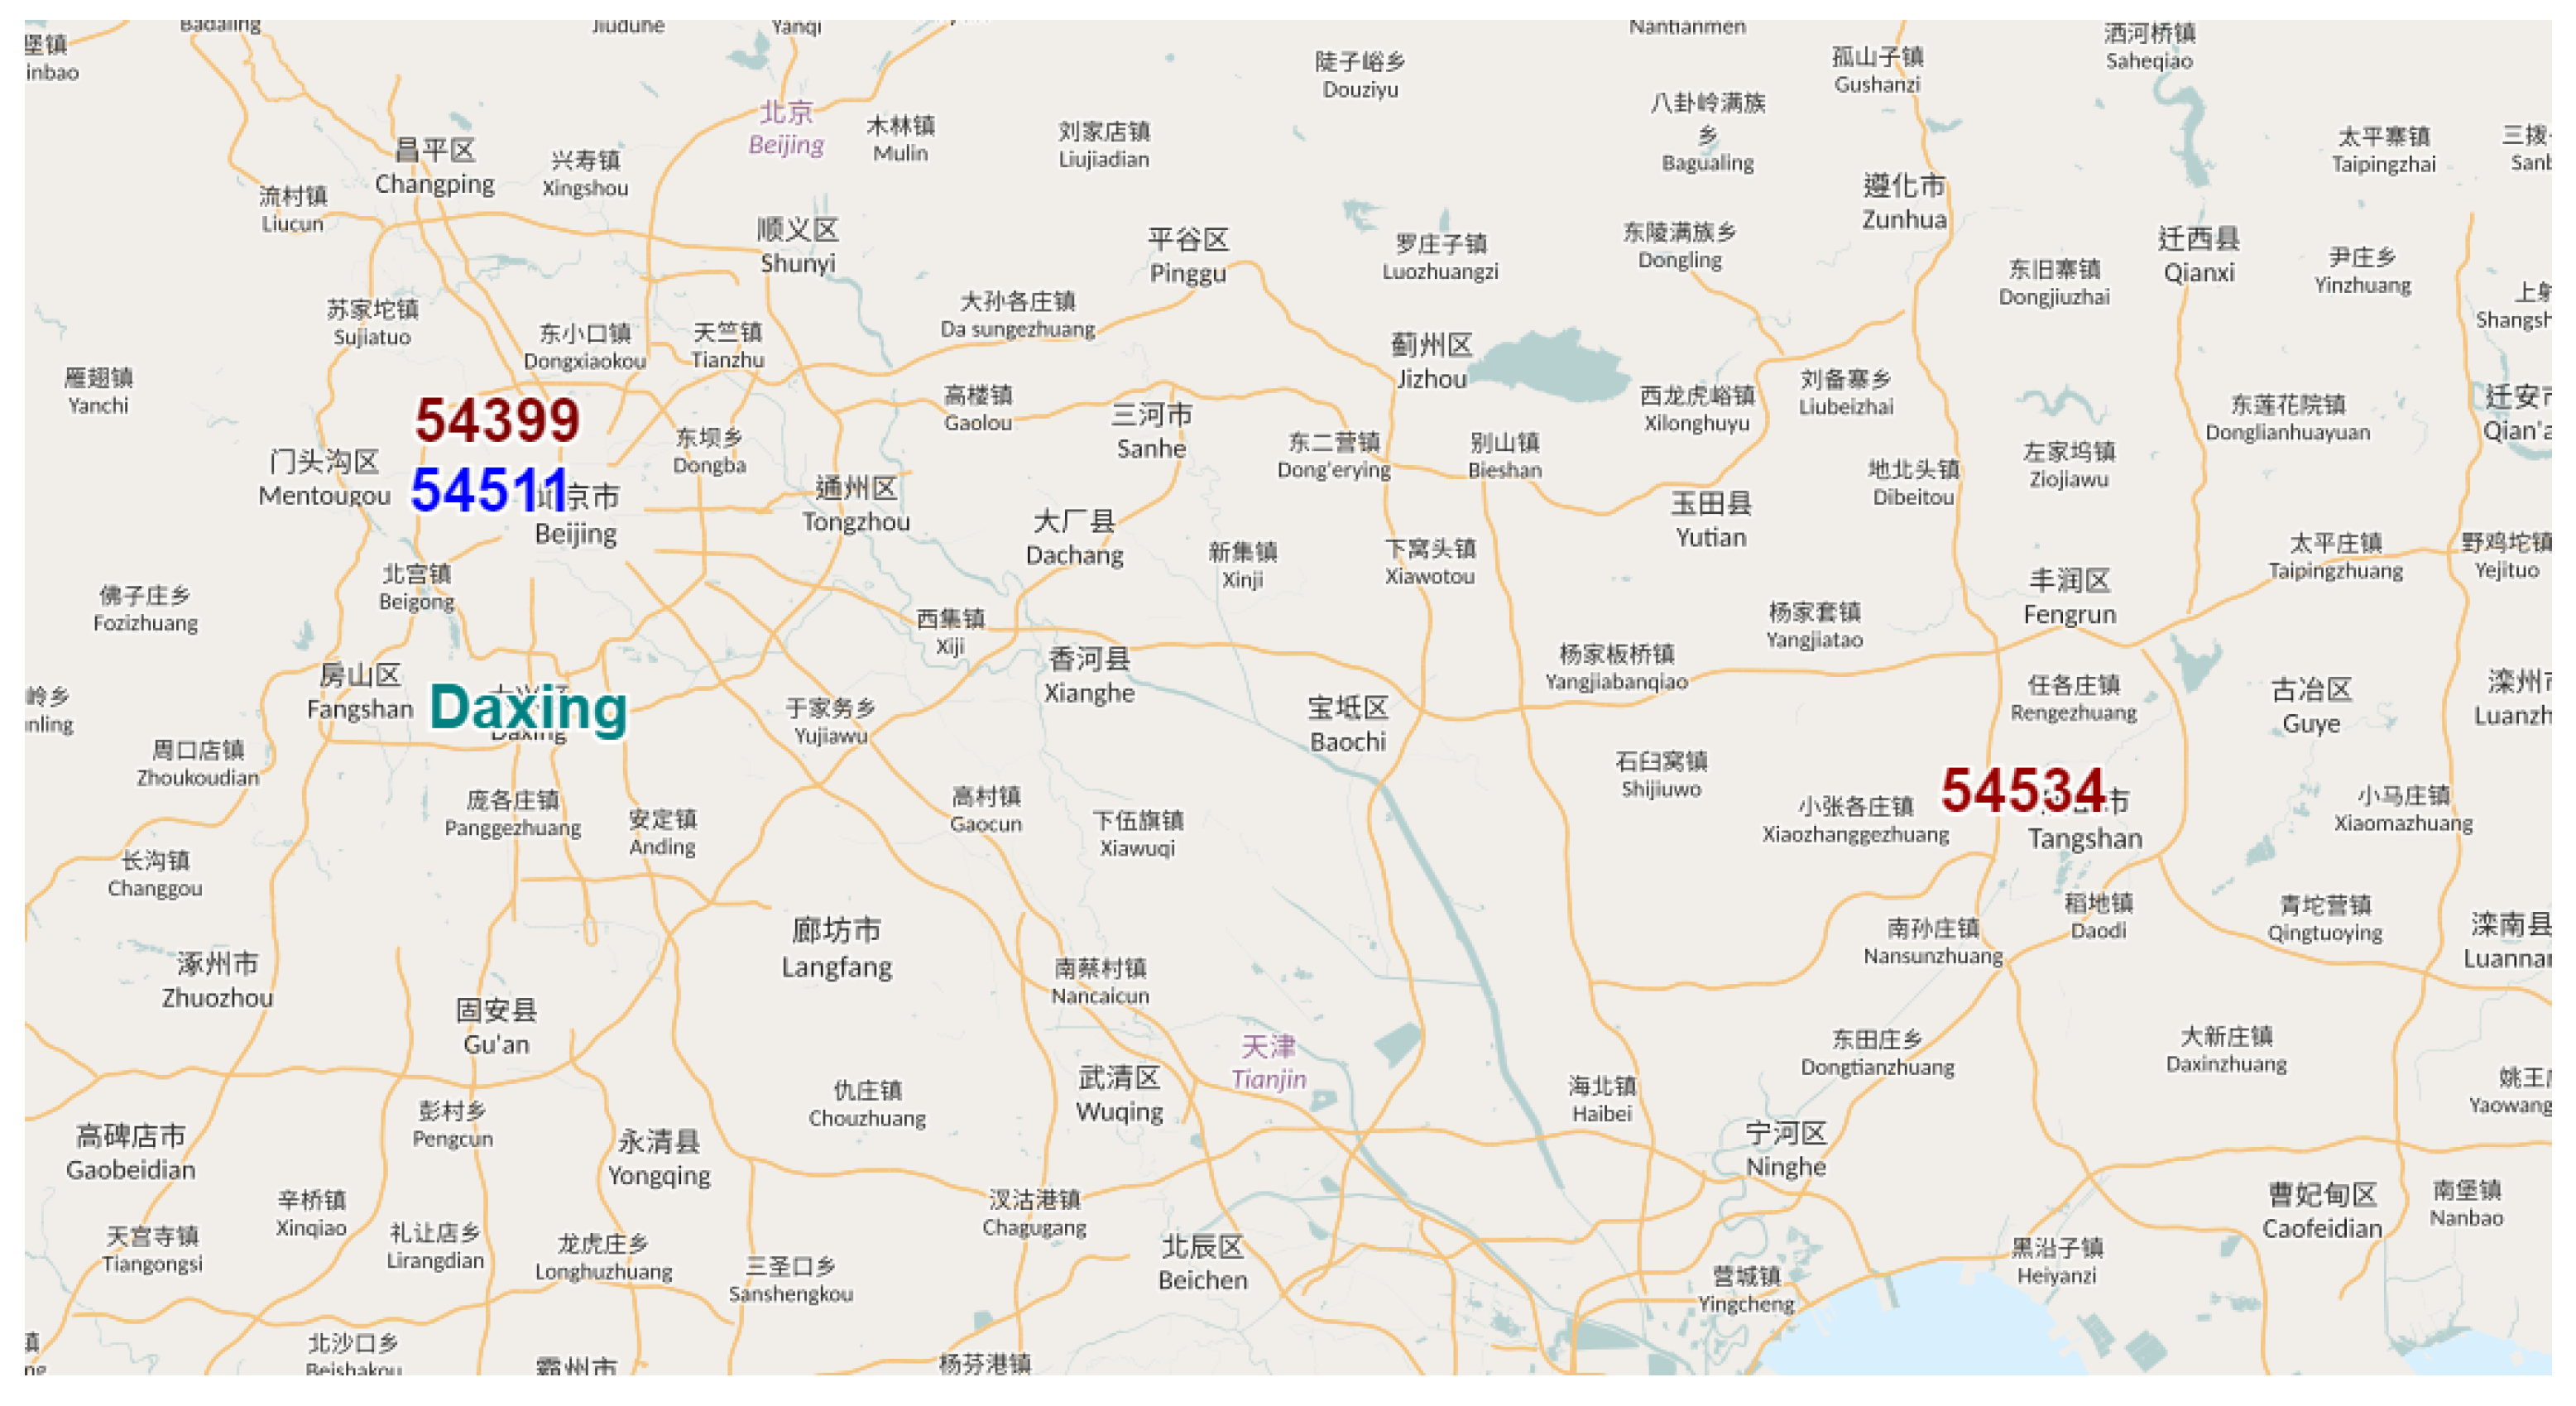
Figure 4.
Vertical wind profiles for the period 09 UTC – 21 UTC, 8 January 2023.
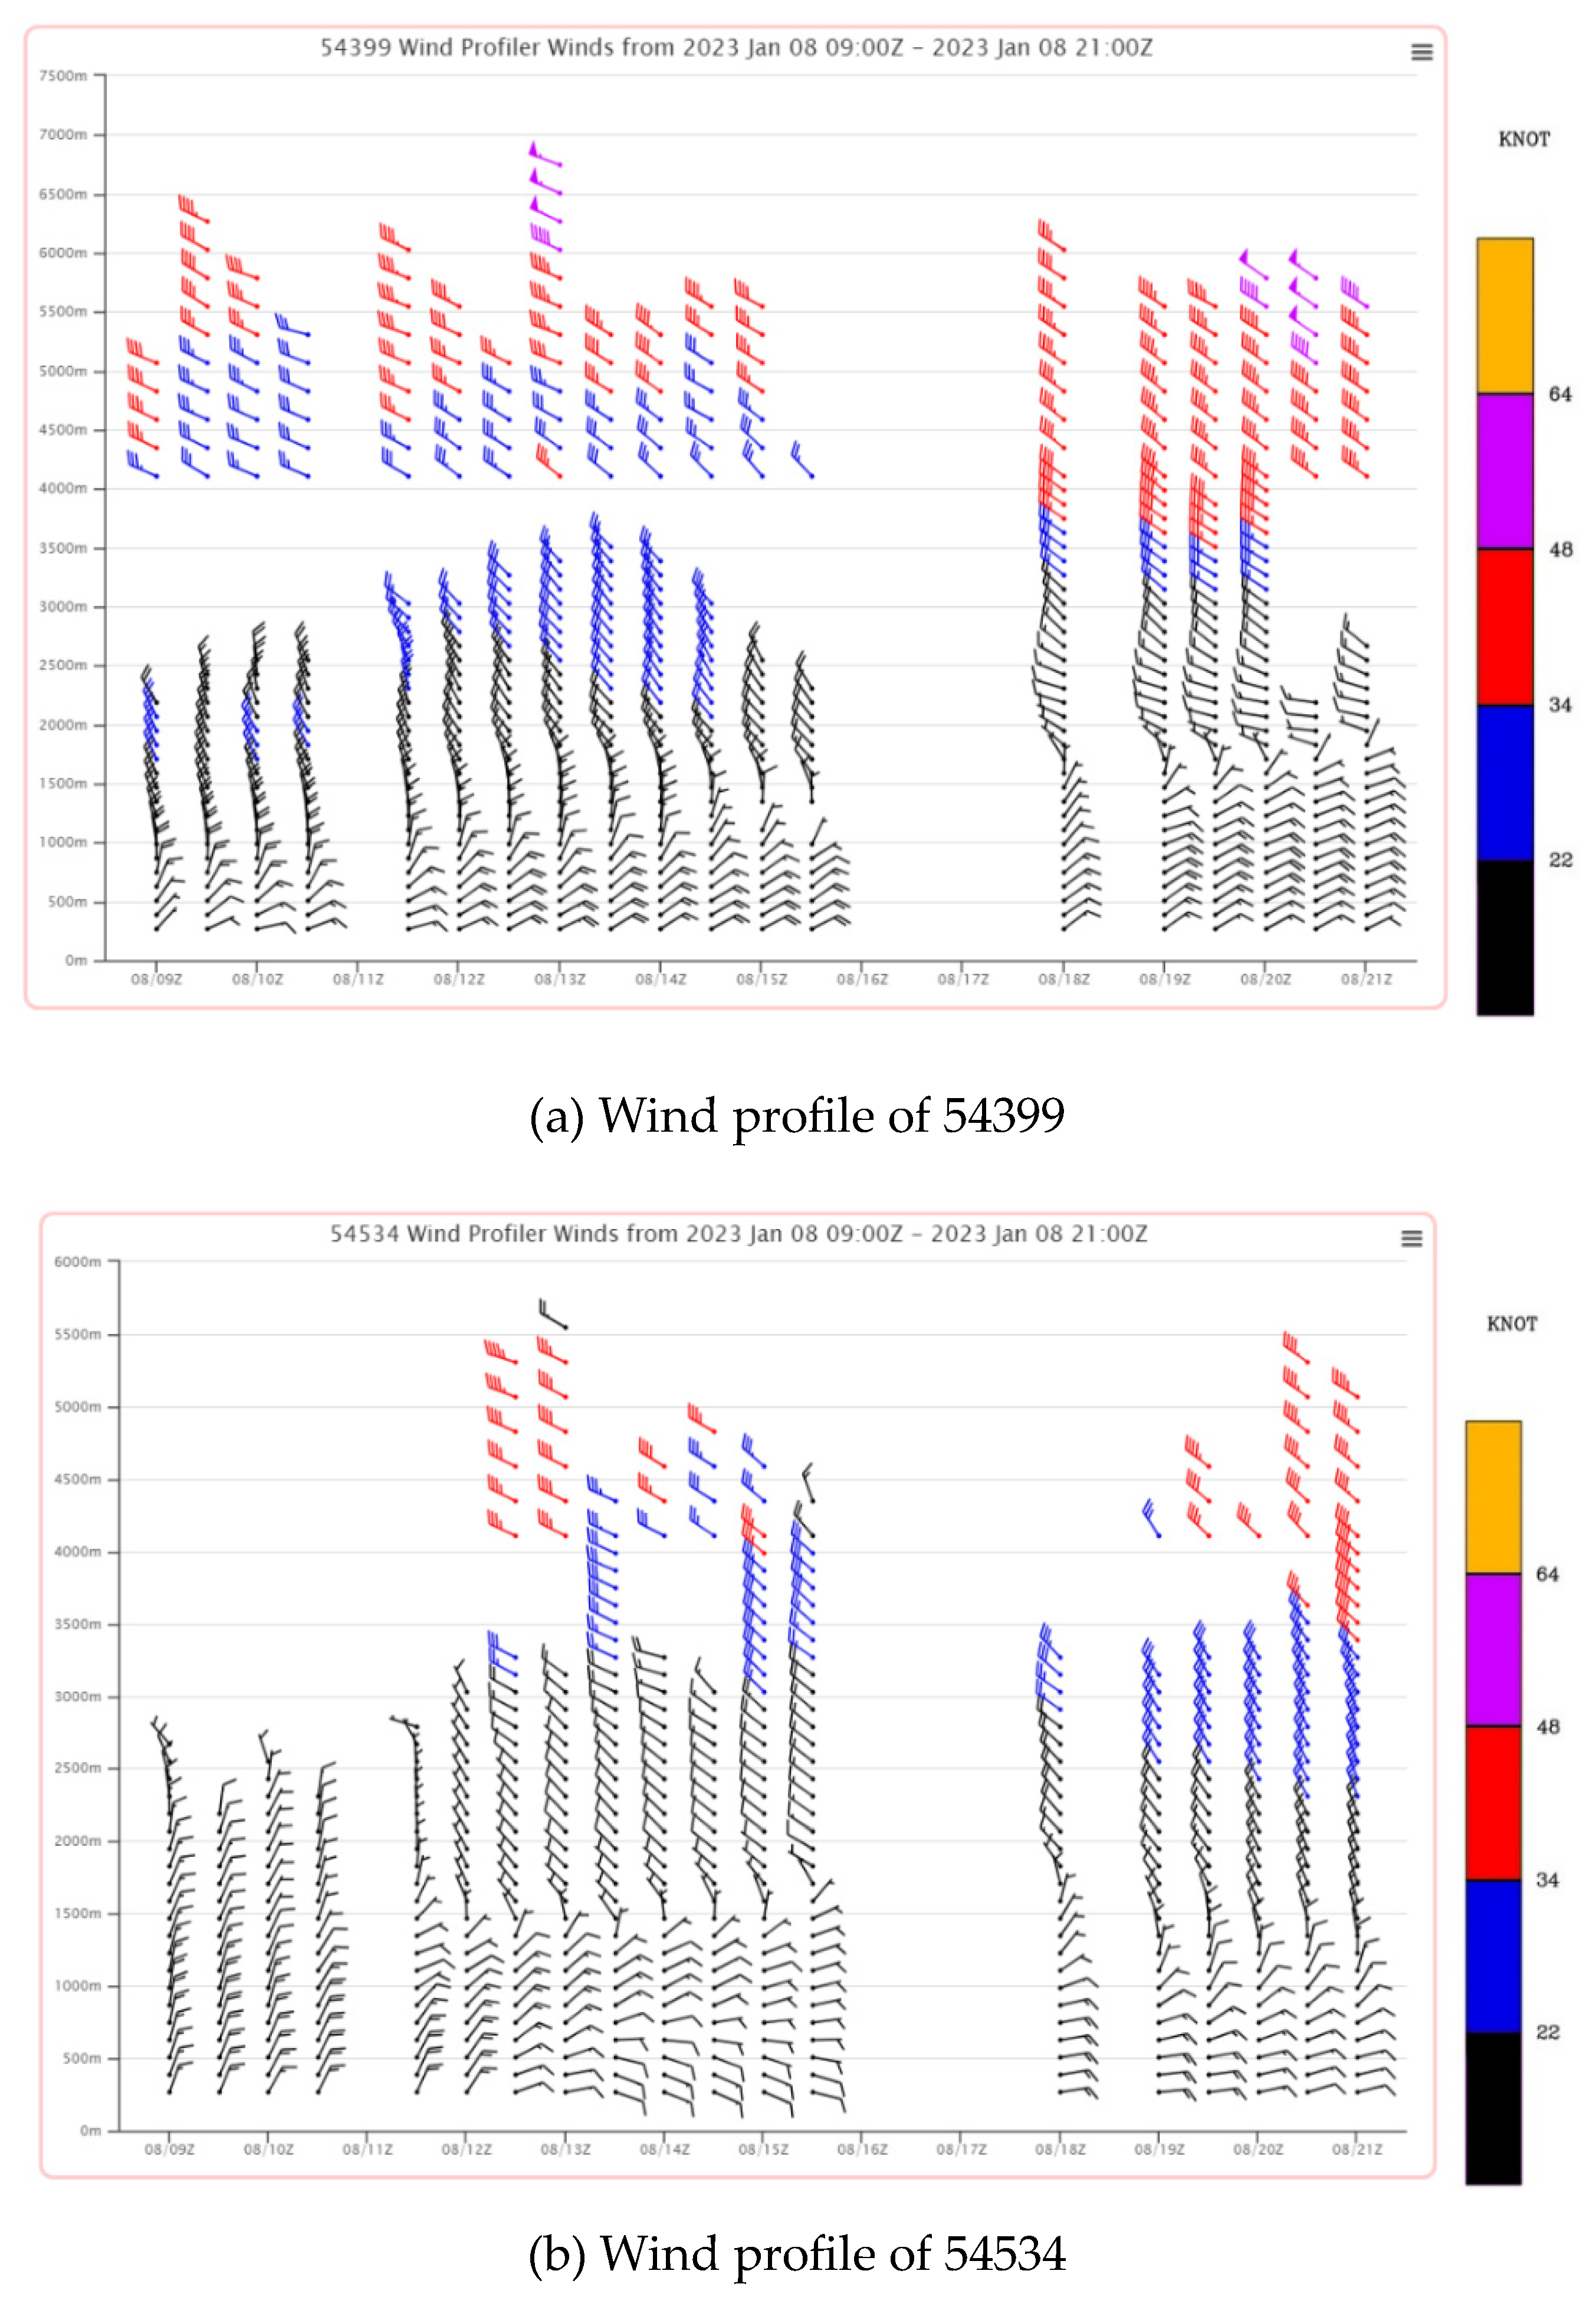
Figure 5.
Tephigram for Beijing Capital International Airport (station code 54511), at 12 UTC, 8 January 2023. The temperature (black curve) and dew point temperature (red curve) illustrated a rather dry and stable atmospheric boundary layer. Geopotential heights are marked on the black straight line.
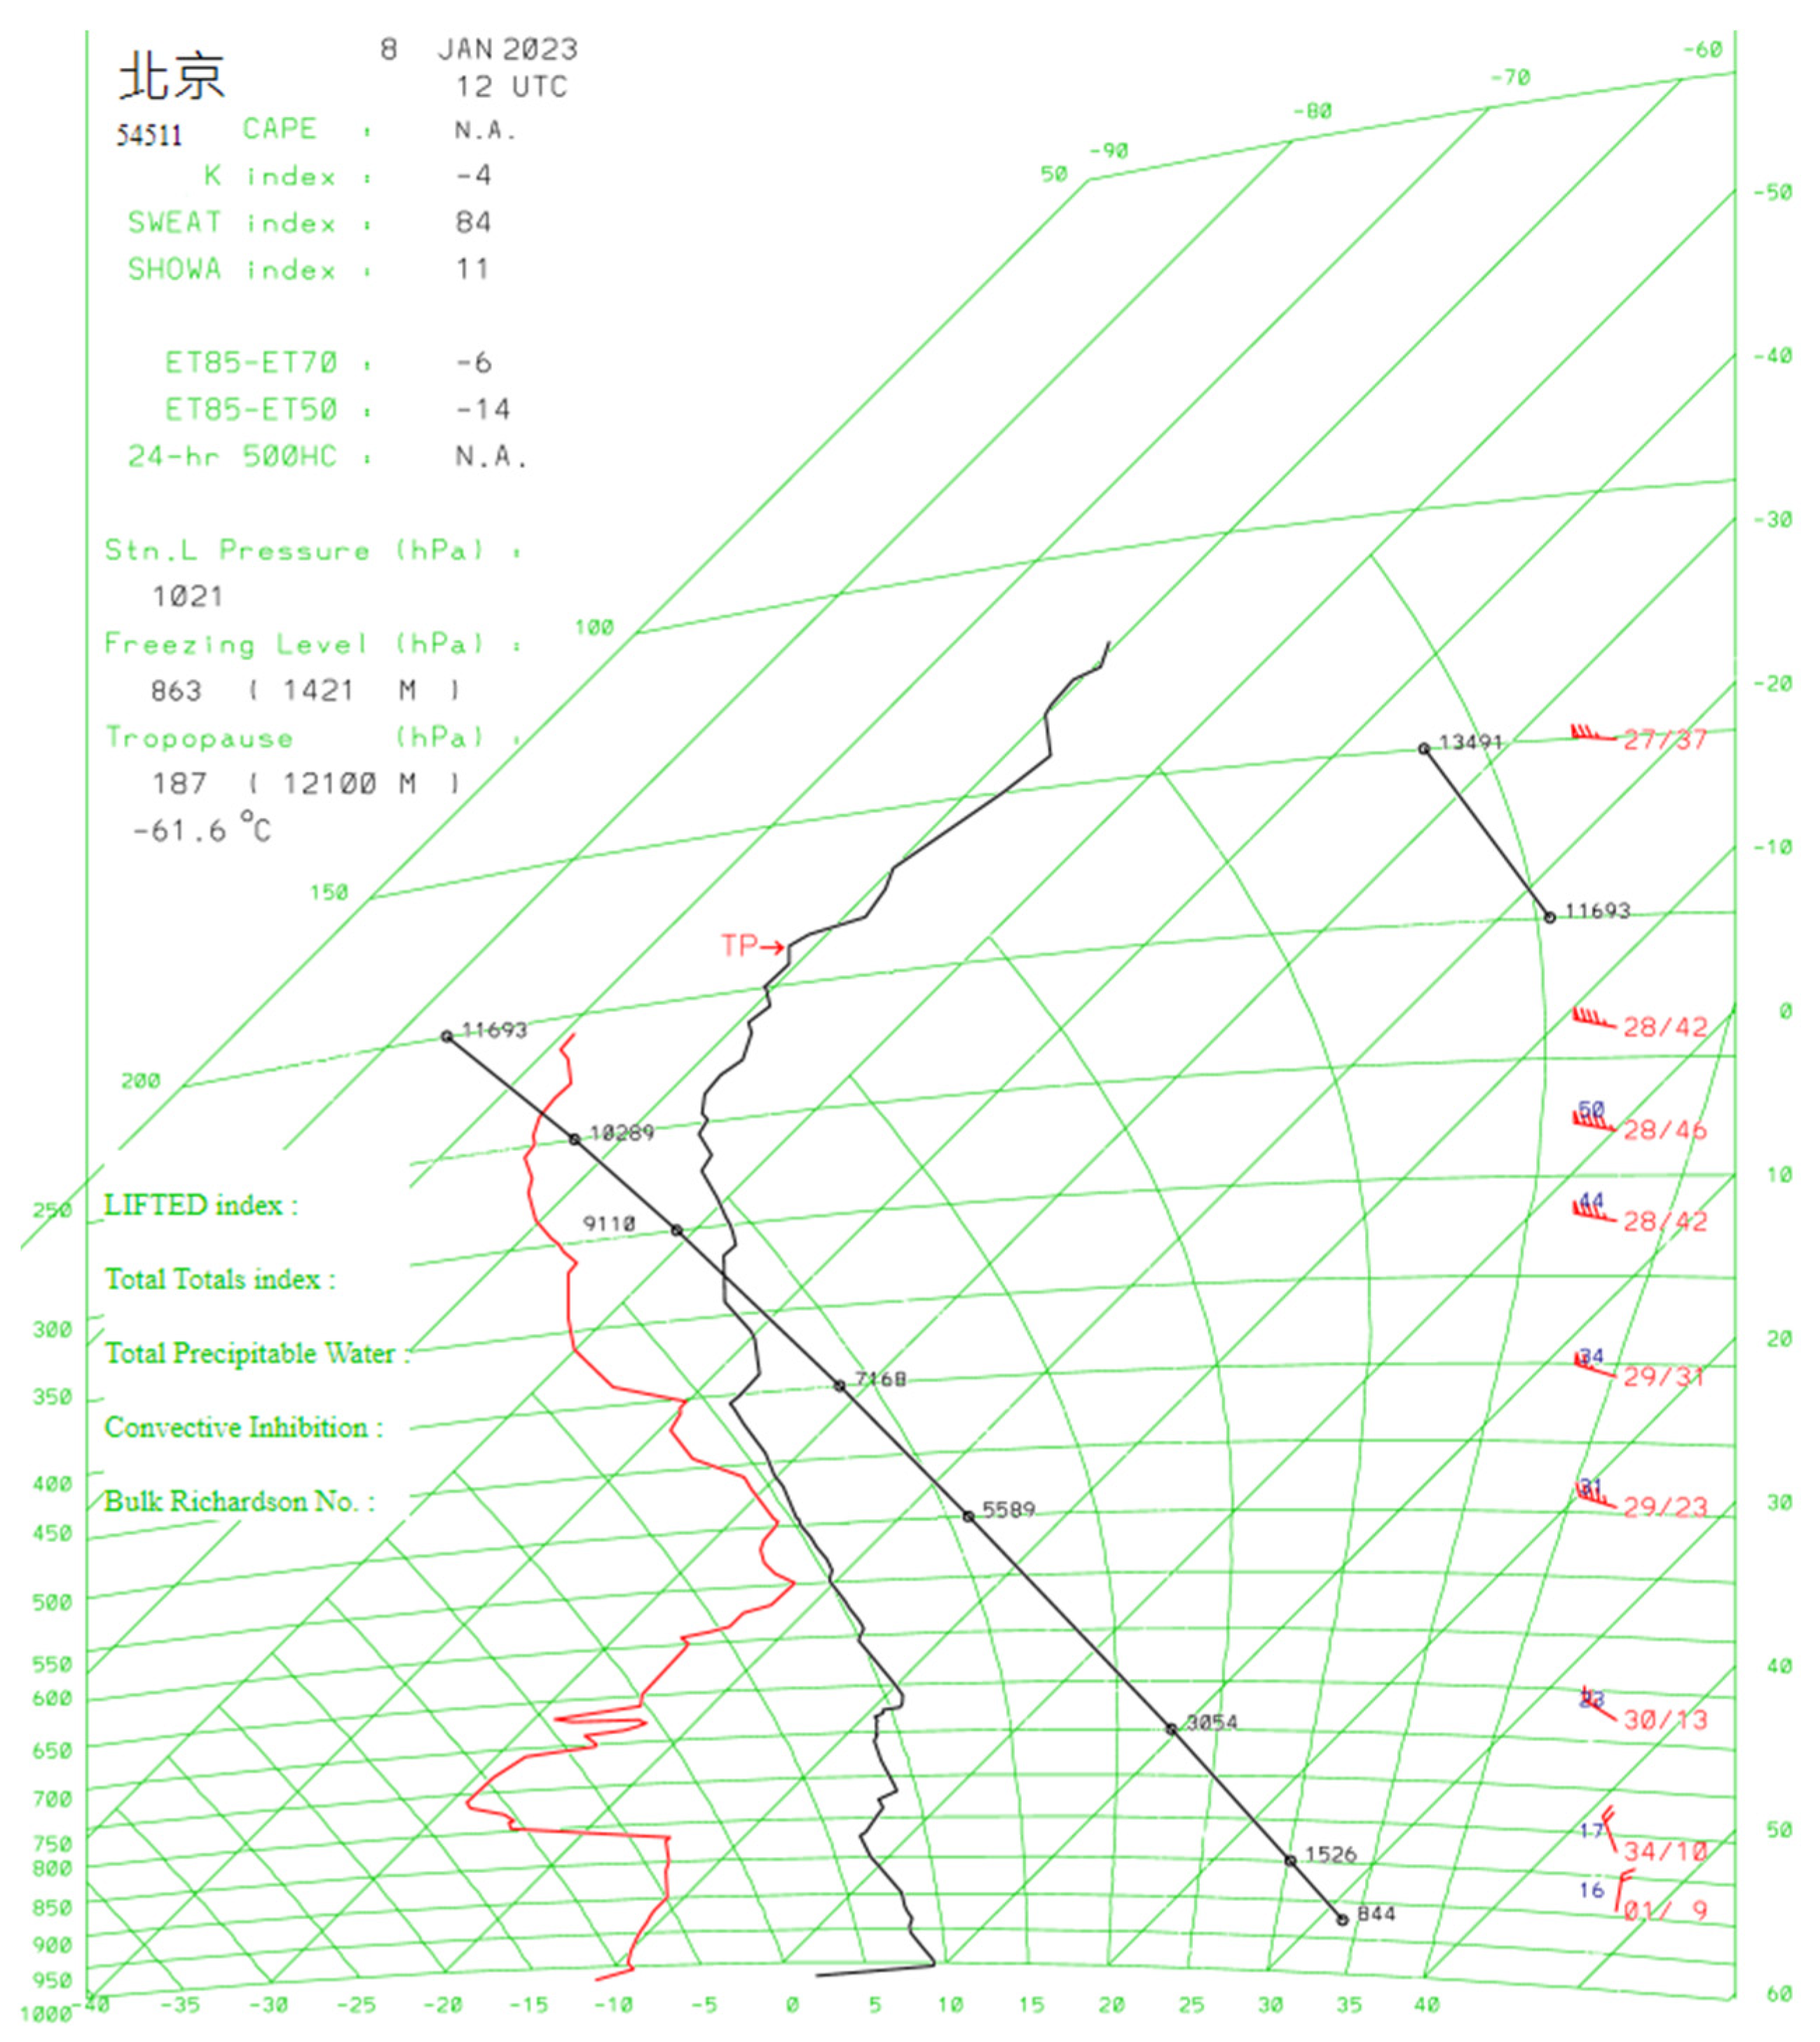
Figure 6.
The 3-degree PPI scans of LIDAR, showing the Doppler velocities (colour coded) and shearline (zebra line in (b)). The analysed two dimensional winds from LIDAR data are also plotted.
Figure 6.
The 3-degree PPI scans of LIDAR, showing the Doppler velocities (colour coded) and shearline (zebra line in (b)). The analysed two dimensional winds from LIDAR data are also plotted.
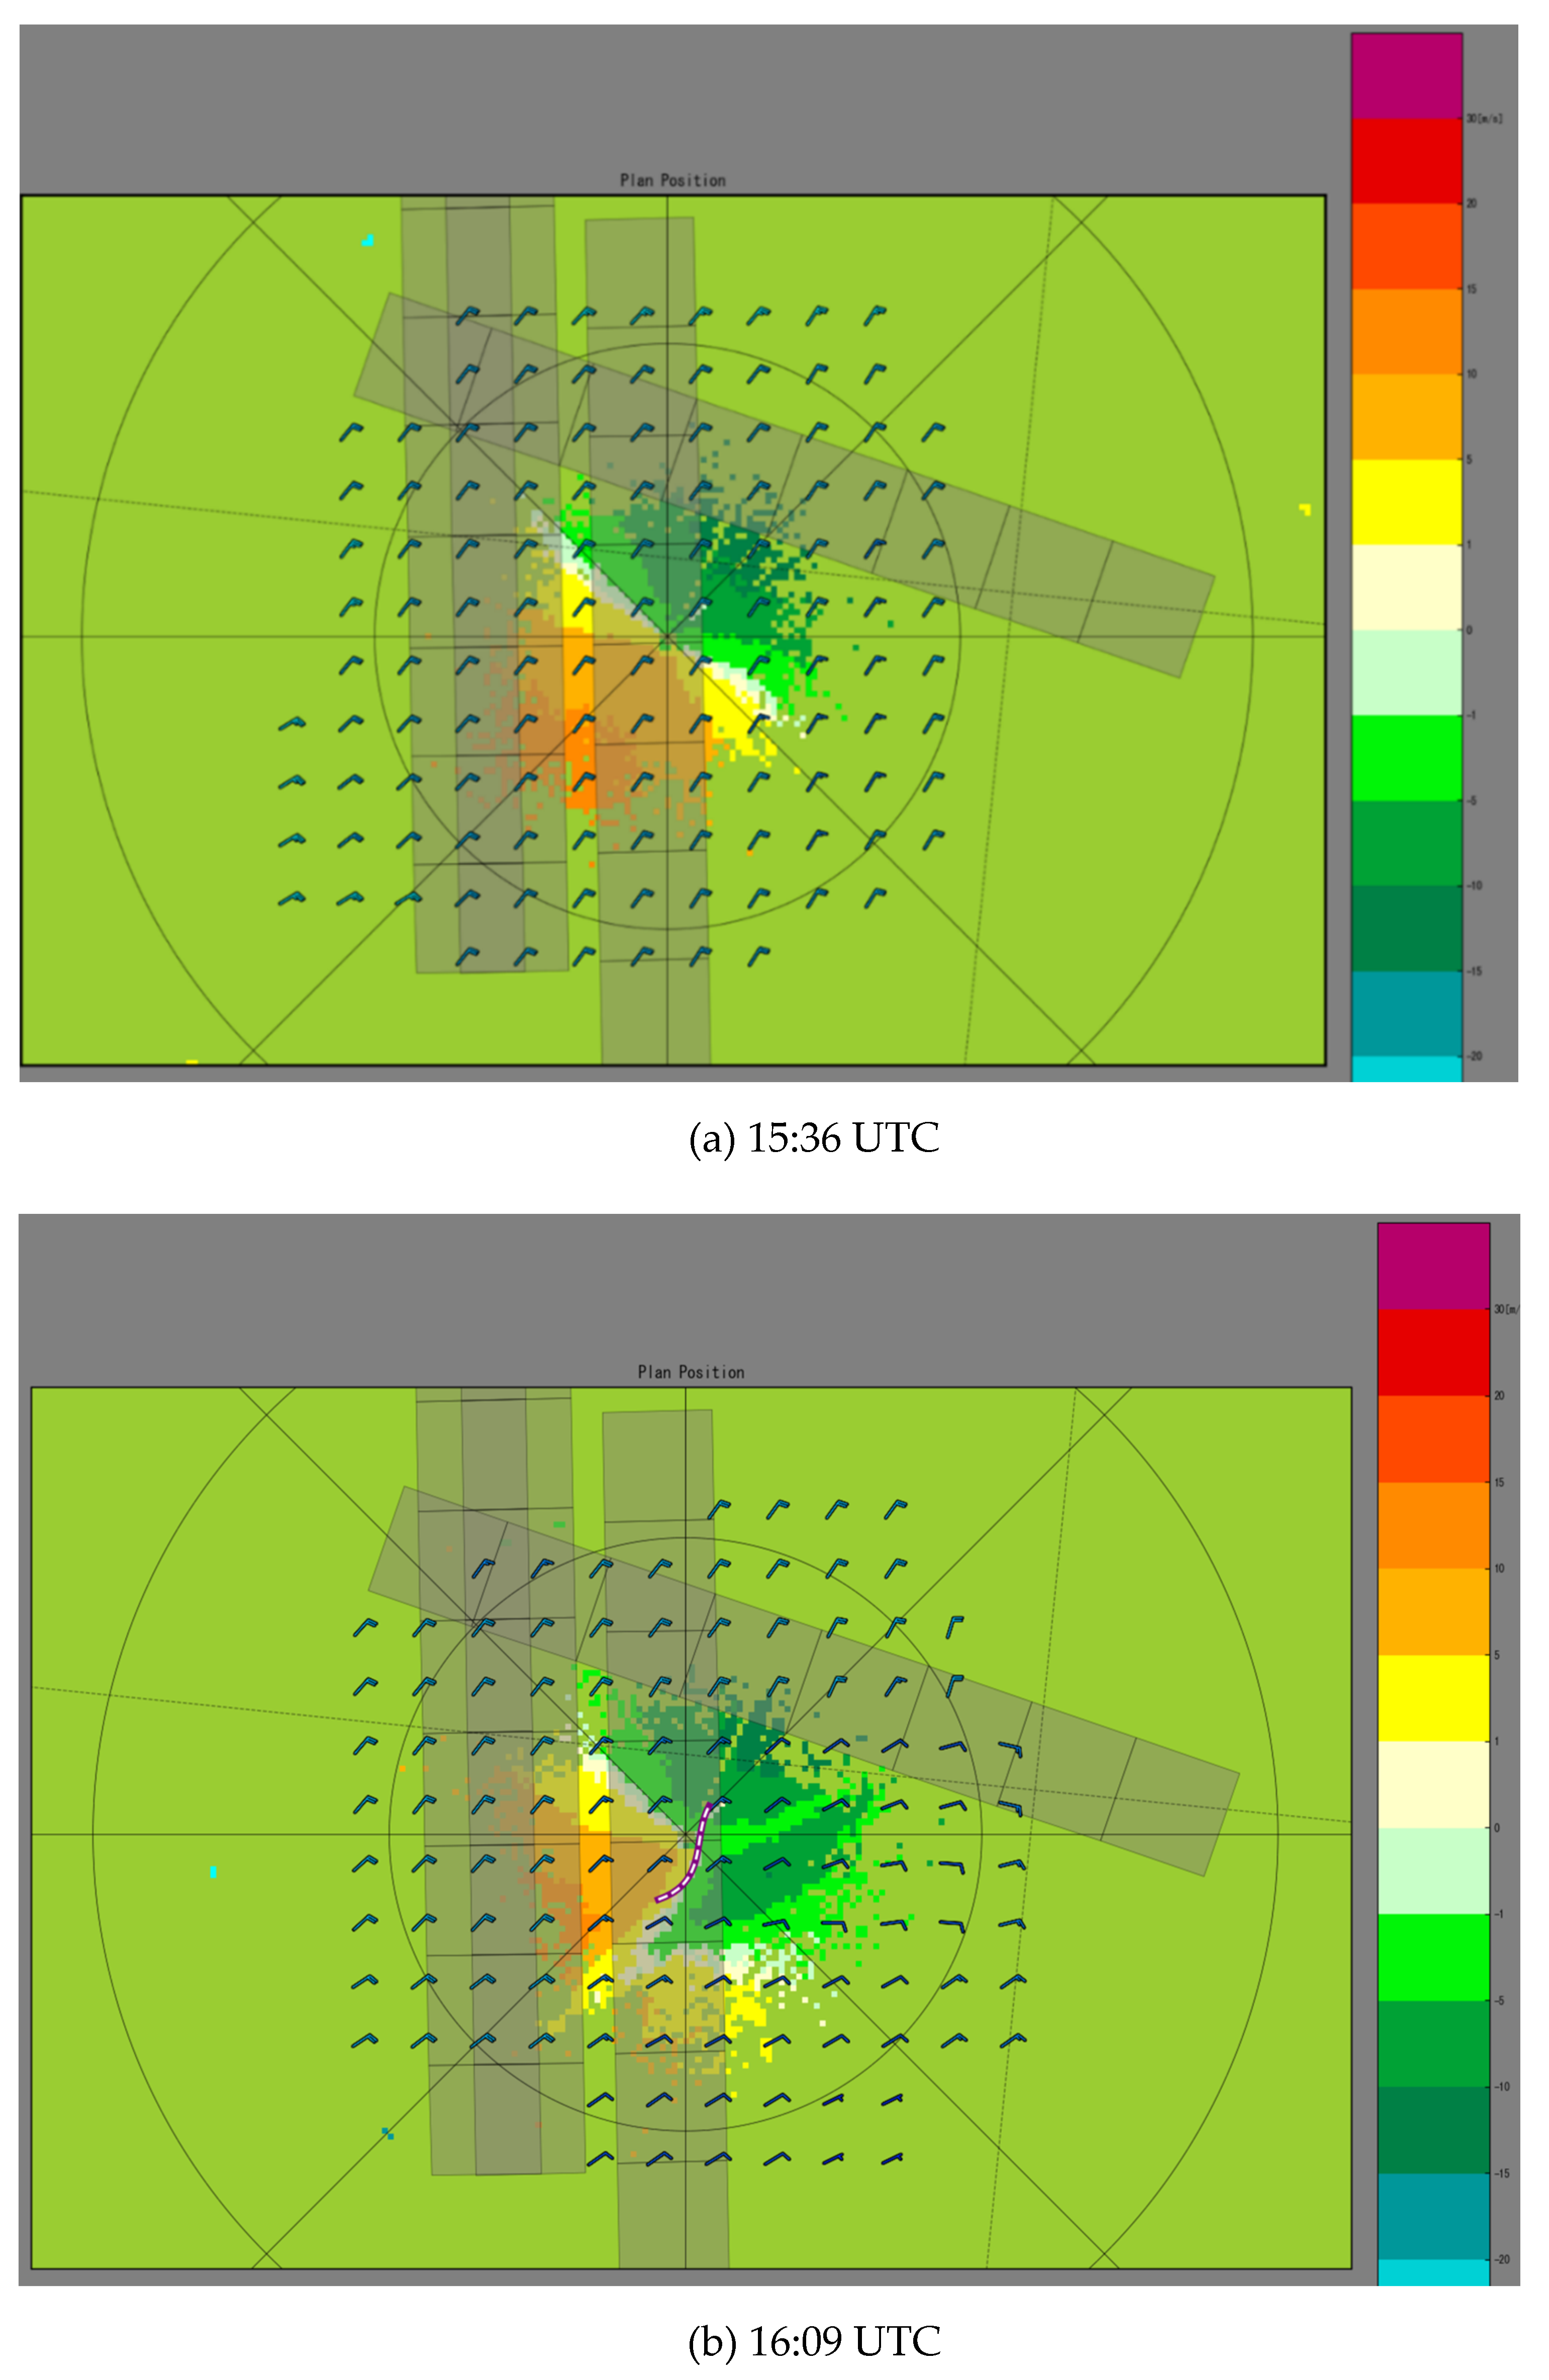
Figure 7.
The 5 nested domains of the numerical weather prediction.
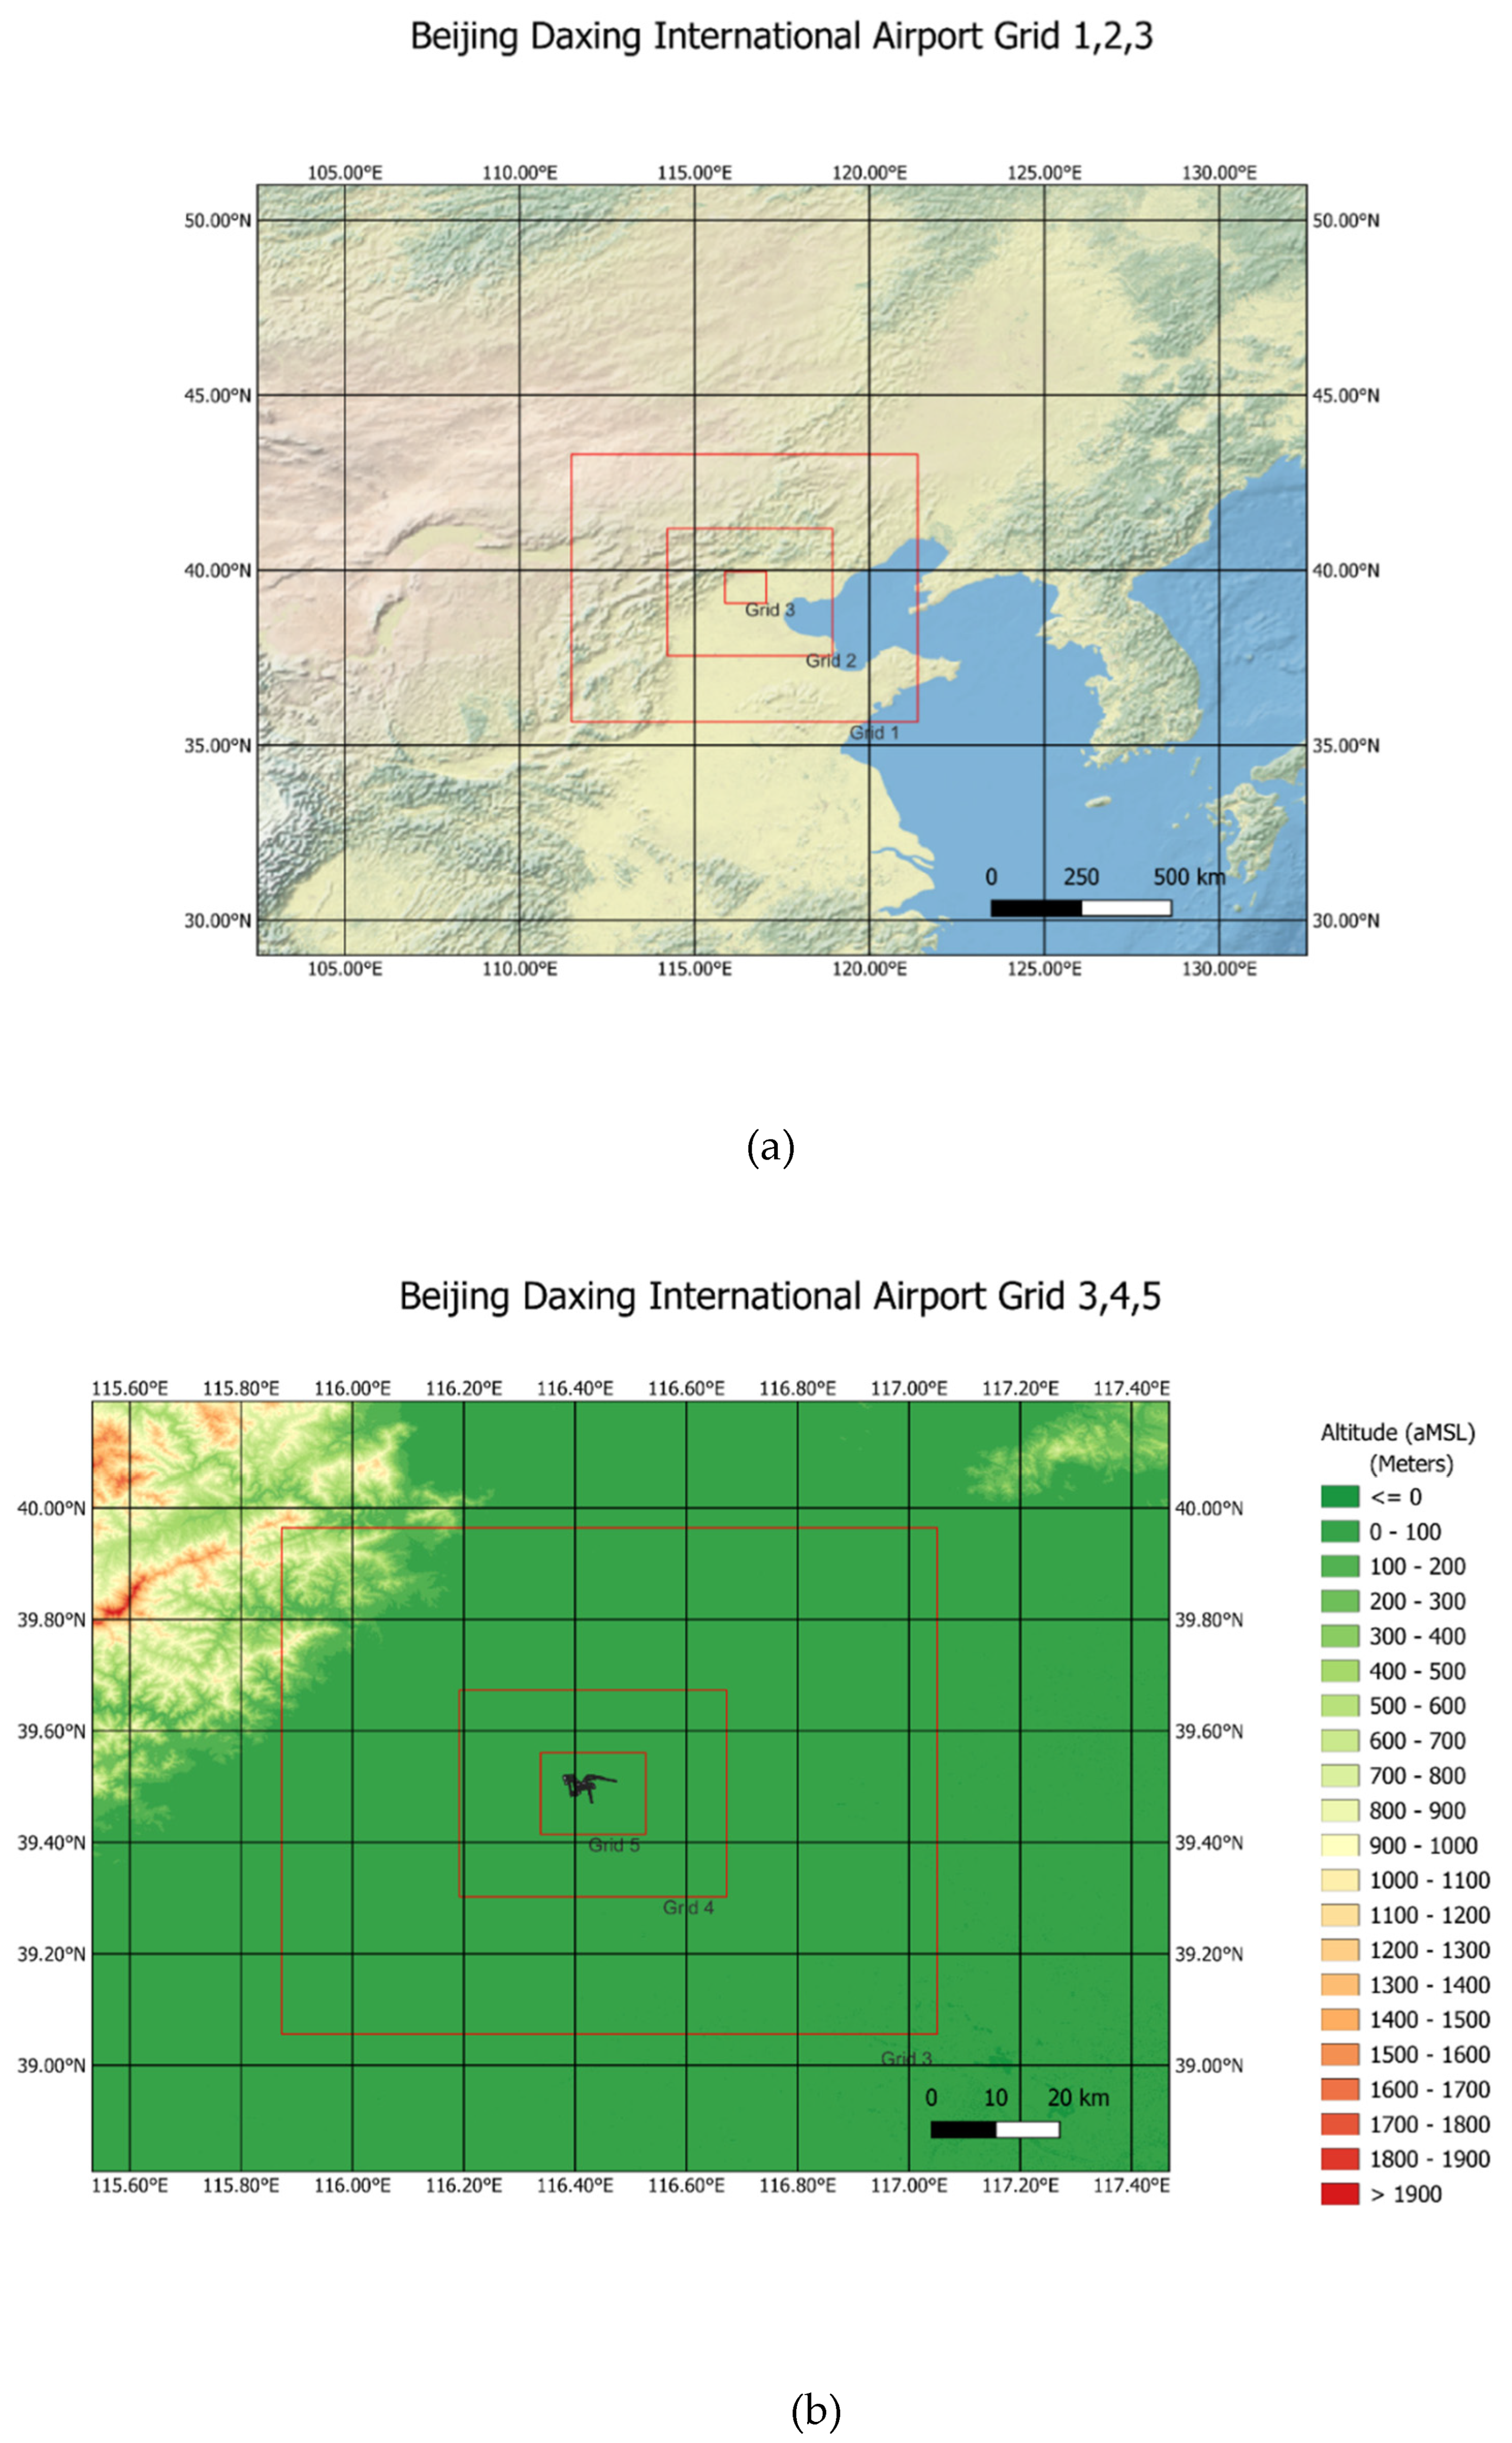
Figure 8.
The simulated LIDAR 3-degree PPI velocity imagery (a) and the 2-dimensional wind field at a height of 464 m above seal level (b) at the simulation time of 16:20 UTC, 8 January 2023.
Figure 8.
The simulated LIDAR 3-degree PPI velocity imagery (a) and the 2-dimensional wind field at a height of 464 m above seal level (b) at the simulation time of 16:20 UTC, 8 January 2023.
Disclaimer/Publisher’s Note: The statements, opinions and data contained in all publications are solely those of the individual author(s) and contributor(s) and not of MDPI and/or the editor(s). MDPI and/or the editor(s) disclaim responsibility for any injury to people or property resulting from any ideas, methods, instructions or products referred to in the content. |
© 2024 by the authors. Licensee MDPI, Basel, Switzerland. This article is an open access article distributed under the terms and conditions of the Creative Commons Attribution (CC BY) license (http://creativecommons.org/licenses/by/4.0/).
Copyright: This open access article is published under a Creative Commons CC BY 4.0 license, which permit the free download, distribution, and reuse, provided that the author and preprint are cited in any reuse.


