1. Introduction
The issue of safety in road transport is crucial and multifaceted. Many factors can be distinguished that influence this safety to a greater or lesser extent. One approach to analyzing transport safety is to identify hazards and assess the risk of an accident or road traffic collision [
1,
2]. The mechanisms and habits that define the set of behavior’s of traffic participants, including drivers and pedestrians, constitute one of the more important groups of risk factors [
3]. The difficulty in analyzing and assessing them stems from the specialized nature of behavioral research into human behavioral mechanisms [
4]. Current research in this area becomes even more relevant in the context of the development of autonomous transport and the achievement of fully autonomous motor vehicles [
5,
6]. The article [
7] outlines the key issues involved in the development of hybrid and electric vehicles, issues unknown to conventional vehicles with internal combustion engines. The growing number of electric and autonomous cars [
8], which operate quietly and with minimal vibrations, requires a reevaluation of safety factors. Noise and vibration are natural indicators of potential hazards [
9,
10].
The issue of driver behavior is very important especially with regard to the consequences that may arise for vulnerable road users, i.e. the risk of traffic accidents. Despite many driver education campaigns [
11], it is assumed that driver behavior is a contributing factor in as many as the majority of road accidents worldwide, so it is extremely important to have as much knowledge as possible about the various factors and their impact on the possibility of a road accident occurring. This topic is so important that, according to the World Health Organization, there are approximately 1.3 million fatal accidents and between 20 and 50 million accidents [
12] involving drivers and vulnerable road users each year. According to accepted standards, there are different methods of data collection used to analyze individual driver profiles. One of the methods that can be used is the demographic profile binning method [
13]. Other methods are those involving the use of different types of tests, questionnaires, psychological interviews and other tools related to learning about drivers' behavior according to what they themselves declare in terms of what risks they are willing to take when driving a motor vehicle in relation to overall road transport safety [
14]. In addition, it is possible to collect data by reading recorded information from devices on the vehicle. This type of study offers the possibility of tracking driver behavior not only at the time of the measurement itself under controlled conditions, but offers the possibility of a continuous uninterrupted cycle of data collection [
15]. In addition, observational studies are also performed, individual situations archived via video cameras are analyzed as well as the use of powerful computer simulators [
16]. Methods using simulation devices - simulators - are methods that aim to replicate, as closely as possible, the real-life conditions in which individual situations can occur. However, there is a safety buffer in that the tests are carried out in a safe manner, excluding the risk factor associated with the fact that health or life will be endangered in the event of a non-compliant response, as may occur in normal traffic. It also involves the responsibility of those who carry out such tests. It would be very difficult under real conditions to study the reaction of drivers during situations such as skidding in normal traffic, which could have fatal consequences such as a road accident. On the other hand, however, conducting tests under controlled conditions to the full extent may be associated with a lack of authenticity of the acquired data [
17]. This is why the planning and design stage of simulation studies is so important and directly affects the quality and usability of the data obtained and the resulting validity and validity of the conclusions drawn.
The aspect of authenticity of the research was also very important during the research planned at the Motor Transport Institute in Warsaw concerning the behavior of drivers approaching pedestrian crossings, in different variants of pedestrian crossing markings such as classic vertical signs, luminous vertical signs, luminous horizontal signs, occurring in different configurations. The simulator facilities used at the Institute of Road Transport in Warsaw are a highly advanced technology for carrying out extensive analyses of the behavior of drivers of not only passenger vehicles, but also heavy goods vehicles in near-real conditions, reproducing in a simulated environment the same reactions as driving a motor vehicle in normal road conditions.
In addition to the passenger car simulators described in this article, we can distinguish, for example, simulators for military applications, where the training of soldiers or service personnel takes place under controlled conditions in which there is no likelihood of a catastrophe associated with improper handling of equipment or vehicles. The same applies to flight simulators, where pilots undergo an extensive training process. However, the procedures that take place during such training are the same as those that take place in real-world conditions. However, in addition to simulators that are so advanced, there are other simulator solutions that provide variety and a very high degree of innovation during training [
18]. At the TRAKO 2023 trade fair organized in Gdańsk, simulators used during the training process for employees of the Polish Railway Lines were presented, an example being a simulator for operating a platform for disabled people on electric multiple units [
19]. This makes it possible to conduct a range of training courses in a minimally invasive way, with the aim of assimilating appropriate, proper operating procedures. The article addresses a very complex issue of road safety, in particular relating to the behavior of both vulnerable road users and drivers of motor vehicles. In the case of tests carried out directly in traffic, a driver performing particular tasks aimed at testing his or her alertness and ability to assess the situation under given conditions would be exposed, as well as endangering other road users, which is of course unacceptable. This is why the development of highly sophisticated driving simulators was such a breakthrough achievement. These reflect real-world conditions in a simulated environment, ensuring safety in the event of a collision or accident.
This paper presents the complete process involved in conducting simulator studies, from general examples defining the framework related to the simulator study approach, to ready-to-use guidelines with study scenarios, based on complex analyses using behavioral studies of both drivers and vulnerable road users, together with the determination of safety determinants of pedestrian crossings without traffic lights. Due to the specific nature of simulator testing and the frequent complaints during long-duration testing, a reduction in testing time while maintaining a representative number of cases and traffic scenarios to be simulated in order to identify driver behavior’s and perceptions that may influence the risk of a pedestrian crossing accident was adopted as a key element in the planning and design of the study. Thus, a comprehensive method and algorithm for planning and designing simulator studies should be considered as the main achievement presented in this article.
4. Planning and Design of Studies of Driver Behavior at Pedestrian Crossings Using Simulators
A key aspect when planning and designing studies using driving simulators is their context. A study is planned differently in the context of, for example, the impact of driving speed, differently if it is to address the impact of fatigue, differently in the case of monotony. One of the most dangerous effects of driving in a monotonous manner is the phenomenon of microspeeding [
31]. The context of the research may also relate to specific group characteristics of the participants, e.g. age, gender, disease entities. One of the context groups is behavior for specific traffic scenes, e.g. post-running in the city, at level crossings, at junctions. All these aspects influence the need to select the type of driving simulator, define the test scenarios, determine the preferences of the users (test subjects), select the measurement parameters and organize the research process. The context of this research concerned the behavior of drivers in the vicinity of pedestrian crossings and involved a general group of users.
4.1. Defining the Research Context and Assumptions
The research problem and context determines the entire planning, design and implementation processes. The correct and precise definition of the research context and the definition of research problems or hypotheses determines the validity of the selection of methods and the scope of the research. This in turn affects the quality of the results obtained and, consequently, the validity of the conclusions formulated. This results in a direct and strong relationship between the research context and the final conclusions. In addition, very often a precise and accurate formulation of the research context makes it possible to significantly reduce the scenarios and conditions, and thus the scope of the research, and allows a significant shortening of the execution time while maintaining the quality of the measurement results obtained.
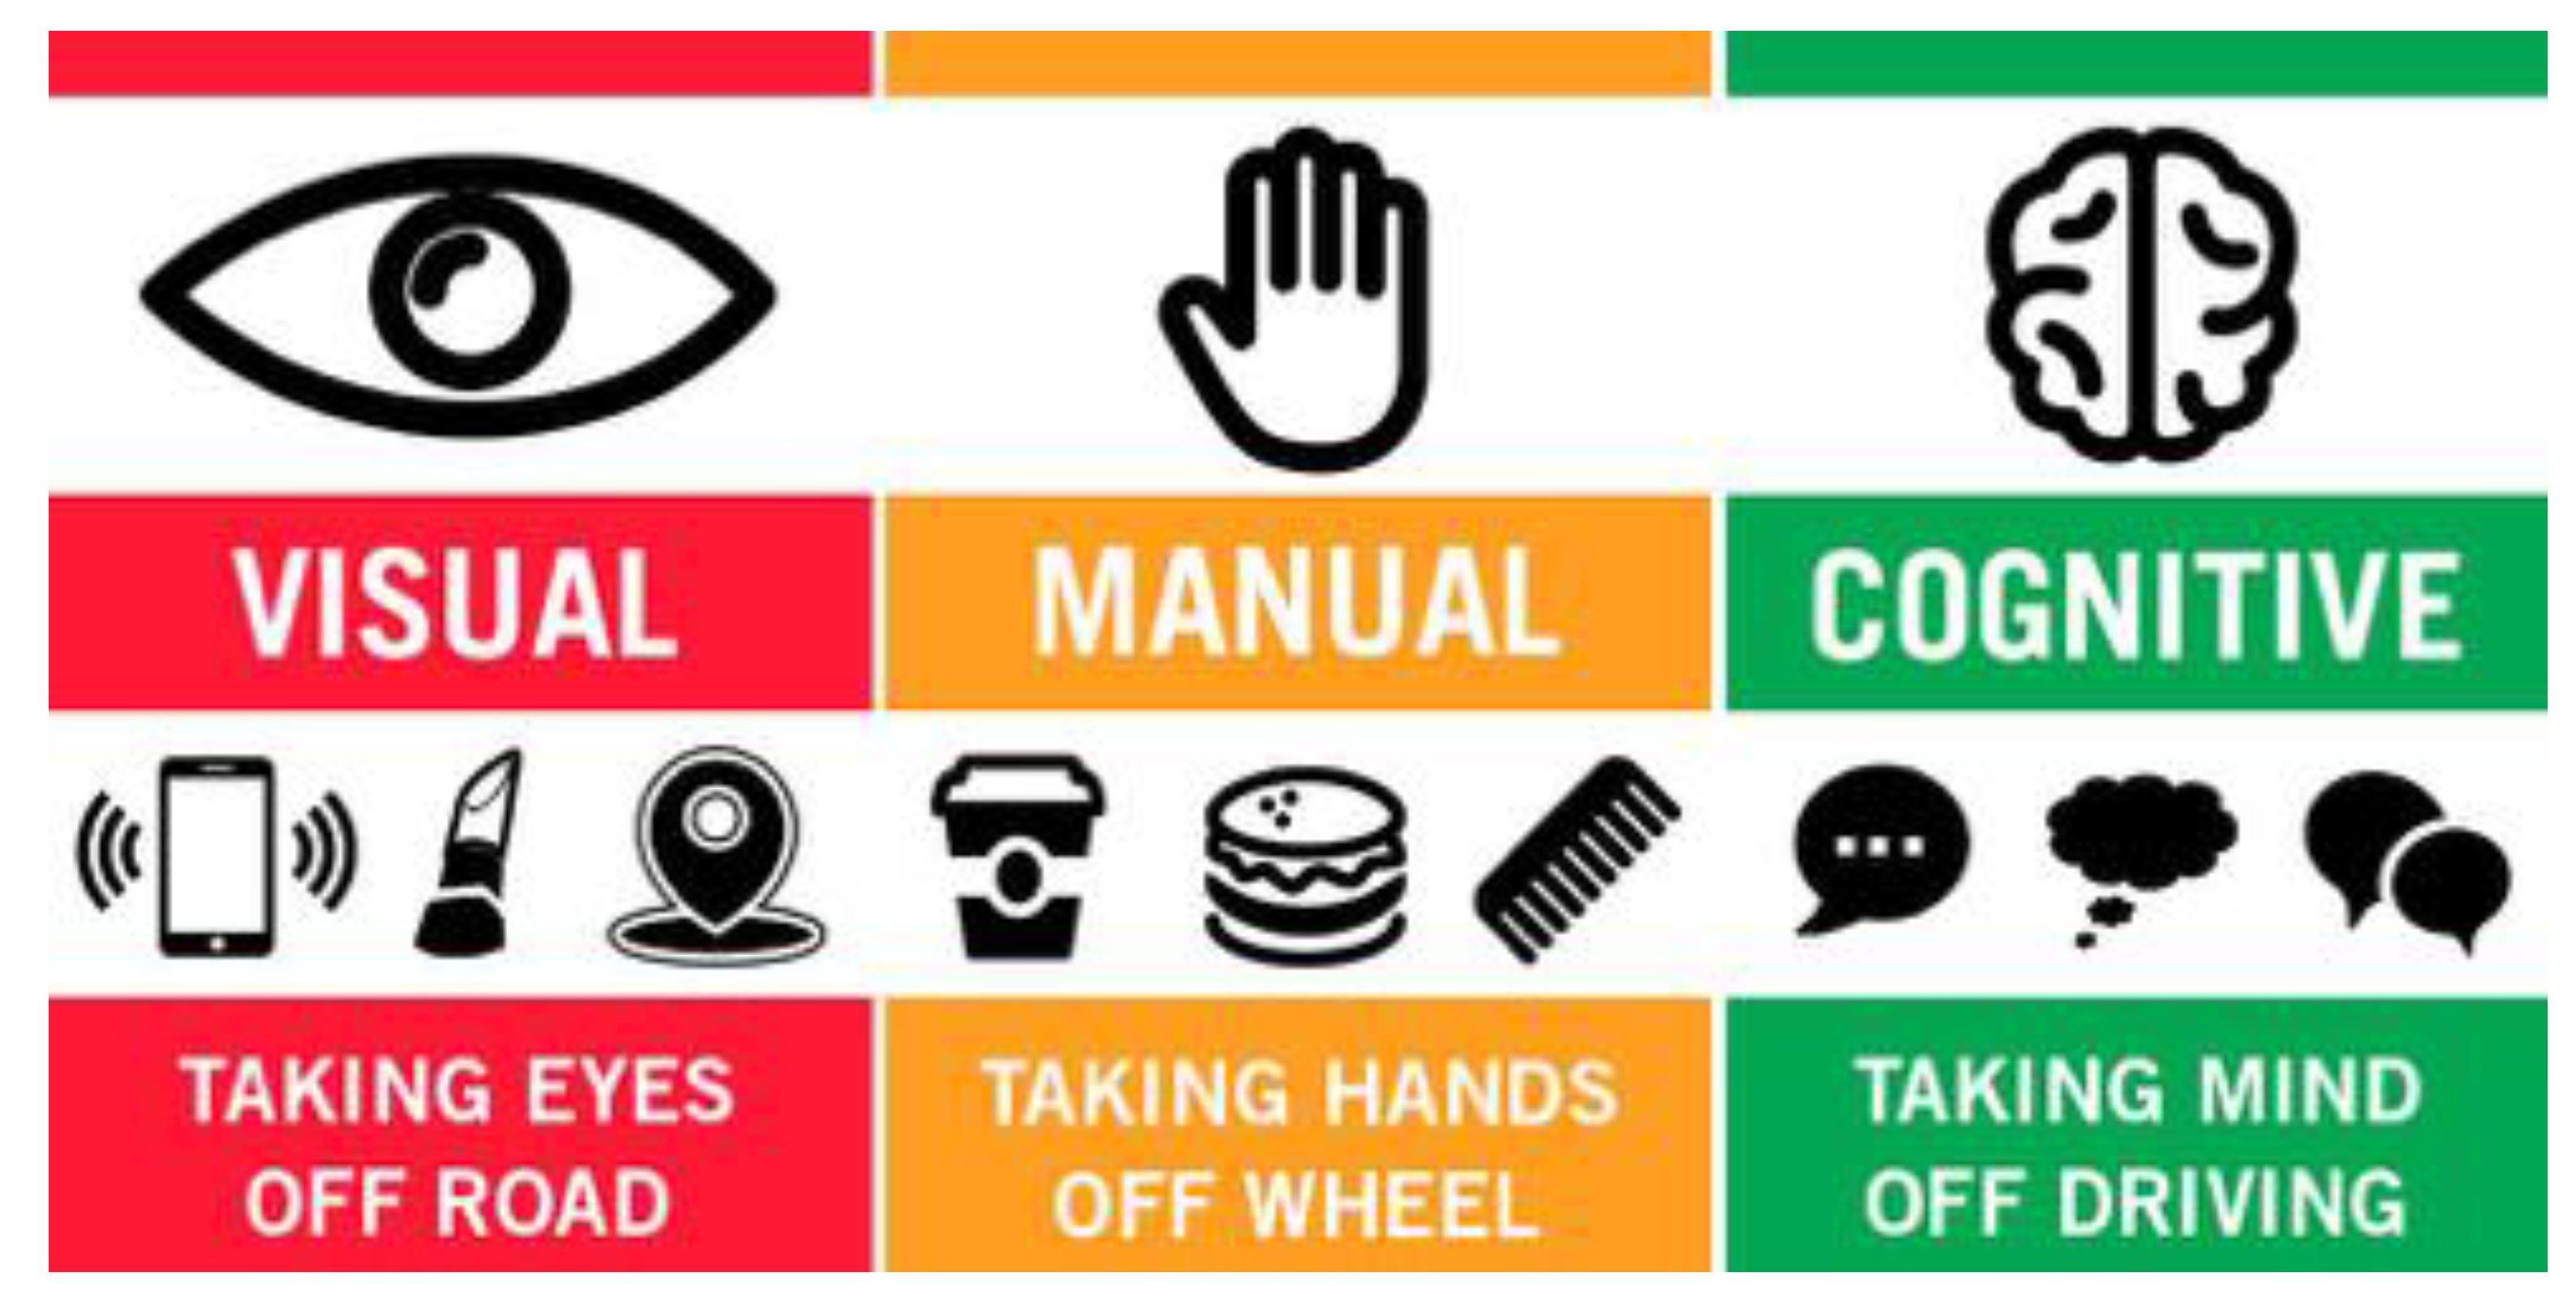
In this study, the research problem was the behavior of drivers around different pedestrian crossings with different factors influencing drivers' perception and focus. The research problem defined in this way made it possible to define a research context, which involved following drivers' behavior and perceptions when approaching and crossing pedestrian crossings under different driving conditions, defined by vehicle speed, weather conditions and the type of surrounding development. In addition, the context included various assumed specific behaviors of vulnerable road users (turning, accelerating step, etc.) and different types of pedestrian crossing development and equipment with warning systems. The influence of internal and external attentional distractors on driver behavior, such as talking on the phone or operating a screen in the vehicle or on a tablet (phone), as well as large-area advertising or unusual objects outside the vehicle, was also identified as an important component of the research context.
Figure 2.
Visual, manual and cognitive distractors affecting the driver [
28].
Figure 2.
Visual, manual and cognitive distractors affecting the driver [
28].
As a result, the research assumptions were defined as:
- analysis of the impact of the type of pedestrian crossing,
- analysis of the impact of the method (system) of warning,
- analysis of the impact of surrounding development conditions,
- analysis of the impact of driving speed and weather conditions (including time of day),
- analysis of the impact of the behavior of vulnerable traffic participants (pedestrian, cyclist),
- analysis of the impact of internal and external distractors of attention.
As additional assumptions limiting the scope of the study were:
- elimination of the effect of driver fatigue during the study (short testing time),
- elimination of the effect of additional medical conditions on driving ability,
- eliminating the impact of driving experience,
- eliminating the impact of road infrastructure lighting and driver glare,
- eliminating the impact of additional vehicle safety systems (including "assistances" and obstacle detection sensors).
4.2. Selection of the Type of the Driving Simulator
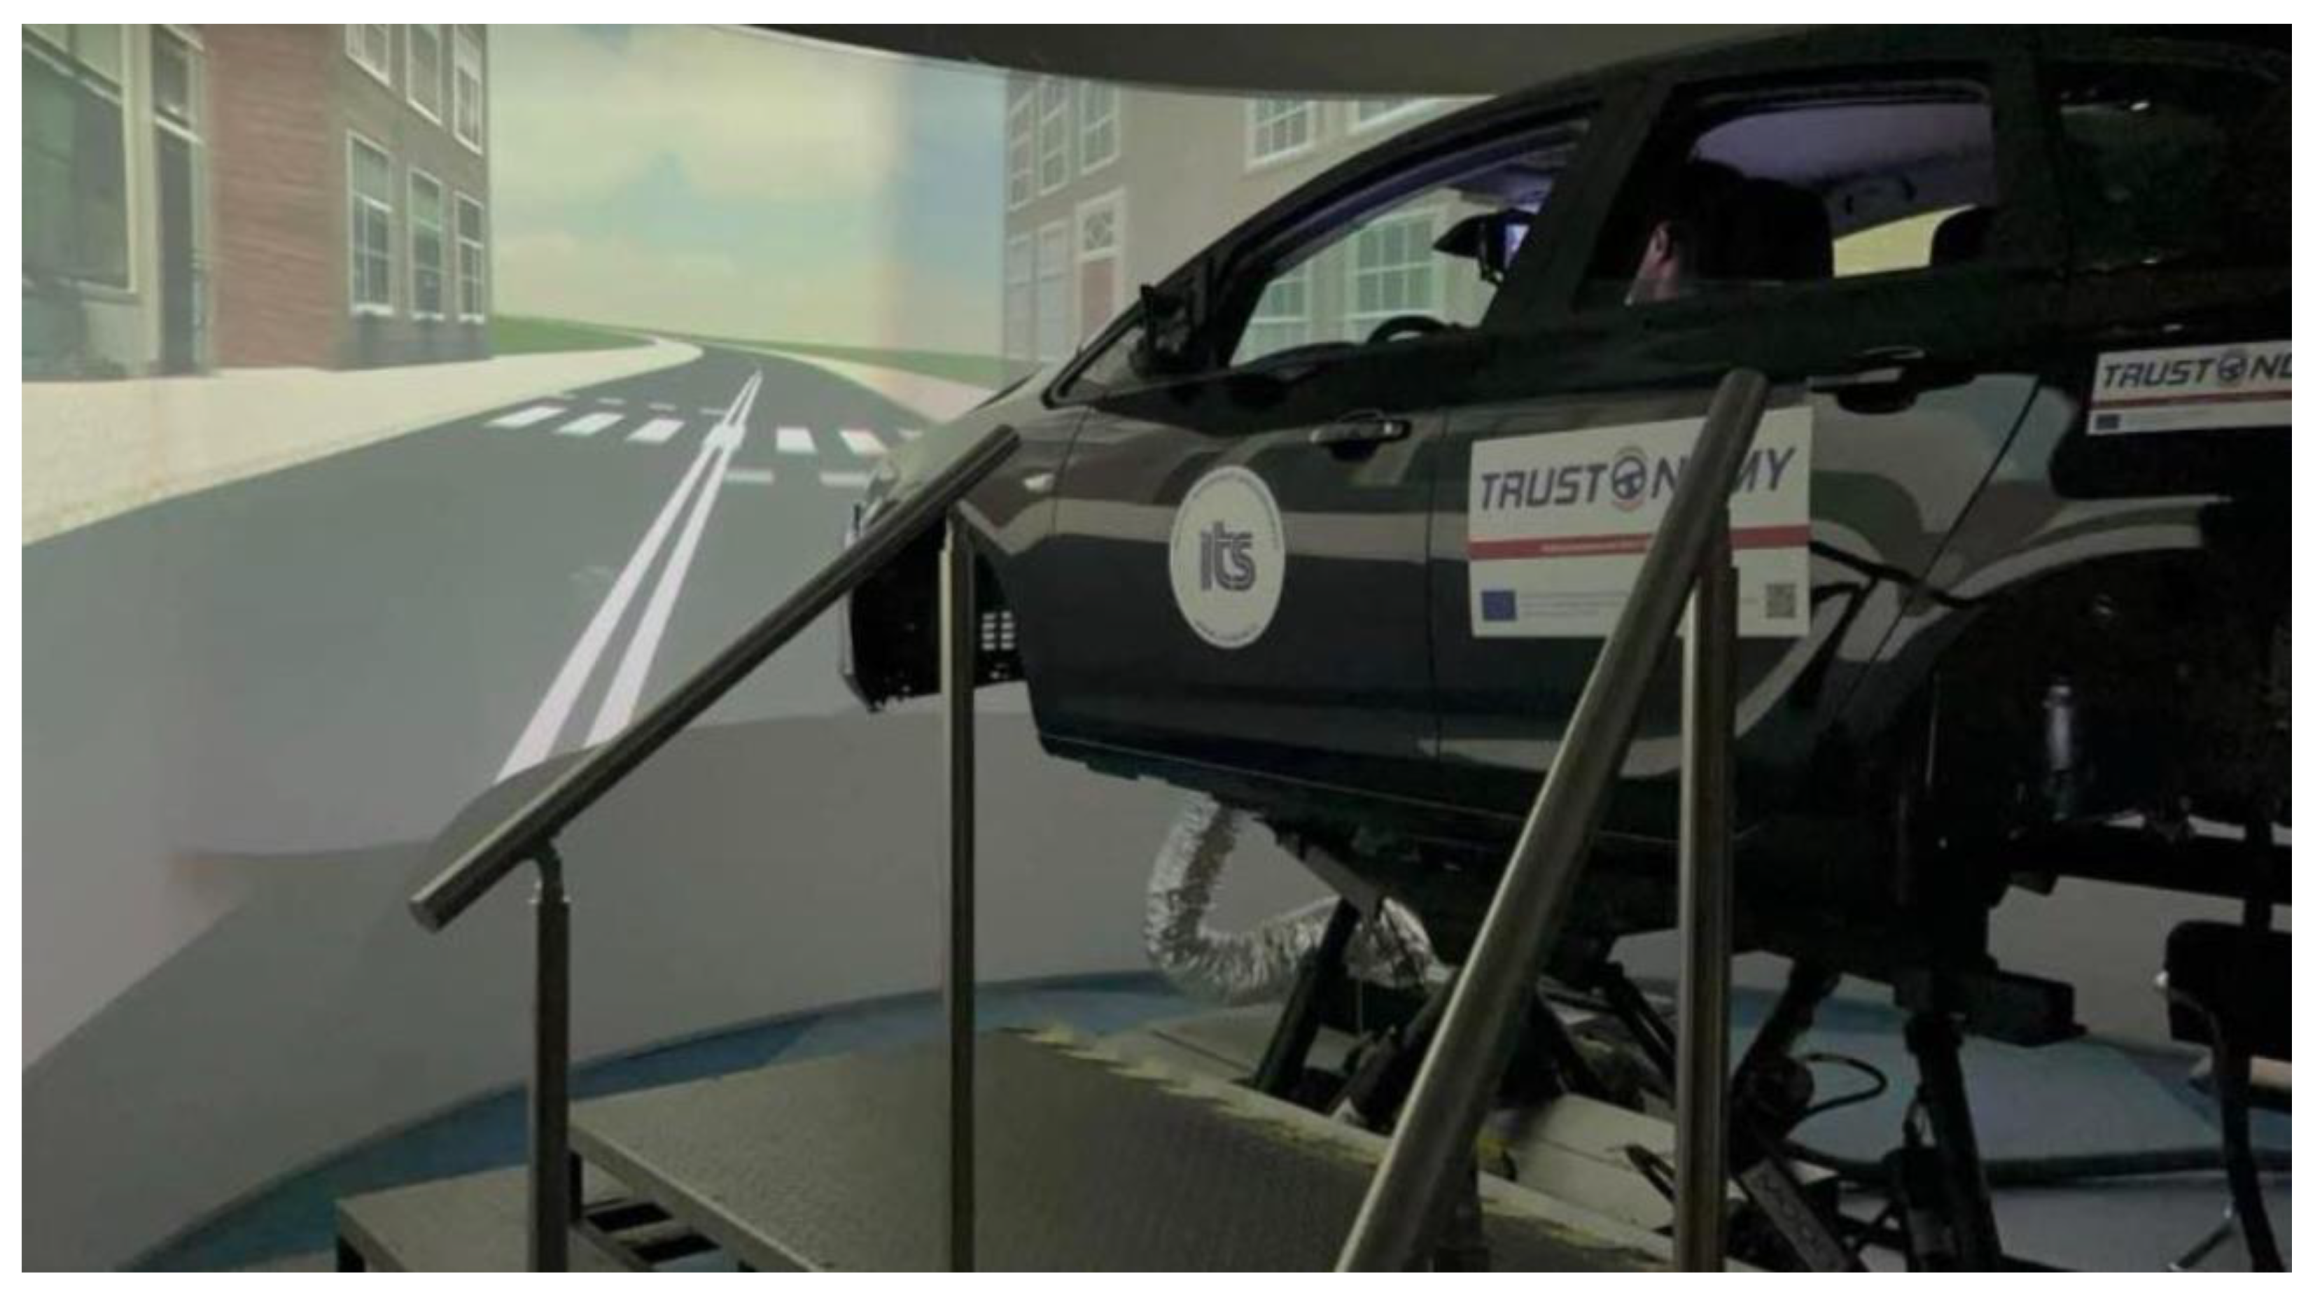
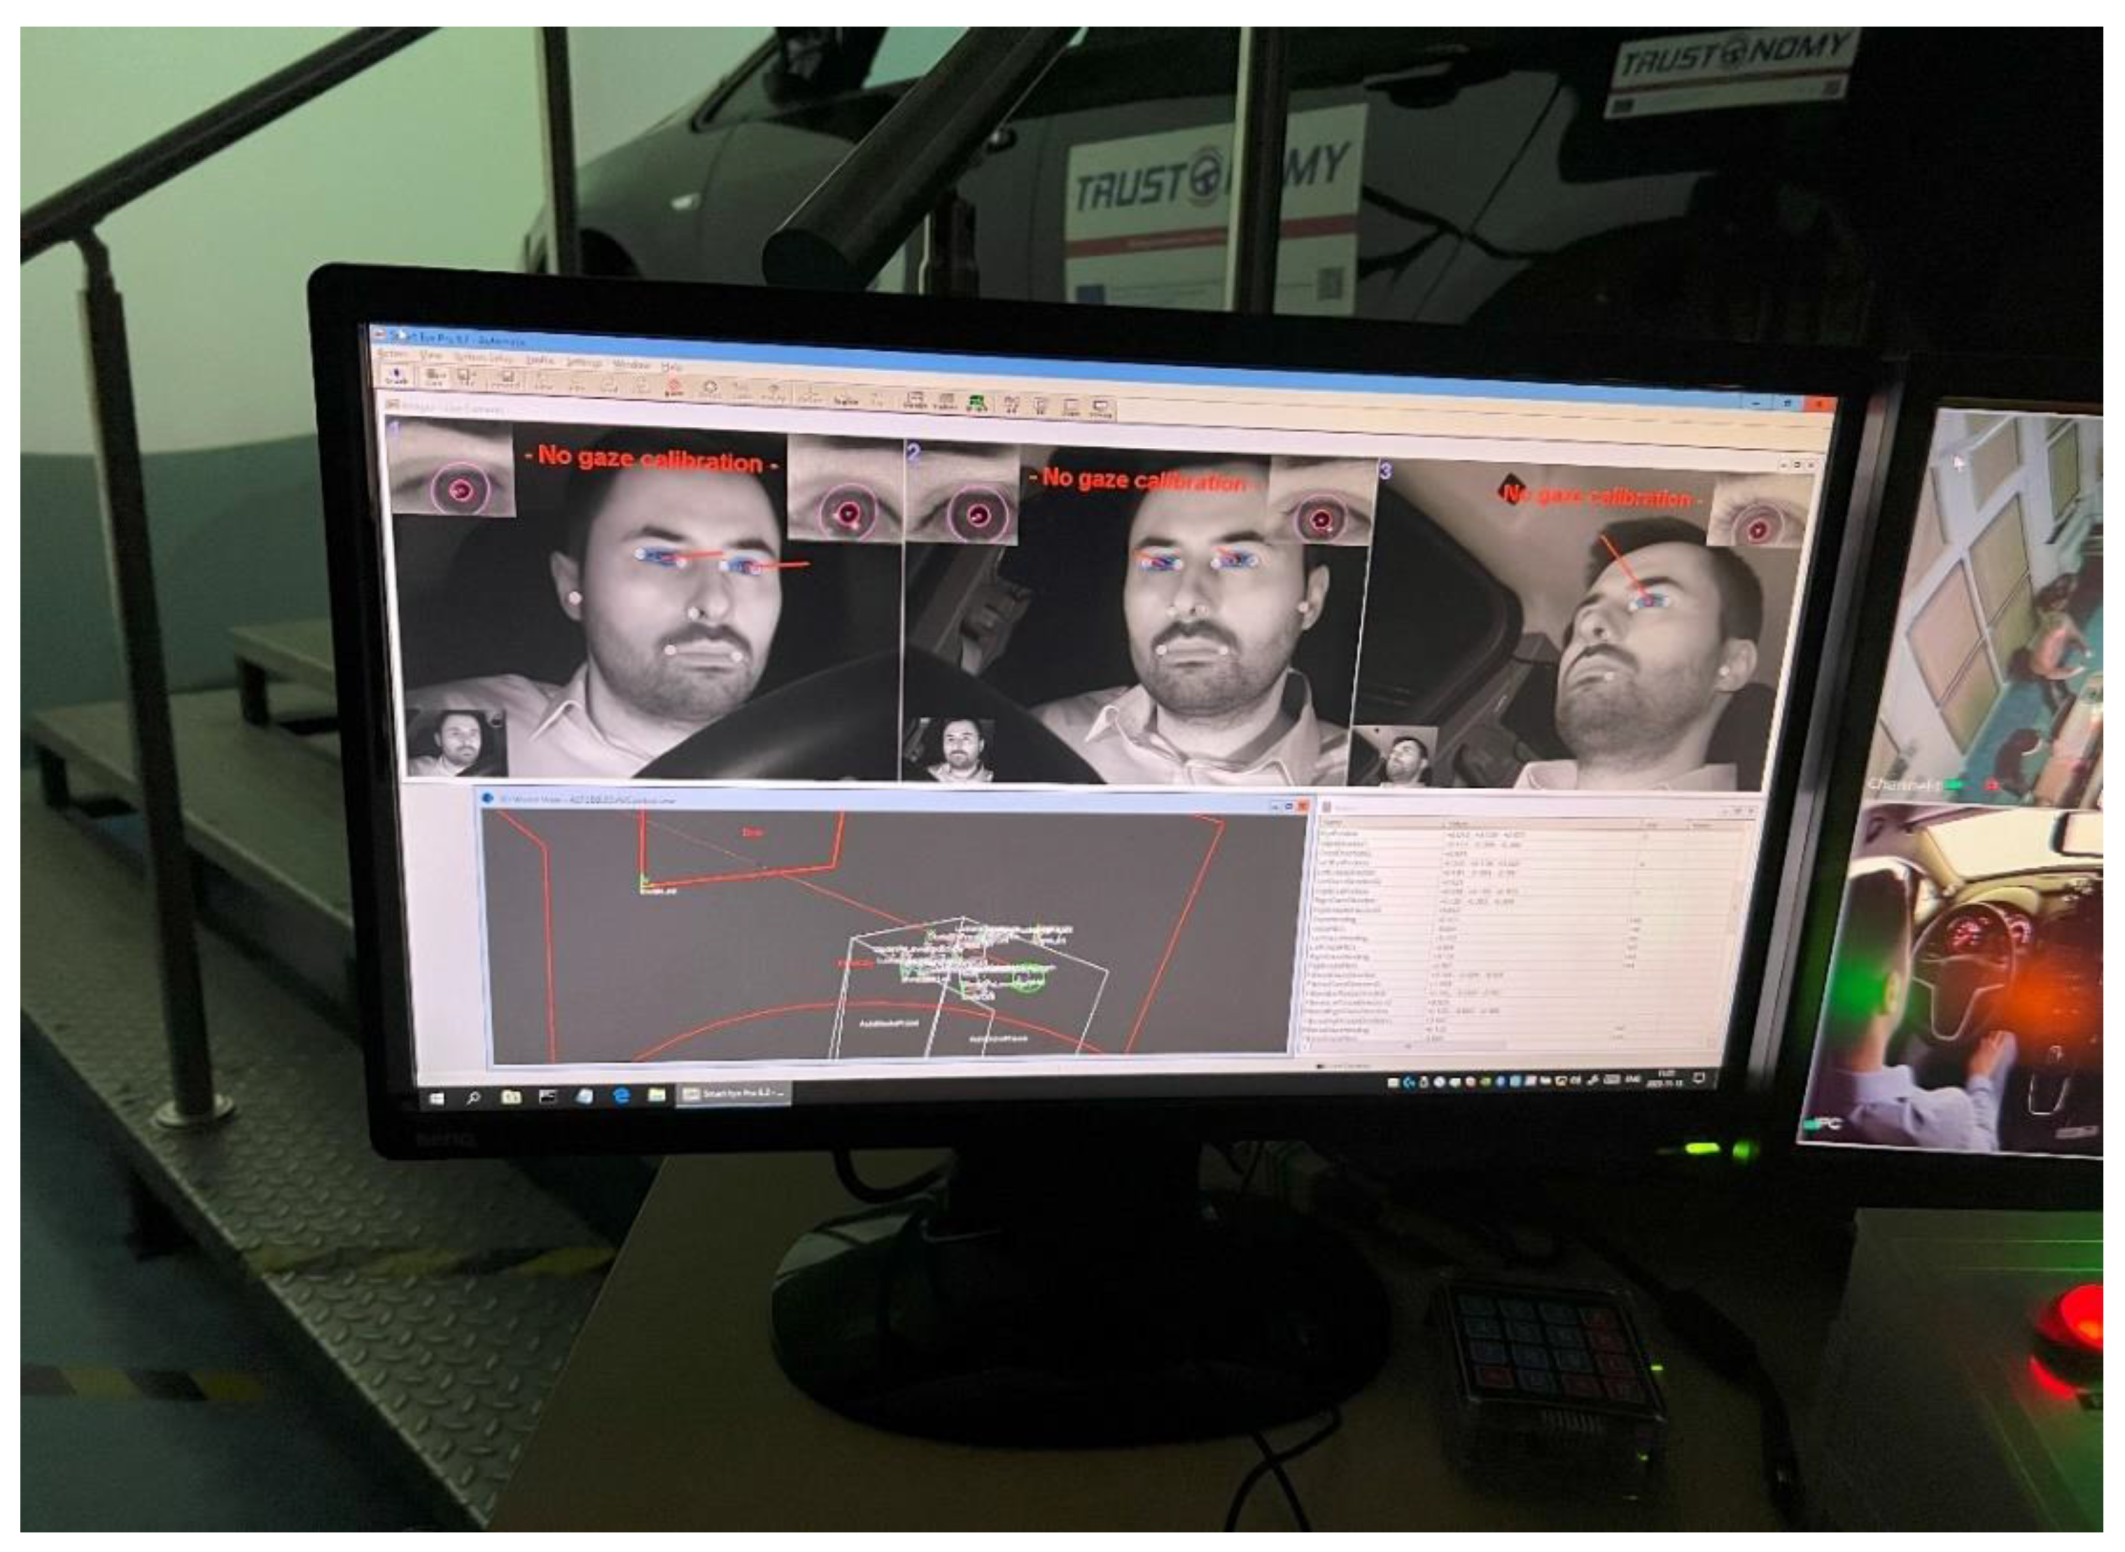
The selection of the type of driving simulator included several aspects one of them was the main purpose for which the research in question is to be carried out, as it is to study the behavior of drivers approaching pedestrian crossings, and the results can then be used to create solutions to support the safety of vulnerable road users, the main requirement was first and foremost the realism of the research itself, to replicate real conditions in a simulated environment as much as possible. Another aspect concerned its complementarity with regard to the functionality of the device. When planning and projecting a behavioral study, research parameters are determined that will be crucial to the simulation study in question. The research parameters in the case of driving simulator research may be driving speed, any kind of reaction time relating to the devices behind-built in the driving simulator, eye tracking, movement of the research participant in the vehicle. The ba-test will be carried out using a high-end simulator AutoSim AS 1200-6, which is built from a full-size cabin of an Opel Astra IV passenger car and equipped with a system of four projectors displaying images on a screen covering a 200º field of vision, as well as a system of three screens acting as car mirrors. The simulator sits on a six-degree-of-freedom moving platform, allowing the simulation of angular and linear movements of the cabin during actual driving. The simulator's software allows full control of weather conditions, lighting conditions and the behavior of other road users. An additional advantage of the solution in question is the minimization of the risk of simulator sickness by not using directly worn VR goggles, as the simulator has a number of relevant cameras to record activity in the cab, and what was also crucial the simulator has six degrees of freedom, which also has a huge impact on the ability to minimize the occurrence of symptoms of simulator sickness among study participants, which is crucial for reliable results after the completion of the study, as extensively described in the previous section of the article. The last aspect concerns the availability of such an advanced solution. Simulators of the class described in this article are available for use only at specialized research institutes.
Figure 3.
AS 1200-6 passenger car simulator (source Motor Transport Institute Warsaw, own picture).
Figure 3.
AS 1200-6 passenger car simulator (source Motor Transport Institute Warsaw, own picture).
4.3. Research Planning
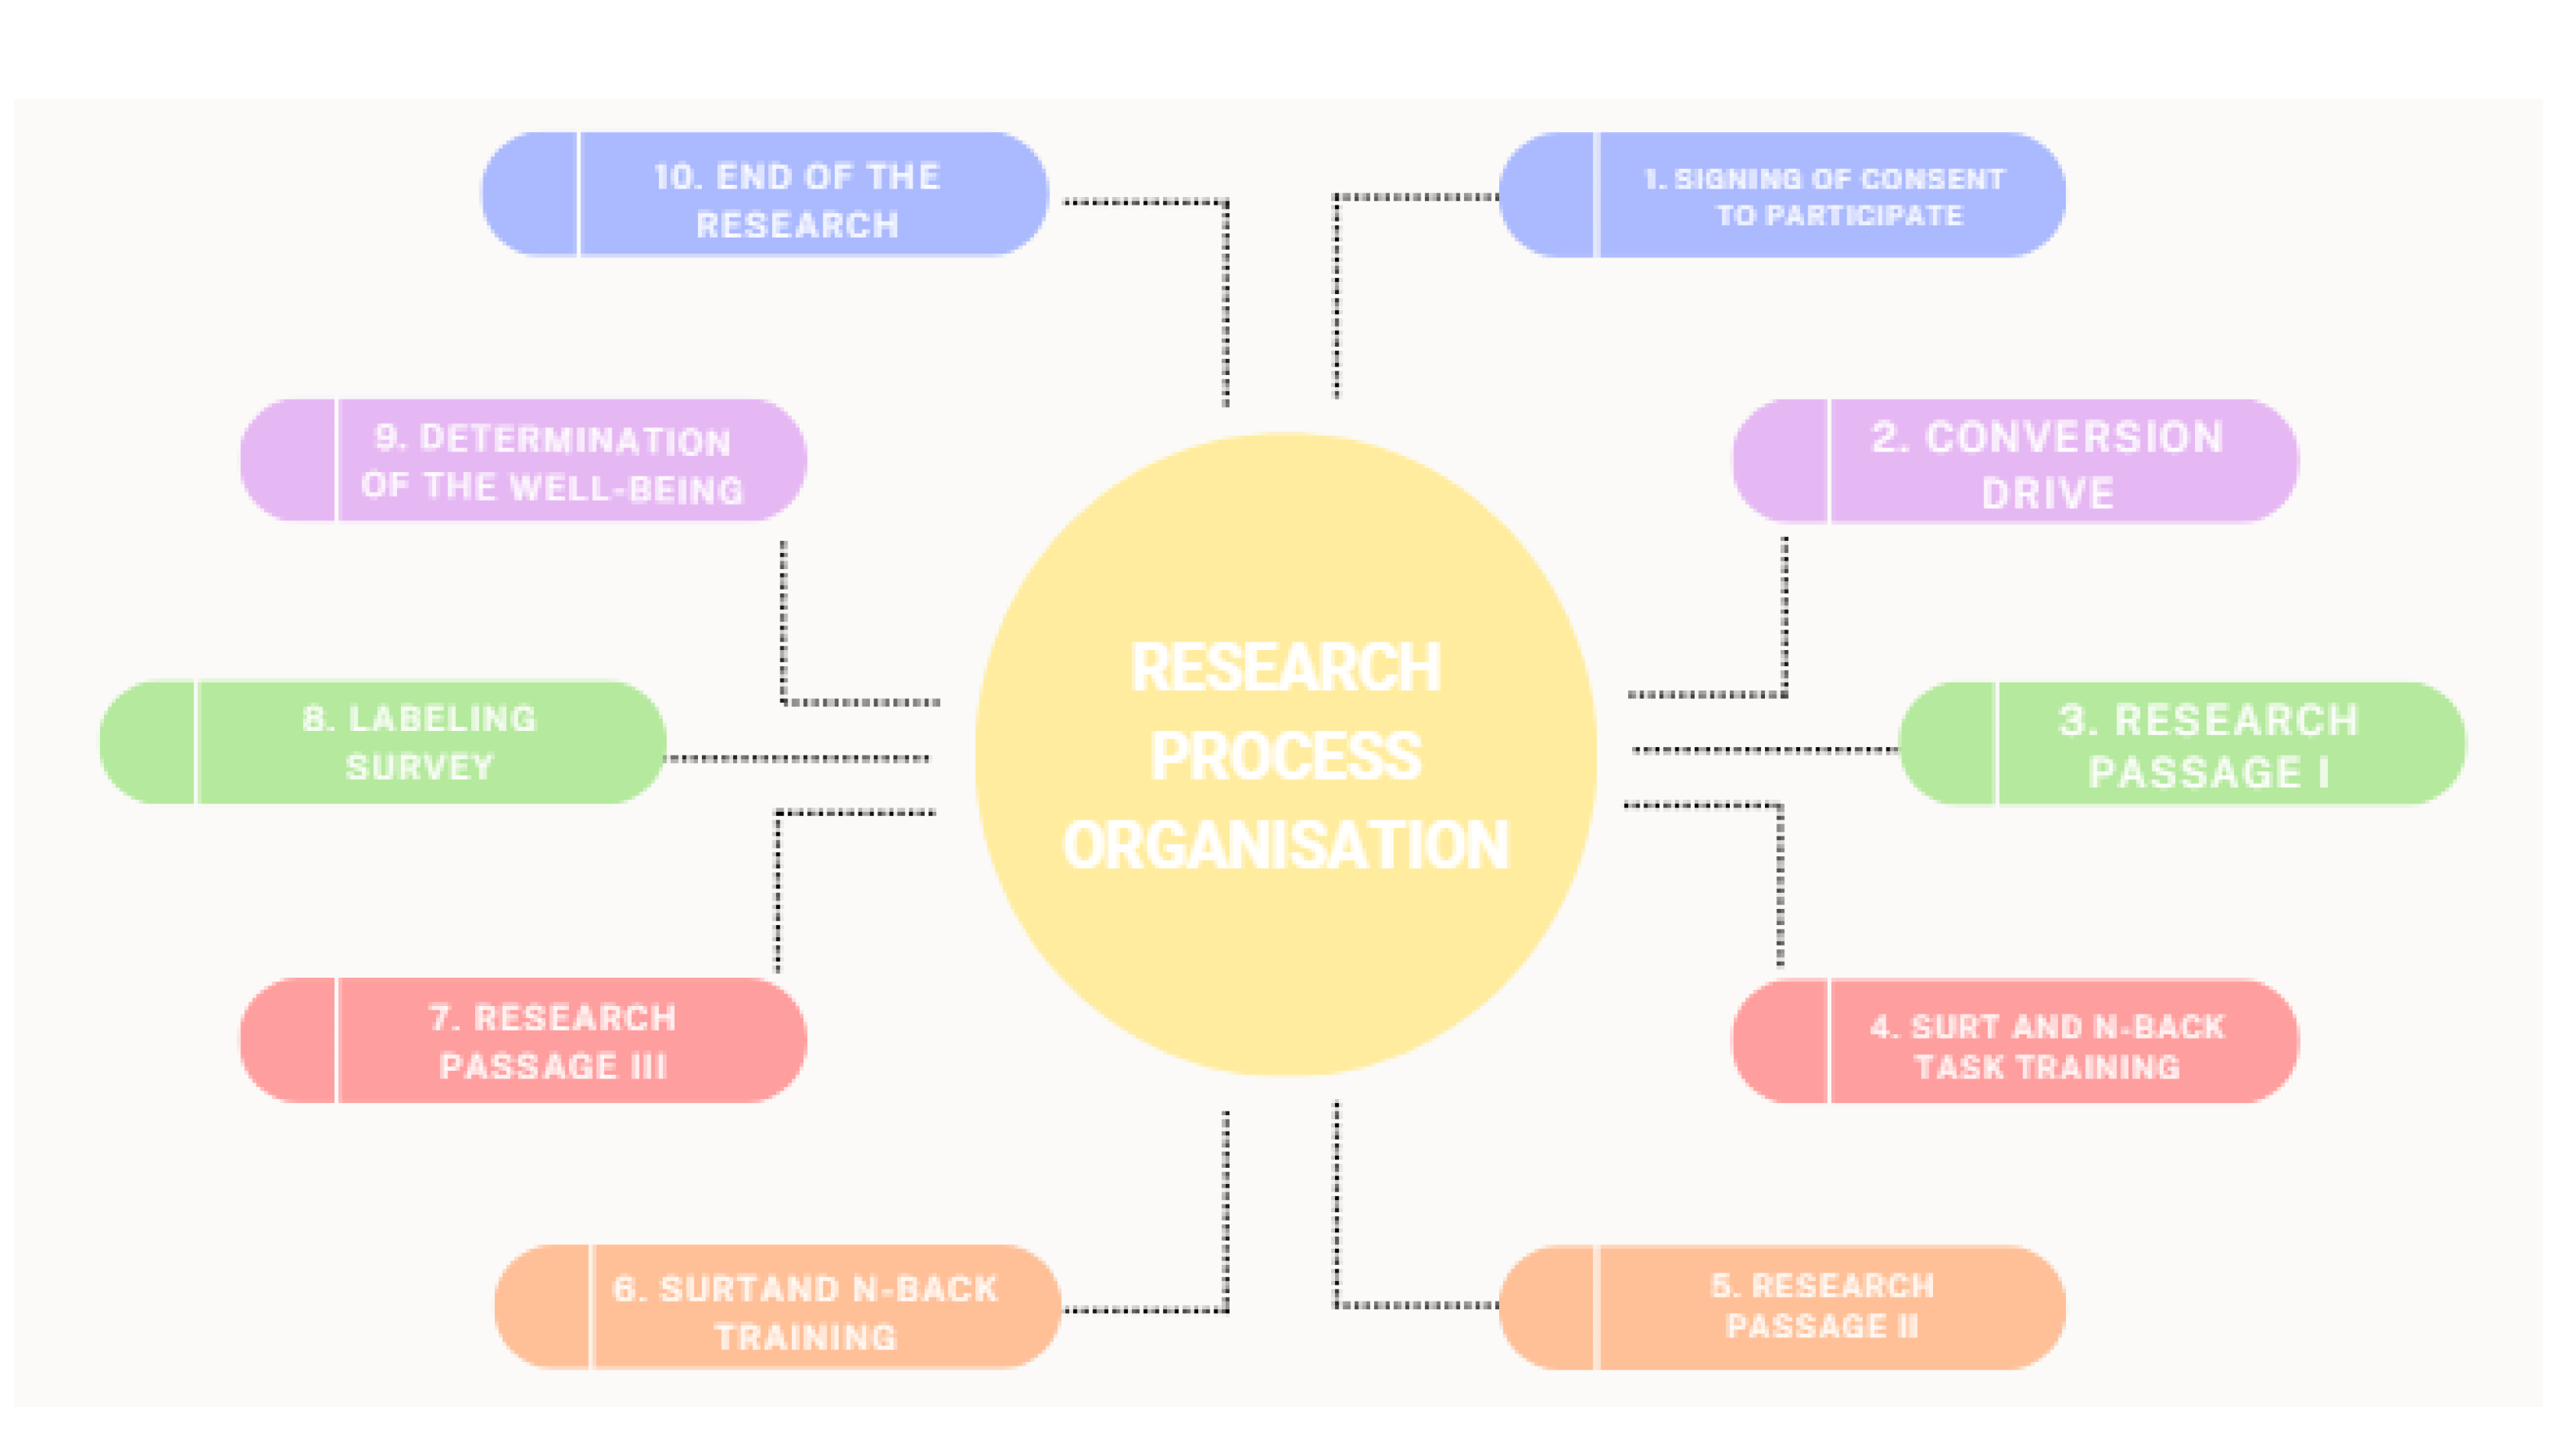
In a study with an experimental scheme, 30 drivers are planned to participate, including 15 men and 15 women. The prerequisites for participation are possession of a cat B driver's license and active participation in traffic for at least half a year. The respondents will be divided into two research groups based on age (young people - under 45 years old, older people - over 45 years old). Remuneration is expected for participation in the study. The research experiment will be conducted according to the scheme shown in
Figure 1. The study is to be individual-dual in nature. In preparation for the study, drivers will be required to sign a consent form and a statement that they are familiar with the possible consequences of taking part in research using driving simulators [
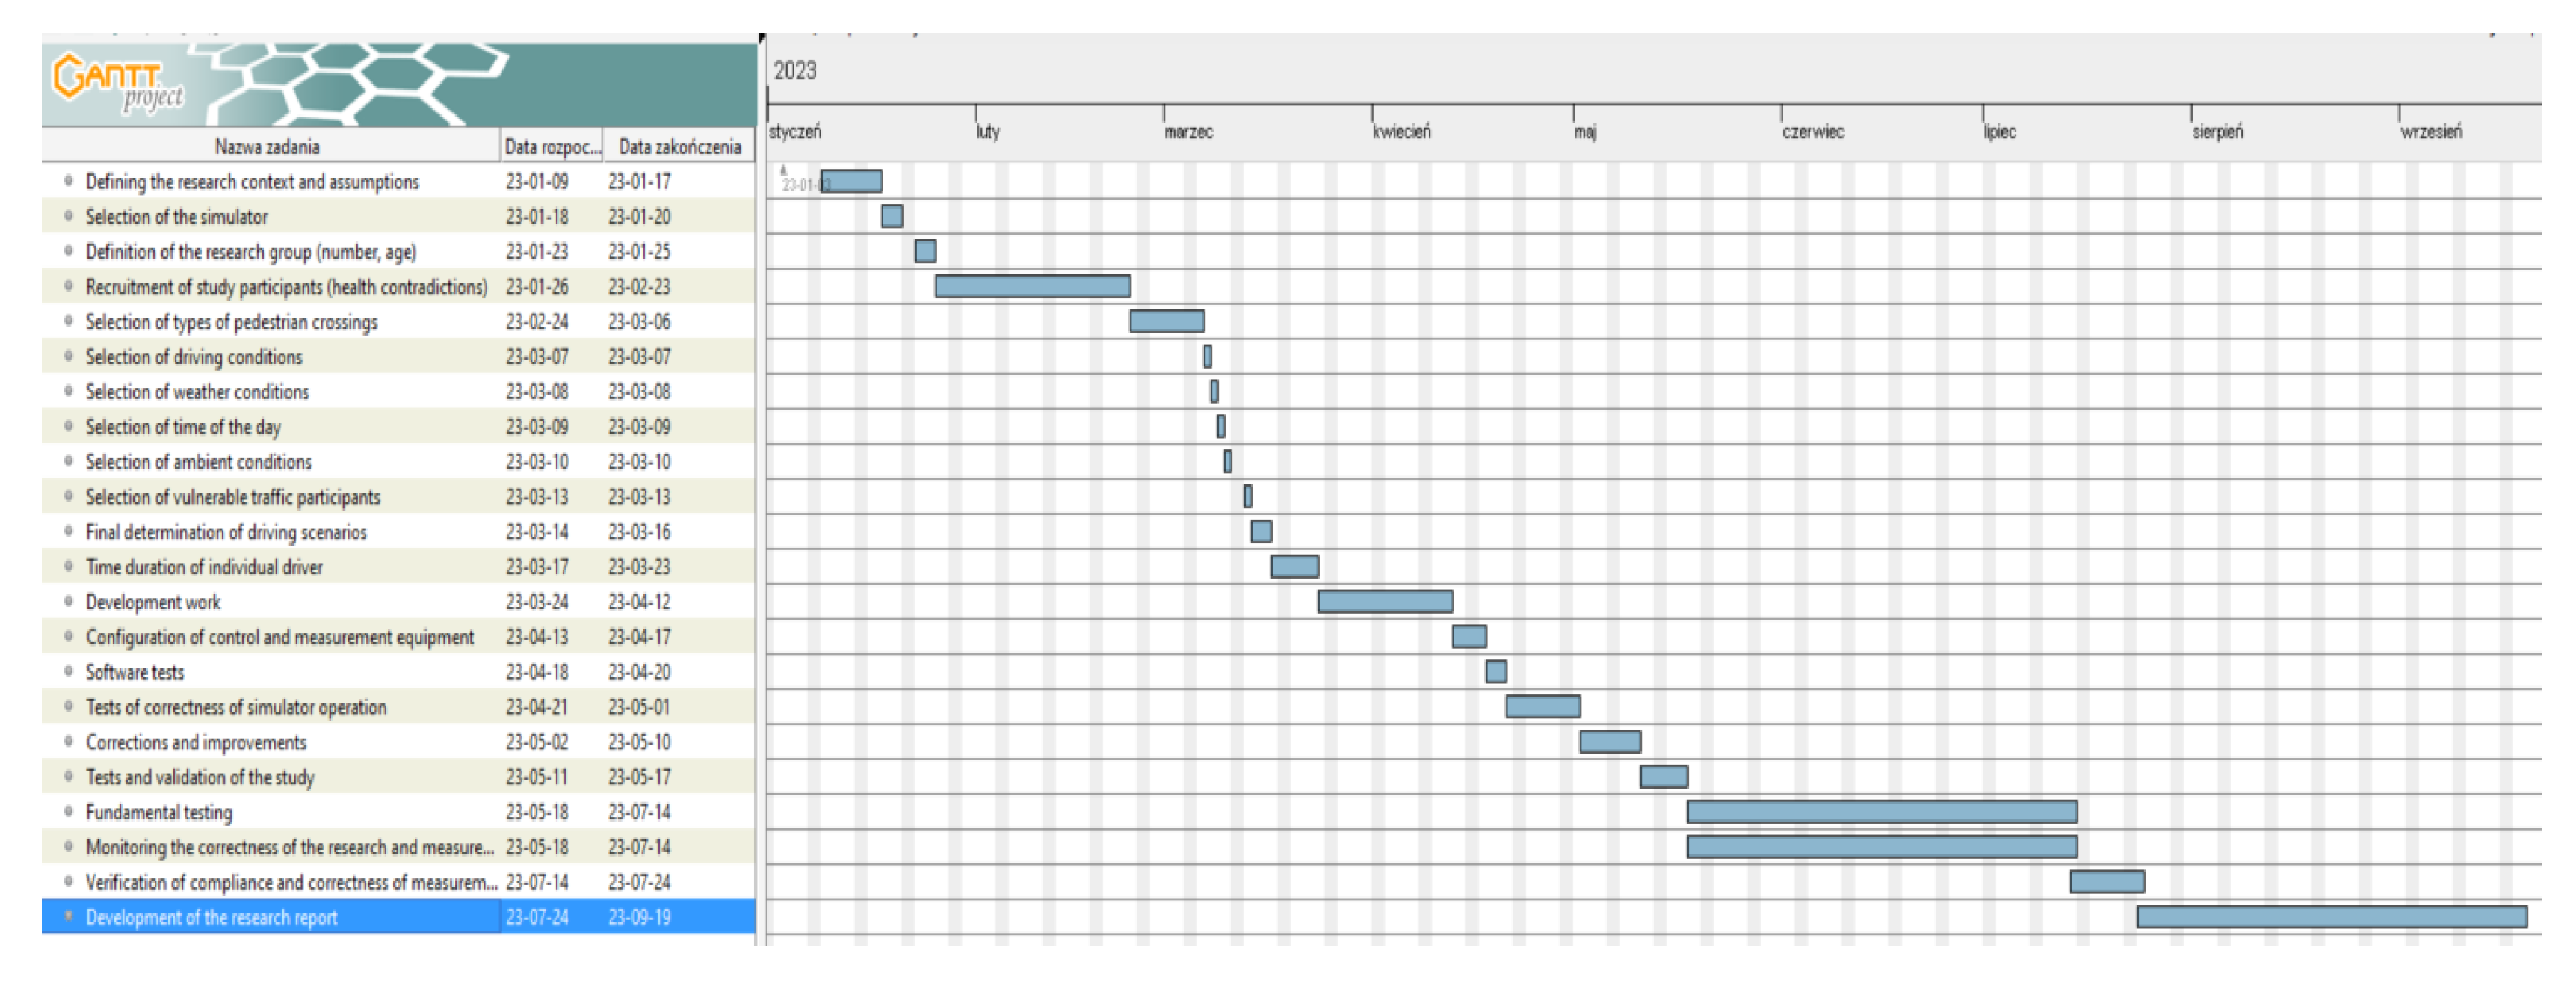
32]. Participants will then complete the first SSQ questionnaire (SSQ1) and begin an adaptive driving session. The diagram below shows the various steps that will be followed to plan and execute the entire measurement process, along with the inference process.
Figure 4.
Timelapse diagram of the whole research process (own elaboration using Gannt software).
Figure 4.
Timelapse diagram of the whole research process (own elaboration using Gannt software).
The next steps (tasks) are as follow:
1 - defining the research context and assumptions (e.g., 1 week)
2 - selection of simulator (e.g. 3 days)
3 - definition of the research group (number, age...)
4 - recruitment of study participants (verification of health contraindications) - 3 weeks
5 - selection of types of pedestrian crossings - 1 week
6 - selection of driving conditions (speed) - 1 day
7 - selection of weather conditions - 1 day
8 - selection of time of day - 1 day
9 - selection of ambient conditions (built environment) - 1 day
10 - selection of vulnerable traffic participants - 1 day
11 - final determination of driving scenarios - 3 days
12 - estimation of the time of individual driving stages and the total study
13- development work (design of the study according to the guidelines) - 2 weeks
14 - configuration of control and measurement equipment (determination of recorded data) - 3 days
15 - software tests - 3 days
16 - tests of correctness of simulator operation - 7 days
17 - corrections and improvements - 1 week
18 - tests and validation of the study (evaluation of compliance with the assumptions, purpose and scope of the basis) - 5 days
19 - Fundamental testing (according to the accepted scope) - 6 weeks
20 - monitoring the correctness of the research and measurement process (in parallel with 19)
21 - verification of compliance and correctness of measurement results - 1 week
22 - development of the research report - 6 weeks
4.4. Defining the Research Scenario
Defining the test scenario is a fundamental step when preparing to perform any test. This stage is labor-intensive due to the multitude of different traffic situations that can occur in real conditions when moving a vehicle. The purpose of selecting individual test scenarios is to select as many possible configurations of a particular travel route as needed. It also refers to establishing the initial and variable conditions to be controlled. Driving simulators provide an unprecedented opportunity for repeatability of implemented conditions, which gives very tangible benefits when performing individual measurements for different groups of people depending on their age or gender. Naturalistic, real-world conditions do not offer the possibility of such a selection of ideal external conditions, because there is a high risk that for each ride these conditions will be slightly different, in the case of simulators the conditions are analogous and repeatable for each participant taking part in the study. The selection of the research scenario also reflects the most relevant needs during the conduct of the study, as the number of possible configurations is arbitrary, after the initial preparation of the extensive possibilities of scenarios, those are selected that are most relevant to the research group due to the nature of the work, but also these limitations are related to the amount of time that the individual participant is able to focus and actively participate in the study. A major threat when conducting this type of research is the phenomenon associated with simulator sickness, a phenomenon that is described in the next section.
For this purpose, an approach of developing reciprocity tables is proposed, which are created on the basis of a square matrix containing all the required specifications of the research scenarios. As a result of the analysis of this array, it is possible to eliminate repeated combinations and then group the remaining scenarios to optimize the final number of scenarios based on the target function defined as the allowable (maximum) execution time of a single study.
The work of defining the research scenarios began by performing a series of studies related to behavioral factors and on the basis of safety determinants. The behavioral research involved analyzing the behavior of a group of 900 drivers approaching pedestrian crossings without traffic lights. Using the appropriate research apparatus, microwave radar, it was determined how the group of drivers surveyed behave when approaching the pedestrian crossings in question. The measurement was carried out at a distance of 30 meters in front of the pedestrian crossing up to the crossing itself. The conditions that were taken into account during the research included weather conditions, time of day, and season, so that the results could be compared for different naturally occurring conditions throughout the year. The observation sheet on the current behavior of drivers approaching pedestrian crossings concerned the recording of information on whether the driver slowed down, accelerated, or maintained a constant speed while crossing the pedestrian crossing. This was followed by information regarding the driver's use of any kind of distraction or performing undesirable activities while driving. These behaviors included talking on the phone, using the phone for activities other than talking, which raises some theories regarding cell phone use [
30]. This was followed by using a screen in the vehicle, talking to another passenger, looking around while approaching a pedestrian crossing, eating or drinking, smoking tobacco products, or performing other unspecified activities in the vehicle that may increase the risk of a traffic accident. The process of classification into gender and age groups of drivers was determined in accordance with official statistics published by the Police Headquarters. Subsequently, statistical tests were performed on the collected data on the occurrence of accidents at pedestrian crossings. These analyses involved the determination of 100 accident situations, the so-called black spots. The analysis consisted of selecting accident sites from various places in the country, divided into provinces with the highest and lowest number of accidents at pedestrian crossings, then the Silesian province was also included in this group, as well as individual sites from across the country with the highest number of accidents at pedestrian crossings nationwide. After determining the most sensitive places from the point of view of traffic safety in relation to vulnerable traffic participants, an extensive analysis was carried out in the places where the accidents in question took place, with a description of the events in the traffic accident database as a confirmation of authenticity. The analysis dealt directly with the places where the incidents in question took place. It described possible causes related to the traffic situation. Since the information on the direct cause of traffic accidents is secret, as it is based on witness statements or the perpetrators directly, it is not possible to determine the direct cause of a traffic accident, so by performing an analysis of the sites, it is possible to identify recurring elements of the pedestrian crossing infrastructure that can affect the occurrence of an incident. It is in this way that determinants related to infrastructure safety of pedestrian crossings were identified. Then, with reference to the secrecy of the direct causes of accidents, an extensive survey was conducted related to the direct perpetrators of traffic accidents. The survey included a series of questions related to the causes of traffic incidents. The survey, performed anonymously, approximates the picture associated with elements that can affect the occurrence of a traffic accident hence the results were used to extract a group of scenarios associated with possible dangerous situations at pedestrian crossings.
4.5. Configuration of the Set of Recorded Data
Configuration of the set of recorded data from the measurement apparatus is a process that should be determined at the research planning stage. Configuration of the simulator in the right way according to the assumptions of the research process is crucial. Because, when formulating the assumptions, it may turn out that the main research problems cannot be studied due to the limitations of the apparatus that will be used for the research. Equipment limitations determine whether a research unit will be considered for selection in the market research process. In the context of driving simulator research in Poland, there is a very narrow group of research units capable of conducting advanced research programs, which limits the freedom to conduct this type of research on a large scale, thus making it very specialized research, also due to the limited number of specialists with expertise in this area.
At this stage, it is very important to define and group driver reactions and behaviors in detail, and to determine the parameters that characterize them. For example, reactions and post-perceptions. The control and measurement apparatus consists of a great many sensors that record specific signals. It is difficult to design and manufacture a system that will directly measure reaction or perception. Currently, such measurements can, admittedly, be implemented almost directly using machine learning methods. The use of artificial intelligence algorithms that can classify behavior on the basis of recorded signals is becoming more and more common, but still depends on the decisions of the neural network, which we do not always have influence on as operators of such a system. Another approach is to try to define groups of behaviors or perceptions based on available measurement signals, such as the timing of brake application or saccadic movements or gaze fixation. In this way, by con-figuring the measurement system accordingly, we are able to record indirect data such as behaviors and perceptions using other directly recorded signals. Often this stage of research is carried out in "post processing" at the results analysis stage.
4.6. Research Ethics
Ethical and safety risks associated with conducting simulator surveys are key to ensuring, among other things, the anonymity of those taking part in simulator surveys. Individuals taking part in this type of research must be aware that their data will not be disseminated in an uncontrolled manner, and hence, in order to maintain ethics, it is not advisable to ask broadly sensitive questions of individual participants when conducting surveys. It is also crucial to ensure safety, subjects must not be exposed to the dangers of possible consequences associated with malfunctioning mechanical devices, the driving simulator cab is equipped with a number of actuators responsible for changing the position of the vehicle cab during driving to properly replicate the sensation of driving a conventional motor vehicle. Of course, any mechanical device can be a potential danger to health or life, so participants must be informed of the potential dangers before the research. However, there is also talk of other specialized devices being used for this type of research. Hence, when recruiting participants for the study, an extensive interview relating to the individual's health situation is carried out, with the consent of the subjects themselves, of course. This is solely related to the risks that may take place during the research process associated with the use of the driving simulator. Among other things, it is from the health angle that the recruitment of participants is carried out, but also in terms of the research assumptions of the study itself, with regard to age, gender, as well as such parameters as visual defect.
4.7. Participant Training
Before starting the process of taking measurements on the driving simulator, a detailed training is performed related to the transfer of all the necessary information for participants from the operation of the simulator, of course, it is also necessary to generally present the scope of the test itself, what it will consist of, but without major details that may affect the decisions made during the test itself. The training is more about making the person taking part in the study feel comfortable while driving on the simulator, and what is important that they understand what tasks they have to perform, the aspect of understanding the idea itself and the correct approach to the tasks performed is key, because it often happens that people have not properly assimilated the knowledge during training, but when asked about understanding they are not able to deny it, even though their knowledge of the procedure itself is incomplete, so it is worthwhile to perform a preliminary study, which will indicate the idea of the study without pointing out aspects relevant to the research objectives. This will make full use of the research participants time and eliminate potential inappropriate measurements that will have to be discarded during the analysis, and considering the financial aspect, it is recommended to take full advantage of the research opportunities. After the several-step preparatory process contained in the pre-subject article, once the research process proper has begun, it is important to implement the research according to a pre-developed scenario in order to maintain consistency of post-testing. Based on the data recorded by the equipment installed in and outside the vehicle, it is also worthwhile to conduct an independent external analysis, record observations and unusual behavior for particular situations, recorded during subsequent trips made by the test participants, they will be a kind of supplement to the knowledge gained through the measurement equipment on the vehicle. The process of conducting the actual tests is followed by the process of analyzing the data, along with the interpretation of the obtained results. These involve carrying out statistical and other identical analysis in accordance with the initial assumptions before the start of the research, interpretation and inference of the obtained results will take place in the context of the set research objectives.
Once the research process is completed, it is important to prepare complete, comprehensive analyses that relate directly to all the steps preceding the ba-research process. The publication of the obtained results provides an opportunity to expand the knowledge of the ba-research team, but also of those conducting scientific activities in the given subject area. When preparing for research, one of the aforementioned indispensable elements is a review of the literature in a given research field, updating the knowledge in a given field will contribute to progress and avoid duplication of individual often very costly research processes [
33].
4.8. Research Process
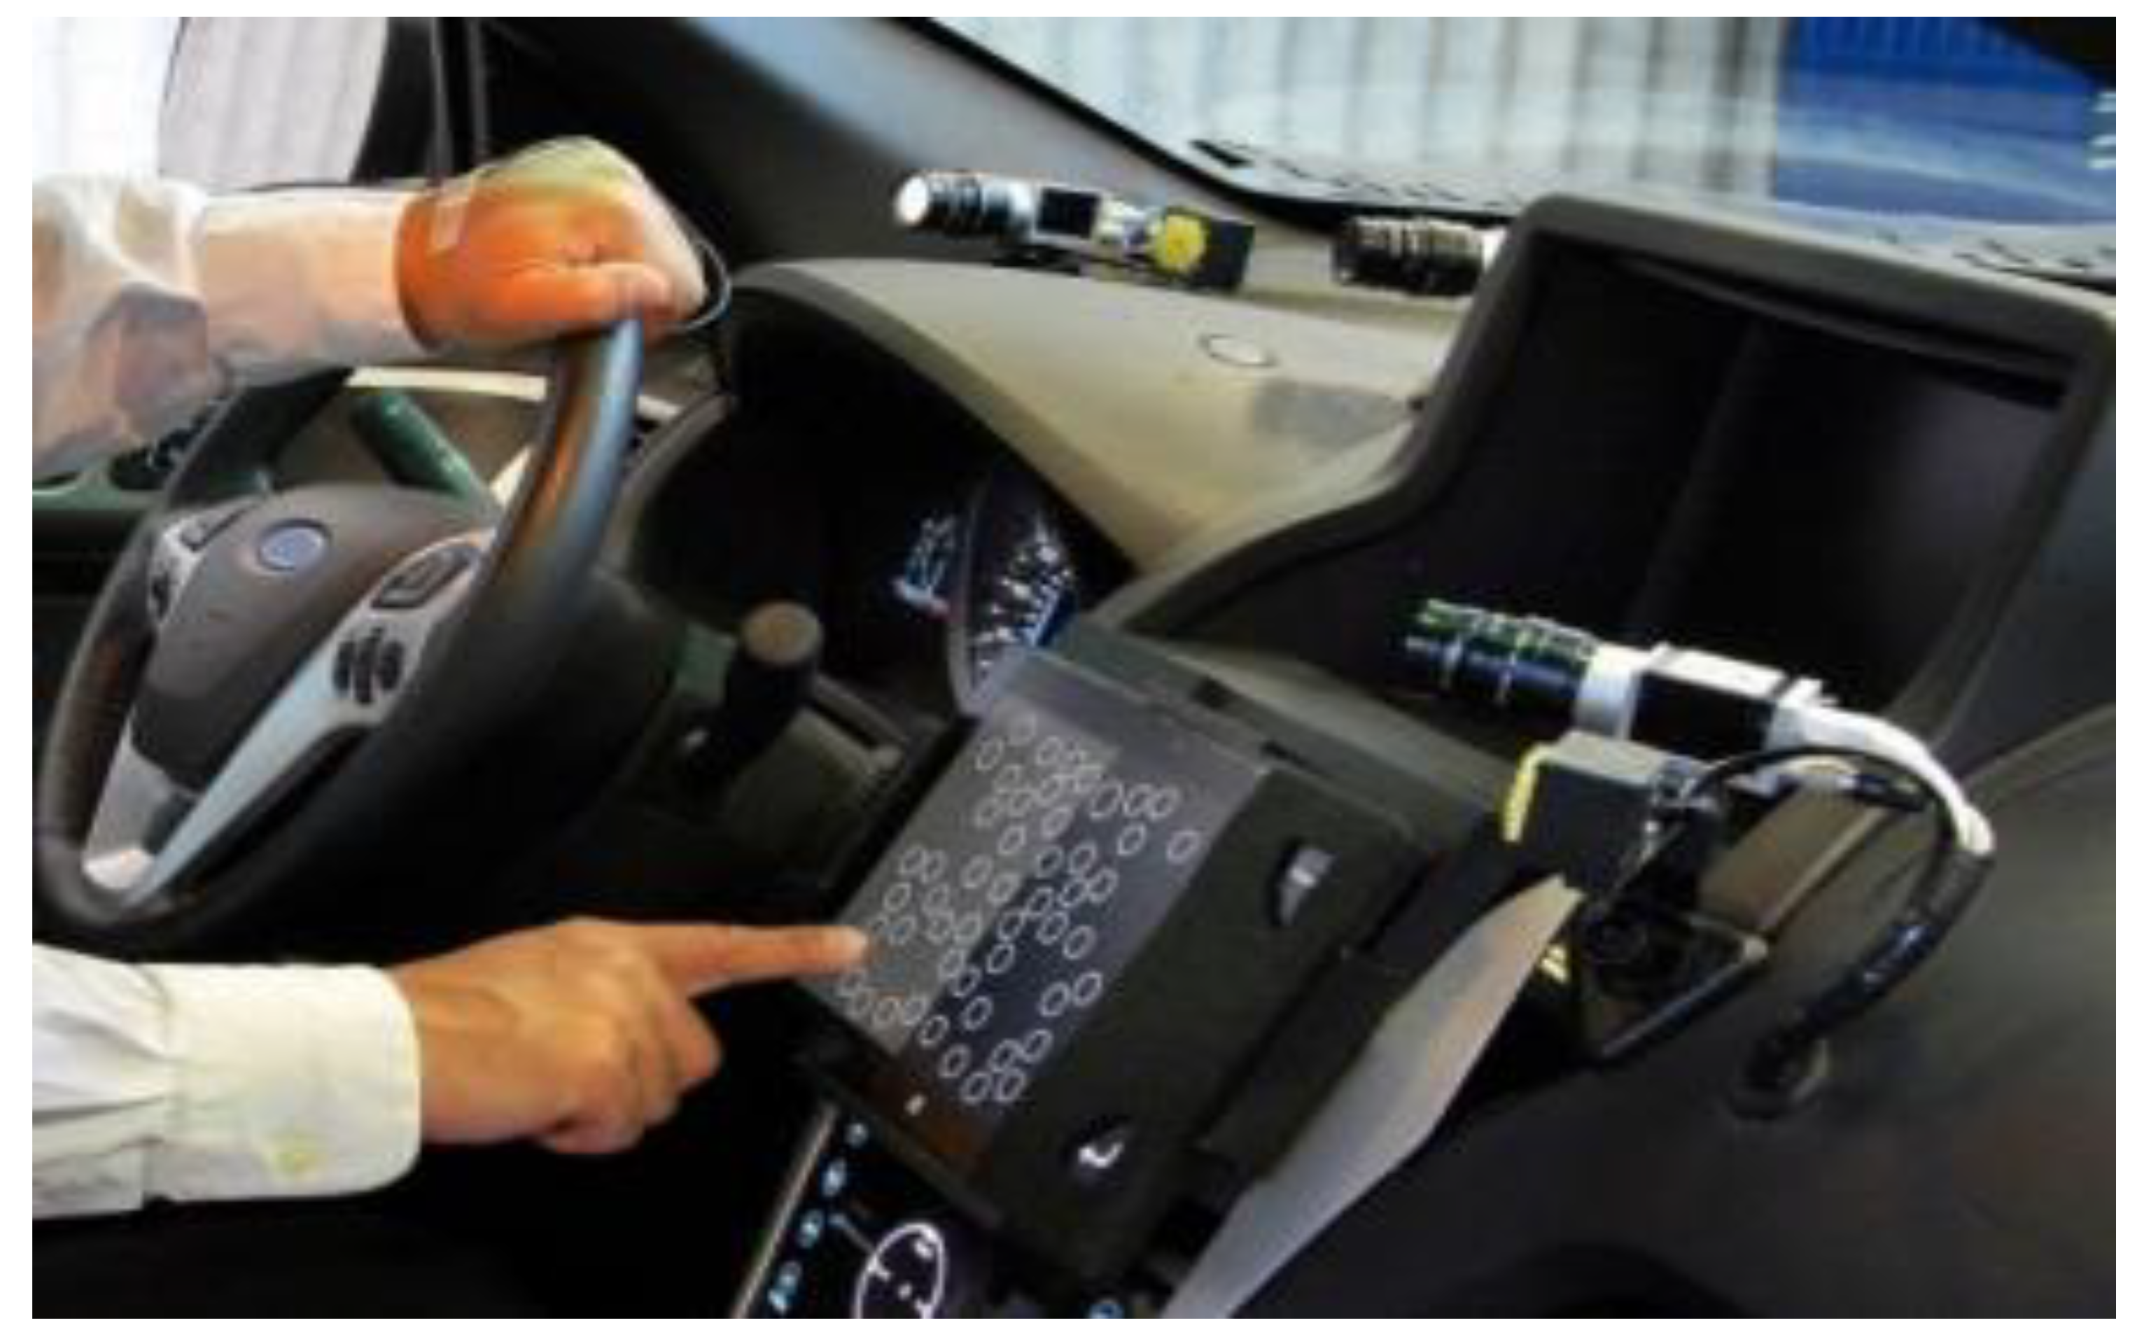
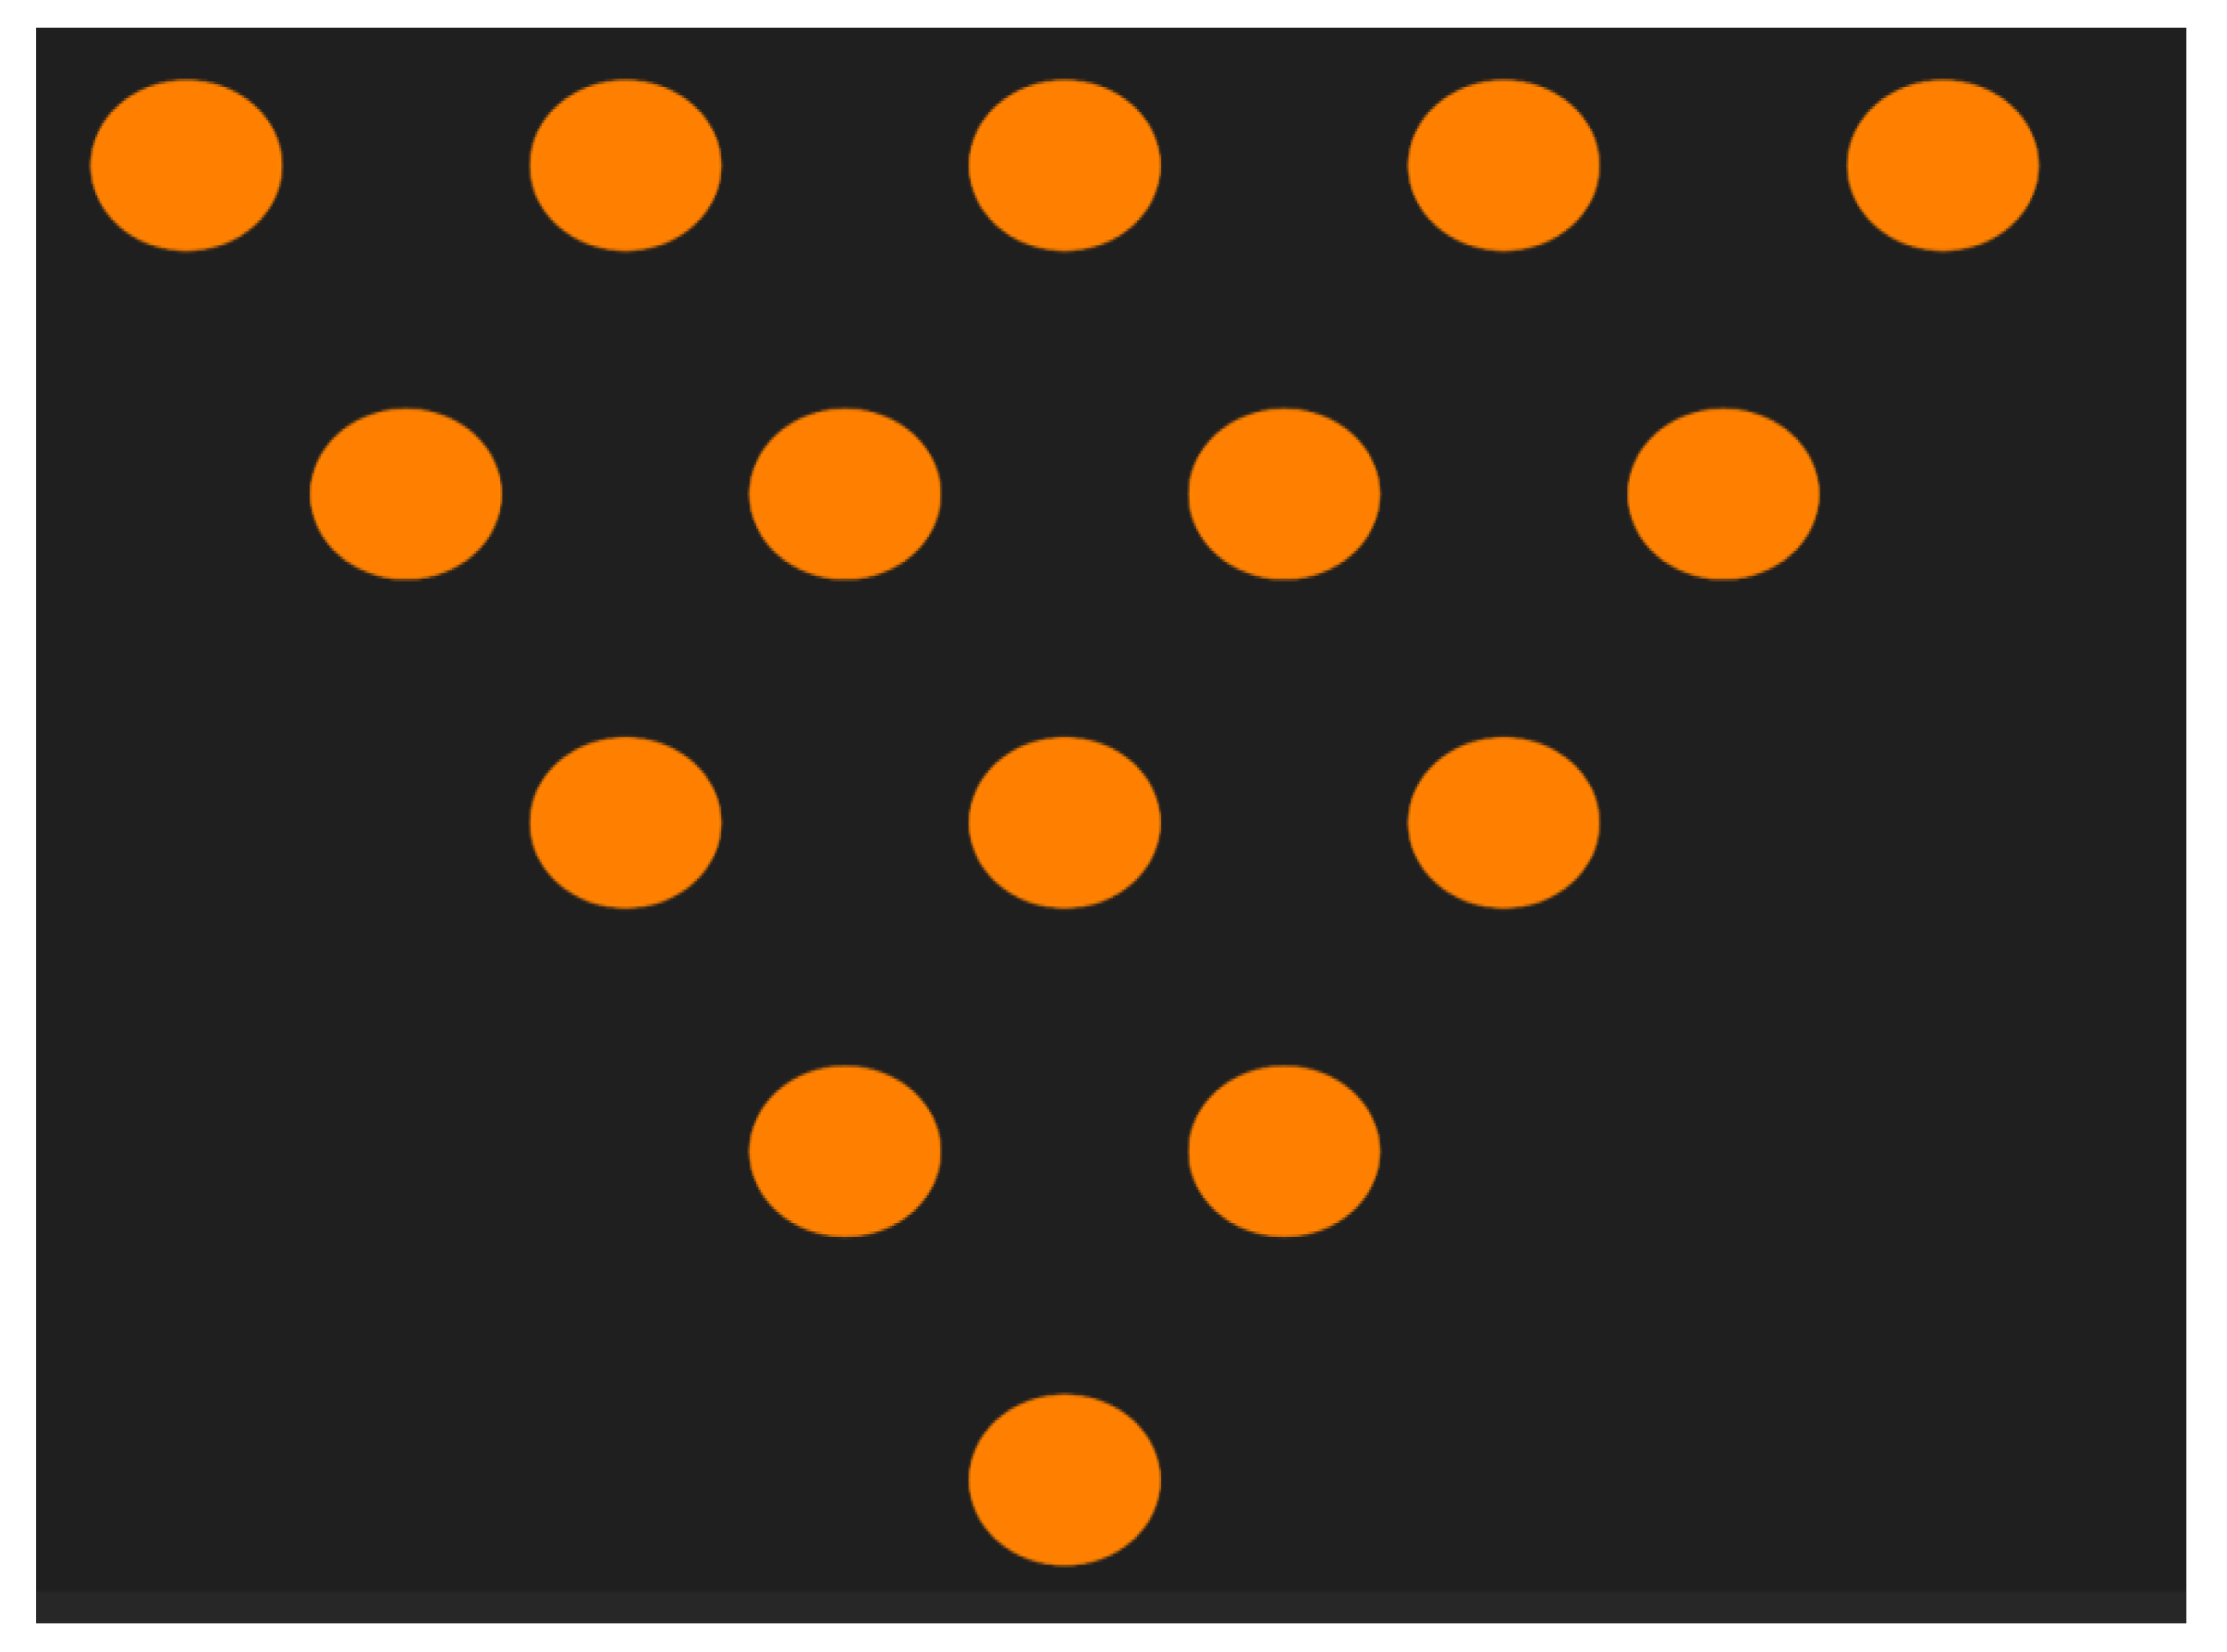
One of the objectives of the research was to analyze the impact of internal and external attentional distractors, which strongly affect the process of perception of essential information, i.e. the traffic scene and the level of concentration of drivers. We embarked on a simulator study, one of the goals of which was to obtain information on the perceptibility and behavioral evaluation of drivers when they were presented with implemented pseudo-random distractors such as N-back and SURT tasks. These tasks affect the ability to focus on the activity at hand and can significantly affect the results of the study. The N-back task involves verbally repeating a sequence of numbers, in sequence read by a recorded voice. In the 0-back condition, the participant had to repeat the last number in the sequence; in the 1-back condition, the participant repeated the penultimate number. The SuRT test is a test depending on the level of difficulty involving the participant in a significant way, this task involves pointing at a tablet mounted in the simulator, on the right side of the driver at the level of the function panel in the vehicle. The participant is asked to point to the circle with the largest diameter when a group of circles appears on the tablet screen, the participant is not immediately informed whether the circle he pointed to is the correct one, the results are analyzed only after the test is completed, depending on the level the difference between the circles changes, which makes it significantly more difficult for the tester to point to the circle with the largest diameter and requires him to be more involved in the test, which is associated with the risks of driving behavior.
Figure 5.
Overview photo for the SuRT task [
34].
Figure 5.
Overview photo for the SuRT task [
34].
Figure 6.
Overview photo of the SuRT task [
34].
Figure 6.
Overview photo of the SuRT task [
34].
4.9. Research Method Validation
In a study with an experimental scheme, 30 drivers are planned to participate, including 15 men and 15 women. The prerequisites for participation are possession of a cat B driver's license and active participation in traffic for at least half a year. The respondents will be divided into two research groups based on age (young people - under 45 years old, older people - over 45 years old). Remuneration is expected for participation in the study. The research experiment will be conducted according to the scheme shown in
Figure 1. The study is to be individual-dual in nature. In preparation for the study, drivers will be required to sign a consent form and a statement that they are familiar with the possible consequences of taking part in research using driving simulators [
34]. Participants will then complete the first SSQ questionnaire (SSQ1) and begin an adaptive driving session.
Figure 7.
Calibration process of the car simulator (own picture).
Figure 7.
Calibration process of the car simulator (own picture).
Figure 8.
Calibration process, preparation to the adaptation drive (own picture).
Figure 8.
Calibration process, preparation to the adaptation drive (own picture).
It was decided to use a scenario in which the participants have to drive about 10 km of the route, which initially runs on a highway, then on a suburban road, and for a small section also on local buildings. The adaptation will make it possible to get used to controlling a simulated vehicle. It is also aimed at eliminating particularly sensitive individuals, who are experiencing symptoms of simulator sickness [
34].
Figure 9.
Diagram of the research procedure used in the planned study of the effects of experimental labeling and cognitive load on the driver (own elaboration).
Figure 9.
Diagram of the research procedure used in the planned study of the effects of experimental labeling and cognitive load on the driver (own elaboration).
The adaptive driving will be followed by a test proper, consisting of three runs and two training runs of a secondary task. The experiment is planned to include three test scenarios (3 runs of each test subject), including one run without distractors (in scenario one) and two runs in which the driver will perform additional tasks during the run: n-back or SURT (in scenarios two and three) [
35]. The main task in all three experimental runs is to drive along a specially designed section of the route and respond to experimental signage informing pedestrians of pedestrian crossings and other vulnerable road users (NURD) [
36]. Each scenario used areas with different landscape characteristics:
-urban development,
-suburban development,
-an area with sparse development,
-forest area,
-an area without development.
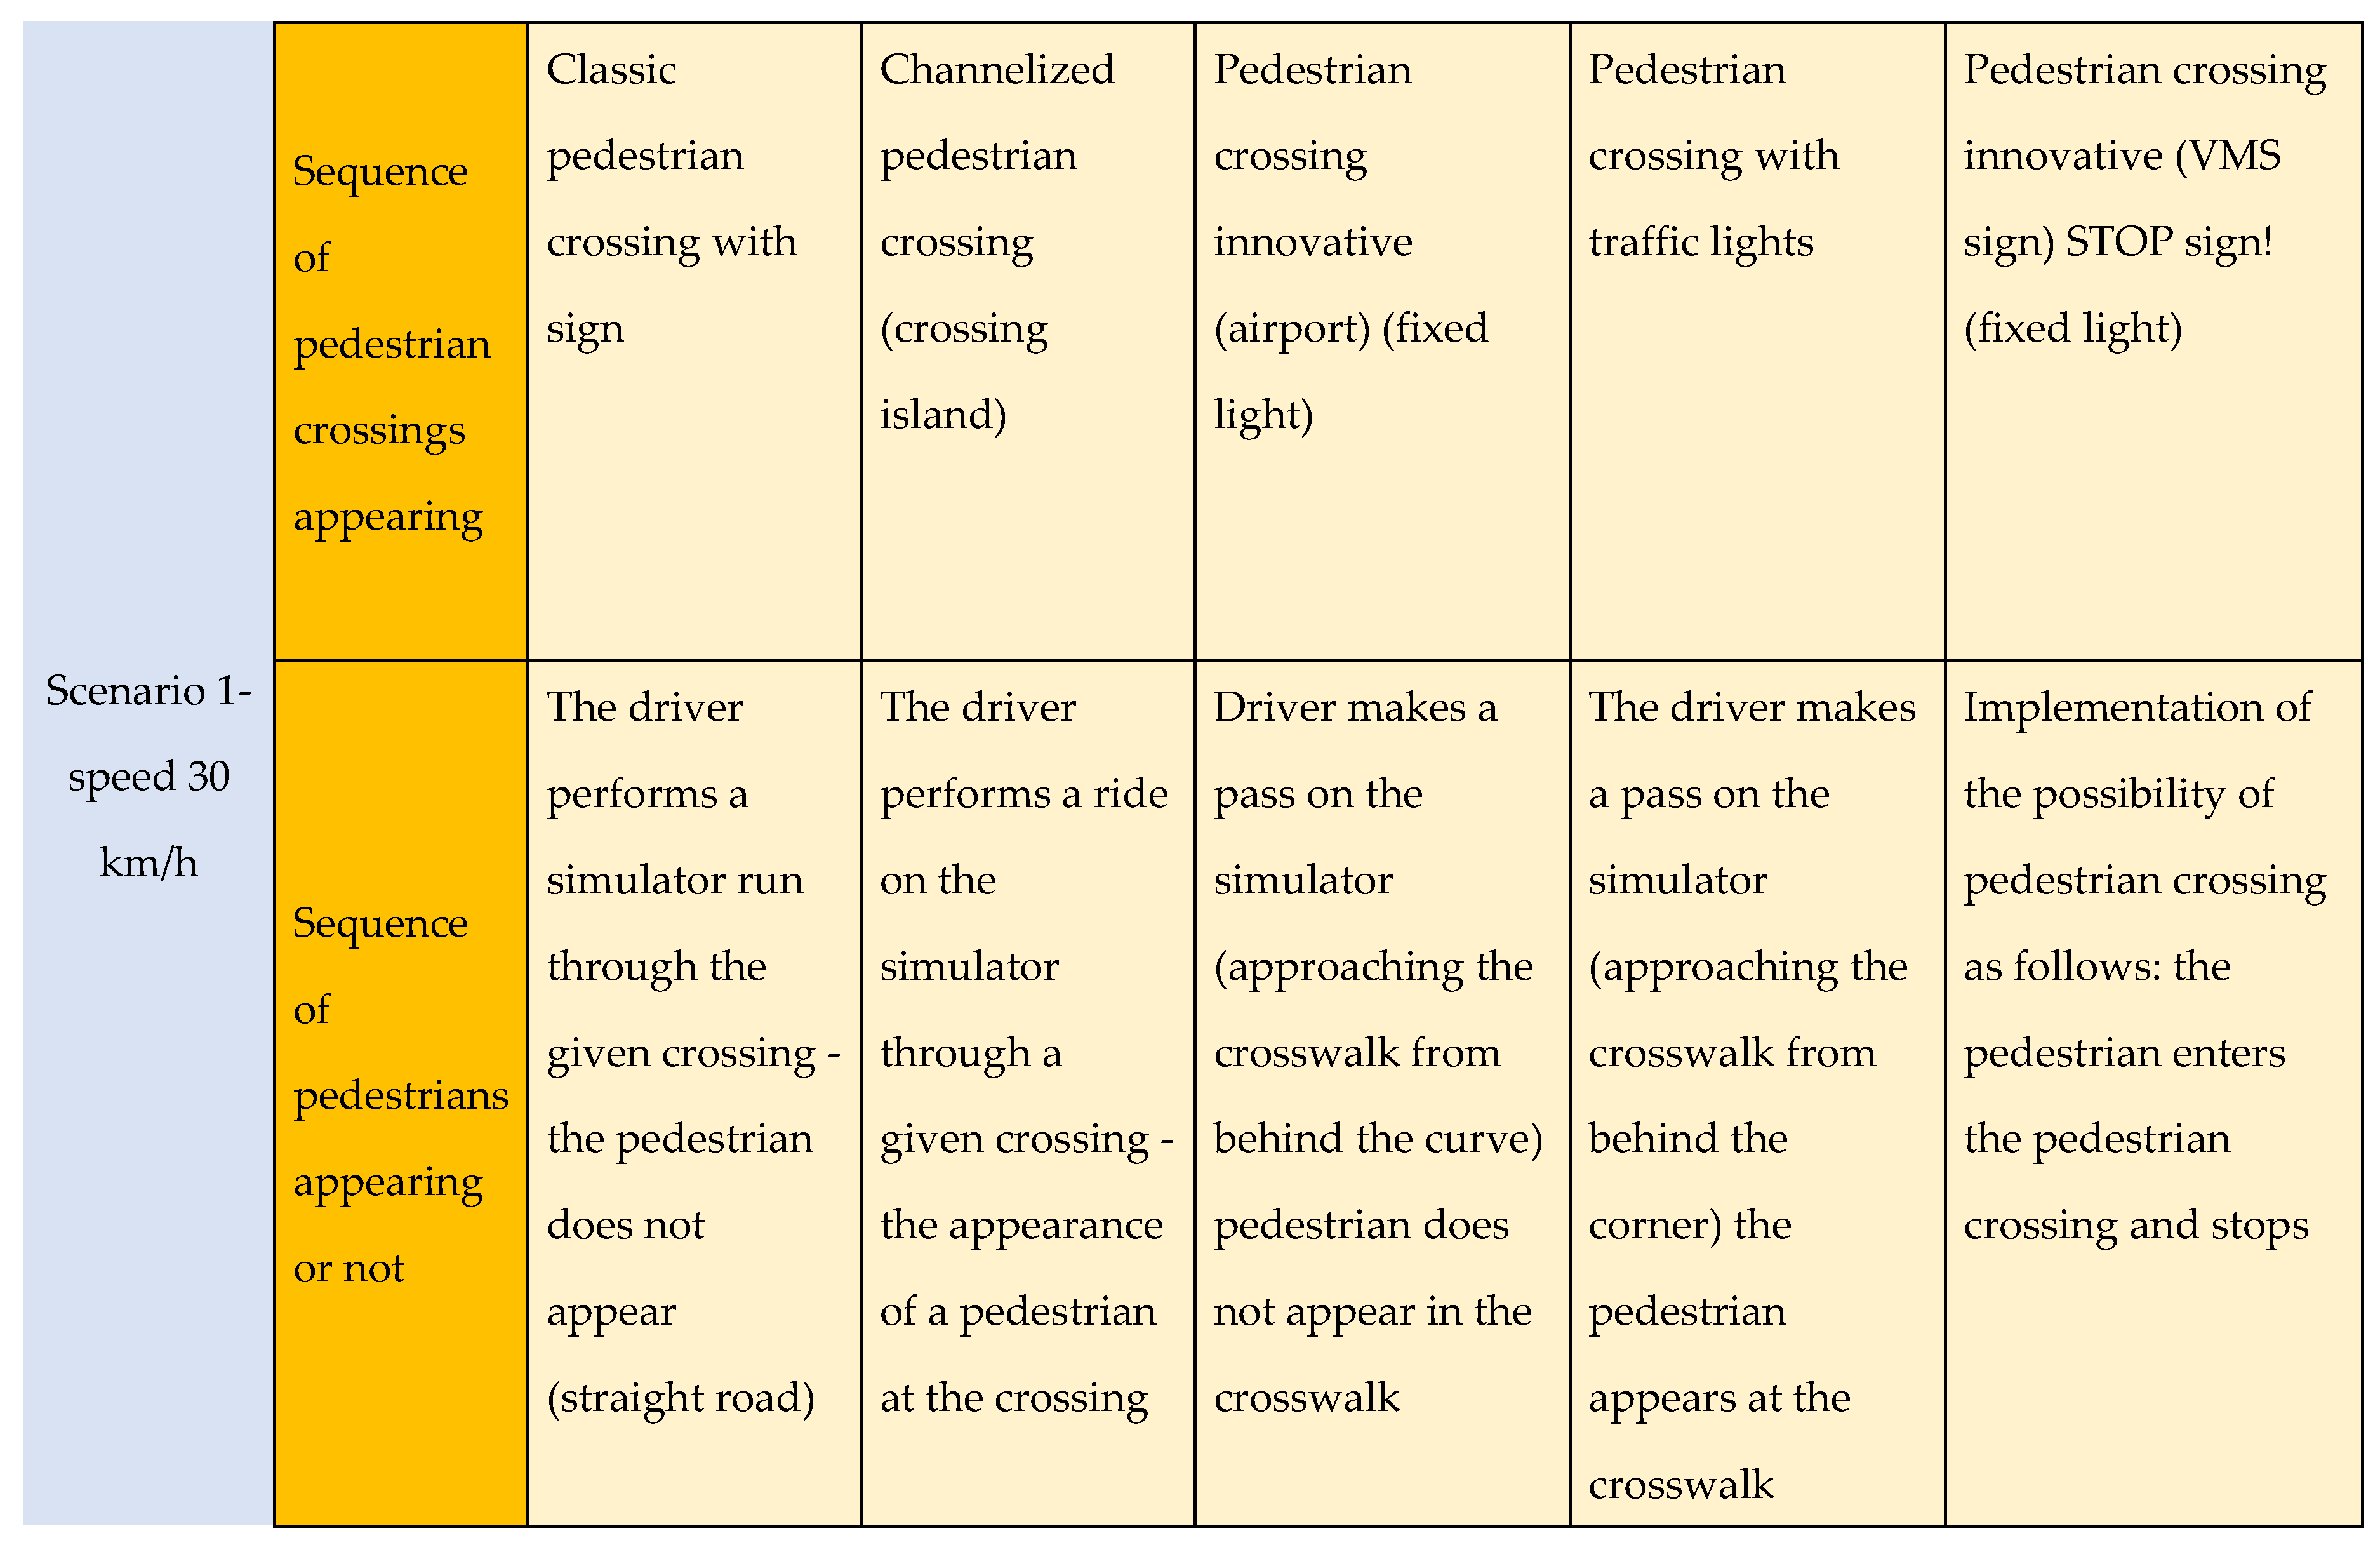
In each of the above-mentioned areas, study drivers will encounter four pedestrian crossings. A total of twenty crosswalks were designed in each research scenario. Seven variants of signage were used to mark the location for pedestrian crossings, including a combination of current and experimental signage [
34]. The variants used are described below:
Variant 1: sign D-6 "pedestrian crossing",
Variant 2: sign D-6 "pedestrian crossing" and horizontal sign "airport" in the form of a permanent light signal,
Variant 3: sign D-6 "pedestrian crossing" and horizontal sign "airport" in the form of a flashing light signal,
Variant 4: sign D-6 "pedestrian crossing" and variable message sign (VMS) "STOP" in the form of a solid light signal,
Variant 5: sign D-6 "pedestrian crossing" and variable message sign (VMS) "STOP" in the form of a flashing light signal,
Variant 6: sign D-6 "pedestrian crossing" and variable content sign (VMS) "pictogram" in the form of a solid light signal,
Variant 7: a D-6 "pedestrian crossing" sign and a variable content sign (VMS) "pictogram" in the form of a flashing light signal.
For half the length of each of the above-mentioned areas, a lane for cyclists will be designated on both sides of the roadway. Half of the crossings in each area will be accompanied by a bicycle crossing, so in these areas the D-6 "pedestrian crossing" sign will be appropriately replaced by the D-6b "pedestrian crossing and bicycle crossing" sign.
At the crossings, study participants will encounter six traffic situations involving NURD:
- a pedestrian walking normally,
- a pedestrian who, after entering the crossing, stops and turns around,
- a pedestrian who, after stepping into the crosswalk, stops and continues walking,
- a pedestrian running across a crosswalk,
- a pedestrian in an inebriated state (varying speed and angle relative to the crosswalk),
- a cyclist crossing a bicycle crossing.
In each scenario, vulnerable road users will always enter the pedestrian crossing from the right side. Randomization of the order of appearance of NURD and the direction of travel was performed.
Two speed-adjusted layouts of the same road were designed, differing in the spacing between pedestrian crossings. Test subjects at the beginning of each of the three experimental crossings will be asked to maintain speed: 30, 50, 70 or 90 km/h. Each participant will take one slow route (at 30 or 50 km/h), one fast route (at 70 or 90 km/h). For the third run, subjects will be assigned pseudo-randomly, taking either the slow or fast route.
In scenarios 2 and 3, in addition to the main task, test drivers will be asked to perform an additional task. The experimental drive is designed in two variants (i.e., with two types of distractors: the N-back task or the SURT task. The test subjects will be randomly assigned to one of two groups, each of which will drive through the scenario performing a different task first. The study ride with the additional task will precede the task training.
The additional task is designed to induce cognitive load by engaging the driver's working (short-term) memory. In both tasks, less complex versions of the task are performed first, and then the level of difficulty is increased. The first task that was decided to be used in this study was the delayed digit recall task, or auditory-vocal task, developed on the basis of the work of [
34]. It involves listening to strings of numbers and recalling the number heard n(0-2) numbers backwards. This task has three levels of difficulty (0-back, 1-back and 2-back). For the 0-back task, the participant must recall the last number heard. For the 1-back task, the participant recalls the penultimate heard number out of the 10 heard. The last version of the task is the 2-back task. It means that each time the speaker reads a list containing 10 numbers, the subject's task is to repeat out loud the number that was said third from the end. For example, if the digit 7 was spoken, then 4, and finally 5, the subject should say only the digit 7. For the purposes of this study, it was decided to use the 1-back version of the task [
37].
The second additional task to be used in the present experiment is the SURT task. This is a visual-manual task [
37]. It involves searching the touch device for the correct circle (the largest one) among a dozen circles appearing on the screen. For the SURT task, a touchscreen tablet placed in the central part of the driver's desktop will be used. The location of the tablet has been determined so that it is in the peripheral field of vision, outside of the driver's acute vision and doe vision [
37].
At the end of the study, a separate questionnaire will be used to directly evaluate the experimental signs implemented in the scenarios.
Figure 10.
An example table containing the piece of the sequence of emerging route elements (own elaboration).
Figure 10.
An example table containing the piece of the sequence of emerging route elements (own elaboration).
4.8. Alternative Markings for Pedestrian Crossings without Traffic Lights
In addition to the use of the classic method of marking pedestrian crossings along with the use of conventional traffic signs informing the driver of the situation in which he is in the vicinity of a pedestrian crossing, example developed alter-native signs were also used. During the execution of the crossing procedure according to the selected driving scenario, 3 types of alternative signage were also implemented, two of which were mounted analogously to conventional vertical signs, where VMS variable content signs were used for their implementation. These signs were presented to the people taking part in the study in different ways, either as fixed signage or with variable frequency of appearance of information on the variable content sign, the inscription and pictogram were used here. In addition, the possibility of implementing an alternative sign directly on the roadway was also used, the idea being to inform about the fact of approaching the subject pedestrian crossing without signaling depending on the distance at which the driver was. Below are presented conceptual graphics of each solution.
Figure 11.
Alternative sign "airstrip" implemented in the transit scenario (in-house development).
Figure 11.
Alternative sign "airstrip" implemented in the transit scenario (in-house development).
Figure 12.
Alternative sign "pictogram" implemented in the transit scenario (in-house development).
Figure 12.
Alternative sign "pictogram" implemented in the transit scenario (in-house development).
Figure 13.
Alternative sign "pictogram" implemented in the transit scenario (in-house development).
Figure 13.
Alternative sign "pictogram" implemented in the transit scenario (in-house development).
4.9. Additional Surveyed Questions
During the conducted research, in addition to the basic metric required during simulator research related to health predisposition for this type of research, a separate one was added concerning direct evaluation of sign implementation, this survey will be used to compare the results of simulator research with the direct evaluation of research participants, below are presented sample questions planned for use:
- In your opinion, was the pictogram or the lettering more legible during the study?
- Which of the pictograms and inscriptions presented is the most understandable to you?
- Were there any elements along the route that were confusing to you in some way during the ride? If "yes", please specify which ones, if "no" please skip the question.
- In your opinion, did the signs that appeared guarantee sufficient time to react in a situation where a pedestrian appeared at a pedestrian crossing? If "no" please justify why, if "yes" please skip the question.
- In your opinion, what did the light signs built into the roadway mean?
- Is the sensation of driving in the simulator in your case comparable to driving a con-conventional vehicle in normal traffic?
- In your opinion, is the placement of variable message signs (pictograms and lettering) on the screen on the right side of the road optimal and does not cause discomfort when reading the intent of the sign? If "no" please justify why, if "yes" please skip the question.
- Which of the signs was visually "better" for you to perceive?
- Which of the signs was more difficult for you to understand and required more attention?
- Which of the signs shown do you think could be used in front of a pedestrian crossing? (you can mark more than one answer)
- Were any of the behaviors of pedestrians or cyclists surprising to you? If "yes" please justify which ones, if "no" please skip the question.
- How long have you held your driver's license?
- How many kilometers on average do you drive per year as a driver?
- Are you a professional driver?
- Have you been fined for speeding in the last 5 years?
- Do you have a visual impairment?

