Preprint
Article

Microplastic Contamination in Commercial Insect Meal: A Valid Analytical Method to Detect It

Submitted:

20 March 2024

Posted:

20 March 2024

You are already at the latest version

A peer-reviewed article of this preprint also exists.

Abstract
Background. Escalating global plastic production, expected to reach 34,000 million tons by 2050, poses a significant threat to human and environmental well-being, particularly in aquatic ecosystems. Microplastics (MP) and nanoplastics (NP), which originate from the degradation of plastics, are of concern due to their potential bioaccumulation and uptake of pollutants. This study addresses identification methods and focuses on insect meal, a raw material for aquaculture feed. Methods. By using different techniques, the study was able to detect MP and NP in insect meal samples. Chemical digestion with KOH at 60°C efficiently removed organic matter without affecting the synthetic polymer polyethylene (PE). Filtration, confocal Raman microscopy, SEM and TEM were used for comprehensive analysis and integrity tests on PE films were performed using Raman and FTIR spectroscopy. The results showed the presence of PE microplastic particles in the insect meal, which was confirmed by correlative Raman and SEM mapping on a positively charged surface. In addition, the increased resolution of the Raman microscope identified submicrometric PE NP (800 nm). Transmission electron microscopy (TEM) with energy dispersive X-ray spectroscopy (EDX) confirmed plastic-like structures in the insect meal, highlighting the presence of PE plastics characterized by irregular shapes and some agglomeration. The higher carbon concentration in the EDX analysis supported the plastic nature, which was also confirmed by Raman spectroscopy. Conclusions. The study provides a robust method for the detection of MP and NP in insect meal and provides valuable insight into the possible presence of plastics in insect-based aquafeeds. The combination of different analytical methods increases the reliability of the results and sets the stage for future investigations that could focus on the quantification of NP and the assessment of their potential environmental impact.
Keywords: 
Subject: 
Biology and Life Sciences  -   Animal Science, Veterinary Science and Zoology

1. Introduction

Global plastics production amounted to 359 million tons in 2018 and is estimated to increase to 34,000 million tons by 2050 [1]. Plastics are a large class of synthetic or semi-synthetic organic polymers with a high molecular weight. The most commonly produced polymers are polyethylene (PE), polypropylene (PP) and polystyrene (PS), which are also among the most common plastics polluting the aquatic environment [2]. Plastic pollution is now considered the greatest threat to human and environmental health, especially to the aquatic environment in which they accumulate [3,4]. The risk is exacerbated by the progressive fragmentation of these plastic wastes in the environmental media caused by physical, chemical, and biological processes or a combination of these processes, such as thermal degradation, oxidative degradation, hydrolysis, biodegradation, UV photodegradation, corrosion, and mechanical abrasion [5,6].
Microplastics (MP) are defined as plastic particles with a diameter of 1μm to 1 mm, while nanoplastics (NP) have a size of 1-1000 nm [7], although the definition of the term NP is still controversial. Based on the source of origin, MP are categorized into primary MP, which are intentionally produced for specific commercial purposes, and secondary MP, which result from the decomposition of larger plastic parts. The latter are predominant in the environment and make up about 80% of the plastic waste found [8]. Secondary MP are ubiquitous in aquatic and terrestrial environments [9,10] and tend to be irregular in size, shape and composition, contributing to an increased potential risk to organisms.
The risks posed by MP and their nanoscale forms include their bioaccumulation along the food chain [11], and their ability to absorb and concentrate hydrophobic chemical pollutants, such as pesticides or pharmaceuticals [12,13,14]. In aquatic vertebrates, MP accumulate mainly in the digestive system and cause various adverse effects such as gastrointestinal (GI) tract damage, alterations in lipid metabolism, behavioural changes, cytotoxicity, and dysbiosis [15,16,17,18,19,20,21,22]. In addition, the transfer of MP from feed to liver and fillet has been described in two of the most important commercial marine fish species for the Mediterranean region, namely gilthead sea bream (Sparus aurata) [23], and European sea bass (Dicentrarchus labrax) [24].
As a possible negative impact on the safety of seafood and a potential risk to human health cannot be excluded, the identification of MP is becoming an increasingly important issue for consumer health. The official EU limit for plastics in animal feed is zero, although many countries actually work with 0.15%. On the other hand, the European Food Safety Authority (EFSA) has acknowledged that there is no legislation for MP and NP as contaminants in food and that reliable identification methods need to be developed, especially for smaller MP that re more likely to cross the intestinal barrier.
The status of currently applied identification and quantification methods for MP and NP has been reported in several reviews [1,25,26,27,28,29] and a new analytical method for NP in complex matrices rich in organic material has been developed [30].
There are currently no uniform standard methods for the characterization and detection of MP. An analytical protocol for the detection and characterization of MPs and NPs usually requires three main steps: extraction from the matrix, separation, quantification and sizing, characterization and/or identification of plastic particles [1,26,31].
Raman and Fourier transform infrared spectroscopy (FTIR) are the most commonly used techniques to identify plastic particles in studies on microplastics. Both techniques have the advantage that they are non-destructive and require only a small amount of sample. However, compared to FTIR spectroscopy, Raman techniques have higher resolution (up to 1 µm, while FTIR resolution is 10-20 µm), broader spectral coverage, higher sensitivity to non-polar functional groups, lower water interference and narrower spectral bands. In combination with a microscope, micro-Raman spectroscopy (µ-Raman) can characterize MP in the 1–10 µm size range that are otherwise undetectable with FTIR [1,27]. On the other hand, the detection time with Raman imaging is significantly higher than with FTIR imaging.
Recently, a novel approach to isolate NPs from mussels and subsequent sampling by µ-Raman analysis has proven successful [30]. Instead, rapid qualitative discrimination between polymers, metals and inorganic particles at the nanoscale could be performed using a scanning electron microscope (SEM) or transmission electron microscopy (TEM) in combination with energy-dispersive X-ray spectroscopy (EDX) [32].
There is very recent evidence of microplastics in raw materials used to produce fish feed [33]. For example, Thiele and colleagues [34] found MP contamination in commercial samples of fishmeal, a product of bycatch or by-products of marine fisheries. Fishmeal is a highly valued nutrient source used as a raw material for the production of feed for farmed terrestrial and aquatic animals, including fish and shrimp. In fact, about 70% of the demand for fishmeal currently comes from aquaculture, which supplies nearly 50% of the seafood consumed by humans.
However, most wild catches are at or above the maximum sustainable yield. As a result, aquaculture can no longer rely on marine resources to produce fish feed, and such feed options are simply not sustainable. To avert ecological damage and cover rising costs, fish farmers and commercial feed manufacturers have made significant efforts to reduce the amount of fishmeal in aquaculture feed by replacing it with other protein sources. In this respect, insects could become a major player in the fish feed market, and insect larvae meal could become a sustainable and commercially viable alternative to fishmeal in aquaculture. In particular, the black soldier fly, Hermetia illucens, has emerged as one of the most promising insect species that can be used in aqua feeds as an alternative protein source to replace fishmeal, as the meal of H. illucens is rich in proteins (45–75% dry matter), essential amino acids, lipids, minerals, and vitamins [35,36,37,38,39].
The insect farming industry can be seen as a model for the circular economy as commonly available organic waste, mainly agricultural and food waste, is successfully used on an industrial scale to produce BSF larvae. However, as Regulation (EC) No 1069/20093 stipulates that insect kept in the EU for food, feed or other purposes are "farmed animals", it is prohibited to feed insects with faeces or separated contents of the digestive tract, manure or food waste and processed animal proteins, with the exception of fishmeal (Regulation (EC) No 767/2009 and No 999/2001). Considering that insect farming is a regenerative system, where the by-products of one process serve as raw material for another process, and in perfect accordance with the circular economy model, we can assume that MP and NP enter the feed chain and eventually return to our diet through the consumption of fish.
In the present work, we demonstrate a method for the detection and identification of MP and NP in a commercial raw material, such as H. illucens insect larvae meal, used for the production of aqua feed. To our knowledge, this matrix has not yet been investigated in any study. To evaluate the presence of plastics in insect meal, µ-Raman electron microscopy (SEM, TEM) was used for the detection of MP and NP in complex matrices according to our previously proposed analytical protocol [30,40].

2. Materials and Methods

2.1. Chemical Digestion with KOH

An aliquot (0.5 g) of commercially available insect meal was digested overnight with 10 ml of 10% KOH (w/vol) at 60°C with mechanical shaking in 15 ml conical glass centrifuge tubes. The digested samples were stored at 4°C until the planned analyses.

2.2. Filtration of Sample

The scheme for the detection of “small” MP and NP in insect meal samples is shown in Figure 1.
One milliliter of the digested sample was diluted 1:1 in MilliQ water. Two consecutive vacuum filtration steps were performed on 25 mm diameter polycarbonate filter membranes (Whatman® Nuclepore™ Track-Etched membranes). The first filtration was performed with a filter pore size of 12 μm. The eluate was then collected and filtered again on a filter with a pore size of 2 μm. After washing with 1 ml MilliQ water, the filter and filtrate (approximately 2 ml) were stored at +4°C until analysis. In parallel, 1 ml of MilliQ water was filtered as a negative control.

2.3. Confocal Raman Microscopy (CRM) Analysis of 2-12 µm Plastic Fraction

The filters were analyzed with the inViaTM Confocal Raman microscope (Renishaw). Objects were recognized by manual point-by-point mapping. The optimization of the Raman signal was set as follows: 1 s, 10% laser, 10 accumulations, range 1700-3000 cm-1. An extended analysis of the spectrum (200-3500 cm-1) was performed for the most interesting objects by setting the Raman signal to 5 s, 10% laser, 5 accumulations. The materials were identified after baseline subtraction of the acquired raw spectra using WiRE 5.5 software (Windows-based Raman environment) and a self-created polymer database. Renishaw’s WiRE software is specially tailored to Raman spectroscopy. It controls the acquisition of the spectra and offers a whole range of data processing and analysis functions.

2.4. Scanning Electron Microscopy (SEM) Analysis of < 12 µm and < 2 µm Plastic Fractions

One milliliter of the digested sample, diluted at 1:1 in MilliQ water, was filtered onto polycarbonate membranes with a pore size of 12 µm (Whatman® Nuclepore™ track-etched membranes); the filtrates were recovered and spread onto a Teflon-coated silicon chip by immersion for 30 minutes. The silicon chips were then dried under nitrogen. Alternatively, 200 µl of the eluate was centrifuged at maximum speed for 5 minutes, the supernatant was discarded, and the resulting pellet was washed with 500 µl of phosphate buffer (PB, 10 mM) and resuspended in 20 µl of PB (10 mM). Samples were then manually spotted onto a Teflon-coated silicon (Si) wafer (1 µl), and dried under nitrogen flow prior to imaging.
For the analysis of plastic particles smaller than 2 µm, the filtrate of a filter with a pore size of 2 µm (approximately 2 mL) was concentrated to 200 µL using an Amicon Ultra 2 mL centrifugal filter unit (30,000 MWCO, Merk-Millipore). The centrifugal filter unit was washed three times with 1 mL of MilliQ water. The sample was then loaded onto the filter unit and centrifuged at 4000 x g for 3 minutes or until the volume was halved at room temperature. One mL of PB buffer (10 mM) was then added to the Amicon filter unit, which was again centrifuged at 4000 x g for 3 minutes. This step was repeated twice to replace the KOH solution with PB buffer. Finally, the filter unit was centrifuged for as long as necessary to concentrate the sample to 200 µl. The concentrated sample was recovered by spinning backwards at 1000 x g for 1 minute.
To induce the aggregation of plastic particles, one microliter of the concentrate was manually blotted onto superhydrophobic surface and dried as described in Valsesia et al. [30]. To evaluate the presence and distribution of small plastic particles, 10 µl of the sample was spotted on a positively charged surface to immobilize the particles in randomly separated positions and allow SEM counting and Raman identification. The preparation of the Si wafer surface was described in detail in [41]. In brief, the Si surface was first coated with a plasma-coated hydrophobic layer of polytetrafluoroethylene and then incubated alternately with positively charged polydiallydimethylammonium chloride or negatively charged poly (sodium 4-styrenesulfonate), to increase the hydrophilic character of the surface.
Scanning electron microscopy of the samples was performed using a Nova 600i Nanolab (Termofisher, Eindhoven, The Netherlands) equipped with an EDX system for elemental analysis (EDAX Inc, Mahwah, NJ, USA).

2.5. Transmission Electron Microscopy (TEM) Analysis of < 2 µm Plastic Fraction

TEM (JEOL JEM-2100, JEOL, Italy) in conjunction with EDX (Brüker, Italy) was used at 120 kV in both TEM and STEM modes to characterize the primary size, morphology and elemental composition of plastic-like particles at the nanoscale.
A digested insect meal sample (3 µL of the sample suspension) was applied to a 200 mesh Formvar (Agar Scientific, USA) carbon-coated copper grid and dried overnight in a desiccator. The grid was then washed twice with MilliQ water, dried, and analyzed.
Elemental analysis was performed in STEM, brightfield and hypermap mode (Quantax software, Brüker, Italy) to determine the carbon content.

2.6. Microplastics Integrity Test

As a control, 1 mm thick PE films (Sigma Aldrich, Milan) were cut into small pieces of 5-6 mm in size. Each PE piece was weighed to the nearest 0.1 µg (Mettler Toledo® XPR2U Ultra-Micro Balance) and placed in a glass vial containing 7 ml of 10% (w/vol) KOH and water. The suspension was allowed to stand overnight at 60°C with mechanical shaking, and then stored at RT and in the refrigerator (4°C) for 3 weeks. Each PE piece was then rinsed in water and dried at 40°C for one week until the weight was constant. The PE pieces were then weighed to determine any variations in weight. The PE pieces were also analyzed using Raman and FTIR spectroscopy to scan the test samples and observe the chemical properties.

3. Results

3.1. KOH Digestion

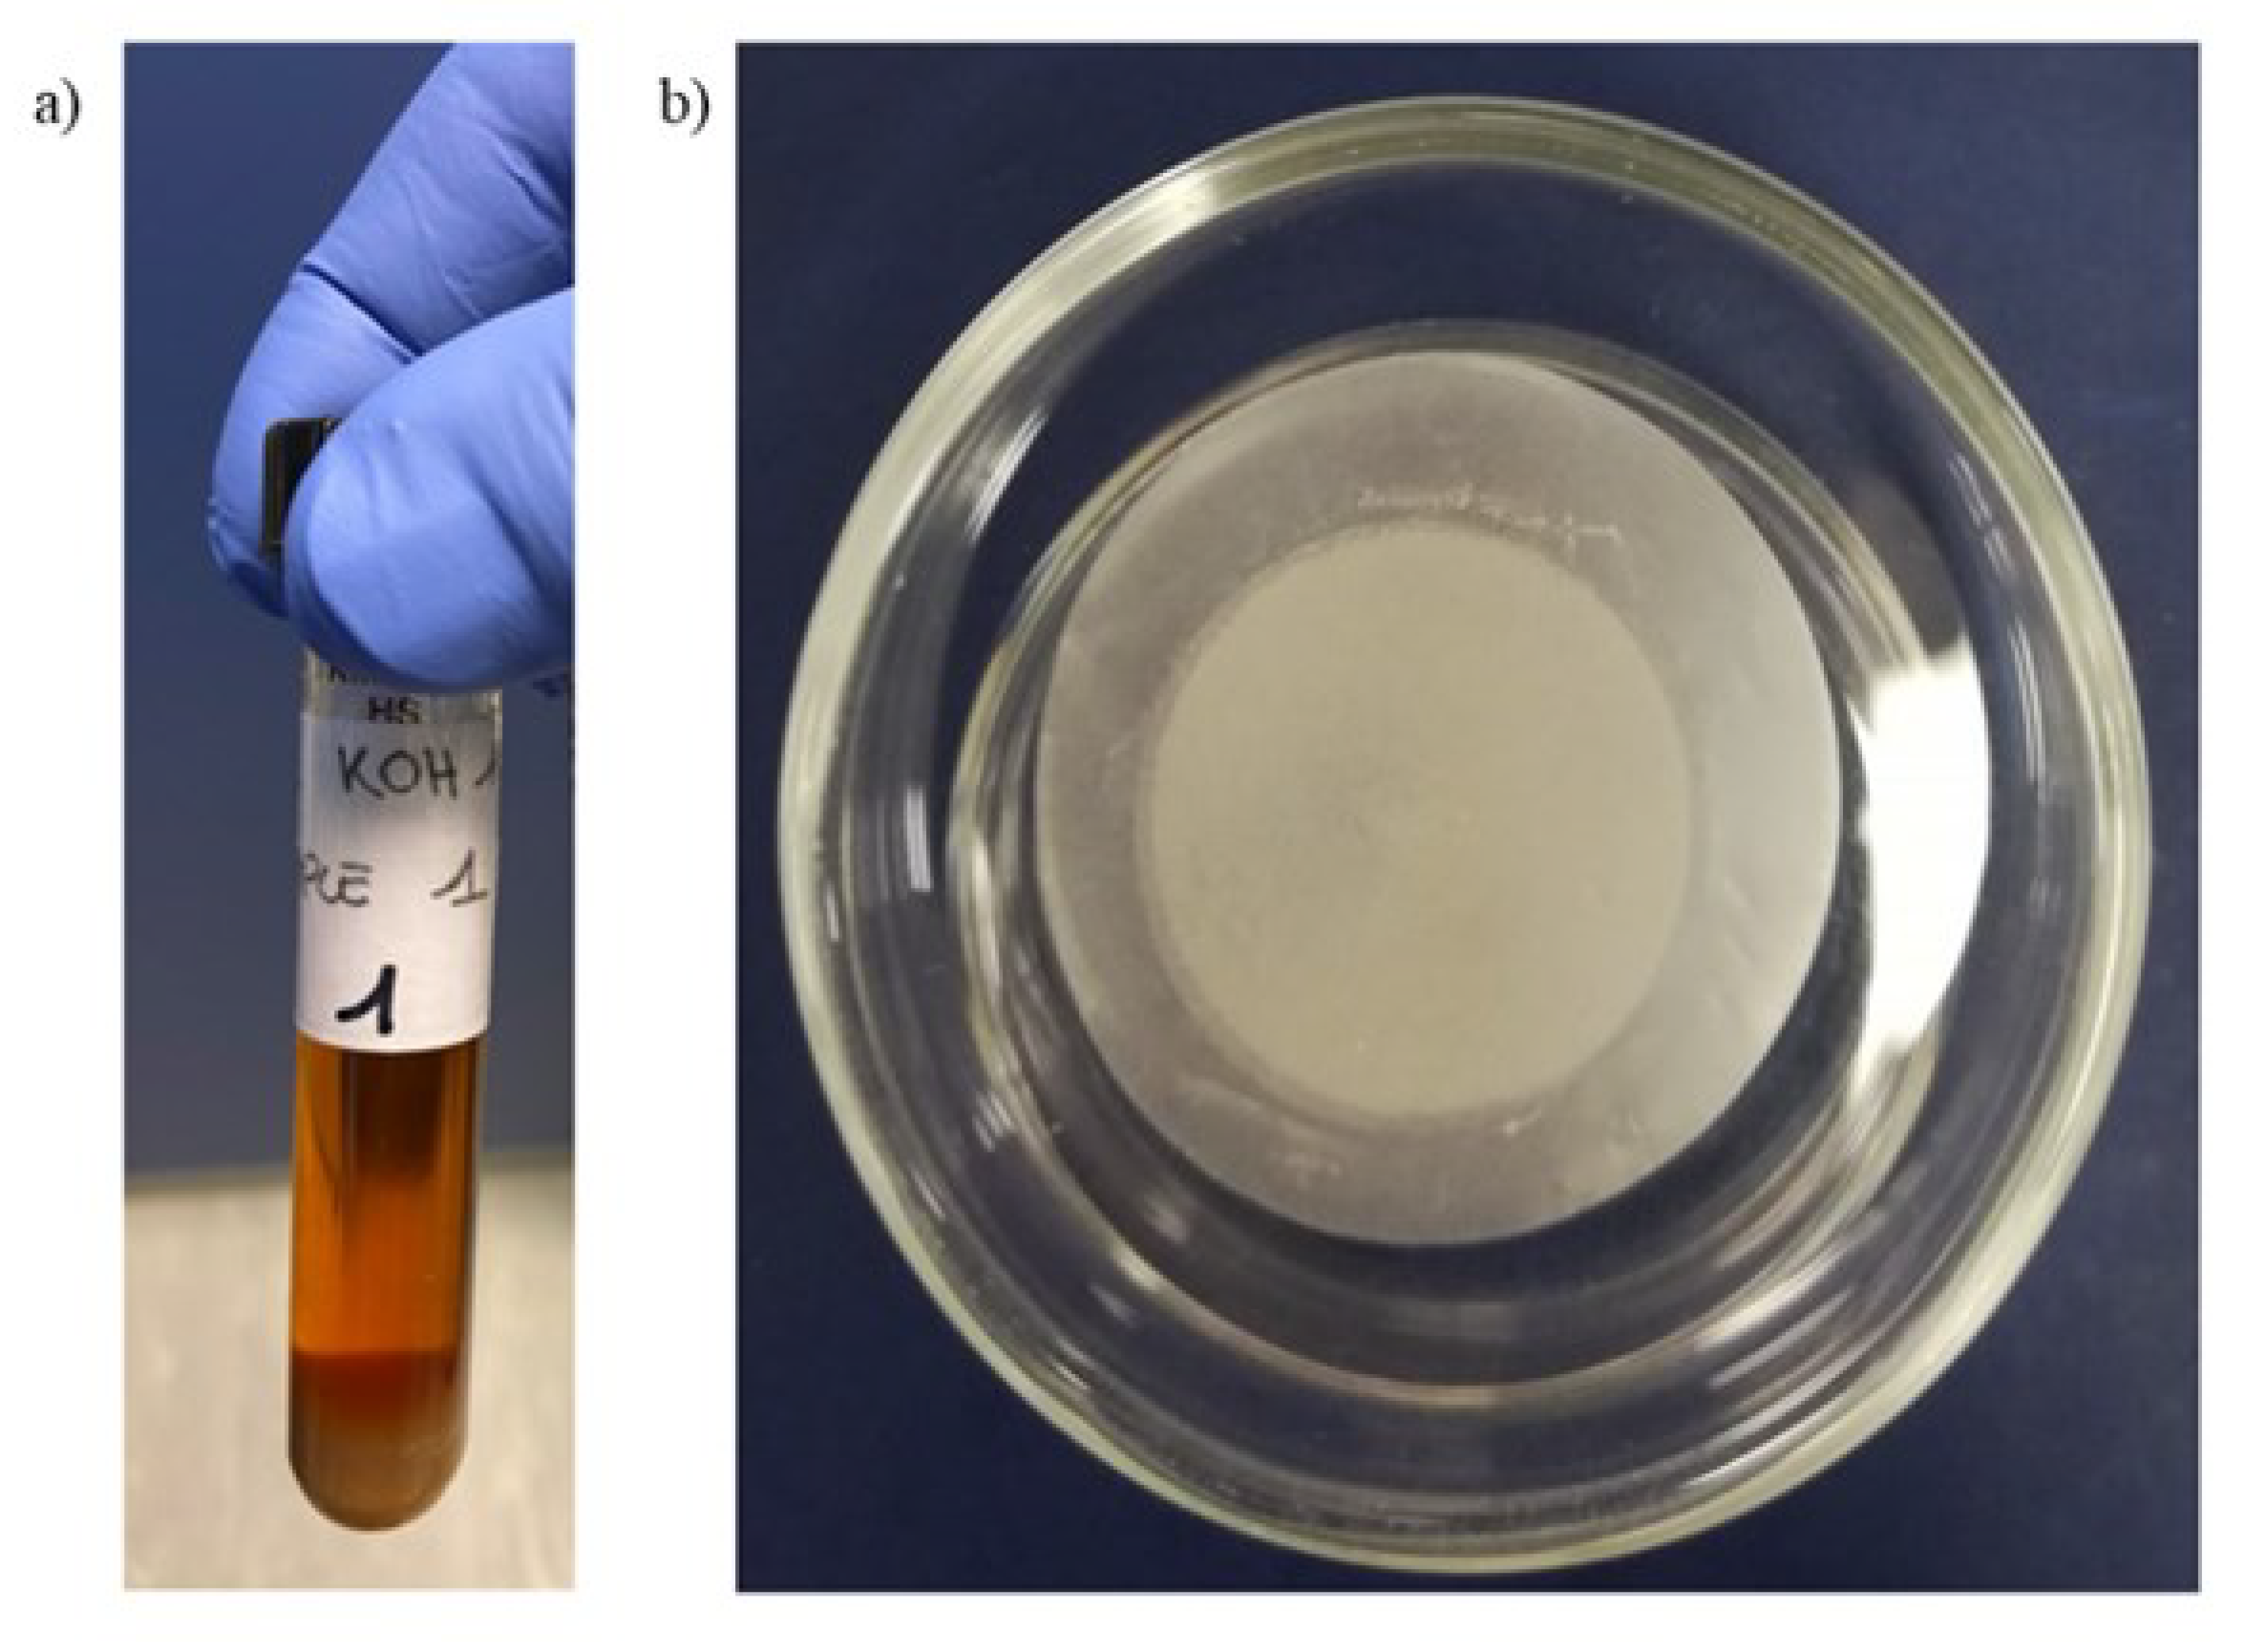
KOH treatment at 60°C efficiently digested the organic matter of the lipid-rich insect meal sample and removed a large part of the biological matrix (Figure 2), while the synthetic target polymer polyethylene (PE) remained intact. The resistance test of PE to the applied digestion protocol showed no significant change in PE unit weight and no changes in chemical structure after KOH treatment (Supplementary data file S1).

3.2. Raman Mapping and Analysis of Measured Spectra of the 2 µm Filter

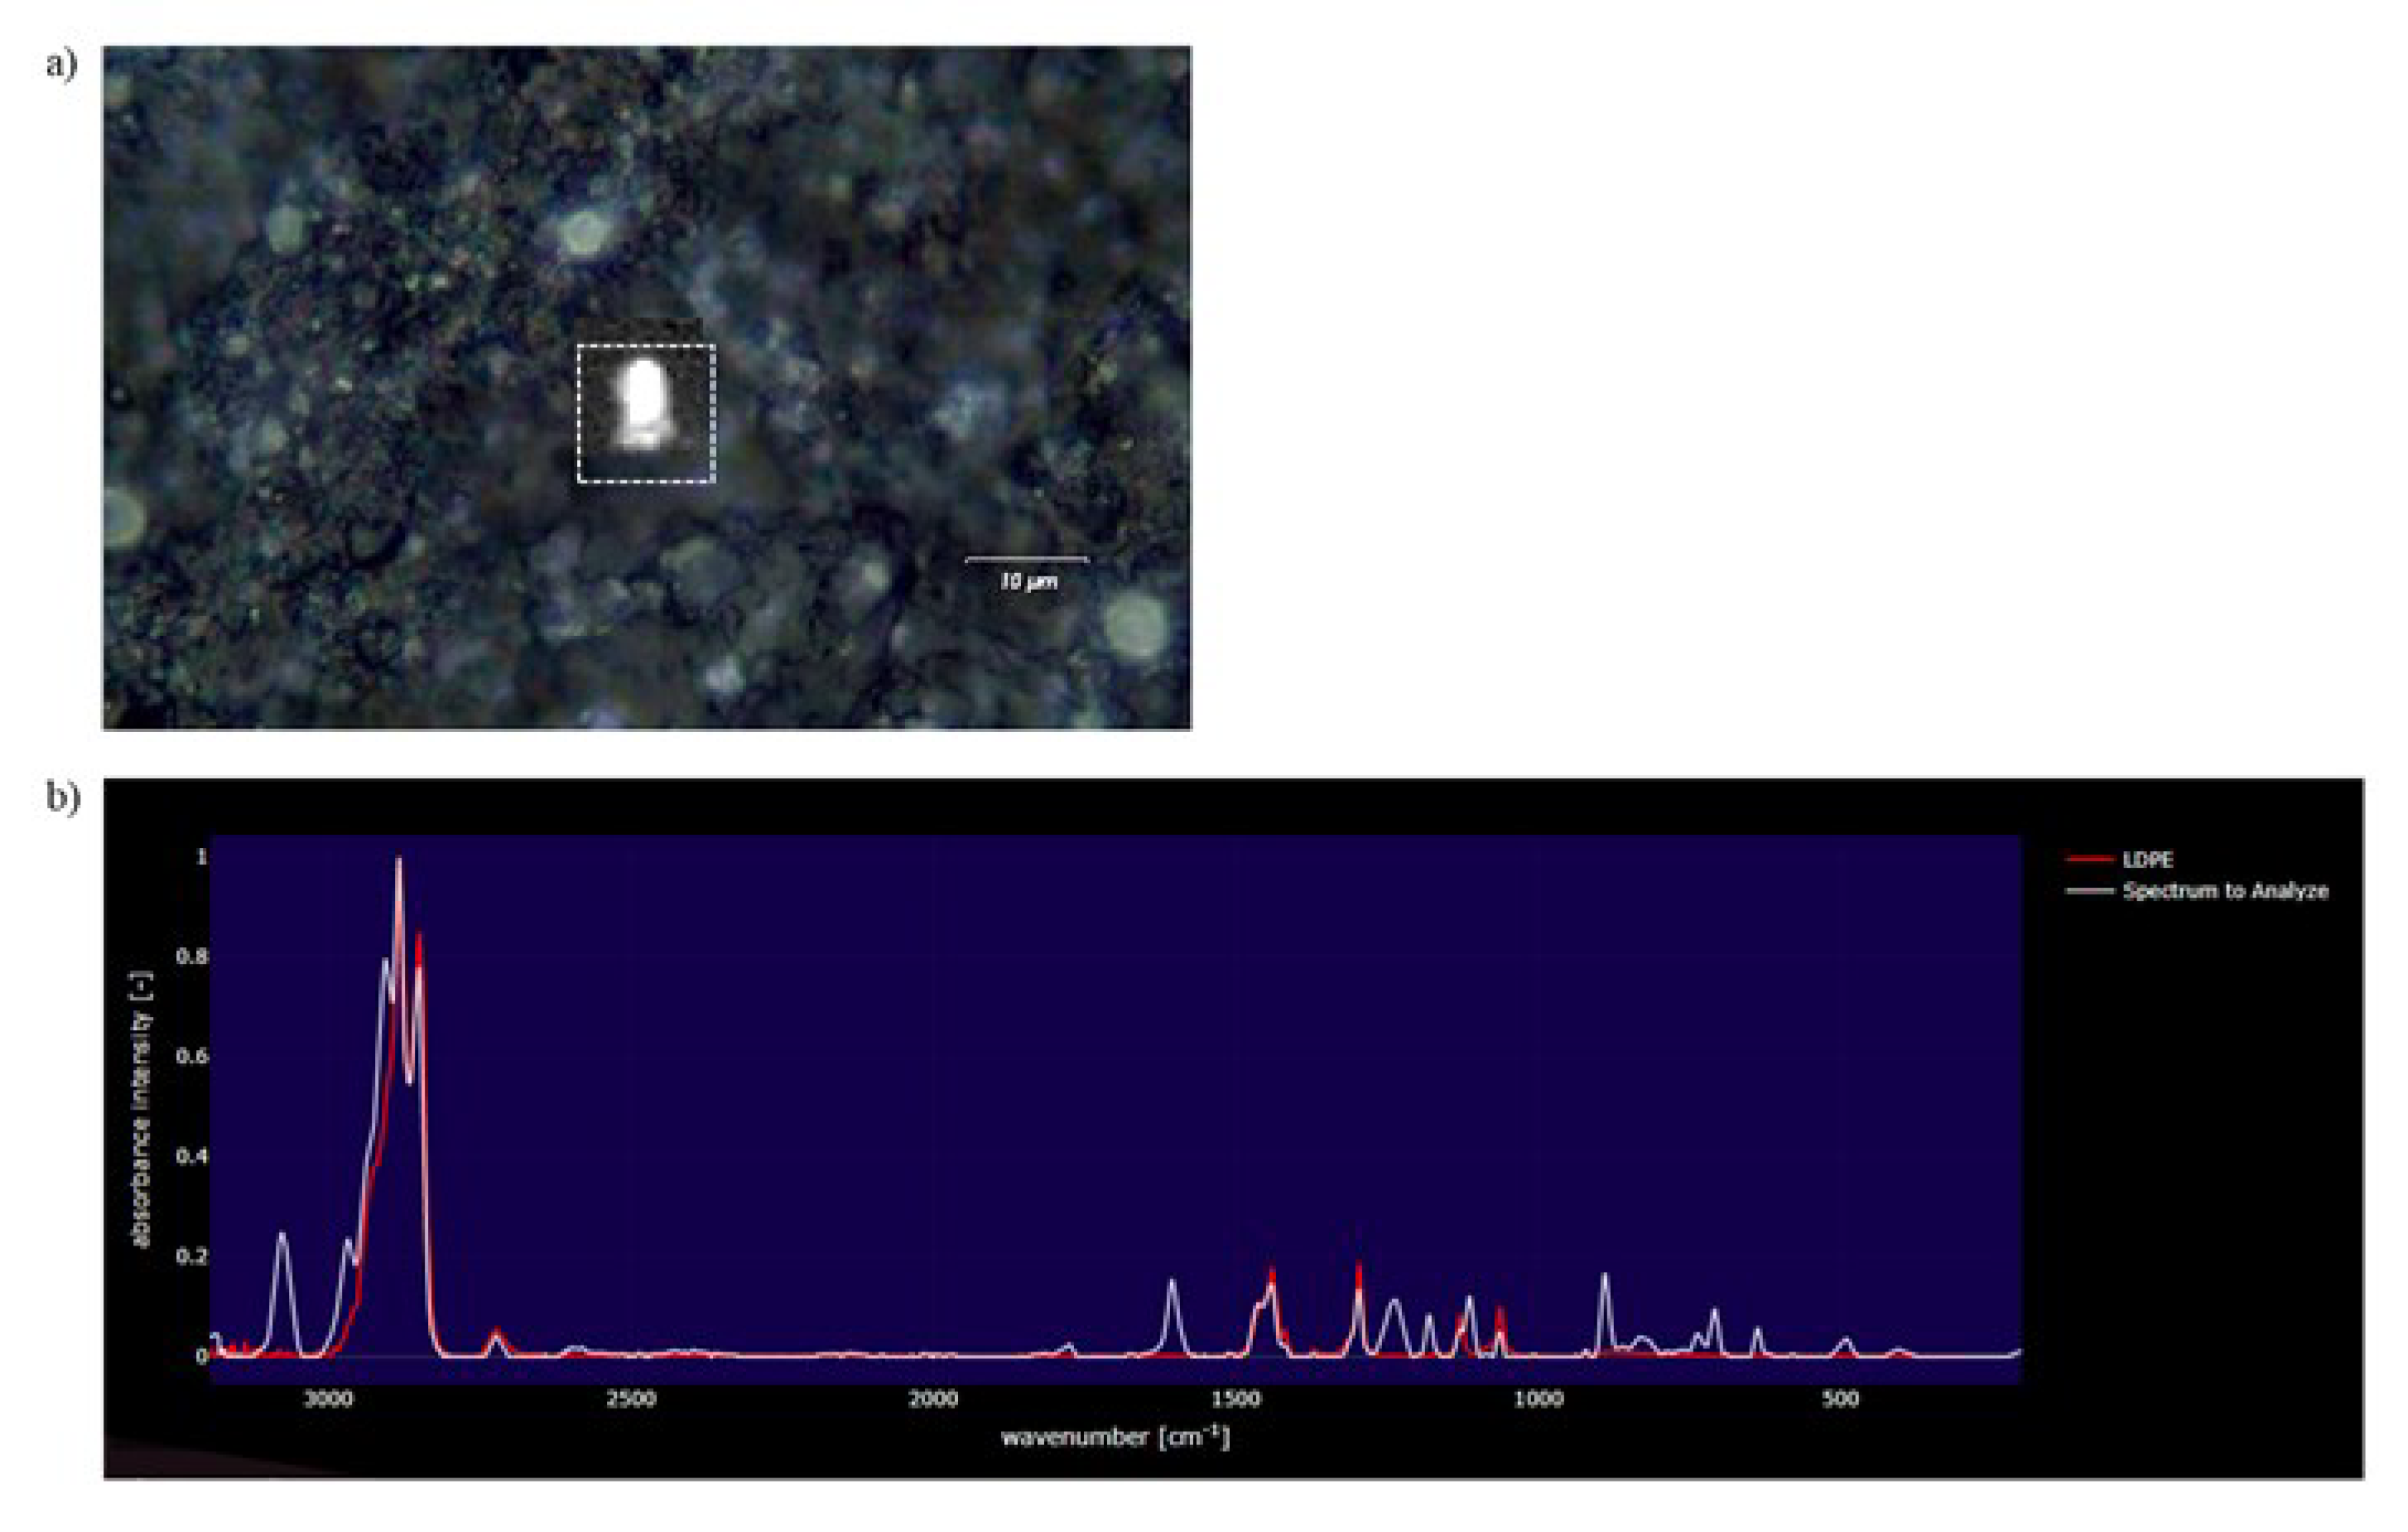
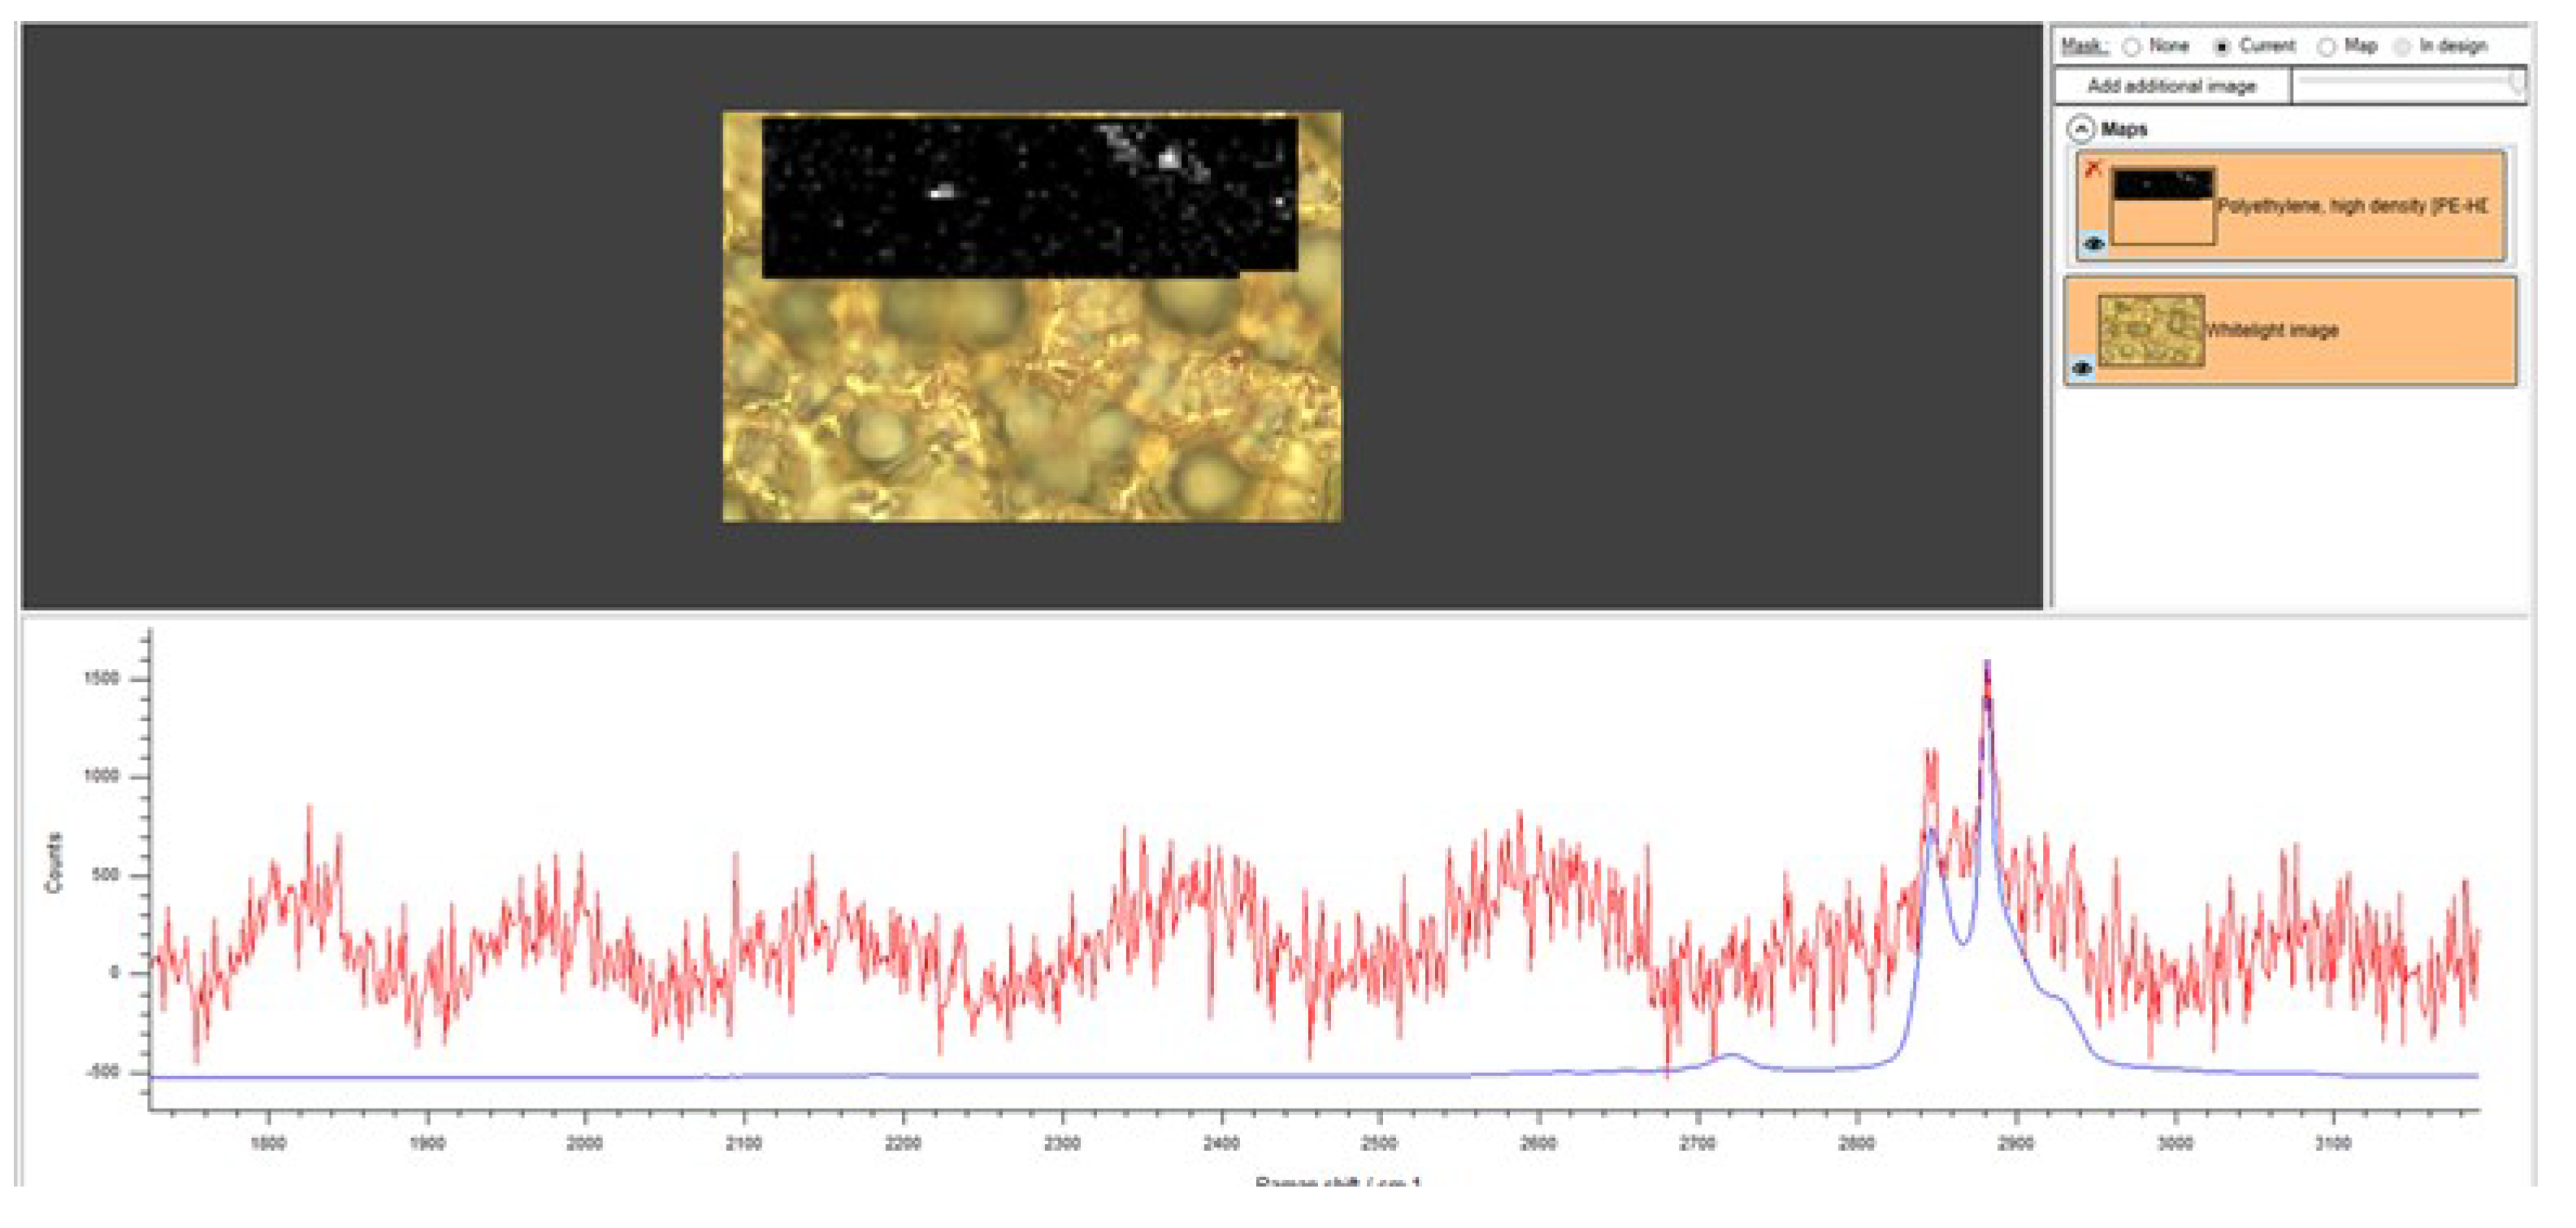
Six different areas of the filter (0.095 mm x 0.060 mm), corresponding to 0.01% of the total filter area were analyzed using Renishaw CRM. A total of 328 objects were manually detected and mapped using a x100 objective. The spectrum (range 1700-3000 cm-1) of seven objectives was recognized as polymer origin. More precisely, these were PE MP with a size of < 10 µm (Figure 3). Considering the volume of the sample analyzed on the filter (1 ml, 10% of the total volume) and the area fraction of the filter analyzed at the best resolution, the potential hit of the polymer objects in the whole sample was:
7/0.1 x 0.0001 = 7 x 10⁵ particles/10 ml or 7 x 10⁵ particles/0.5g

3.3. Correlative Raman and SEM Mapping and Analysis of Measured Spectra of the Particulate < 2 µm on a Positively Charged Surface

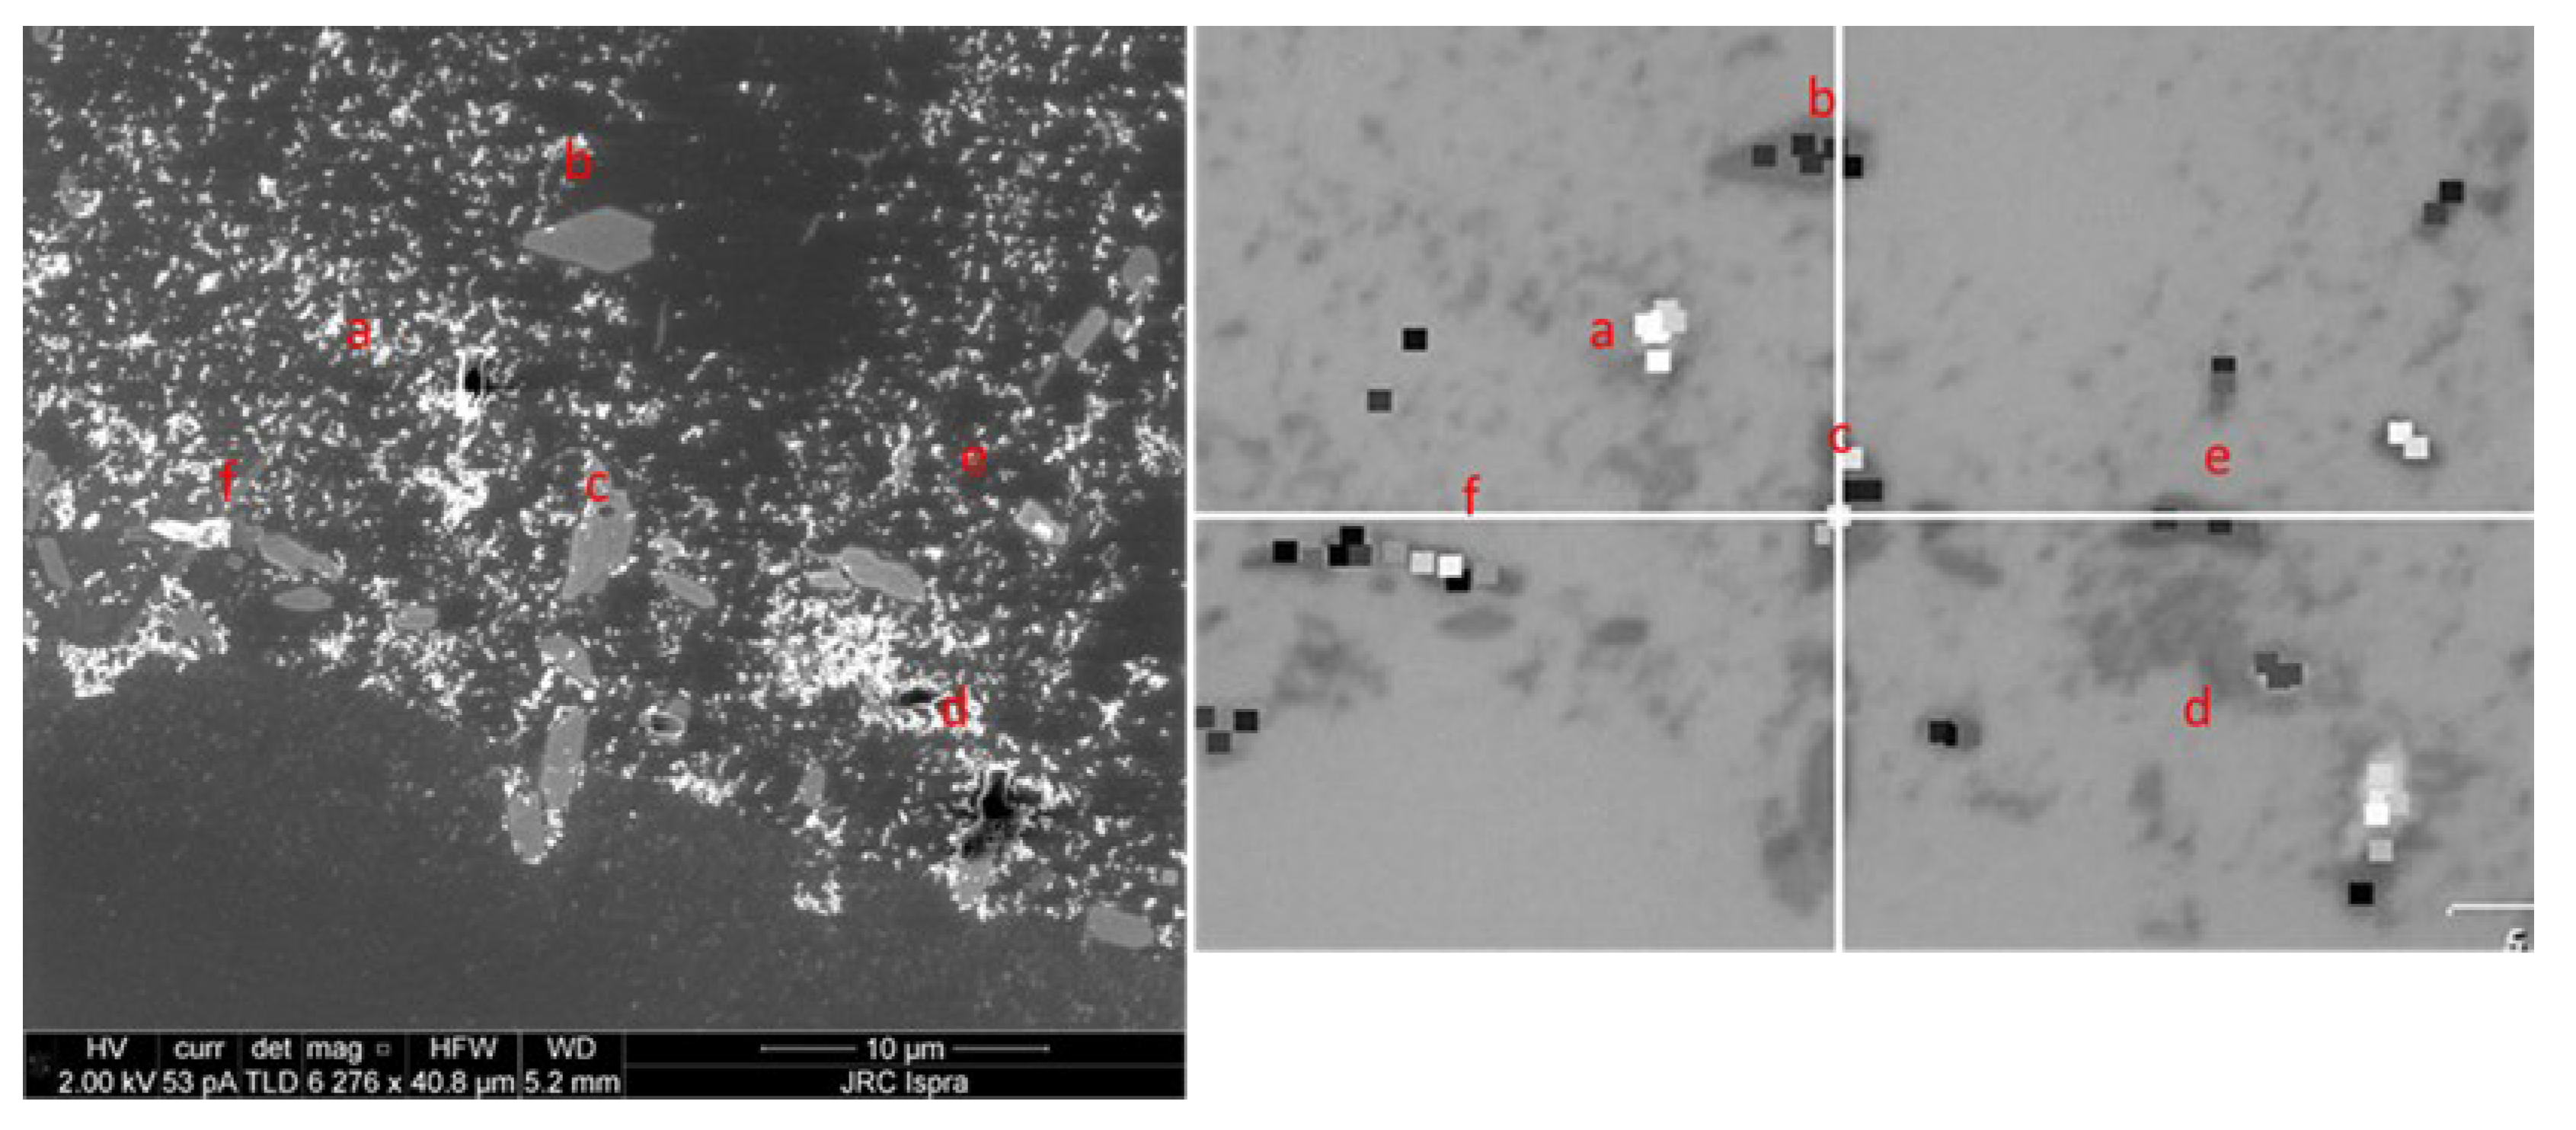
The particles that passed through the filter with a filtration fineness of 2 µm were then concentrated on a positively charged surface, allowing correlative Raman and SEM mapping. A particularly particle-rich area was selected with the SEM and the particles were recognized by their shape and size. After e-beam irradiation, the area appeared brighter in the optical microscope connected to the confocal Raman micro spectrometer. In this way, the same area that was analyzed in SEM was detected in the optical microscope and the particles were labeled with the same letter in the two images. The Raman spectrum of each object was then captured and recorded. A comparative analysis of the probability of the spectra with the spectrum of PE was performed by the software of the device. The software then classified the particles with a color scale: “white” for particles (or dots) whose spectrum is practically identical to that of PE and “black” for spectra that are not similar to that of PE. The results are shown in Figure 4. The particles labeled a, f, d, and b were identified as PE. Other particles similar in shape and morphology were not classified as PE.
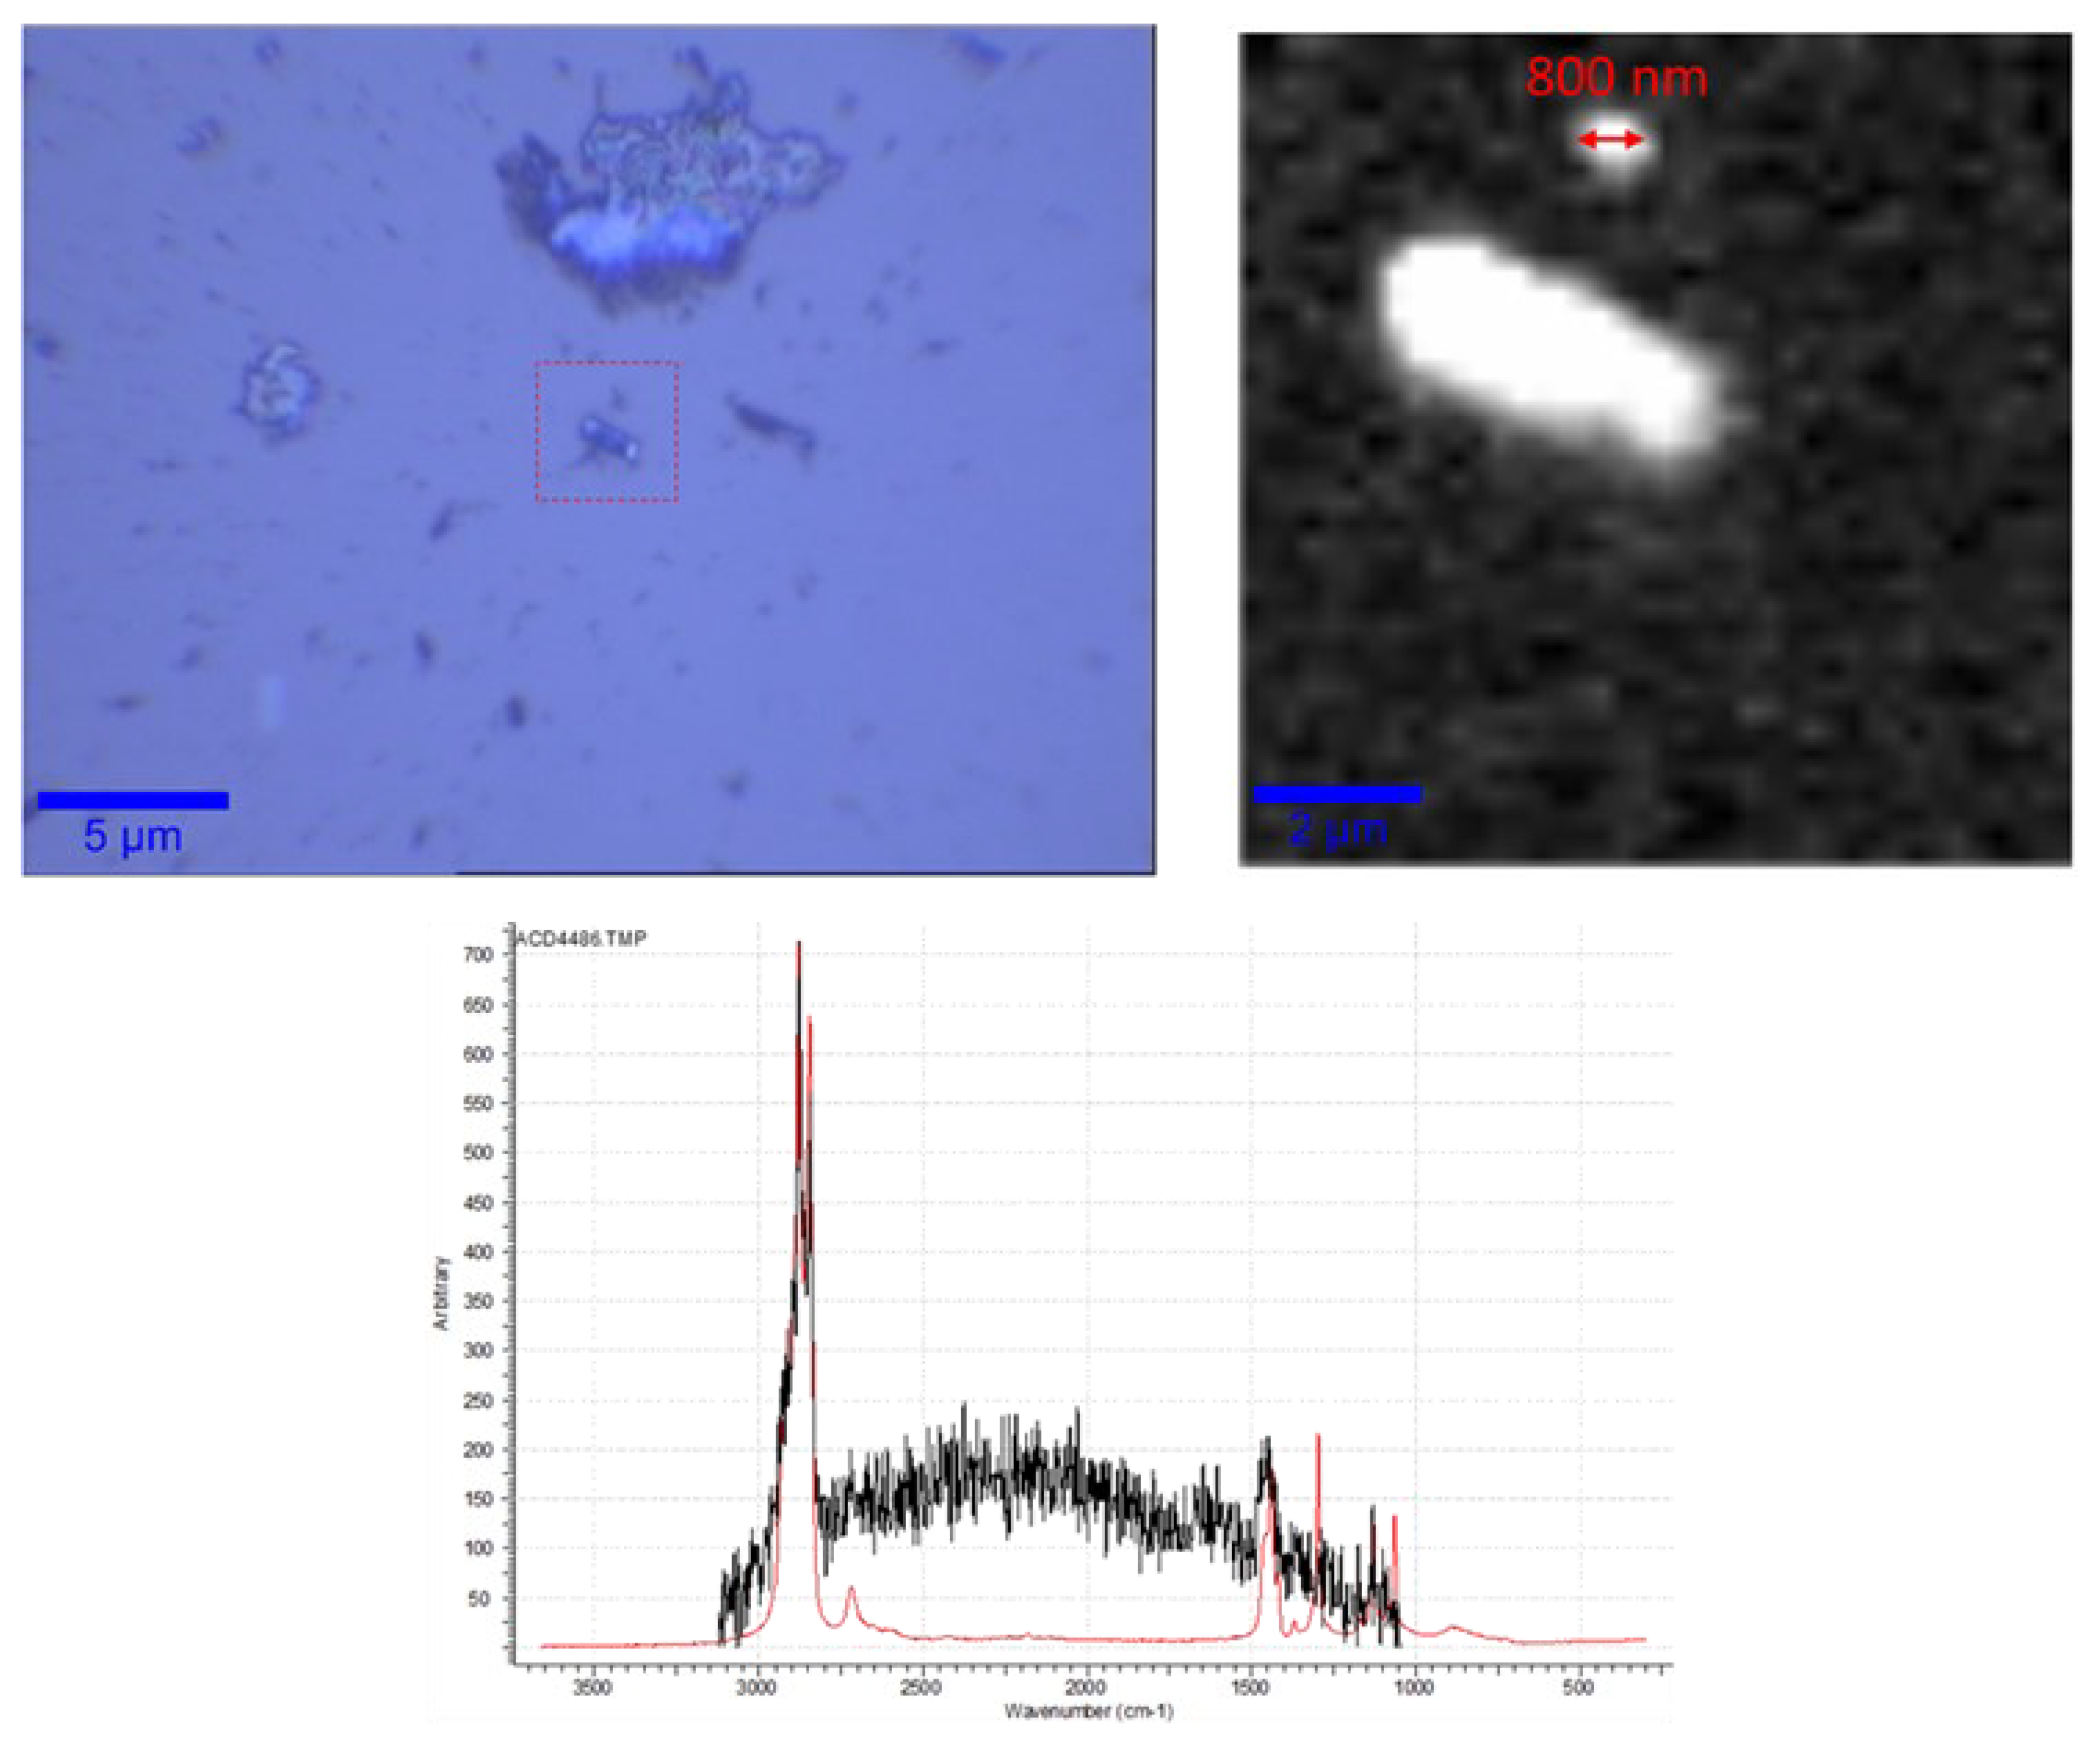
By increasing the resolution of the Raman microscope with a 100X objective, an area aound a selected particle was scanned with the highest possible scan resolution (X, Y step of 100 nm). In this way, a submicrometric PE particle characterized by a size of 800 nm was identified and mapped (Figure 5). This result proves the presence of PE NP in the sample.

3.4. Raman Mapping and Analysis of Measured Spectra of the Particulate < 2 µm Spoted on a Superhydrophobic Surface

With this approach, small NP were clustered on the superhydrophobic surface and mapped with Raman. A map with a resolution of < 100 nm was acquired with a 100X objective. Again, the white pixels were associated with a spectrum similar to the PE spectrum, while black pixels were not recognized as PE. Different PE clusters were recognized by the software (Figure 6).

3.5. TEM Characterization of MPs

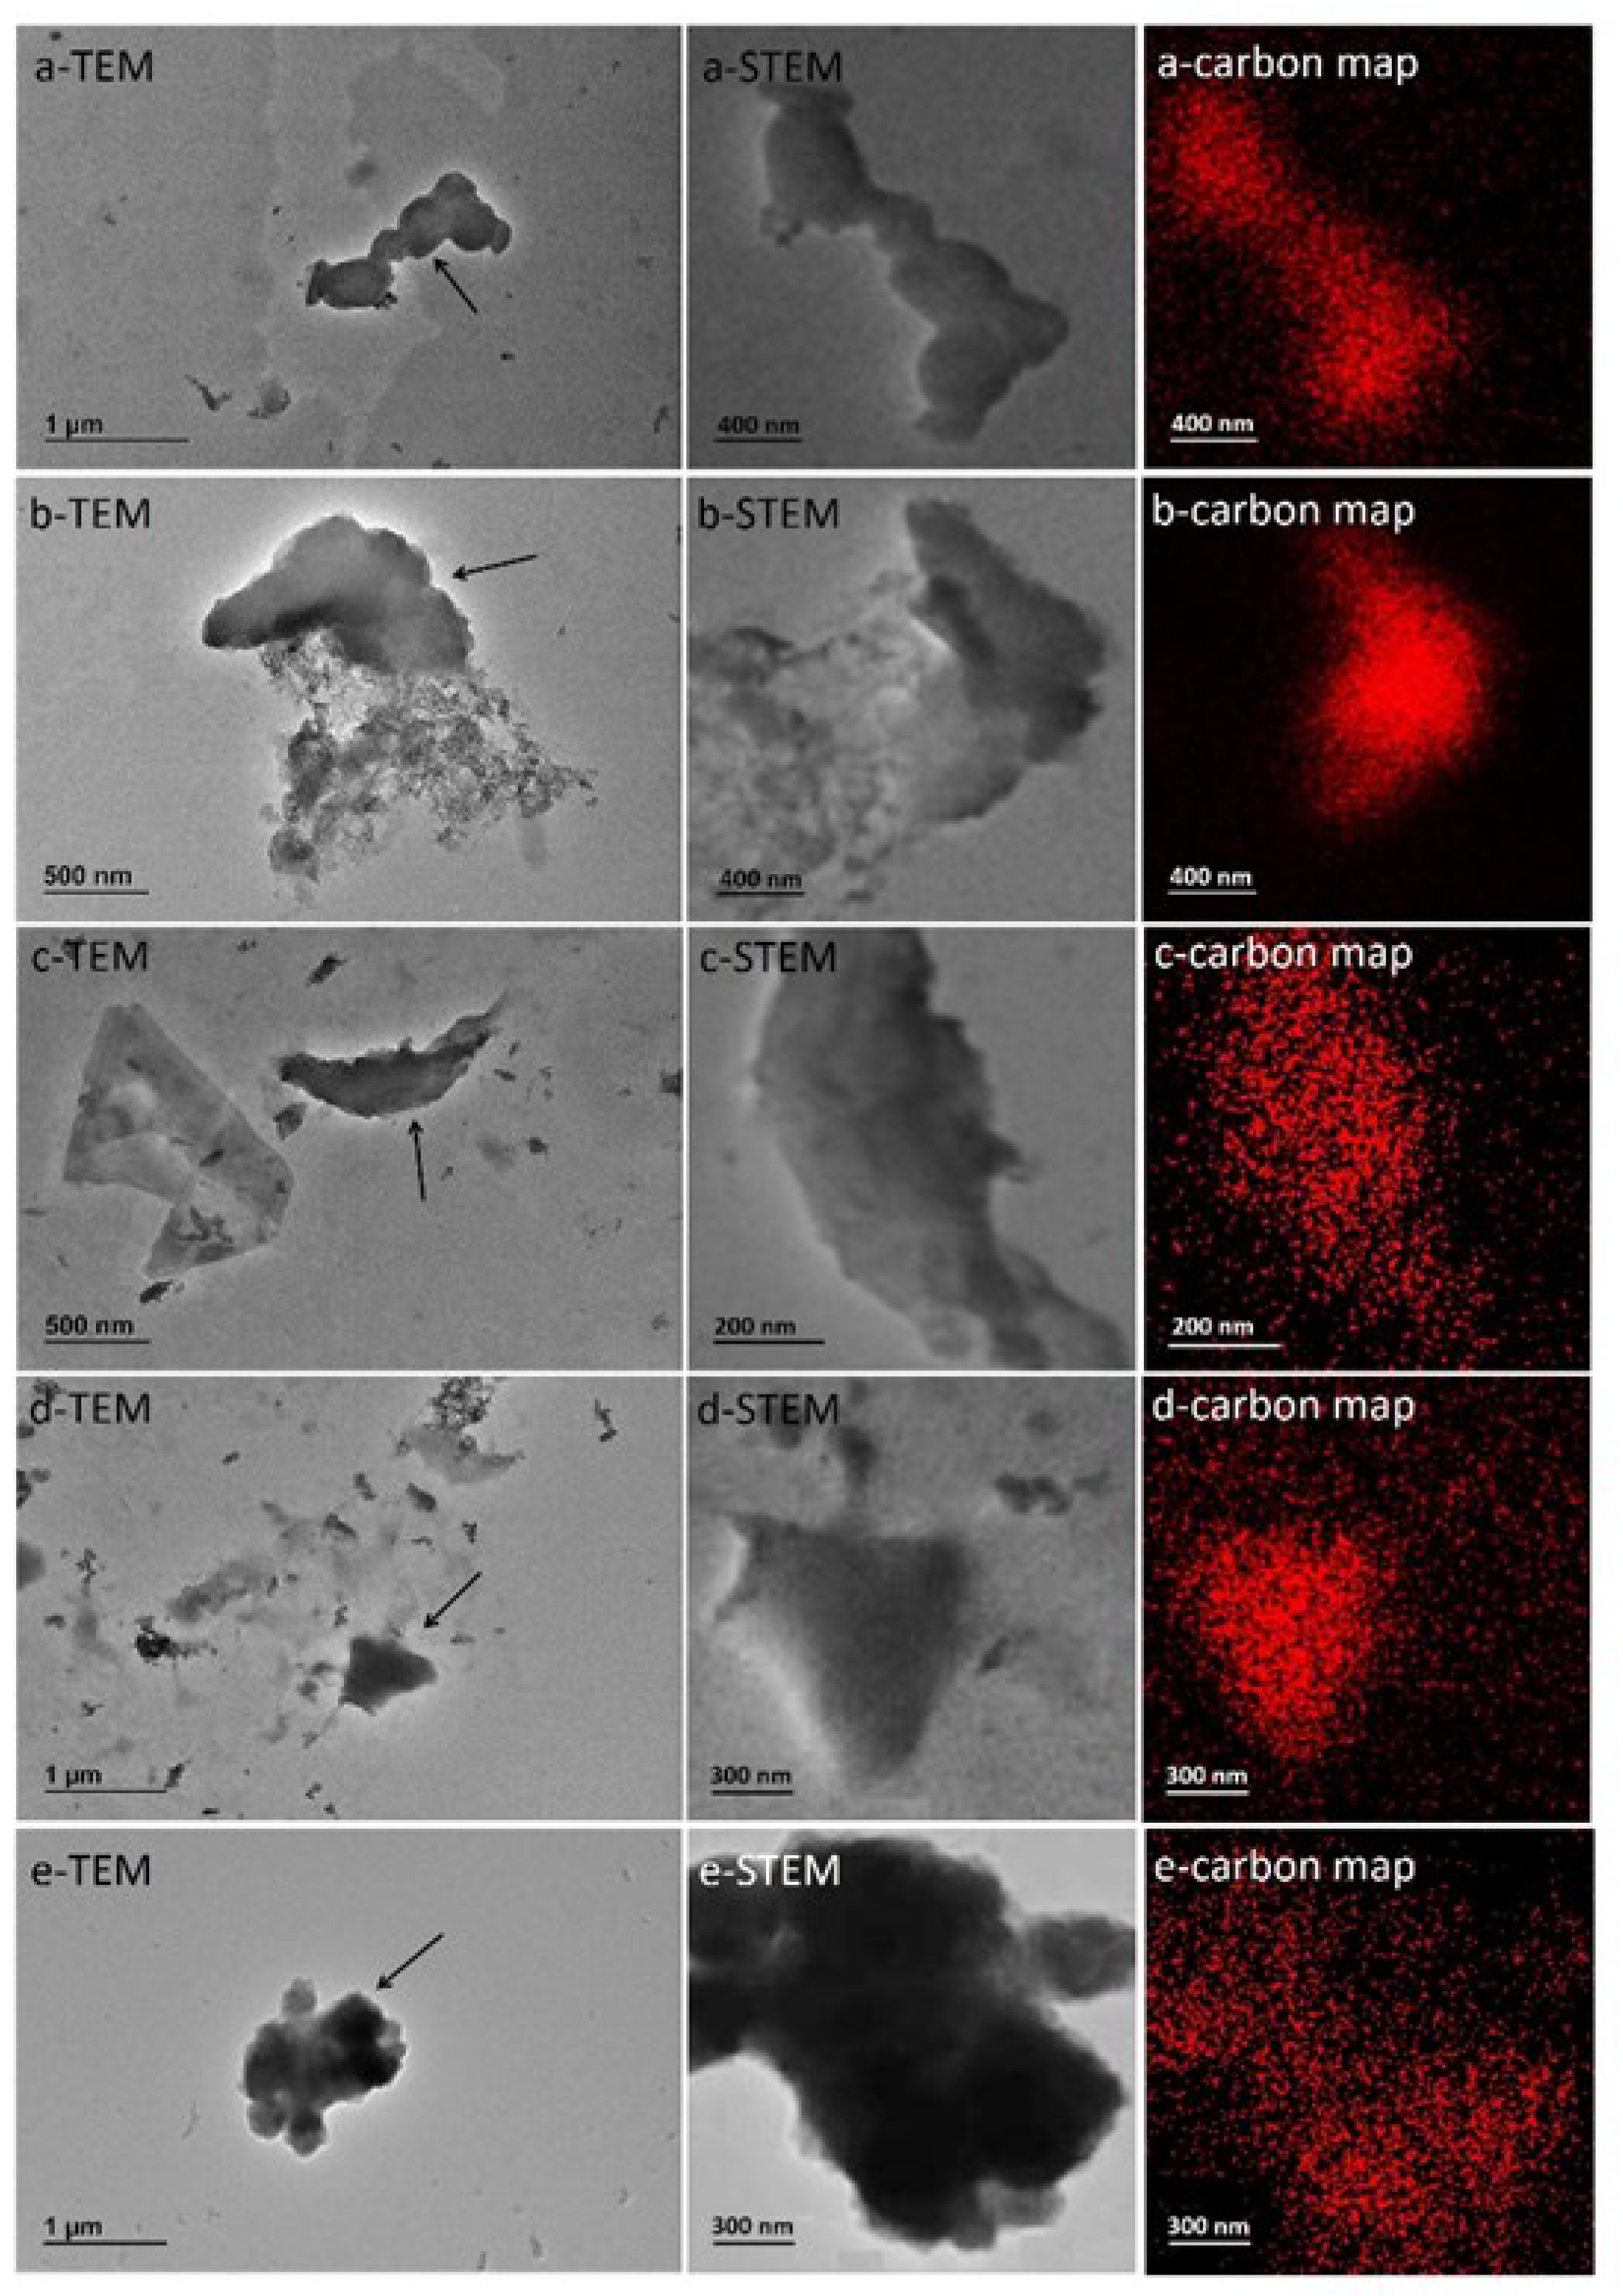
TEM in conjunction with EDX confirmed the presence of plastic-like morphological structures as observed by SEM and confocal Raman microscopy in the digested insect meal sample. Sample preparation allowed sufficient matrix to be removed to see whole particles approximately 1µm in size and below, which were irregularly shaped (Figure 7) and in some cases agglomerated/aggregated (Figure 7a,e). The corresponding EDX analysis in STEM mode showed that the objects found contained carbon in higher concentration than the background.
This finding suggests that they could be PE plastics, which was confirmed by Raman spectroscopy.

4. Discussion

This study deals with the detection and identification of MP and NP in a commercial raw material, namely insect larvae meal of H. illucens, which is used for the production of aqua feed. Various analytical techniques were used in the study, including Raman spectroscopy, correlative SEM-Raman imaging and detection on a superhydrophobic surface.
Plastic pollution is a global problem and there is an urgent need for effective detection methods due to the increasing production and environmental risks associated with plastics. The risks posed by MP and NP include bioaccumulation, absorption of pollutants and the potential impact on aquatic organisms, highlighting the implications for seafood safety and human health.
MP and NP can enter the environment from various sources, and insects, like other animals, can be exposed to them through different routes, such as airborne deposition, soil contamination, and consumption of contaminated prey [42].
Synthetic textiles are the main source of airborne MP. Other sources include tire and brake particles from vehicles, the degradation of large plastics and industrial emissions. The size range of airborne MP ranges from 5000 mm to < 25 mm. These MP can be transported through the air and deposited on surfaces, including plants that insects feed on. This can occur through atmospheric processes such as wind and precipitation. [42].
MP can also occur in soil, either directly through the dispersal of plastic waste or indirectly through the decomposition of larger plastic pieces into smaller particles over time. After rain and snowfall, rainwater can infiltrate the soil, potentially contributing to MP in the soil. Insects can ingest MP when they feed on contaminated food sources, e.g., plants, other insects or organic material containing microplastics.
MP can enter the body of insects by ingestion, inhalation or skin contact. The uptake dose of MP in insects can vary greatly depending on species, life stage and environmental conditions. Studies have shown that the concentration of MP in organisms can range from negligible amounts to significant quantities [42,43,44,45]. Insects pass these on to other animals when they themselves are eaten.
In recent years, this risk has become an increasingly pressing issue with the growing use of insect meal in animal feed. Indeed, aqua feed manufacturers have successfully incorporated insect proteins and oils into their formulations, reducing the use of fishmeal and fish oil while improving the sustainability and nutritional value of the feeds.
Therefore, it is crucial to find valid analytical methods for the detection of MP in complex matrices, such as animal feeds and the raw materials used for their formulation.
The main problem in the analysis is the isolation and detection of small plastic fragments in an extremely complex matrix such as insect larvae meal. In this work we approached the problem step by step. The first step was to simplify the solid matrix. To convert the solid matrix into a liquid dispersion, the KOH digestion strategy was applied. KOH is a general digestion method that also preserves the chemical integrity of the various plastic fragments. The result of KOH digestion is again an extremely complex matrix containing dissolved chemicals and colloidal particles of different sizes, ranging from NP to particles several micrometers in size.
Since we were looking for the smaller fraction of MP, we filtered the suspension with a 12 µm – mesh filter to retain the large particles and further simplify the matrix. Raman mapping of the filter allowed us to analyze thousands of objects and check if their spectrum matched the spectrum of one of the most abundant polymers. 7 particles in the selected area were attributed to PE. If we assume that the distribution in the volume of the digested liquid and on the surface of the filter is homogeneous, we can estimate the concentration of MP in the digested matrix and consequently per mass of the original sample.
A number of 1430 particles per gram of material was calculated. Interestingly, we found MP and NP in the filtrate. To detect the presence of “small” MP (with a size of less than 12 µm), we used the approach of electrostatic trapping of particles on a functionalized surface. This method is relatively simple, but allows the almost complete simplification of the matrix and the isolation of the “hard” particles present in it. All colloidal particles floating in a suspension are subjected to different forces (according to the XDLVO theory [46], which keeps the particles in a state of equilibrium and moving in the fluid by Brownian motion. When a surface comes into contact with the suspension, the same DLVO forces act between the particles and the surface, which can be attractive or repulsive depending on the properties of the colloidal particles and the surface. In the present case, we have introduced a positively charged surface capable of attracting negatively charged particles and immobilizing them. Moreover, dispersed molecules, micelles and aggregates of the matrix (if they are negatively charged) are attracted to the surface, but they do not keep their shape when immobilized because they are not as mechanically stable as the hard colloidal particles (such as MP and NP). The rate of absorption depends on many factors, such as the concentration of the particles in suspension and the rate of diffusion. After a time, a number of particles are immobilized on the surface and distributed in a semi-ordered manner by the particle-particle repulsion forces.
With this method, it is possible to image the colloidal dispersion on the surface and spatially isolate the “hard” MP and NP from the rest of the matrix. The particles are then examined individually using CRM and SEM. In this way, we were able to detect individual PE particles with a size of < 1 µm, which is close to the detection limit for Raman microscopy. To overcome this inherent size limitation of the instrument and to be able to detect smaller particles, we used a different approach to immobilize the particles. By using a superhydrophobic surface, we favored the self-aggregation of the particles by inducing the drying of a dispersion droplet. During the drying process, capillary forces tend to aggregate the particles into clusters, which are then detectable by CRM. Clusters typically range in size from a few micrometers to tens of micrometers and can be detected with CRM. In this way, we were able to identify clusters containing PE and detect the presence of NP particles in the original sample.
The results of the present study show that insect meal can be a source of contamination of farmed fish with MP and it is therefore possible that MP enters the farmed fish via the feed. Using CRM, we estimated 14 x 105 particles/g insect meal. If we assume that the proportion of insect meal in a commercial feed is usually no more than 10%, this figure corresponds hypothetically to 140 x 106 MP particles/1 kg feed. A value that is significantly higher than the previously documented values in commercial feeds for Asian stinging catfish (Heteropneustes fossilis), European seabass and tilapia (Oreochromis niloticus), which ranged between 500 and 11,600 MP particles/kg fish feed [47,48,49]. The deviating results can be explained on the one hand by the properties and composition of the ingredients. These previous data refer to a commercial feed containing only fishmeal and vegetable raw materials. As shown in various studies, the MP content of fishmeal can have a range of values from 0 to 17.3 plastic particles/g [50,51,52]. Similar amounts of MP (between 0.8 and 1.7 particles per gram) were found in plant-based meals [50]. Secondly, the method used for MP detection was different. In all previous studies, visualization of MP by a stereomicroscope and FTIR spectroscopic analysis was used. For the identification and quantification of MP, FTIR spectroscopic analysis has limited sensitivity for MP smaller than 10 µm, resulting in an underestimation of MP contamination.
Although the great number of MP detected in our insect meal sample, it is important to point out that the effects of MP on insects and other animals such as fish are still the subject of active research and the long-term consequences are not fully known. Potential effects include physical damage, impaired feeding and digestion, and the possible transfer of chemicals associated with plastic [18,48,53,54,55].
MP can indeed serve as a vector for the bioaccumulation of toxic substances in fish, and the toxicity resulting from the ingestion of plastic is a consequence of both the sorbed pollutants and the plastic material [56].
The ingestion of microplastic particles and the transfer of potentially harmful substances together with microplastics has been studied in a variety of organisms, especially invertebrates. However, the potential accumulation of very small MP along food webs ending with vertebrate models has only been investigated in a few studies so far. Results from those studies suggested that food-borne MP-associated pollutants may desorb in the fish intestine, facilitating their transfer to the intestinal epithelium and liver [56].
The regulatory context underscores the significance of addressing MP and NP in the realm of EU regulations on plastics in animal feed [57]. Recognizing the imperative to comply with these regulations, there is a pressing need for reliable identification methods specifically tailored to detect and analyze MP and NP in food. This highlights the intersection of environmental concerns, regulatory compliance, and the necessity for advanced detection methodologies in safeguarding the quality and safety of food products.
Accordingly, the application of the aforementioned methods for the detection and identification of MP and NP in insect larvae meal is a novelty in the study of this matrix. The results of KOH digestion, filter analysis, correlative SEM-Raman analysis and superhydrophobic surface detection confirmed the presence of PE NP in the insect meal sample.
For a comprehensive analysis of MP and NP, the combination of several techniques, such as Raman spectroscopy, SEM, TEM and EDX, can provide complementary information and overcome individual limitations [30,40]
In fact, Raman spectroscopy alone provides detailed chemical information about the composition of MP and helps to identify specific polymers. It is a non-destructive technique that allows the analysis of MP without altering their structure. On the other hand, SEM provides high-resolution images of MP that allow detailed morphological analysis. SEM provides information on the surface topography and texture of microplastics and can be coupled with EDX for elemental analysis of MP. The limitations of SEM lie in sample preparation, as it often requires coating of the samples, which can alter the surface properties of MP. In addition, SEM provides 2D images, which limits the ability to fully understand the three-dimensional structure of MP. While EDX can provide elemental information, SEM may not provide detailed chemical information about the polymer composition.
TEM offers an even higher resolution than SEM and enables a detailed analysis of microplastic structures. TEM provides detailed information about the internal structure and morphology of microplastics. TEM can be combined with EDX for elemental analysis. However, as with SEM, TEM often requires complex sample preparation and the process can produce artifacts. Working with TEM requires specialized knowledge and the instrument is sensitive to environmental conditions. TEM has a limited field of view and is therefore less suitable for analyzing larger areas.
EDX provides information on the elemental composition of microplastics and thus helps to identify them. EDX can be used for quantitative elemental analysis and provides information on the concentration of the various elements. However, the spatial resolution of EDX is lower compared to SEM and TEM, which limits its ability to provide detailed information about microplastic structures. EDX can have problems in distinguishing elements from the microplastic matrix and surrounding materials. The sensitivity of EDX can be limited, especially for trace elements in microplastics.
Therefore, to thoroughly examine microplastics, utilizing multiple techniques like Raman spectroscopy, SEM, TEM, and EDX is essential. By combining these methods, which individually have their own strengths and weaknesses, a comprehensive analysis can be achieved. This approach maximizes the benefits of each technique while minimizing their respective limitations.
In summary, the study provides a method to detect MP and NP in a unique matrix, offering insights into the potential presence of plastics in insect-based aquafeeds. The combination of different analytical methods strengthens the reliability of the results.
Solutions such as ‘recycling’ or ‘circular economy’ are often mentioned. Theoretically, if all used plastic was recycled and reused as new material, no more plastic would end up in the environment. Unfortunately, the reality is less rosy.

5. Conclusions

The main result of the current work lies in the successful discovery and identification of NP, a significant achievement in understanding the extent of plastic contamination. The identification process provides valuable insights into the presence of these minute plastic particles in the insect meal samples and potentially in insect-based aquafeeds. However, there are avenues for potential future work that can build upon these findings.
One promising direction for future research involves the quantification of NP. While the identification of NP is a crucial first step, quantifying their concentrations allows for a more comprehensive understanding of their prevalence and potential impact. This could involve developing and refining analytical techniques to accurately measure the quantity of NP in various samples, providing data that can be used to assess the scale of contamination.
Moreover, investigating the potential effects of NP on biological systems and ecosystems represents another avenue for future exploration. Understanding the ecological implications and potential risks associated with NP exposure can contribute to the development of informed regulations and mitigation strategies.
Additionally, exploring the sources and pathways of NP pollution can be a crucial aspect of future work. This could involve tracing the origins of NP in different environments, understanding how they enter food chains, and identifying potential sources for effective pollution prevention measures.
In summary, while the current work successfully identifies and characterizes NP, there is room for future research to focus on quantification methods, ecological impacts, and the sources of NP pollution. These endeavors will contribute to a more comprehensive understanding of the issue and aid in the development of strategies to mitigate the environmental impact of NP contamination.

Supplementary Materials

The following supporting information can be downloaded at the website of this paper posted on Preprints.org. Data file S1.

Author Contributions

Conceptualization, G.T. and A.V.; methodology, J.P.; S.R.; R.L.S.; F.F.; software, A.V.; J.P.; R.L.S.; F.F.; validation, J.P.; S.R.; R.L.S.; F.F.; formal analysis, S.R.; resources, A.V.; G.T.; data curation, J.P.; S.R.; R.L.S.; F.F.; S.R.; writing—original draft preparation, S.R.; G.T.; writing—review and editing, S.R.; A.V.; J.P.; funding acquisition, A.V.; G.T. All authors have read and agreed to the published version of the manuscript.

Funding

This research was funded by the project I-FISH – “Development of an intelligent system for the production, distribution and traceability of functional fish-based foods", presented in the context of Innovation Agreements attributable to the II Pillar of the "Horizon Europe" framework program for research and innovation, referred to in the Regulation (EU) 2021/695 – Italian Ministerial Decree 31.12.2021.

Data Availability Statement

All the data supporting reported results can be found in the paper.

Acknowledgments

The authors gratefully acknowledge the administrative and technical support of the European Commission, Joint Research Centre (JRC), Ispra, Italy.

Conflicts of Interest

The authors declare no conflicts of interest. The funders had no role in the design of the study; in the collection, analyses, or interpretation of data; in the writing of the manuscript; or in the decision to publish the results.

References

  1. Du, H.; Wang, J. Characterization and environmental impacts of microplastics. Gondwana Res. 2021, 98, 63–75. [Google Scholar] [CrossRef]
  2. Erni-Cassola, G.; Zadjelovic, V.; Gibson, M.I.; Christie-Oleza, J.A. Distribution of plastic polymer types in the marine environment; A meta-analysis. J. Hazard. Mater. 2019, 369, 691–698. [Google Scholar] [CrossRef]
  3. Auta, H.S.; Emenike, C.U.; Fauziah, S.H. Distribution and importance of microplastics in the marine environment: A review of the sources, fate, effects, and potential solutions. Environ. Int. 2017, 102, 165–176. [Google Scholar] [CrossRef] [PubMed]
  4. Li, P.; Wang, X.; Su, M.; Zou, X.; Duan, L.; Zhang, H. Characteristics of plastic pollution in the environment: A review. Bull. Environ. Contam. Toxicol. 2020, 107, 577–584. [Google Scholar] [CrossRef] [PubMed]
  5. Murphy, F.; Ewins, C.; Carbonnier, F.; Quinn, B. Wastewater Treatment Works (WwTW) as a source of microplastics in the aquatic environment. Environ. Sci. Technol. 2016, 50, 5800–5808. [Google Scholar] [CrossRef]
  6. Liu, P.; Zhan, X.; Wu, X.; Li, J.; Wang, H.; Gao, S. Effect of weathering on environmental behavior of microplastics: Properties, sorption and potential risks. Chemosphere 2020, 242, 125193. [Google Scholar] [CrossRef] [PubMed]
  7. Jambeck, J.R.; Geyer, R.; Wilcox, C.; Siegler, T.R.; Perryman, M.; Andrady, A.; Narayan, R.; Law, K.L. Plastic waste inputs from land into the ocean. Science (80-. ). 2015, 347, 768–771. [Google Scholar] [CrossRef] [PubMed]
  8. Andrady, A.L. The plastic in microplastics: A review. Mar. Pollut. Bull. 2017, 119, 12–22. [Google Scholar] [CrossRef] [PubMed]
  9. Duis, K.; Coors, A. Microplastics in the aquatic and terrestrial environment: sources (with a specific focus on personal care products), fate and effects. Environ. Sci. Eur. 2016, 28, 1–25. [Google Scholar] [CrossRef] [PubMed]
  10. Horton, A.A.; Walton, A.; Spurgeon, D.J.; Lahive, E.; Svendsen, C. Microplastics in freshwater and terrestrial environments: Evaluating the current understanding to identify the knowledge gaps and future research priorities. Sci. Total Environ. 2017, 586, 127–141. [Google Scholar] [CrossRef]
  11. Borrelle, S.B.; Rochman, C.M.; Liboiron, M.; Bond, A.L.; Lusher, A.; Bradshaw, H.; Provencher, J.F. Why we need an international agreement on marine plastic pollution. Proc. Natl. Acad. Sci. U. S. A. 2017, 114, 9994–9997. [Google Scholar] [CrossRef]
  12. Hirai, H.; Takada, H.; Ogata, Y.; Yamashita, R.; Mizukawa, K.; Saha, M.; Kwan, C.; Moore, C.; Gray, H.; Laursen, D.; et al. Organic micropollutants in marine plastics debris from the open ocean and remote and urban beaches. Mar. Pollut. Bull. 2011, 62, 1683–1692. [Google Scholar] [CrossRef] [PubMed]
  13. Ogata, Y.; Takada, H.; Mizukawa, K.; Hirai, H.; Iwasa, S.; Endo, S.; Mato, Y.; Saha, M.; Okuda, K.; Nakashima, A.; et al. International Pellet Watch: Global monitoring of persistent organic pollutants (POPs) in coastal waters. 1. Initial phase data on PCBs, DDTs, and HCHs. Mar. Pollut. Bull. 2009, 58, 1437–1446. [Google Scholar] [CrossRef] [PubMed]
  14. Van, A.; Rochman, C.M.; Flores, E.M.; Hill, K.L.; Vargas, E.; Vargas, S.A.; Hoh, E. Persistent organic pollutants in plastic marine debris found on beaches in San Diego, California. Chemosphere 2012, 86, 258–263. [Google Scholar] [CrossRef] [PubMed]
  15. Jovanović, B. Ingestion of microplastics by fish and its potential consequences from a physical perspective. Integr. Environ. Assess. Manag. 2017, 13, 510–515. [Google Scholar] [CrossRef]
  16. Wright, S.L.; Kelly, F.J. Plastic and Human Health: A Micro Issue? 2017. [CrossRef]
  17. Yan, W.; Hamid, N.; Deng, S.; Jia, P.P.; Pei, D.S. Individual and combined toxicogenetic effects of microplastics and heavy metals (Cd, Pb, and Zn) perturb gut microbiota homeostasis and gonadal development in marine medaka (Oryzias melastigma). J. Hazard. Mater. 2020, 397, 122795. [Google Scholar] [CrossRef] [PubMed]
  18. Montero, D.; Rimoldi, S.; Torrecillas, S.; Rapp, J.; Moroni, F.; Herrera, A.; Gómez, M.; Fernández-Montero, Á.; Terova, G. Impact of polypropylene microplastics and chemical pollutants on European sea bass (Dicentrarchus labrax) gut microbiota and health. Sci. Total Environ. 2022, 805, 150402. [Google Scholar] [CrossRef] [PubMed]
  19. Ahrendt, C.; Perez-Venegas, D.J.; Urbina, M.; Gonzalez, C.; Echeveste, P.; Aldana, M.; Pulgar, J.; Galbán-Malagón, C. Microplastic ingestion cause intestinal lesions in the intertidal fish Girella laevifrons. Mar. Pollut. Bull. 2020, 151, 110795. [Google Scholar] [CrossRef]
  20. Pedà, C.; Caccamo, L.; Fossi, M.C.; Gai, F.; Andaloro, F.; Genovese, L.; Perdichizzi, A.; Romeo, T.; Maricchiolo, G. Intestinal alterations in European sea bass Dicentrarchus labrax (Linnaeus, 1758) exposed to microplastics: Preliminary results. Environ. Pollut. 2016, 212, 251–256. [Google Scholar] [CrossRef]
  21. Bonfanti, P.; Colombo, A.; Saibene, M.; Motta, G.; Saliu, F.; Catelani, T.; Mehn, D.; La Spina, R.; Ponti, J.; Cella, C.; et al. Microplastics from miscellaneous plastic wastes: Physico-chemical characterization and impact on fish and amphibian development. Ecotoxicol. Environ. Saf. 2021, 225. [Google Scholar] [CrossRef]
  22. Jacob, H.; Besson, M.; Oberhaensli, F.; Taylor, A.; Gillet, B.; Hughes, S.; Melvin, S.D.; Bustamante, P.; Swarzenski, P.W.; Lecchini, D.; et al. A multifaceted assessment of the effects of polyethylene microplastics on juvenile gilthead seabreams (Sparus aurata). Aquat. Toxicol. 2021, 241, 106004. [Google Scholar] [CrossRef]
  23. Jovanović, B.; Gökdağ, K.; Güven, O.; Emre, Y.; Whitley, E.M.; Kideys, A.E. Virgin microplastics are not causing imminent harm to fish after dietary exposure. Mar. Pollut. Bull. 2018, 130, 123–131. [Google Scholar] [CrossRef]
  24. Zeytin, S.; Wagner, G.; Mackay-Roberts, N.; Gerdts, G.; Schuirmann, E.; Klockmann, S.; Slater, M. Quantifying microplastic translocation from feed to the fillet in European sea bass Dicentrarchus labrax. Mar. Pollut. Bull. 2020, 156. [Google Scholar] [CrossRef] [PubMed]
  25. Primpke, S.; Christiansen, S.H.; Cowger, W.; De Frond, H.; Deshpande, A.; Fischer, M.; Holland, E.B.; Meyns, M.; O’Donnell, B.A.; Ossmann, B.E.; et al. Critical Assessment of Analytical Methods for the Harmonized and Cost-Efficient Analysis of Microplastics; 2020; Vol. 74; ISBN 0003702820921.
  26. Fu, W.; Min, J.; Jiang, W.; Li, Y.; Zhang, W. Separation, characterization and identification of microplastics and nanoplastics in the environment. Sci. Total Environ. 2020, 721, 137561. [Google Scholar] [CrossRef]
  27. Araujo, C.F.; Nolasco, M.M.; Ribeiro, A.M.P.; Ribeiro-Claro, P.J.A. Identification of microplastics using Raman spectroscopy: Latest developments and future prospects. Water Res. 2018, 142, 426–440. [Google Scholar] [CrossRef] [PubMed]
  28. Francischini, D.S.; Arruda, M.A.Z. When a picture is worth a thousand words: Molecular and elemental imaging applied to environmental analysis – A review. Microchem. J. 2021, 169, 106526. [Google Scholar] [CrossRef]
  29. Phuong, N.N.; Fauvelle, V.; Grenz, C.; Ourgaud, M.; Schmidt, N.; Strady, E.; Sempéré, R. Highlights from a review of microplastics in marine sediments. Sci. Total Environ. 2021, 777. [Google Scholar] [CrossRef]
  30. Valsesia, A.; Quarato, M.; Ponti, J.; Fumagalli, F.; Gilliland, D.; Colpo, P. Combining microcavity size selection with Raman microscopy for the characterization of Nanoplastics in complex matrices. Sci. Rep. 2021, 11, 1–12. [Google Scholar] [CrossRef] [PubMed]
  31. Caputo, F.; Vogel, R.; Savage, J.; Vella, G.; Law, A.; Della Camera, G.; Hannon, G.; Peacock, B.; Mehn, D.; Ponti, J.; et al. Measuring particle size distribution and mass concentration of nanoplastics and microplastics: addressing some analytical challenges in the sub-micron size range. J. Colloid Interface Sci. 2021, 588, 401–417. [Google Scholar] [CrossRef] [PubMed]
  32. Cooper, D.A.; Corcoran, P.L. Effects of mechanical and chemical processes on the degradation of plastic beach debris on the island of Kauai, Hawaii. Mar. Pollut. Bull. 2010, 60, 650–654. [Google Scholar] [CrossRef]
  33. Mahamud, A.G.M.S.U.; Anu, M.S.; Baroi, A.; Datta, A.; Khan, M.S.U.; Rahman, M.; Tabassum, T.; Tanwi, J.T.; Rahman, T. Microplastics in fishmeal: A threatening issue for sustainable aquaculture and human health. Aquac. Reports 2022, 25, 101205. [Google Scholar] [CrossRef]
  34. Thiele, C.J.; Hudson, M.D.; Russell, A.E.; Saluveer, M.; Sidaoui-Haddad, G. Microplastics in fish and fishmeal: an emerging environmental challenge? Sci. Rep. 2021, 11, 1–12. [Google Scholar] [CrossRef]
  35. Rimoldi, S.; Antonini, M.; Gasco, L.; Moroni, F.; Terova, G. Intestinal microbial communities of rainbow trout (Oncorhynchus mykiss) may be improved by feeding a Hermetia illucens meal/low-fishmeal diet. Fish Physiol. Biochem. 2021, 47, 365–380. [Google Scholar] [CrossRef]
  36. Rimoldi, S.; Terova, G.; Ascione, C.; Giannico, R.; Brambilla, F. Next generation sequencing for gut microbiome characterization in rainbow trout (Oncorhynchus mykiss) fed animal by-product meals as an alternative to fishmeal protein sources. PLoS One 2018, 13, 1–29. [Google Scholar] [CrossRef] [PubMed]
  37. Terova, G.; Rimoldi, S.; Ascione, C.; Gini, E.; Ceccotti, C.; Gasco, L. Rainbow trout (Oncorhynchus mykiss) gut microbiota is modulated by insect meal from Hermetia illucens prepupae in the diet. Rev. Fish Biol. Fish. 2019, 29, 465–486. [Google Scholar] [CrossRef]
  38. Terova, G.; Ceccotti, C.; Ascione, C.; Gasco, L.; Rimoldi, S. Effects of partially defatted Hermetia illucens meal in rainbow trout diet on hepatic methionine metabolism. Animals 2020, 10, 1–13. [Google Scholar] [CrossRef]
  39. Gasco, L.; Acuti, G.; Bani, P.; Dalle Zotte, A.; Danieli, P.P.; De Angelis, A.; Fortina, R.; Marino, R.; Parisi, G.; Piccolo, G.; et al. Insect and fish by-products as sustainable alternatives to conventional animal proteins in animal nutrition. Ital. J. Anim. Sci. 2020, 19, 360–372. [Google Scholar] [CrossRef]
  40. Facchetti, S. V.; La Spina, R.; Fumagalli, F.; Riccardi, N.; Gilliland, D.; Ponti, J. Detection of metal-doped fluorescent pvc microplastics in freshwater mussels. Nanomaterials 2020, 10, 1–14. [Google Scholar] [CrossRef] [PubMed]
  41. Desmet, C.; Valsesia, A.; Oddo, A.; Ceccone, G.; Spampinato, V.; Rossi, F.; Colpo, P. Characterisation of nanomaterial hydrophobicity using engineered surfaces. J. Nanoparticle Res. 2017, 19. [Google Scholar] [CrossRef] [PubMed]
  42. Shen, M.; Liu, S.; Hu, T.; Zheng, K.; Wang, Y.; Long, H. Recent advances in the research on effects of micro/nanoplastics on carbon conversion and carbon cycle: A review. J. Environ. Manage. 2023, 334, 117529. [Google Scholar] [CrossRef]
  43. Parenti, C.C.; Binelli, A.; Caccia, S.; Della Torre, C.; Magni, S.; Pirovano, G.; Casartelli, M. Ingestion and effects of polystyrene nanoparticles in the silkworm Bombyx mori. Chemosphere 2020, 257, 127203. [Google Scholar] [CrossRef]
  44. Cuthbert, R.N.; Al-Jaibachi, R.; Dalu, T.; Dick, J.T.A.; Callaghan, A. The influence of microplastics on trophic interaction strengths and oviposition preferences of dipterans. Sci. Total Environ. 2019, 651, 2420–2423. [Google Scholar] [CrossRef]
  45. Scherer, C.; Wolf, R.; Völker, J.; Stock, F.; Brennhold, N.; Reifferscheid, G.; Wagner, M. Toxicity of microplastics and natural particles in the freshwater dipteran Chironomus riparius: same same but different? Sci. Total Environ. 2020, 711, 134604. [Google Scholar] [CrossRef]
  46. van Oss, C.J. The Extended DLVO Theory. Interface Sci. Technol. 2008, 16, 31–48. [Google Scholar] [CrossRef]
  47. Rahman, T.; Mustakima, S.; Ferdous, Z.; Tabassum, T.; Sofi Uddin Mahamud, A.G.M.; Siddika, M.; Akter, M.; Alam, M.S.; Haque, M.N. Properties and abundance of microplastics found in fish feed, tissues, and culture water of catfish (Heteropneustes fossilis). Int. J. Aquat. Biol. 2022, 10, 1–10. [Google Scholar] [CrossRef]
  48. Matias, R.S.; Gomes, S.; Barboza, L.G.A.; Salazar-Gutierrez, D.; Guilhermino, L.; Valente, L.M.P. Microplastics in water, feed and tissues of European seabass reared in a recirculation aquaculture system (RAS). Chemosphere 2023, 335. [Google Scholar] [CrossRef]
  49. Muhib, M.I.; Rahman, M.M. Microplastics contamination in fish feeds: Characterization and potential exposure risk assessment for cultivated fish of Bangladesh. Heliyon 2023, 9, e19789. [Google Scholar] [CrossRef] [PubMed]
  50. Walkinshaw, C.; Tolhurst, T.J.; Lindeque, P.K.; Thompson, R.; Cole, M. Detection and characterisation of microplastics and microfibres in fishmeal and soybean meal. Mar. Pollut. Bull. 2022, 185, 114189. [Google Scholar] [CrossRef] [PubMed]
  51. Wang, Q.; Li, J.; Zhu, X.; Sun, C.; Teng, J.; Chen, L.; Shan, E.; Zhao, J. Microplastics in fish meals: An exposure route for aquaculture animals. Sci. Total Environ. 2022, 807, 151049. [Google Scholar] [CrossRef] [PubMed]
  52. Gündogdu, S.; Eroldoğan, O.T.; Evliyaoğlu, E.; Turchini, G.M.; Wu, X.G. Fish out, plastic in: Global pattern of plastics in commercial fishmeal. 2020. [CrossRef]
  53. Espinosa, C.; Esteban, M.Á.; Cuesta, A. Dietary administration of PVC and PE microplastics produces histological damage, oxidative stress and immunoregulation in European sea bass (Dicentrarchus labrax L.). Fish Shellfish Immunol. 2019, 95, 574–583. [Google Scholar] [CrossRef]
  54. Herrera, A.; Acosta-Dacal, A.; Pérez Luzardo, O.; Martínez, I.; Rapp, J.; Reinold, S.; Montesdeoca-Esponda, S.; Montero, D.; Gómez, M. Bioaccumulation of additives and chemical contaminants from environmental microplastics in European seabass (Dicentrarchus labrax). Sci. Total Environ. 2022, 822. [Google Scholar] [CrossRef] [PubMed]
  55. Compa, M.; Ventero, A.; Iglesias, M.; Deudero, S. Ingestion of microplastics and natural fibres in Sardina pilchardus (Walbaum, 1792) and Engraulis encrasicolus (Linnaeus, 1758) along the Spanish Mediterranean coast. Mar. Pollut. Bull. 2018, 128, 89–96. [Google Scholar] [CrossRef] [PubMed]
  56. Batel, A.; Linti, F.; Scherer, M.; Erdinger, L.; Braunbeck, T. Transfer of benzo[a]pyrene from microplastics to Artemia nauplii and further to zebrafish via a trophic food web experiment: CYP1A induction and visual tracking of persistent organic pollutants. Environ. Toxicol. Chem. 2016, 35, 1656–1666. [Google Scholar] [CrossRef] [PubMed]
  57. Legislation on Food Contact Union Guidelines on Regulation ( EU ) No 10 / 2011 on plastic materials and articles intended to come into contact with food as regards information in the supply chain. 2016, Version 1., 1–45.
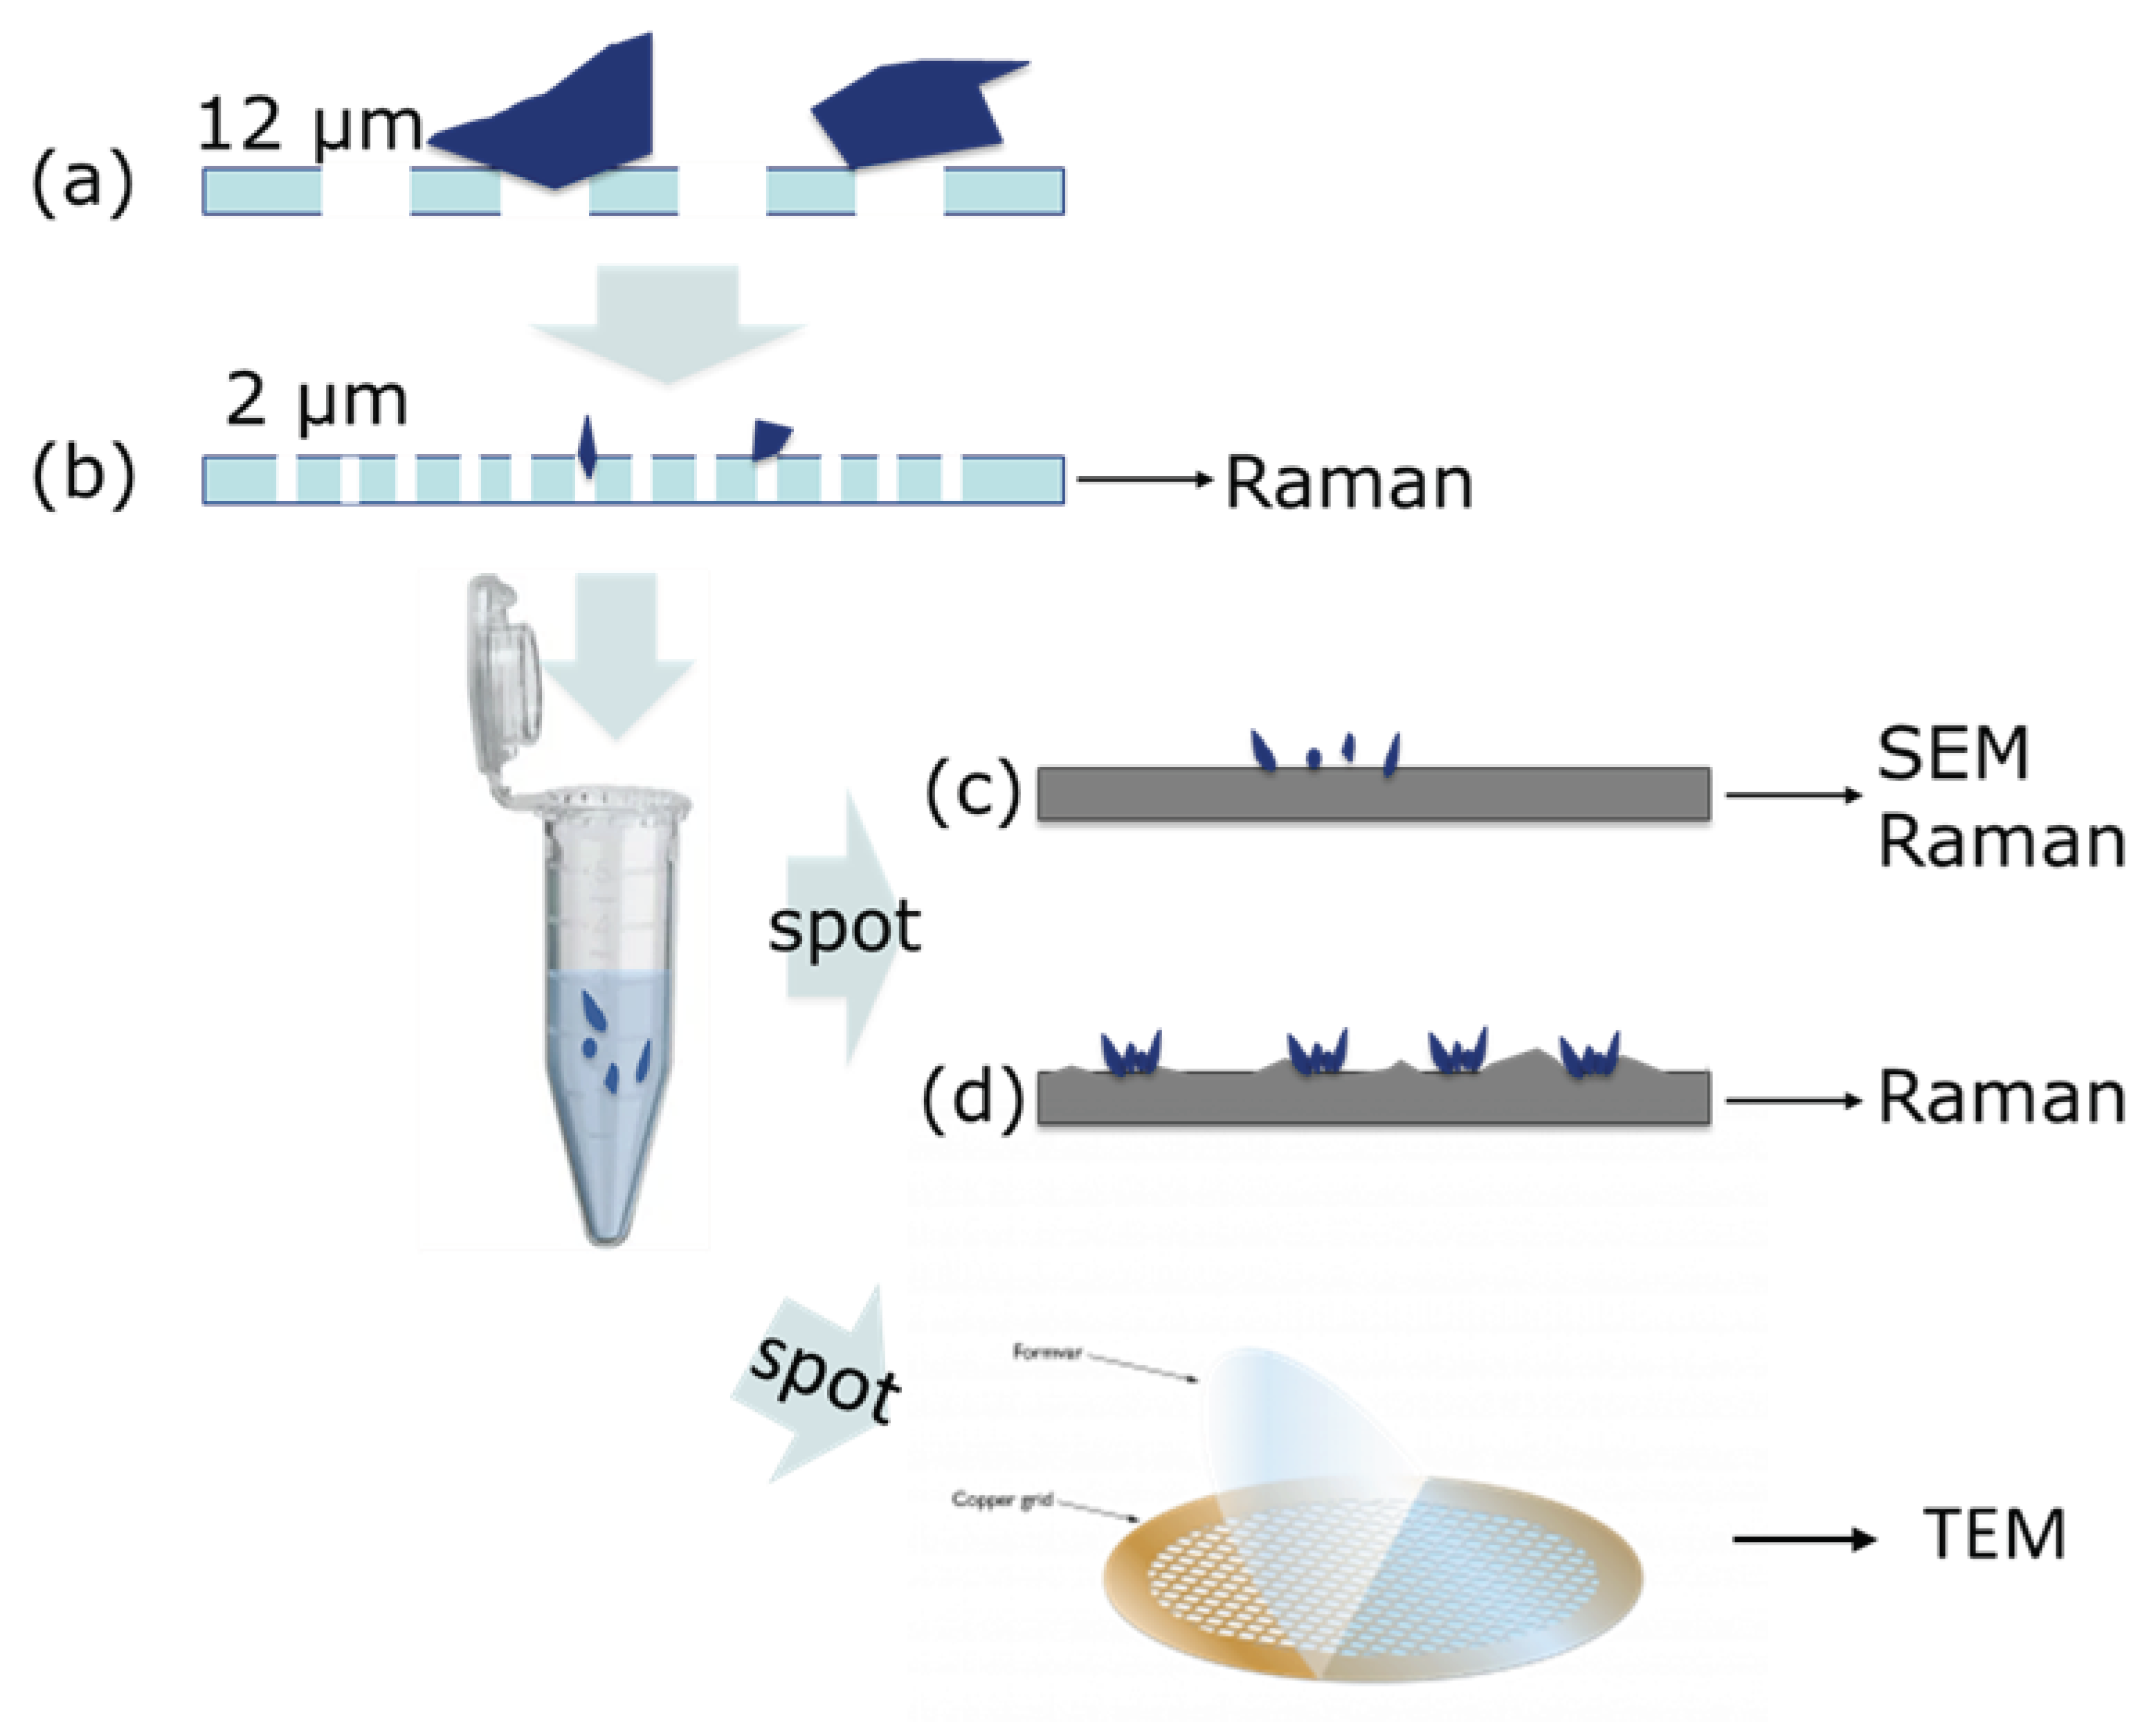
Figure 1. Scheme for the detection of “small” MP and NP in fishmeal samples.
Preprints 101846 g001
Figure 2. Insect meal sample after (a) digestion with potassium hydroxide (KOH) at 60°C; and (b) filtration on a polycarbonate filter with 2 µm pore size.
Preprints 101846 g002
Figure 3. Identification of MP extracted from insect meal using CRM: (a) Raman map image of a single particle (dotted) and its relative confocal Raman spectrum; (b). The spectrum of the selected object (white) was compared with the original reference spectrum (red). (Open Specy v0.9.3).
Preprints 101846 g003
Figure 4. SEM-RAMAN comparison: The white dots in the Raman correspond to a good match with the PE spectrum.
Preprints 101846 g004
Figure 5. High-resolution Raman map of a few particles on the T5 surface. NP (<1µm) were detected.
Preprints 101846 g005
Figure 6. Sample filtered < 2 µm (NP fraction) and blotted over a superhydrophobic surface to cause aggregation of the particles. The white areas correspond to the PE particles.
Preprints 101846 g006
Figure 7. Electron microscopic analysis of the suspension of digested insect meal. Images taken in TEM and STEM modes and the corresponding carbon map analysis are reported. Representative TEM images of the sample containing a small amount of matrix under which particles can be seen (arrow). Both whole pieces (b, c, d) and agglomerates/aggregates (a, e) can be seen. It is possible to observe the heterogeneous shape and the irregular edges of the MP. The STEM images are analyzed with EDX and show the map of carbon distribution (red).
Preprints 101846 g007
Disclaimer/Publisher’s Note: The statements, opinions and data contained in all publications are solely those of the individual author(s) and contributor(s) and not of MDPI and/or the editor(s). MDPI and/or the editor(s) disclaim responsibility for any injury to people or property resulting from any ideas, methods, instructions or products referred to in the content.
Copyright: This open access article is published under a Creative Commons CC BY 4.0 license, which permit the free download, distribution, and reuse, provided that the author and preprint are cited in any reuse.
Alerts
Prerpints.org logo

Preprints.org is a free preprint server supported by MDPI in Basel, Switzerland.

Subscribe

© 2025 MDPI (Basel, Switzerland) unless otherwise stated