
Submitted:
20 March 2024
Posted:
26 March 2024
You are already at the latest version
Abstract
Enhancing energy efficiency within the building sector is imperative to curbing energy losses, given that this sector alone contributes to over 34% of global energy consumption. Employing a building management system, along with its regular updates, presents a strategic avenue to decrease energy usage, enhance building energy efficiency, and more. Tailored control strategies, aligned with the unique characteristics and usage patterns of each building, are essential for achieving energy savings. This article presents an evaluation of HVAC system efficiency in office buildings, utilizing a data-driven approach coupled with simulations conducted in IDA ICE software. The research explores the control strategy of an office building equipped with a constant air volume HVAC system, featuring a regularly controlled air handling unit. The objective is to boost energy efficiency while striking a balance between occupant comfort and energy consumption. Findings indicate that by analyzing measured data and adjusting configurable parameters, building energy consumption can be significantly reduced. Close monitoring of indoor parameters by building operators and corresponding adjustments to the HVAC system can yield energy savings of up to 16%. Leveraging these insights, the paper suggests integrating data-driven and dynamic simulation methods into building management system models to optimize HVAC systems, enhance energy efficiency, and advance ambitious carbon neutrality objectives.
Keywords:
Building management system
; HVAC
; energy efficiency
; energy savings
; optimization
; data-driven
1. Introduction
In the last twenty years, significant factors such as advancements in technology, environmental concerns, and financial as well as energy crises have exerted a profound impact on global economic development and regional politics [1]. Energy matters have emerged as a crucial element influencing sustainable development on a global scale. Energy is indispensable for both production and sustaining human life. Global energy consumption has been steadily increasing at an average annual rate of 1.8% over the past decade [2].
In Europe, as well as globally, regulatory measures are being implemented to gradually eliminate the utilization of fossil fuels for energy generation. The RePowerEU plan [3] endorsed by the European Commission, seeks to reduce the EU's reliance on Russian fuel and address the climate emergency. This strategy includes initiatives to improve energy efficiency, expand the spectrum of energy sources and accelerate the integration of renewable energy alternatives to achieve climate neutrality by 2050 [4].
As per The Global Status Report for Buildings and Construction (2022), the buildings and construction sector constituted over 34% of global final energy usage, with heating, ventilation, and air conditioning (HVAC) systems and associated energy-intensive appliances contributing to more than two-thirds of building energy consumption [5]. These figures make building energy efficiency one of the European Commission's top priorities for its transformation policy under the European Green Deal [6].
Ineffectively operating HVAC systems cause notable environmental problems because of their high energy consumption and inefficient operation [7]. Studies [8,9] indicates that HVAC systems are responsible for around 40% of total energy consumption in commercial buildings, making a substantial contribution to greenhouse gas emissions and the progression of climate change. Ineffective HVAC systems additionally play a role in indoor air quality concerns, potentially leading to occupant’s well-being and health issues [10,11]. HVAC - related loads is affected by many elements: building type and location, local climate, occupancy level, equipment efficiency, thermostat settings, and building controls [12,13]. Indeed, a comprehensive examination of each of these influential factors can result in pinpointing distinct opportunities for energy savings. The HVAC aim in commercial buildings is to uphold a comfortable and secure environment for occupants, equipment, and the building itself [14]. Thus, the minimum standards must ensure the functionality and safety of building construction ang engineering and technical systems, such as preventing pipes from freezing and walls from mold, etc.) [15]. Although, many contemporary buildings prioritize air conditioning for maximum occupancy rather than tailoring it to actual usage and needs. A prevalent control strategy for HVAC systems still relies on predetermined or fixed schedules that overlook occupancy patterns [16]. Specifically, significant energy savings without discomfit can be achieved by reducing the set point, especially during idle periods. Research indicates that even minor adjustments to the set point can lead to energy savings of up to 30% in buildings [17].
New building energy consumption standards [18]and regulatory measures [3] aimed at sustainable resource usage necessitate a shift in the management of energy systems. Efficient management of buildings is crucial, balancing the need for occupant comfort with minimizing energy consumption. The integration of IoT sensors, remote control capabilities, digitization of energy data, and real-time automated decision-making has spurred the creation of innovative energy management systems (EMS) for buildings, microgrids etc.[19]. A building management system (BMS) serves as a strategic approach to address these challenges, mitigating impacts, optimizing energy supply and demand, enhancing building energy efficiency, and achieving other objectives [20]. A BMS is a sophisticated control system implemented in a building to monitors and regulate its mechanical and electrical components, including ventilation, lighting, electrical infrastructure, and HVAC systems [21]. Ideally the BMS will operate the building itself. But in real live a lot of building have outdated BMS [20]which cannot analyze indoor parameters and manage some building systems, for example, ventilation and air conditioning.
This study investigates the performance of HVAC systems and potential energy savings by analyzing scheduling data from a constant air volume ventilation system. The study examines the base load, representing energy consumption during inactive periods, and quantifies potential savings by effectively adjusting set points during these times. Additionally, CO2 level measurements are conducted to ensure that turning off the system does not compromise indoor comfort for occupants. Results showcasing potential savings are demonstrated specifically for an office building. While previous research has touched upon studies of office buildings [22,23], there has been no comprehensive exploration of occupant comfort and CO2 concentration measurements. Although this approach is complex, requiring the installation of sensors to measure indoor CO2 levels, it offers a deeper understanding of variables such as building type and occupancy, providing a unique perspective on the value of reducing base load without sacrificing indoor comfort quality. The European Union has already formulated recommendations for comprehensive ventilation and heating system requirements, which include maximum CO2 concentration levels in rooms, a measure already adopted in some countries and under development in others [24]. The Covid-19 pandemic worldwide has prompted the assessment of indoor air quality indicators in public buildings, impacting not only the health but also the comfort of occupants.
2. Materials and Methods
Ventilation and air conditioning systems cause the most problems in efficient building management and at the same time are the main element in ensuring the comfort of occupants. Modern ventilation and air condition system is variable air volume (VAV) HVAC system which allows to adjust air flow in each room of the building and due that allows to make a lot of comfort zones. Each zone has a unique parameters of temperature requirements, occupancy, internal heat gains and pollution. And VAV system with the help of sensors and modern BMS is capable to create comfortable working conditions by supplying a required and unique for each room amount of air in automatic mode without human assistance. But in most cases constant air volume (CAV) HVAC system was chosen due to initial cost of the VAV system. Unlike the VAV system, CAV system provides a certain amount of air which was calculated during system design. Some adjustments can be done but they will affect rooms. In CAV system the amount of supplied air can be adjusted by power reduction of main air handling unit (AHU). In result high comfort requirements of one room will negatively affect on energy consumption of whole building. New CAV ventilation system setting adjustment using air damper regulation can be done but this procedure needs to be done for whole building and not always possible because of ventilations system constructions and used equipment.
Most CAV systems work according to schedules. AHU turns on in the morning, turns off late at night. In ideal case air flow needs to be adjusted in accordance with occupancy, but in most building, AHU works with constant air flow all day long. This drawback leads to an increased HVAC energy consumption and unnecessary comfort conditions.
The decision challenge discussed here revolves around the energy efficiency of the office building complex illustrated in Figure 1. The referenced building is located in the Riga, Latvia.
Only one building was simulated for the case study (the one on the left in the photo). This building consists of four stories, with office spaces occupying floors 1 through 4, along with underground parking. The total area of the building is 1806 square meters, accommodating a total of 20 office workers.
The foundation and ceilings of buildings consist of reinforced concrete, walls consist of glass walls and reinforced concrete, roof consist of flexible sheet materials. Electricity consumption of the building is 327 kWh/m2 per year, but gas consumption for heating – 134 kWh/m2 per year.
Ventilation in the building is provided by two modular air handling units. Air conditioning in the building is provided by five conditioning systems. Office building is equipped with CAV HVAC system with schedule AHU control. The diagram of ventilation working schedule during week is shown in Figure 2. On working days AHU turns on at 7:00 and works with 70% of maximum air flow until 21:00. During night AHU is turned off. On weekend at Sunday
As usually happens, design occupancy and real occupancy vary greatly. In result CO2 production from occupants is significantly different from design. In Figure 3 is shown one of the office room real CO2 concentrations in air during measurements. In Figure 4 the same office CO2 concentration is considered during a typical workweek. From measurements can be concluded that the mean peak CO2 in the office is around 800 ppm on working days. Maximum value for CO2 ir 1126 and unusually high concentration of CO2 is only one day from measured days. Peaks values observed in time period from 12:00 to 15:00. However, 800 ppm of CO2 is a good air quality result for the office. ASHRAE and World Health Organization recommends to maintain CO2 concentration under 1000 ppm [25], [26]. But for energy consumption decreasing maximum CO2 concentration can be increased.
As shown in Figure 5, ventilation system turns on at 7:00 at CO2 concentration around 400 ppm, which is typical outdoor CO2 concentration. Same situation is in the end of a day - at 18:00 at CO2 concentration around 450 ppm. This indicates that there is excess of supply air. For energy saving AHU schedule can be adjusted and can be turned on, for example, at 9:00, when office workers start working, and at 16:00 can be turned off while occupants finishing work. During night CO2 concentration will naturally decrease.
3. Results
For theory testing office room model was created in building performance simulation program IDA ICE [27]. Typical Latvian office was chosen (Figure 6). Office area is 147.4 m2 and room height 3.14 m. Simulation model was made according to standard “Energy performance of buildings” [28]. The number of employees is 28 (≈ 5 m2/pers.) and for single office metabolic rate of people is 118 W/pers. or 1.127 MET. Occupancy was chosen according to standard EN 16798 and it is shown in Figure 7. Supply airflow is calculated for II category low-polluted building and is 2.03 l/s*m2 or 7.2 m3/h*m2.
Several simulations have been done. Energy consumption and CO2 level in office room under EN 16798 and researched office AHU working schedules were compared. Each schedule was edited by changing the star and end times of work. Results is shown in Table 2. In results, for EN16798 AHU working schedule reducing operating time by one hour is an acceptable measure of decreasing energy consumption. For period of 6 month potential energy savings is 451 kWh. At the same time maximum CO2 value is under ASHRAE recommended border. After reducing operating time by two hours in EN16798 schedule, CO2 level at the morning will influence workers and this operating time reduction not recommended for use. After reducing operating time by one hours in the morning and three hours in evening in researched office AHU working schedules almost the same results were received – ventilation operating time reduction does not effect on comfort of occupants and energy savings is 451 kWh. After reducing operating time by two hours in the morning and evening working conditions become unsatisfactory.
It can be stated that the simple analysis of measured data and editing available changeable parameters can be used for building energy consumption reduction. If the building operator monitors the indoor parameters in detailed and adjust the HVAC system according to them, 16% of energy savings easily can be done. However, building must be equipped with sensors for historical data collection and the use of the building must be with the same appointment - without any significant changes in indoor parameters, occupancy and occupant behaviour.
4. Discussion
In Figure 8 is shown block diagram of building management. A special role is played by ensuring a high level of comfort for occupants and at the same time ensuring the most efficient use of energy. To maintain this, it is necessary to monitoring indoor parameters such as temperature, humidity and CO2 level. It is important to ensure that they are within acceptable values for workers. At the same time, it is necessary to monitor the number of workers and create comfort environment only at an occupied hour. Also, occupants’ behaviour can impact on indoor parameters, for example, light physical activities can increase all indoor parameters. Building operator must adjust HVAC setting for actual occupants needs. Historical data and search for behaviour patterns can be used for creating a unique for each building systems schedules.
5. Conclusions
Office buildings present significant opportunities for reducing energy usage through relatively straightforward adjustments to their cooling and control systems. In this study, potential savings were analyzed and quantified using a data-driven methodology combined with simulations conducted in IDA ICE software. The analysis involved examining the building's overall energy consumption under its current HVAC system schedule and comparing it to an optimized schedule that factored in office occupancy patterns, actual and optimal base loads. Additionally, changes in CO2 concentration based on HVAC system operation were evaluated. The findings indicate that by employing the developed approach to optimize HVAC system operation, energy savings of up to 16% can be easily achieved while maintaining a balance between occupant comfort and efficient energy consumption. This approach can be applied to each building even with simplest HVAC system.
Author Contributions
Conceptualization, A.B. and A.K.; methodology, A.B.; software, A.P.; validation, A.P., K.L. formal analysis, A.P.; investigation, A.P.; resources, A.K.; data curation, K.L.; writing—original draft preparation, K.L.; writing—review and editing, A.P.; visualization, A.P.; supervision, AK.; project administration, A.K.; funding acquisition, A.K. All authors have read and agreed to the published version of the manuscript.
Funding
Nr.5.1.1.2.i.0/1/22/A/ CFLA/001 co-funded by the Recovery and Resilience Facility
Institutional Review Board Statement
Not applicable.
Informed Consent Statement
Not applicable.
Data Availability Statement
Not applicable.
Acknowledgments
This research (nosaukums) is being conducted based on agreement with SIA “ETKC” (Centre of Competence for Energy and Transportation) within the framework of project Nr.5.1.1.2.i.0/1/22/A/ CFLA/001 co-funded by The Recovery and Resilience Facility.
Conflicts of Interest
The authors declare no conflicts of interest.
References
- L. Wu, C. Zhu, and G. Wang, “The impact of green innovation resilience on energy efficiency: A perspective based on the development of the digital economy,” J Environ Manage, vol. 355, p. 120424, Mar. 2024. [CrossRef]
- J. Wang, W. Yang, Y. Zhang, T. Ren, and S. Liang, “Research on energy consumption evaluation and energy saving and carbon reduction measures for typical general hospitals in hot summer and warm winter regions,” Energy for Sustainable Development, vol. 79, p. 101381, Apr. 2024. [CrossRef]
- European Commission, “REPowerEU Plan,” 2022.
- J. Rosenow, “Europe on the way to net zero: What challenges and opportunities?,” PLOS Climate, vol. 1, no. 7, 2022. [CrossRef]
- “Tracking progress | Globalabc.” Accessed: Mar. 04, 2024. [Online]. Available: https://globalabc.org/our-work/tracking-progress-global-status-report.
- European Commission, “The European Green Deal,” The European Green Deal. Accessed: Mar. 06, 2024. [Online]. Available: https://commission.europa.eu/strategy-and-policy/priorities-2019-2024/european-green-deal_en.
- R. Kathiravel, S. Zhu, and H. Feng, “LCA of net-zero energy residential buildings with different HVAC systems across Canadian climates: A BIM-based fuzzy approach,” Energy Build, vol. 306, p. 113905, Mar. 2024. [CrossRef]
- P. Gobinath, R. H. Crawford, M. Traverso, and B. Rismanchi, “Life cycle energy and greenhouse gas emissions of a traditional and a smart HVAC control system for Australian office buildings,” Journal of Building Engineering, vol. 82, p. 108295, Apr. 2024. [CrossRef]
- Z. Pang, Z. O’Neill, Y. Chen, J. Zhang, H. Cheng, and B. Dong, “Adopting occupancy-based HVAC controls in commercial building energy codes: Analysis of cost-effectiveness and decarbonization potential,” Appl Energy, vol. 349, 2023. [CrossRef]
- Borodinecs A., J. Zemitis, and A. Palcikovskis, “HVAC System Control Solutions Based on Modern IT Technologies: A Review Article,” Energies (Basel), vol. 15, no. 18, 2022. [CrossRef]
- R. Lavanya, C. Murukesh, and N. R. Shanker, “Development of Machine Learning Based Microclimatic HVAC System Controller for Nano Painted Rooms Using Human Skin Temperature,” Journal of Electrical Engineering and Technology, vol. 18, no. 3, 2023. [CrossRef]
- Z. Deng and Q. Chen, “Impact of occupant behavior on energy use of HVAC system in offices,” in E3S Web of Conferences, 2019. [CrossRef]
- Z. Afroz, M. Goldsworthy, and S. D. White, “Energy flexibility of commercial buildings for demand response applications in Australia,” Energy Build, vol. 300, 2023. [CrossRef]
- T. Kitzberger, J. Kotik, and T. Pröll, “Energy savings potential of occupancy-based HVAC control in laboratory buildings,” Energy Build, vol. 263, 2022. [CrossRef]
- M. M. Ouf, W. O’Brien, and B. Gunay, “On quantifying building performance adaptability to variable occupancy,” Build Environ, vol. 155, 2019. [CrossRef]
- T. Li et al., “A systematic review and comprehensive analysis of building occupancy prediction,” Renewable and Sustainable Energy Reviews, vol. 193, p. 114284, Apr. 2024. [CrossRef]
- Ghahramani A., K. Zhang, K. Dutta, Z. Yang, and B. Becerik-Gerber, “Energy savings from temperature setpoints and deadband: Quantifying the influence of building and system properties on savings,” Appl Energy, vol. 165, 2016. [CrossRef]
- “Energy performance of buildings directive.” Accessed: Mar. 07, 2024. [Online]. Available: https://energy.ec.europa.eu/topics/energy-efficiency/energy-efficient-buildings/energy-performance-buildings-directive_en.
- F. D. Agbajor, M. C. Mewomo, V. B. Umoh, and S. A. Makanjuola, “Building energy management system research in South Africa—A decade overview,” Energy Reports, vol. 9, 2023. [CrossRef]
- D. Mariano-Hernández, L. Hernández-Callejo, A. Zorita-Lamadrid, O. Duque-Pérez, and F. Santos García, “A review of strategies for building energy management system: Model predictive control, demand side management, optimization, and fault detect & diagnosis,” Journal of Building Engineering, vol. 33. 2021. [CrossRef]
- G. Bianco, F. Delfino, G. Ferro, M. Robba, and M. Rossi, “A hierarchical Building Management System for temperature’s optimal control and electric vehicles’ integration,” Energy Conversion and Management: X, vol. 17, 2023. [CrossRef]
- Khalilnejad A., R. H. French, and A. R. Abramson, “Data-driven evaluation of HVAC operation and savings in commercial buildings,” Appl Energy, vol. 278, 2020. [CrossRef]
- Y. Zhou, Z. Shi, Z. Shi, Q. Gao, and L. Wu, “Disaggregating power consumption of commercial buildings based on the finite mixture model,” Appl Energy, vol. 243, 2019. [CrossRef]
- P. Carrer et al., “ European Collaborative Action - Urban Air, Indoor Environment and Human Exposure, Report No 30, Framework for health-based ventilation guidelines in Europe,” Luxembourg, 2020.
- “WHO Guidelines on Indoor Air Quality and the Role of Air Quality Monitors - HibouAir.” Accessed: Mar. 07, 2024. [Online]. Available: https://www.hibouair.com/blog/who-guidelines-on-indoor-air-quality-and-the-role-of-air-quality-monitors/.
- Persily A. et al., “ASHRAE’s New Position Document on Indoor Carbon Dioxide,” in 17th International Conference on Indoor Air Quality and Climate, INDOOR AIR 2022, 2022.
- “Building Performance - Simulation Software | EQUA.” Accessed: Jan. 18, 2024. [Online]. Available: https://www.equa.se/en/.
- LVS, EN 16798-1:2019 Energy performance of buildings - Ventilation for buildings - Part 1: Indoor environmental input parameters for design and assessment of energy performance of buildings addressing indoor air quality, thermal environment, lighting and acous. 2019.
Figure 1.
The office building complex of the case study (author photo).
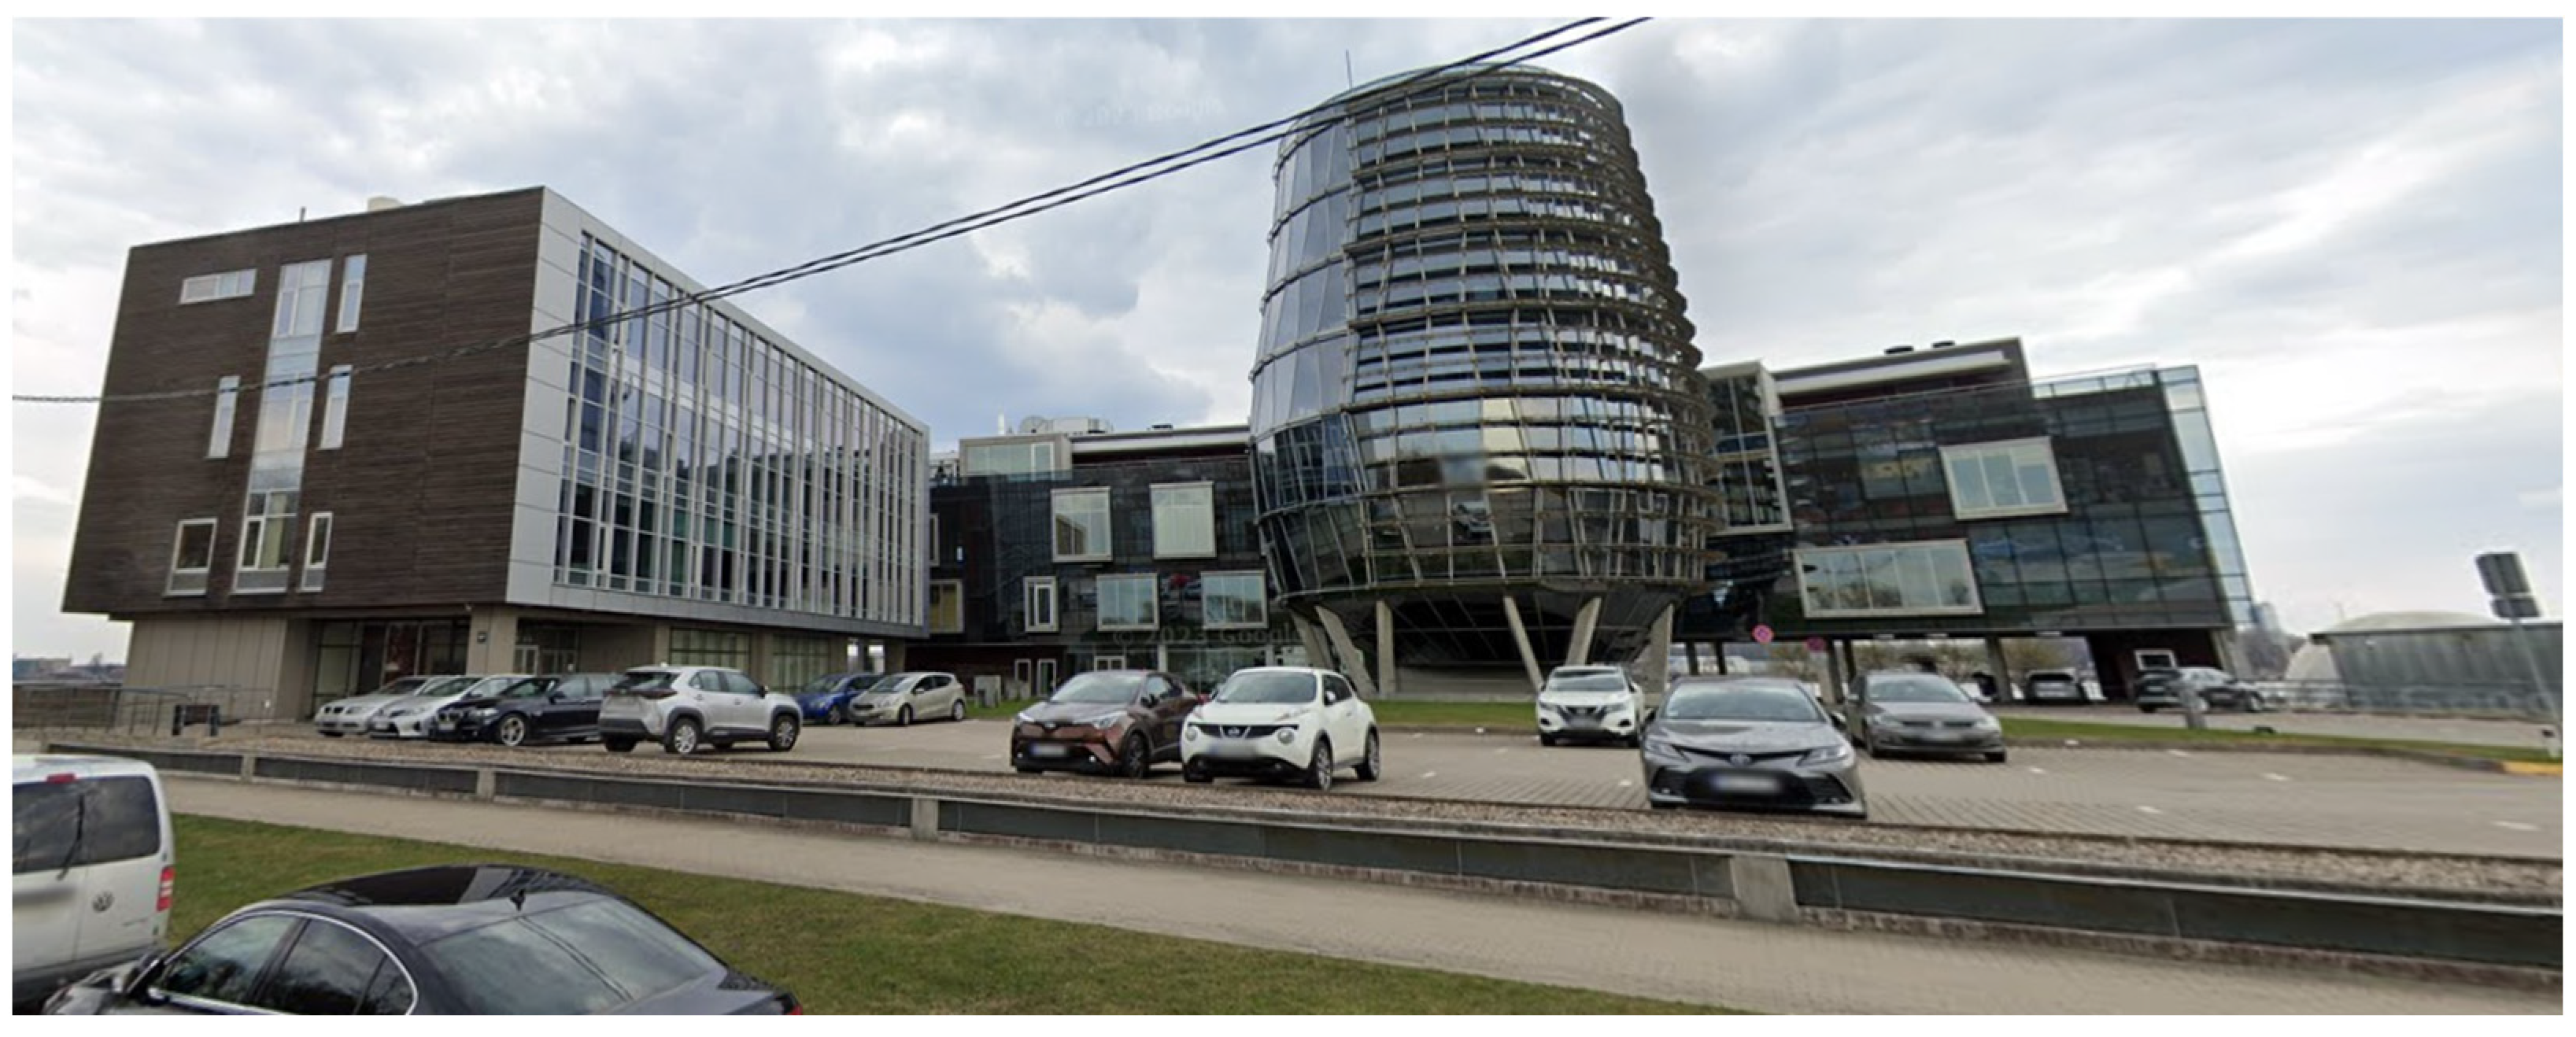
Figure 2.
CAV ventilation system working schedule during week.
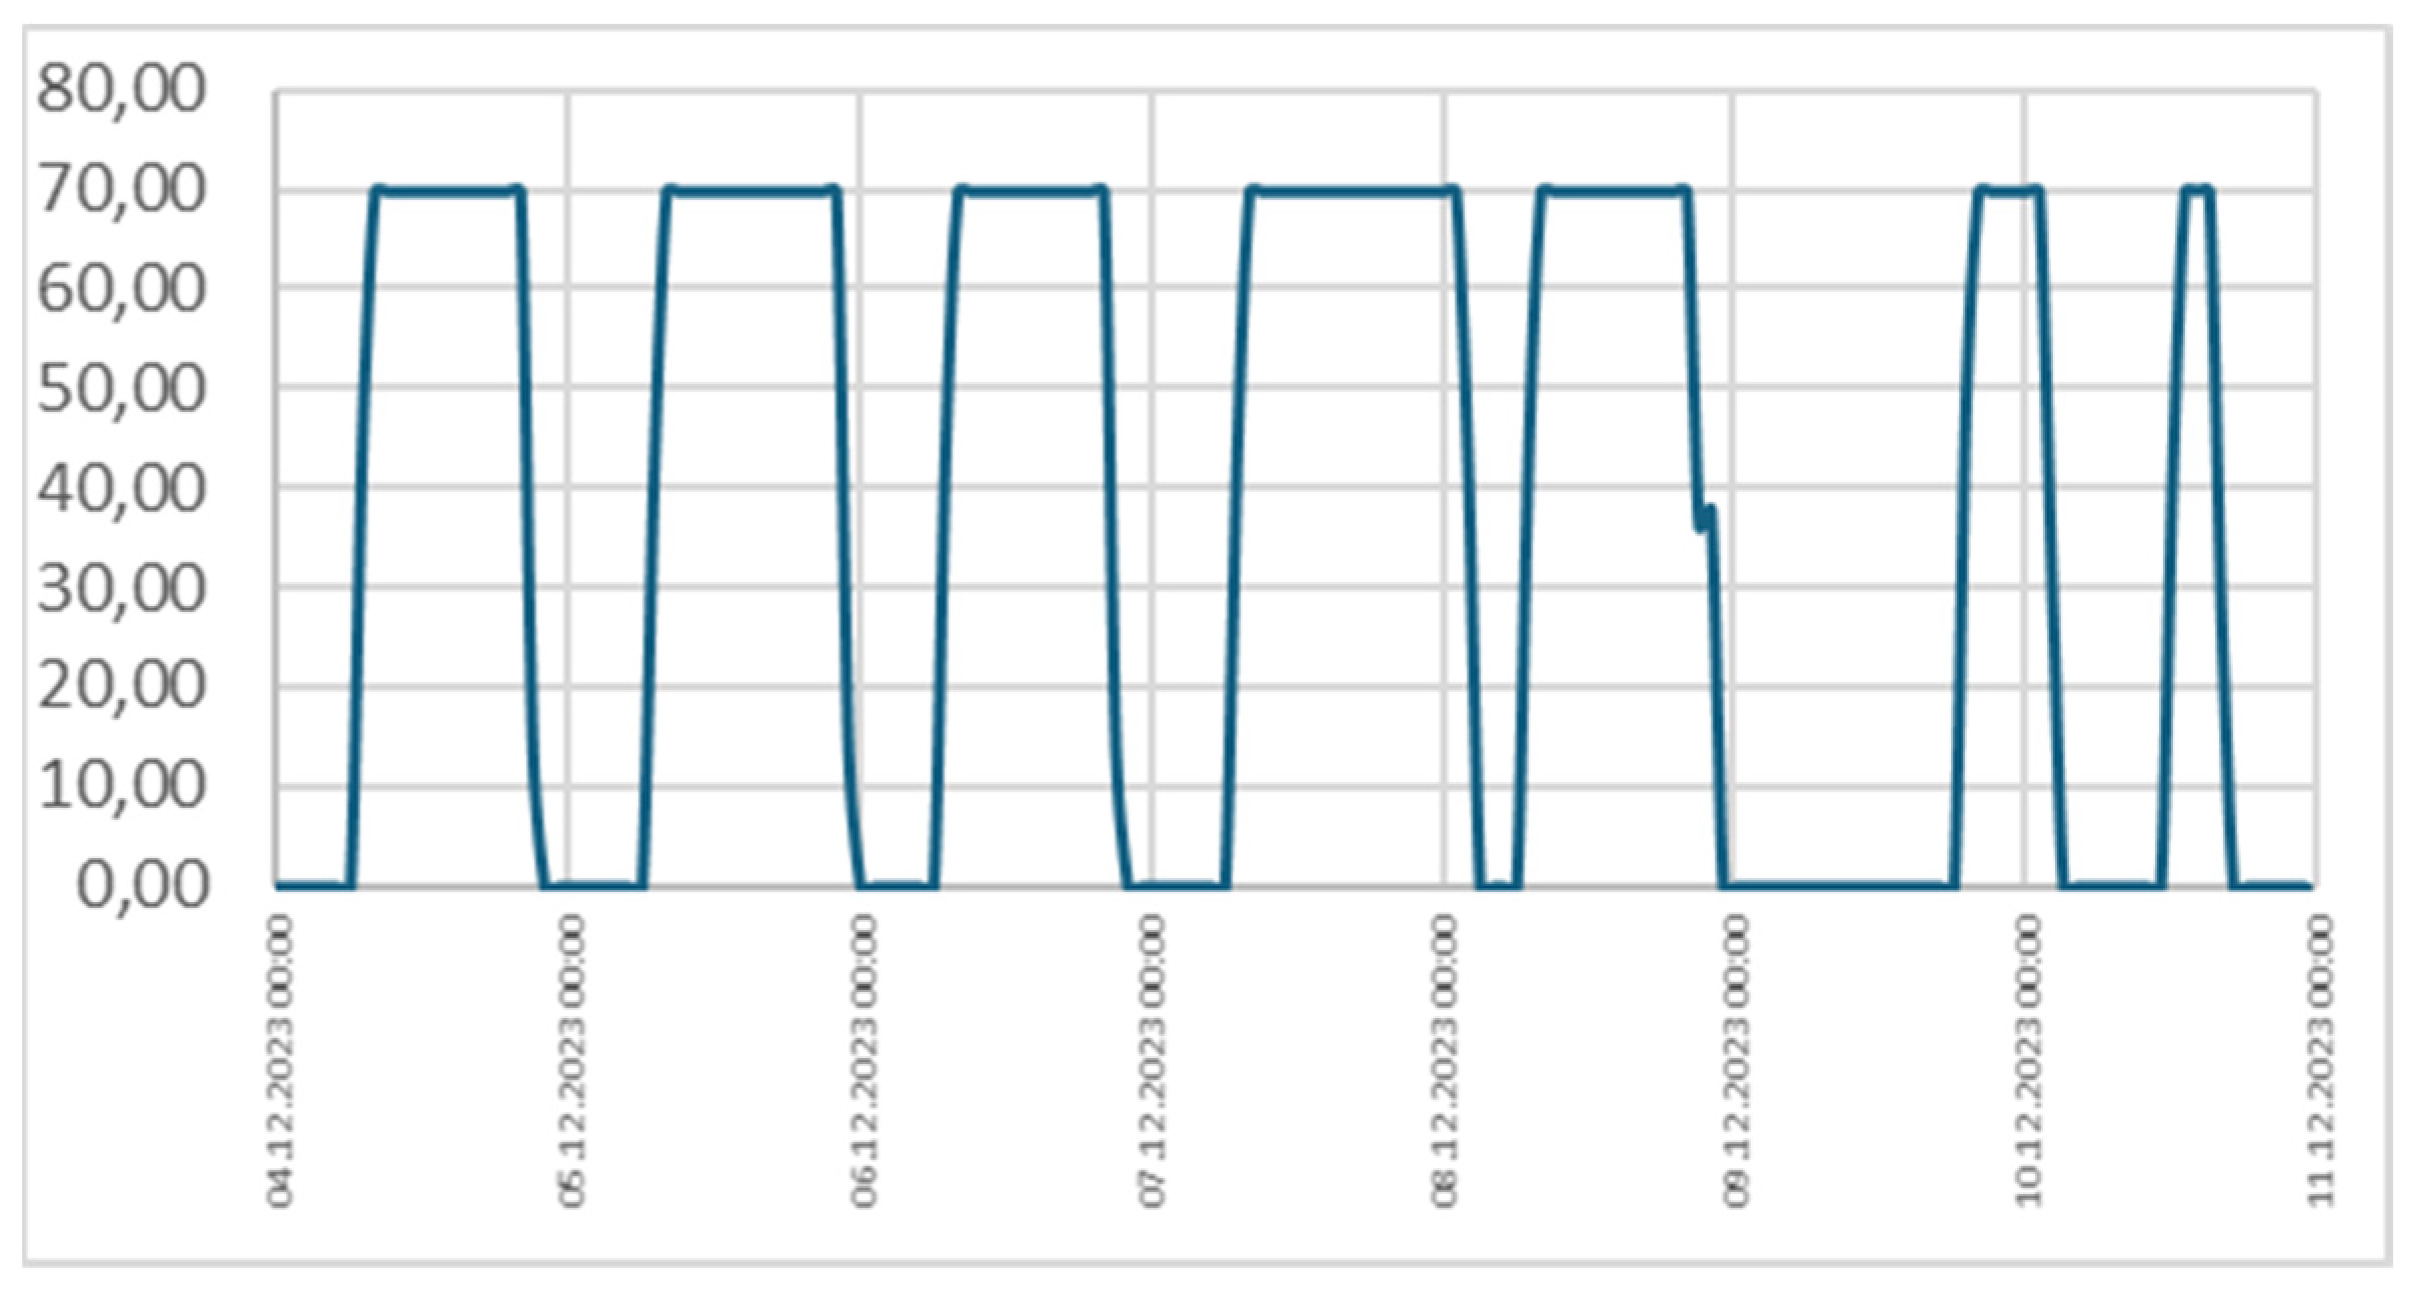
Figure 3.
CO2 concentration in one office and ventilation system working schedule.
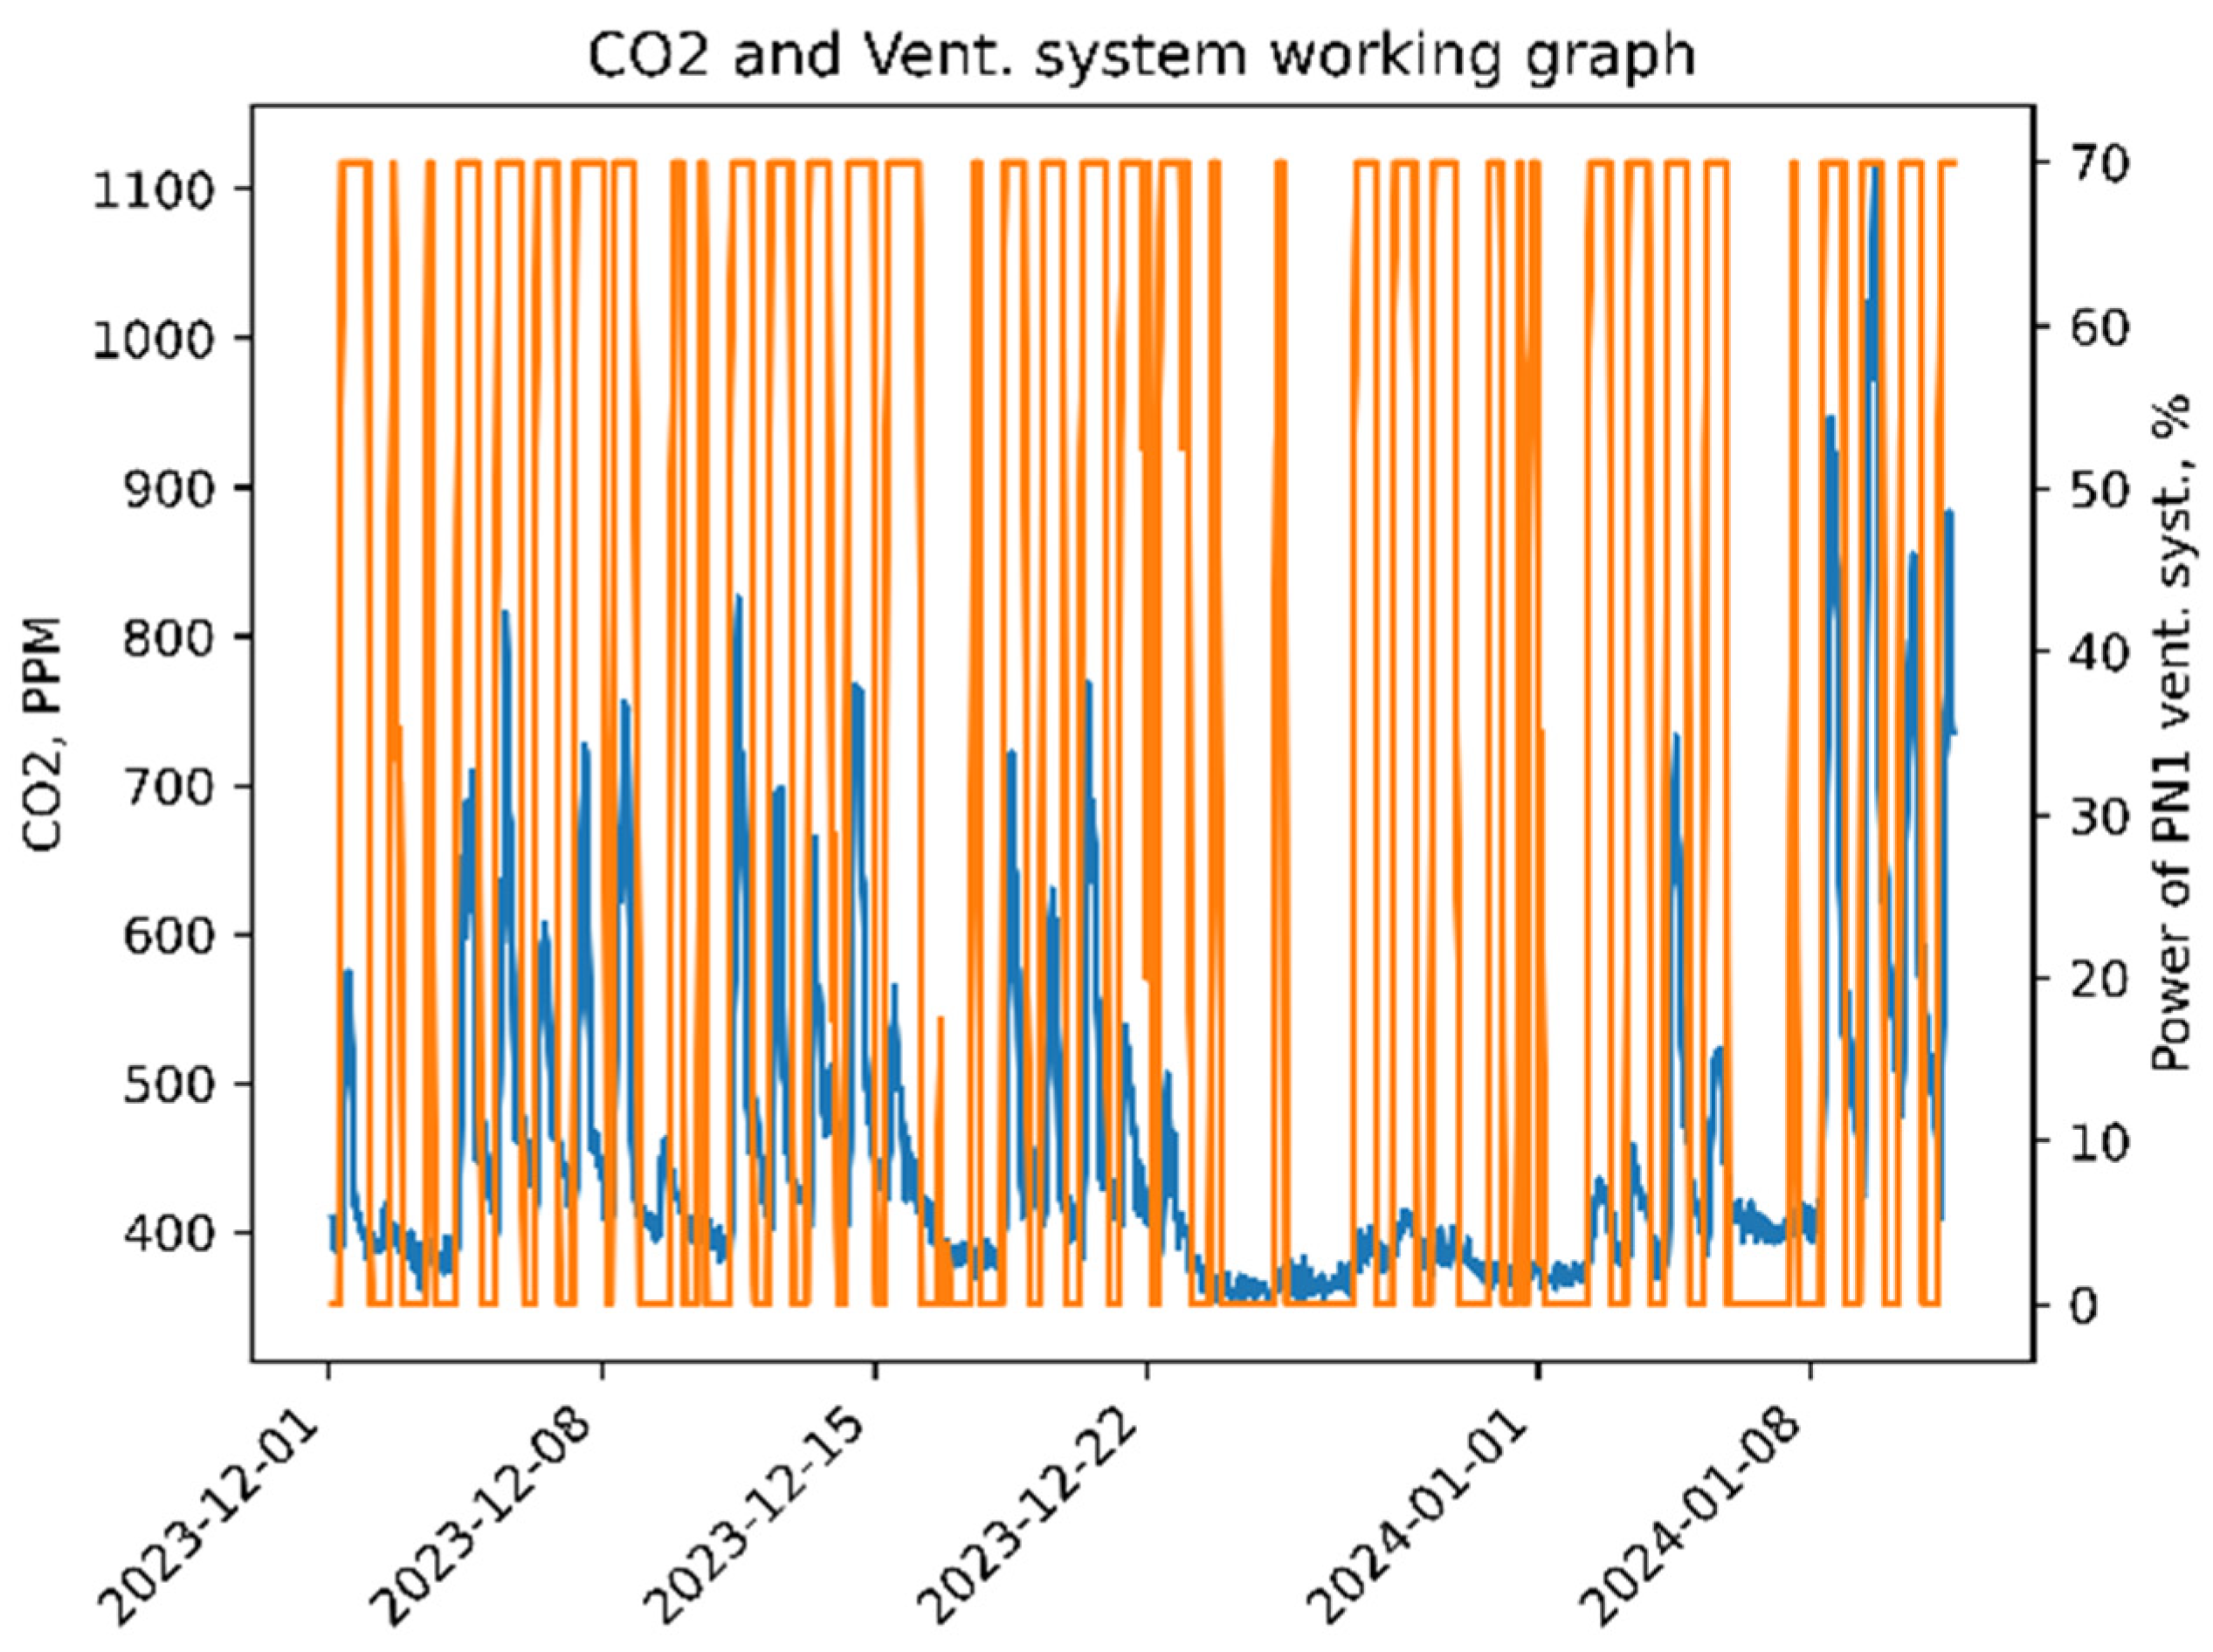
Figure 4.
CO2 concentration in one office and ventilation system working schedule during week.
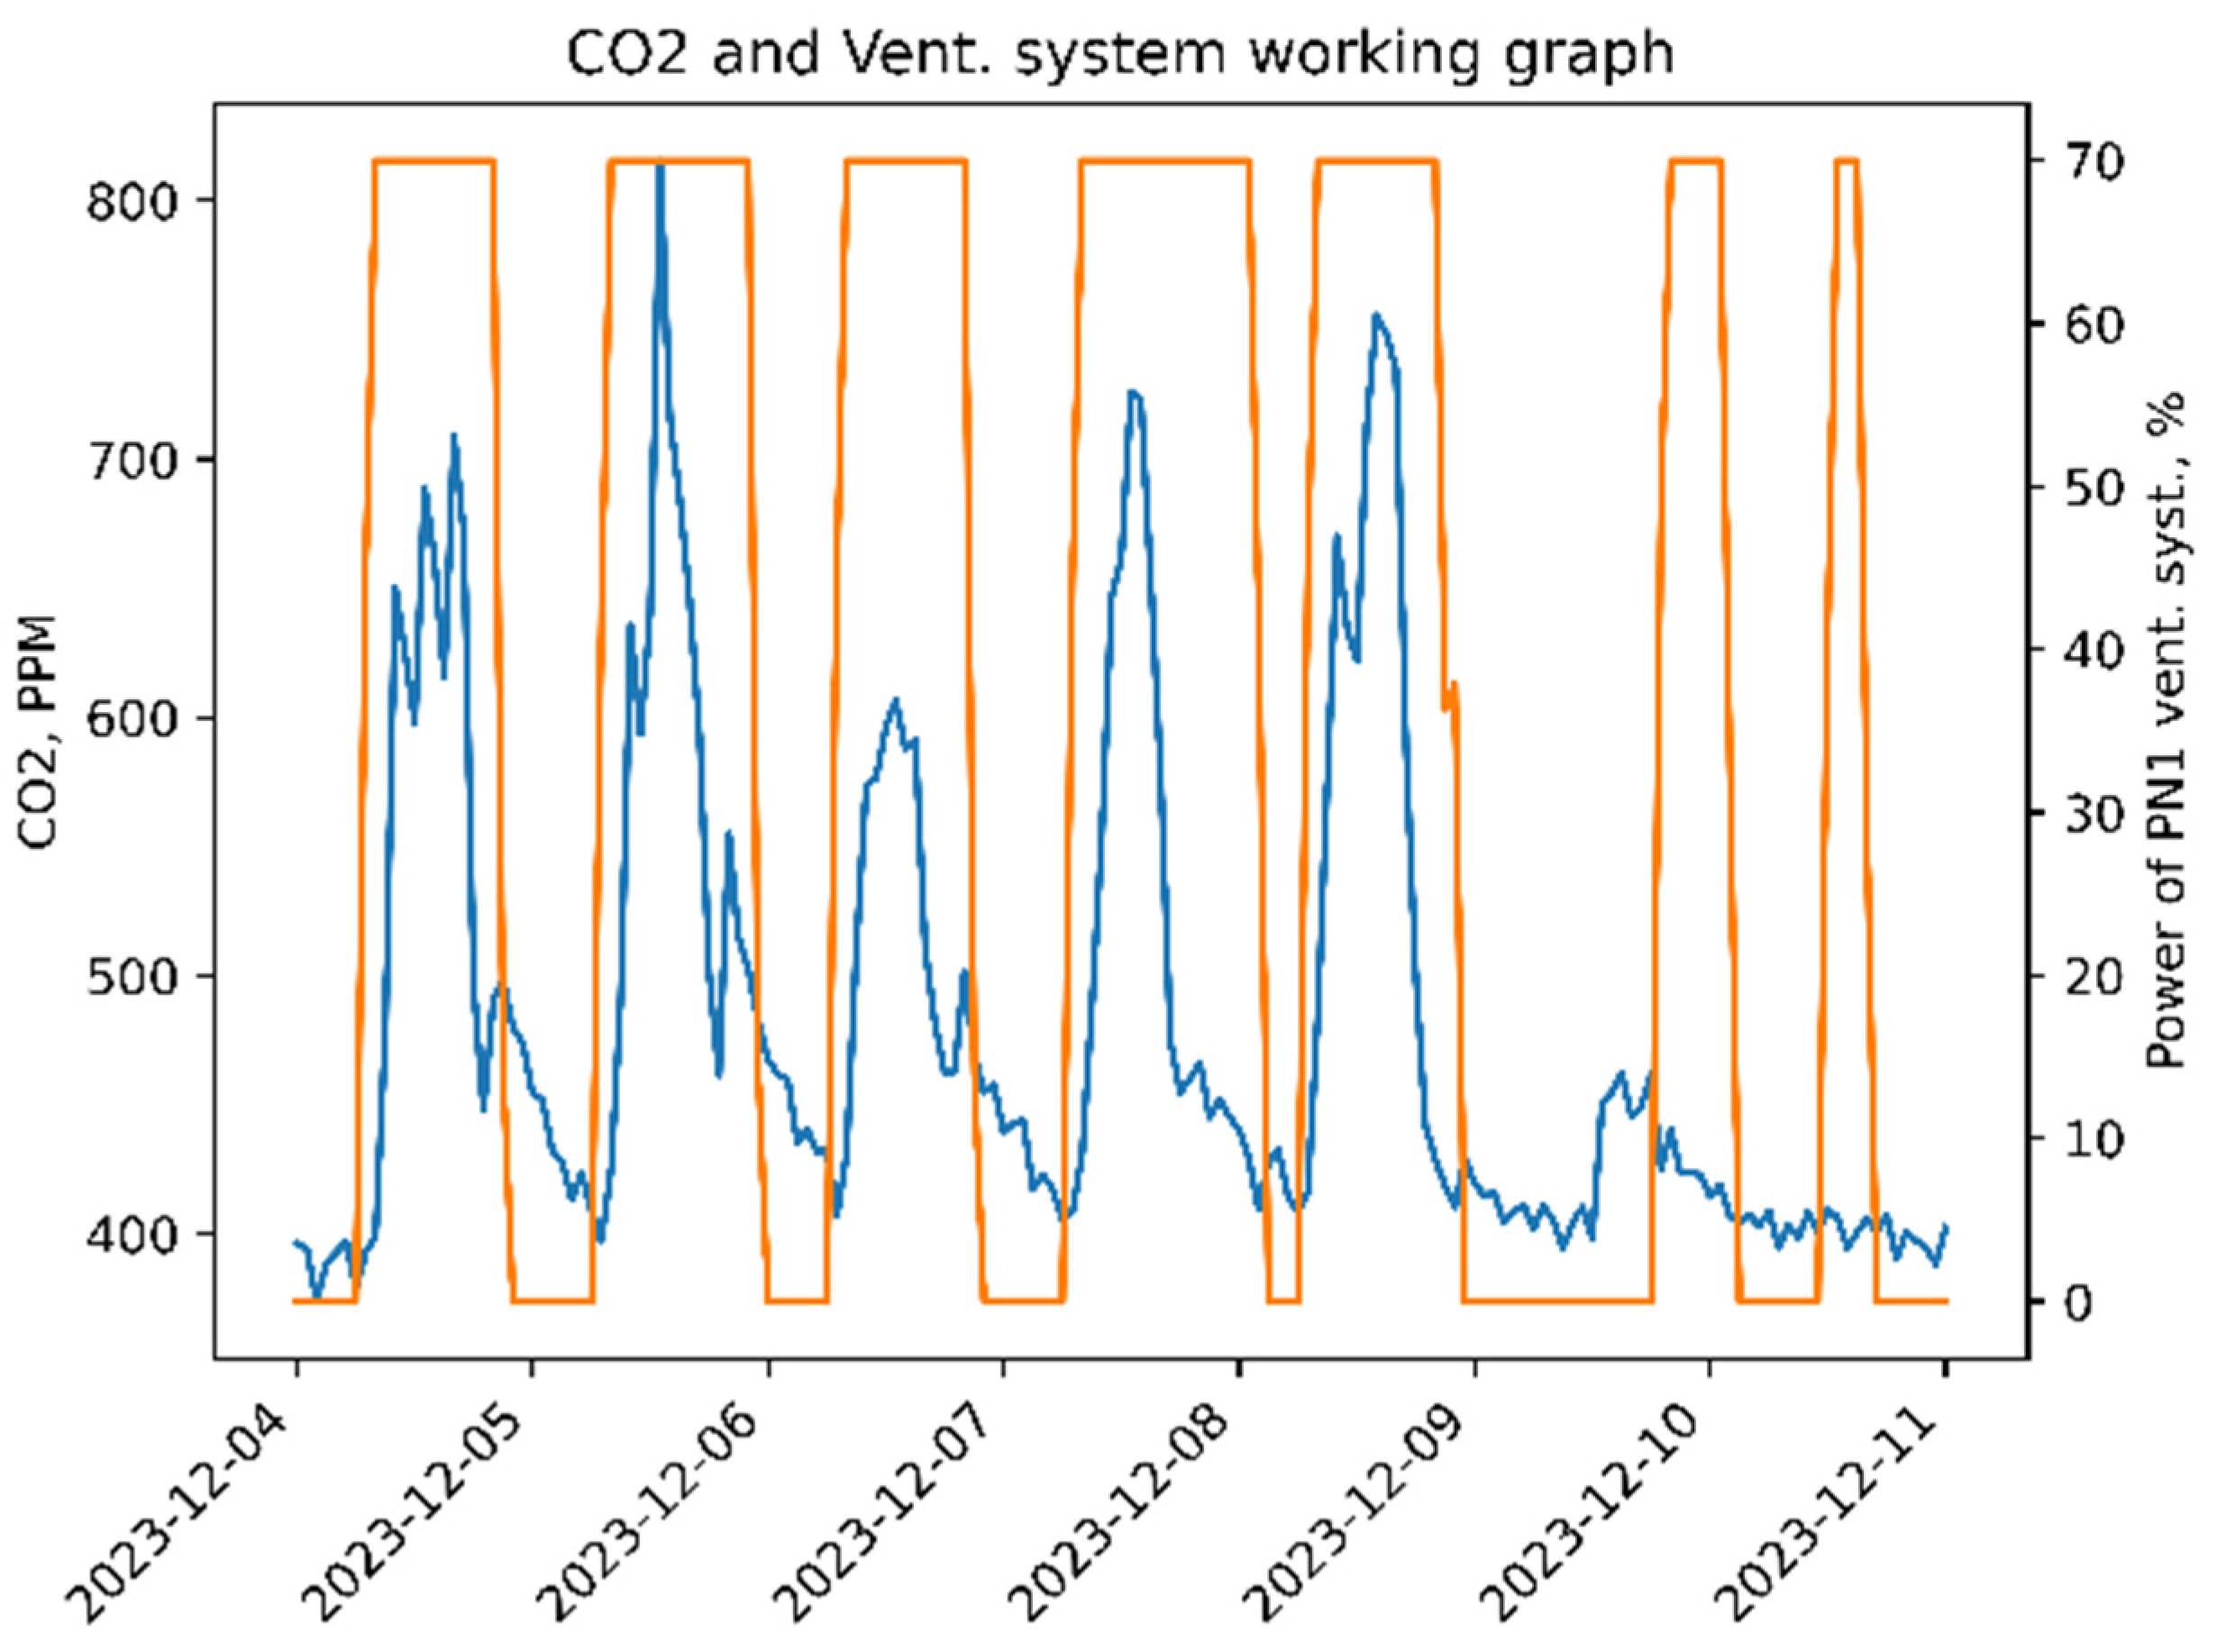
Figure 5.
CO2 concentration in one office and ventilation system working schedule during working day.
Figure 5.
CO2 concentration in one office and ventilation system working schedule during working day.
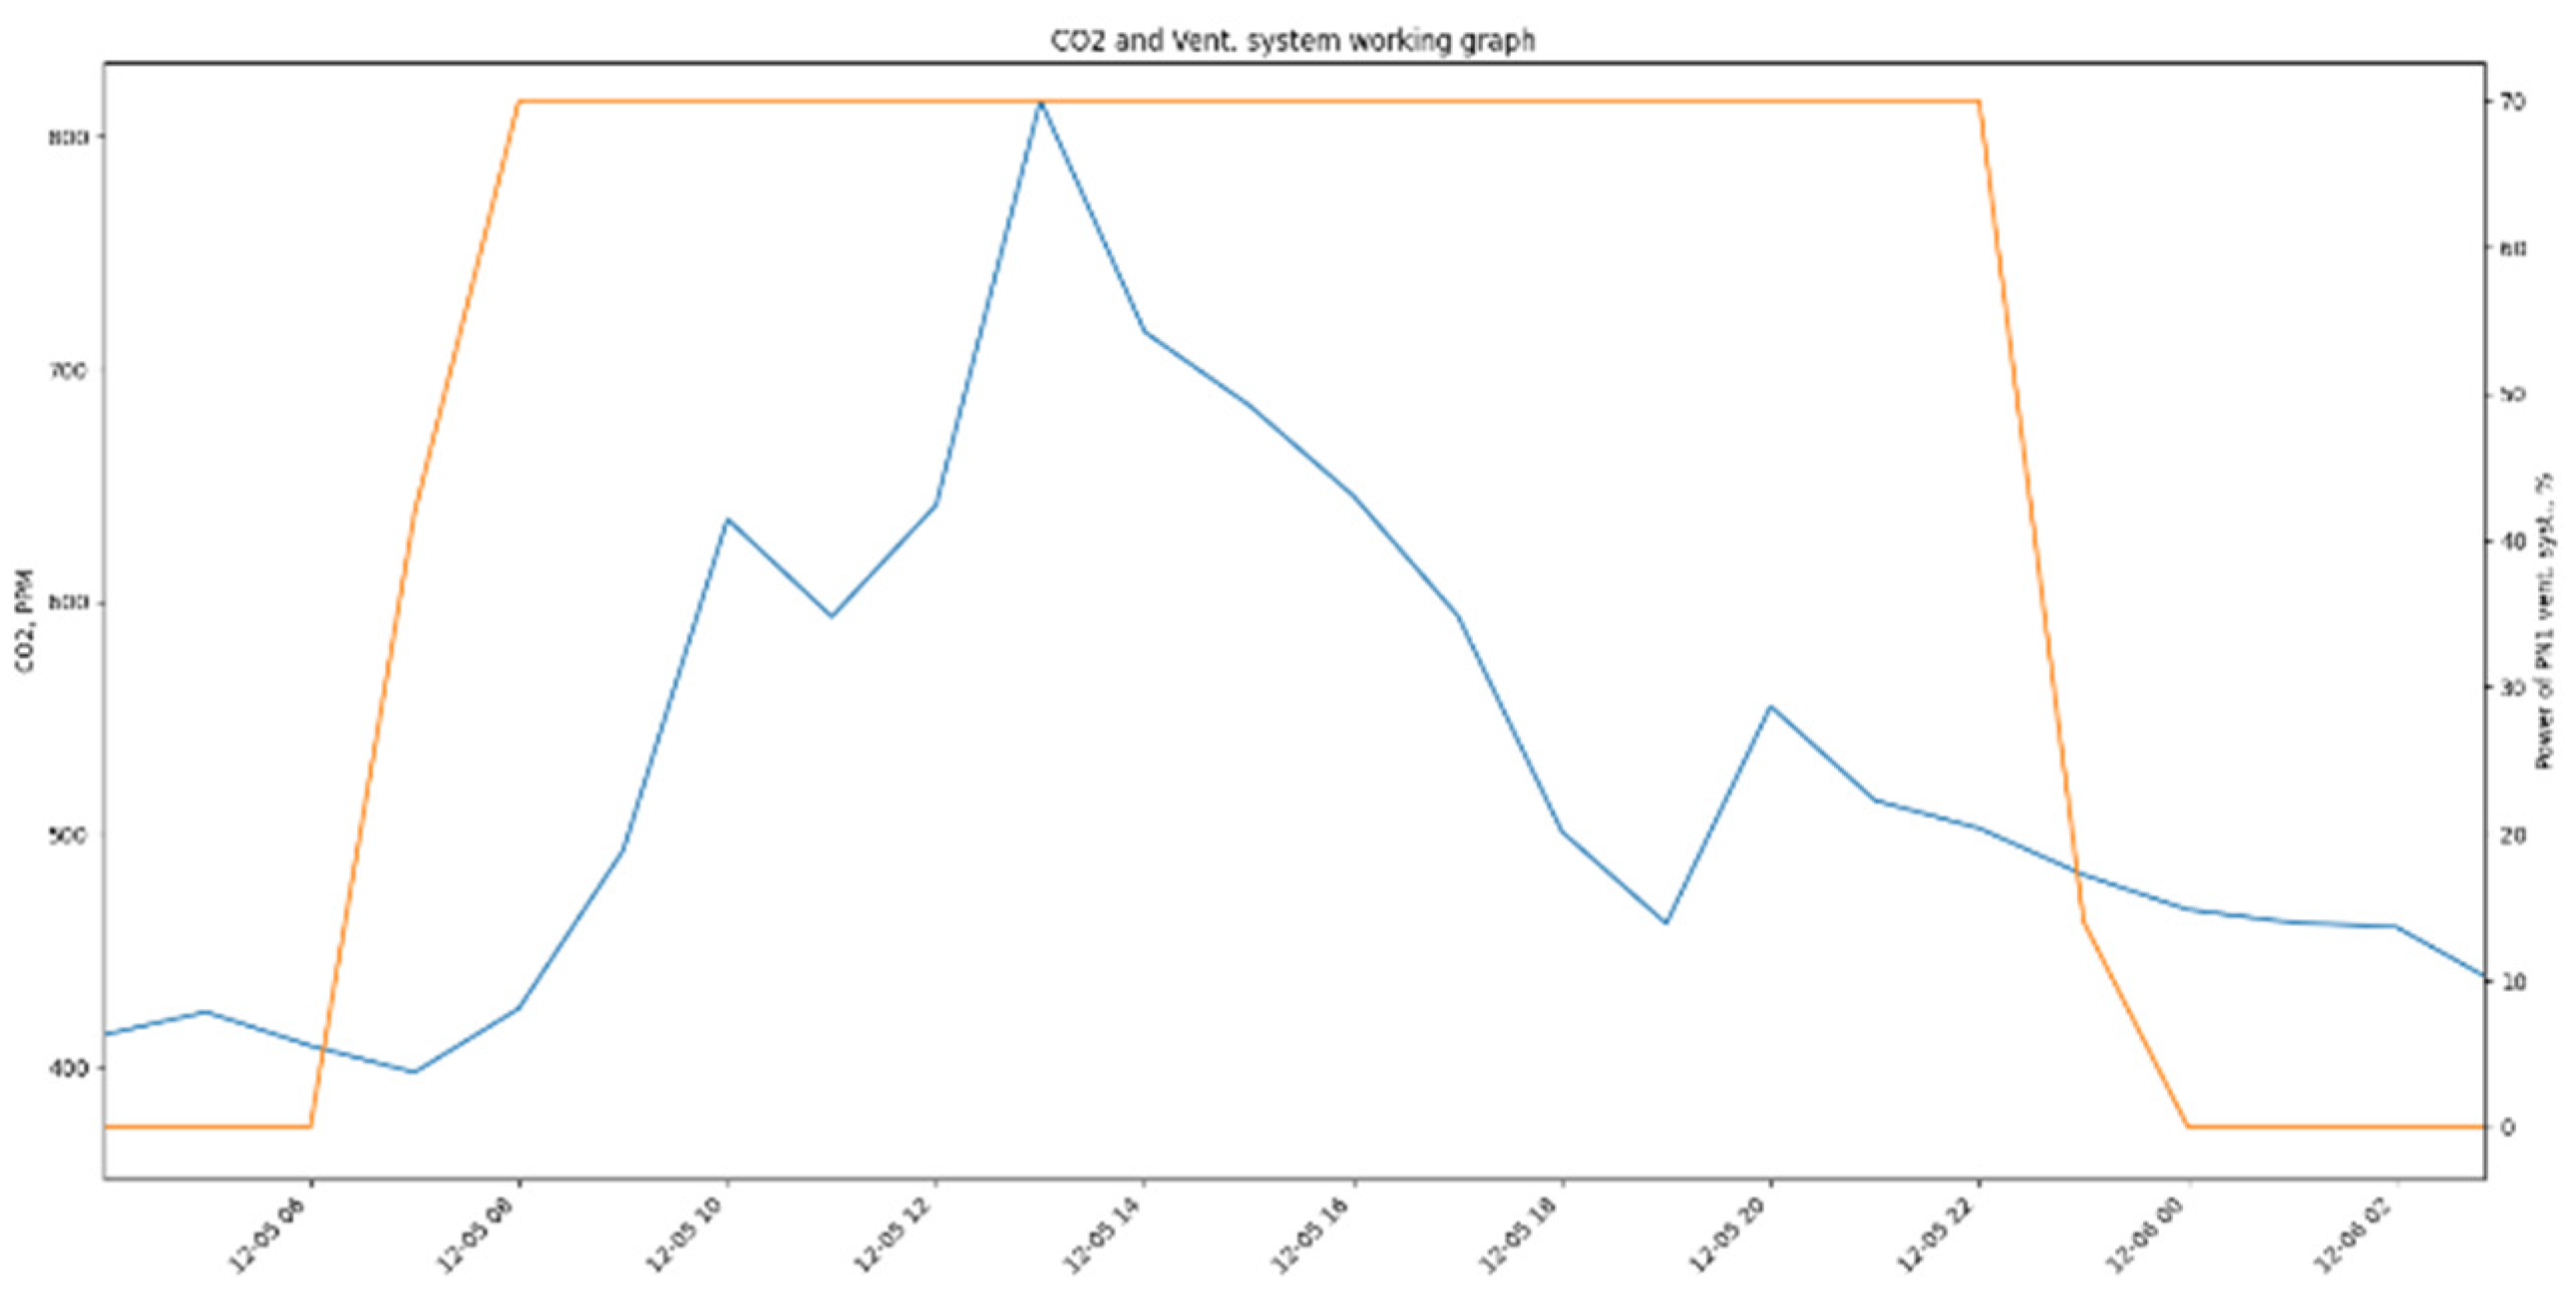
Figure 6.
Simulation model of office room.
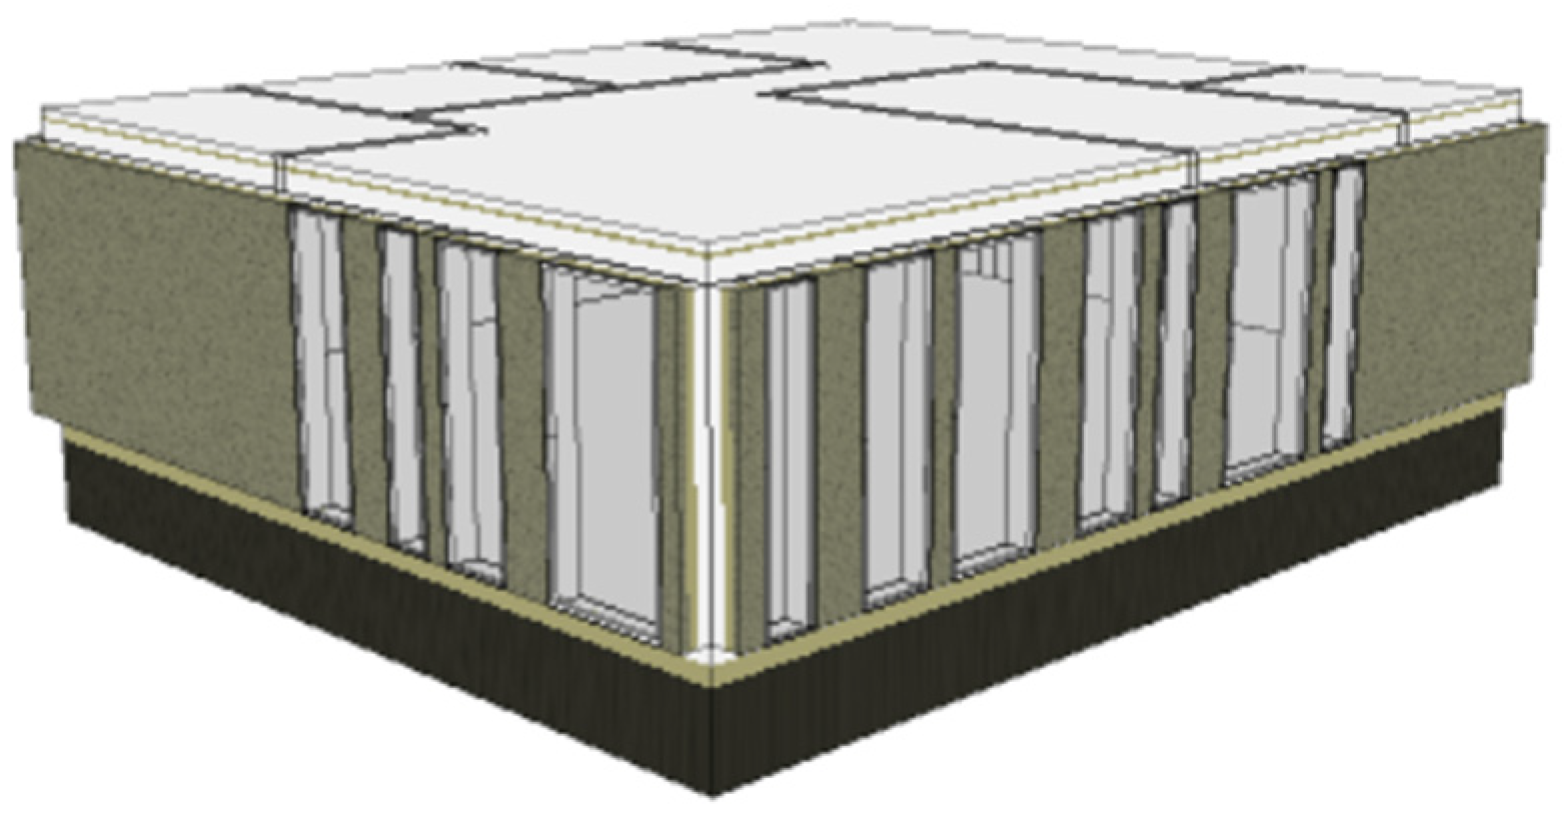
Figure 7.
Office occupancy schedule according to standard EN 16798.
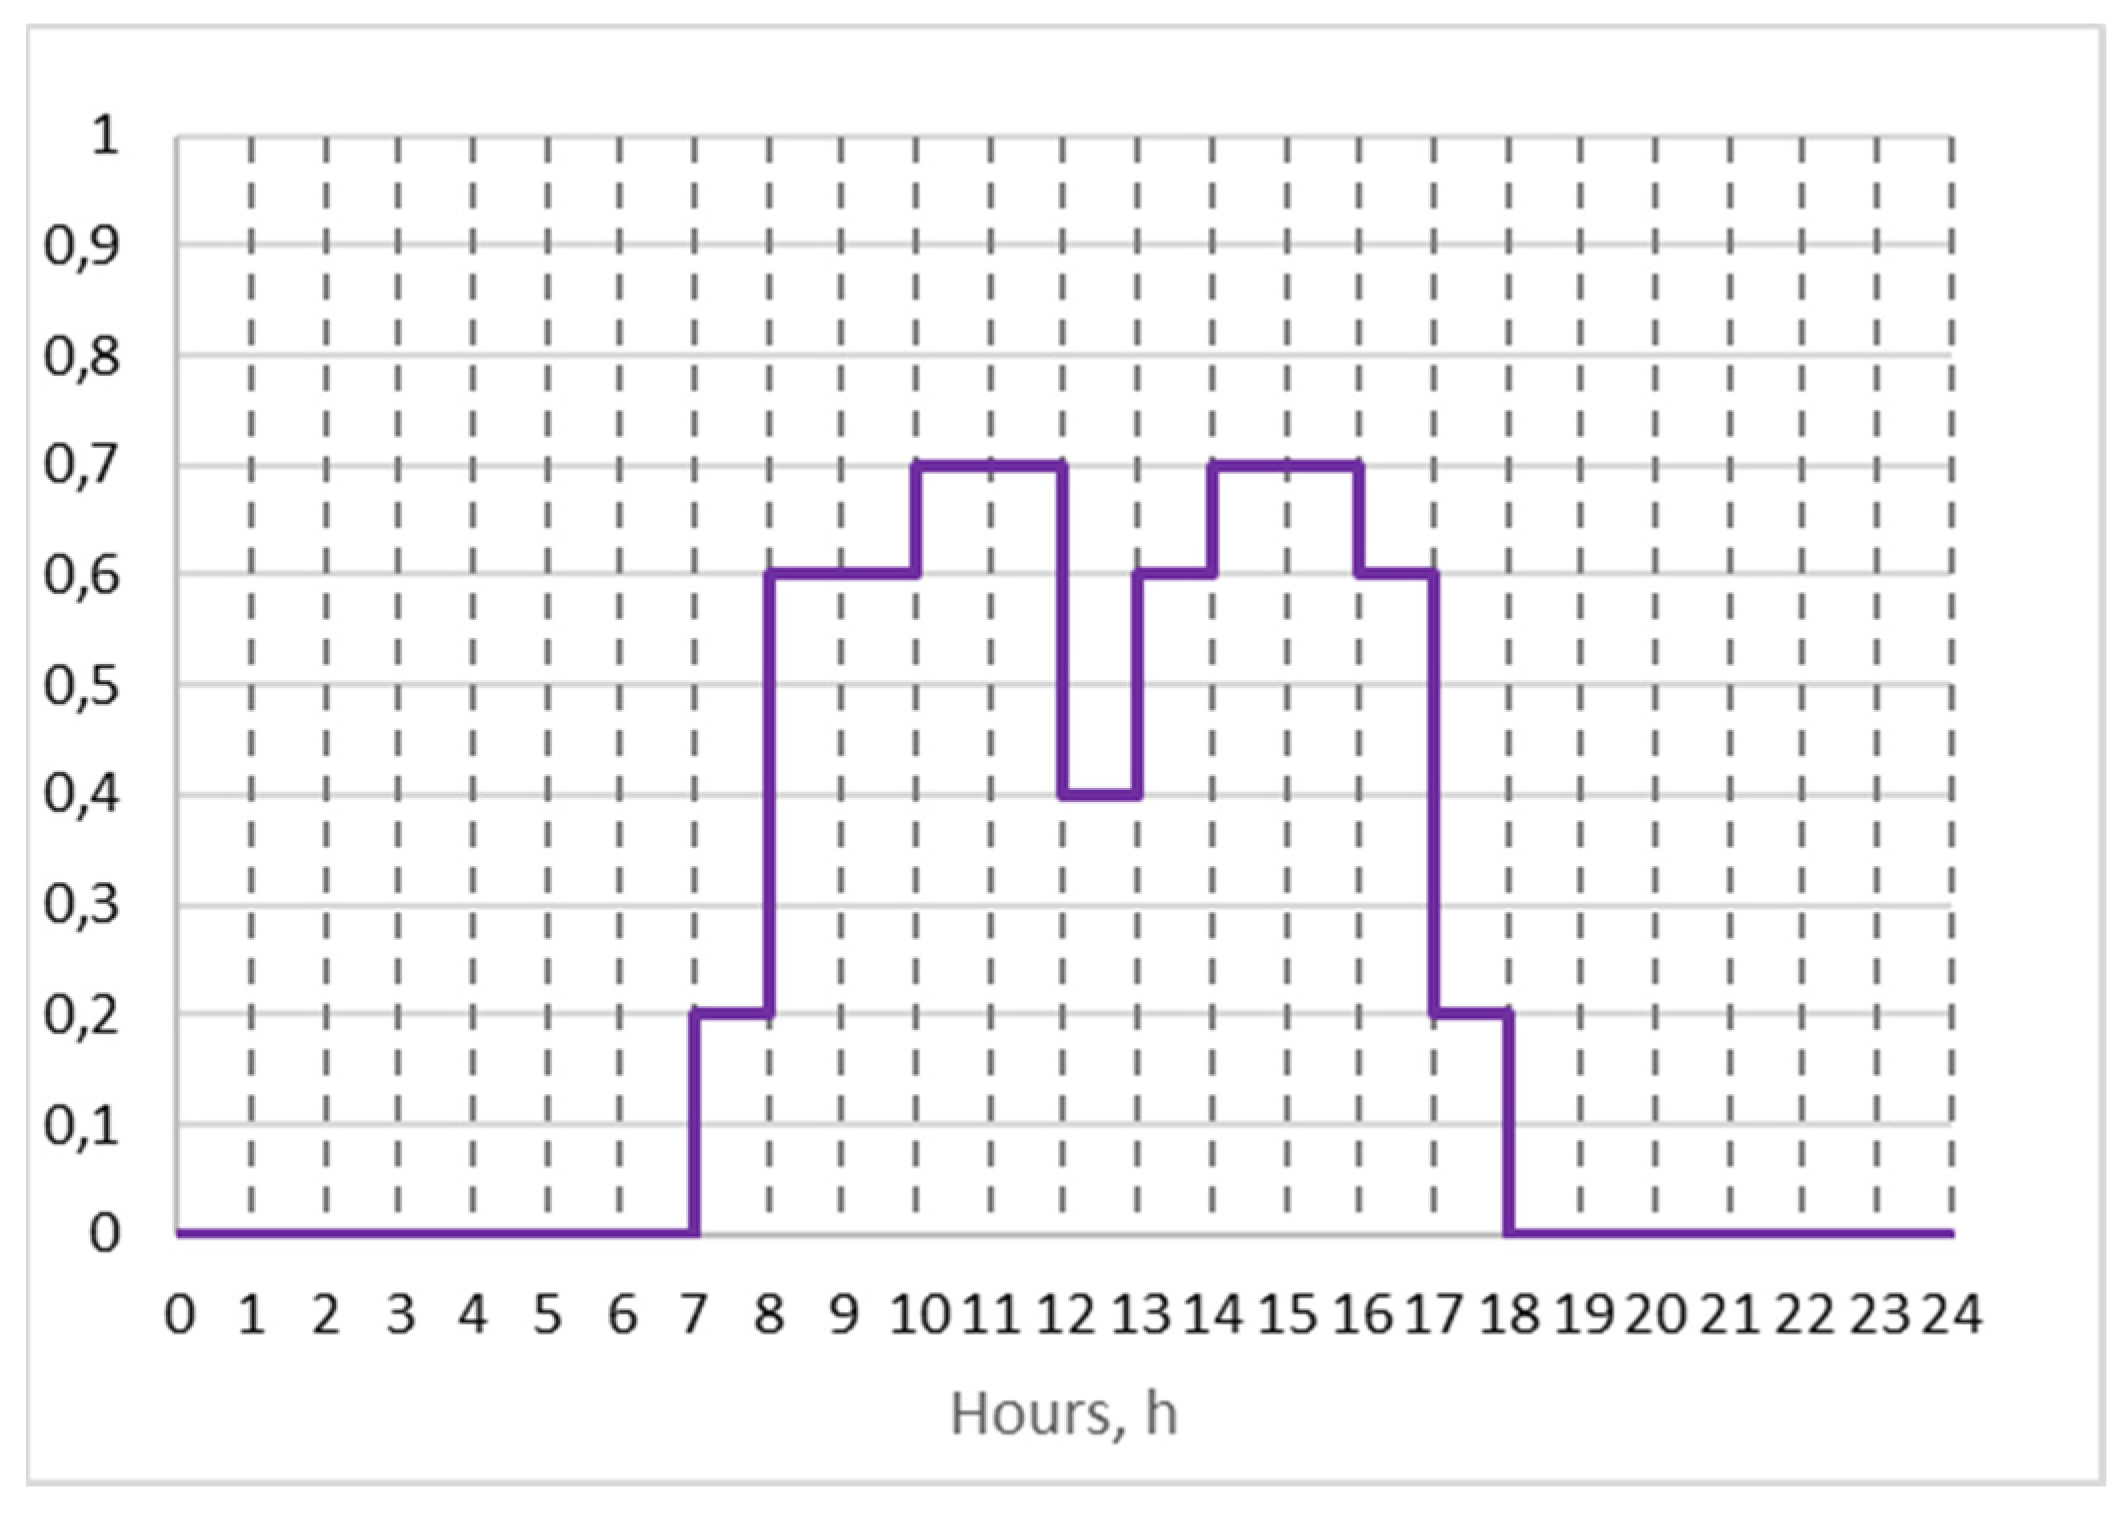
Figure 8.
Block diagram of building management.
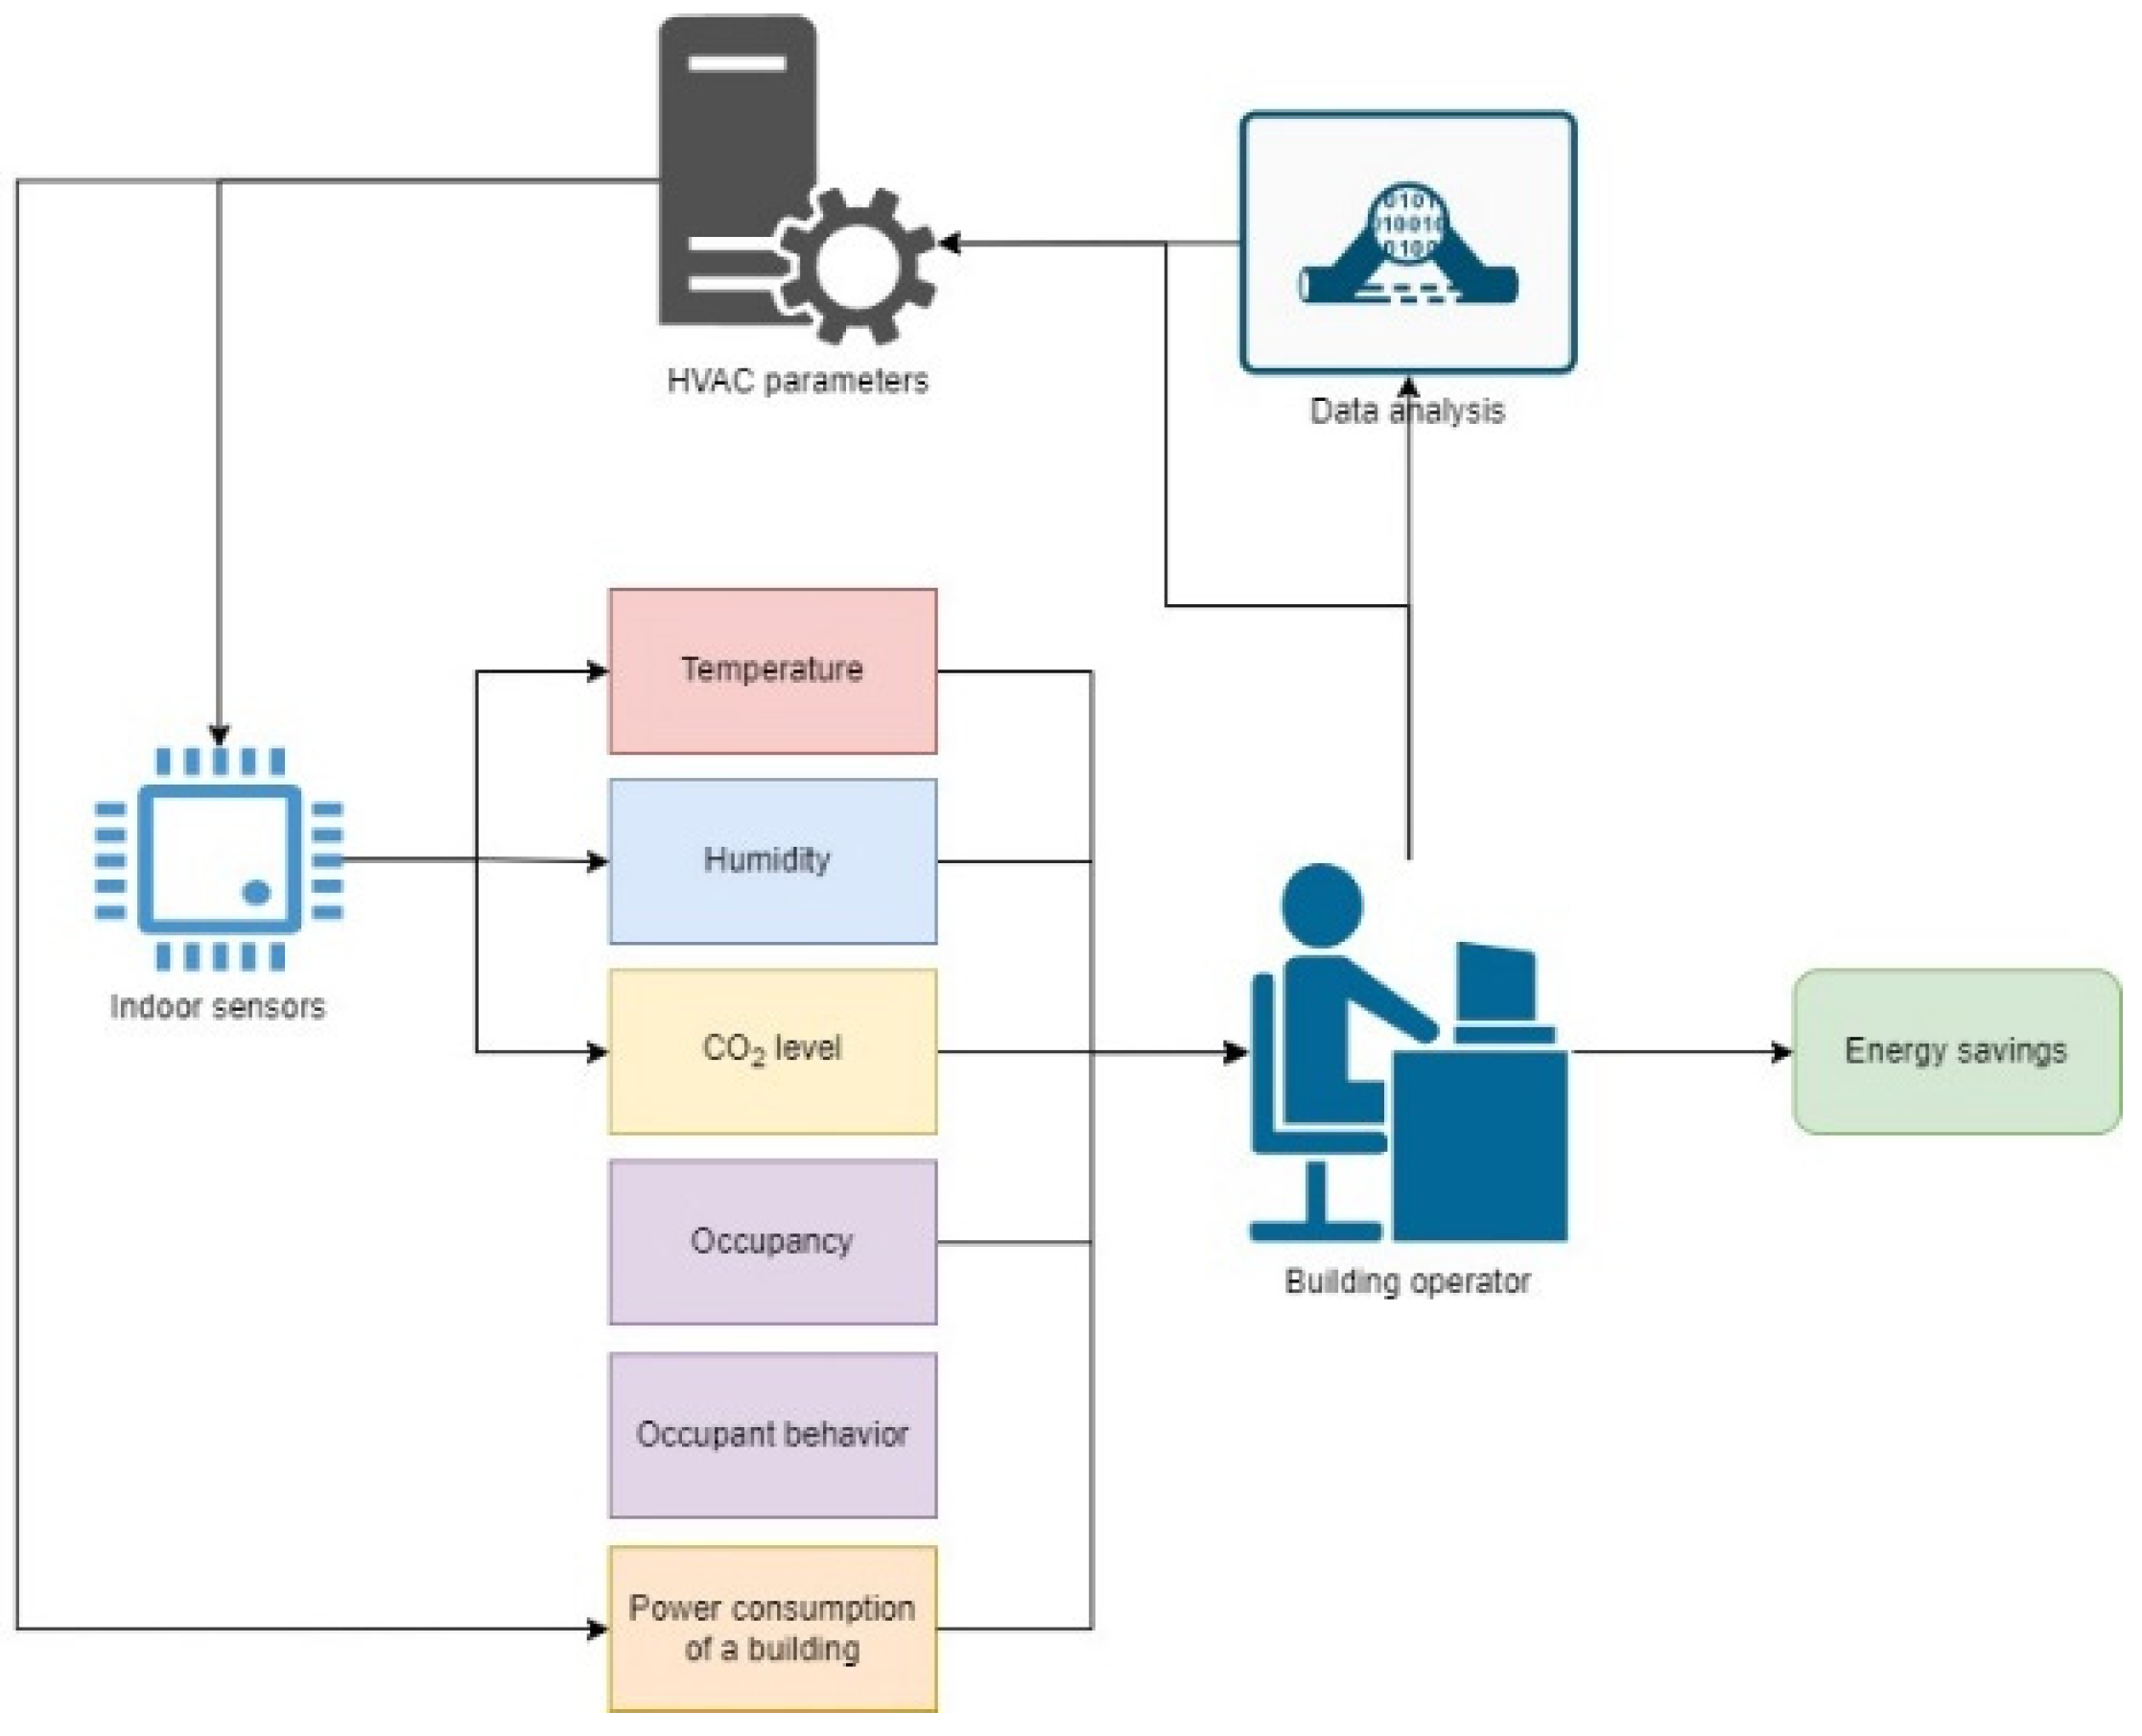

Table 2.
Result of simulations.
| Turn On | Turn Off | CO2 avg, ppm | CO2 max, ppm | Energy consumption, kWh (6 months) | Energy savings, kWh (6 months) | |
|---|---|---|---|---|---|---|
| Real office | 7:00 | 21:00 | 523 | 873 | 2300 | |
| Real office -1h, -3h | 8:00 | 18:00 | 631 | 985 | 1898 | 401.3 |
| Real office -2h, -5h | 9:00 | 16:00 | 1253 | 2704 | 1405 | 894.8 |
| EN16798 | 6:00 | 18:00 | 547 | 737 | 2904 | |
| EN16798 -1h, -1h | 7:00 | 17:00 | 742 | 982 | 2453 | 451 |
| EN16798 -2h, -2h | 8:00 | 16:00 | 1105 | 1940 | 1999 | 904.3 |
Disclaimer/Publisher’s Note: The statements, opinions and data contained in all publications are solely those of the individual author(s) and contributor(s) and not of MDPI and/or the editor(s). MDPI and/or the editor(s) disclaim responsibility for any injury to people or property resulting from any ideas, methods, instructions or products referred to in the content. |
© 2024 by the authors. Licensee MDPI, Basel, Switzerland. This article is an open access article distributed under the terms and conditions of the Creative Commons Attribution (CC BY) license (http://creativecommons.org/licenses/by/4.0/).
Copyright: This open access article is published under a Creative Commons CC BY 4.0 license, which permit the free download, distribution, and reuse, provided that the author and preprint are cited in any reuse.


