1. Introduction
The rapid global urbanization, projected to exceed 60% by 2030, is leading to profound adjustments in cities' industrial structures and posing challenges to urban development. As cities adapt to these transformations, the role of commercial activities in reshaping urban space becomes increasingly significant. A well-designed commercial area not only fuels economic development but also meets residents' consumption needs while enhancing their comfort and happiness. Therefore, it is of utmost importance to simulate and optimize the expansion of urban commercial space for effective urban planning.
In this rapidly changing world, understanding the significance of commerce in cities goes beyond economic prosperity; it is about shaping livable and business-friendly urban environments that create more opportunities and benefits for residents. Through in-depth research and comprehensive analysis, we can discover that a rational layout of commercial space not only promotes sustainable urban development but also strengthens community cohesion and improves residents' quality of life.
The planning and development of commercial areas should consider social and environmental sustainability, emphasizing innovation and diversity to provide cities with more choices and opportunities while balancing the needs of urban development and ecological preservation. By actively incorporating advanced technologies and intelligent management, we can enhance the efficiency and convenience of commercial areas, providing residents with better shopping and service experiences.
Therefore, research on effective planning and optimization of urban commercial space holds significant meaning. It not only drives sustainable urban development but also creates more livable and prosperous urban environments, leading to greater well-being and happiness in people's lives.
Urban commercial spaces are influenced by factors like transportation, policy, economy, and history. Traditional qualitative analysis methods relied heavily on planners' intuition and were largely subjective. However, the recent trend is applying machine learning to urban planning. This multidisciplinary field leverages vast data sets and continuously refines results based on set rules, allowing effective handling of site selection issues by simulating suitable locations based on influential factors.[
1,
2]. Moreover, machine learning can be integrated with image data for refined research, enabling identification of image features and semantic segmentation of streetscape images [
3,
4].
Machine learning, combined with urban CA models, has resulted in varied CA-based urban models like ANN-CA [
5] and RF-CA [
6,
7] to simulate future urban spaces. Applying machine learning to urban commercial spaces is an upcoming trend to reduce subjectivity in urban planning. Commonly used algorithms include artificial neural networks (ANN), decision trees, and support vector machines (SVM)[
8,
9,
10]. Decision trees help establish correlations between buildings and inhabitants' socio-economic levels. SVMs can classify data into different categories, and when combined with GIS analysis, can predict issues like landslides. ANNs, due to their ability to model complex relationships, can predict factors like daily city water consumption and help in functional area classification[
11,
12]. Considering these factors, the ANN algorithm was chosen to simulate the expansion of urban commercial space for more rational optimization and better decision-making resources for urban planners.
Numerous artificial neural network (ANN) models exist, with common ones including RBF networks, Elman networks, and Backpropagation (BP) neural networks [
13,
14,
15,
16,
17,
18]. RBF networks have been used to predict urban industrial land demand and simulate smart city growth. Elman networks have proven accurate in predicting carbon emissions and average sea level changes. BP networks have been employed for urban air quality prediction and regional flood hazard assessment. Generally, BP networks are the most prevalent, accounting for over 70% of neural network models[
19,
20,
21,
22,
23,
24,
25,
26,
27,
28]. Consequently, this study employs the BP neural network.
2. Study Area and Data
2.1. Study Area
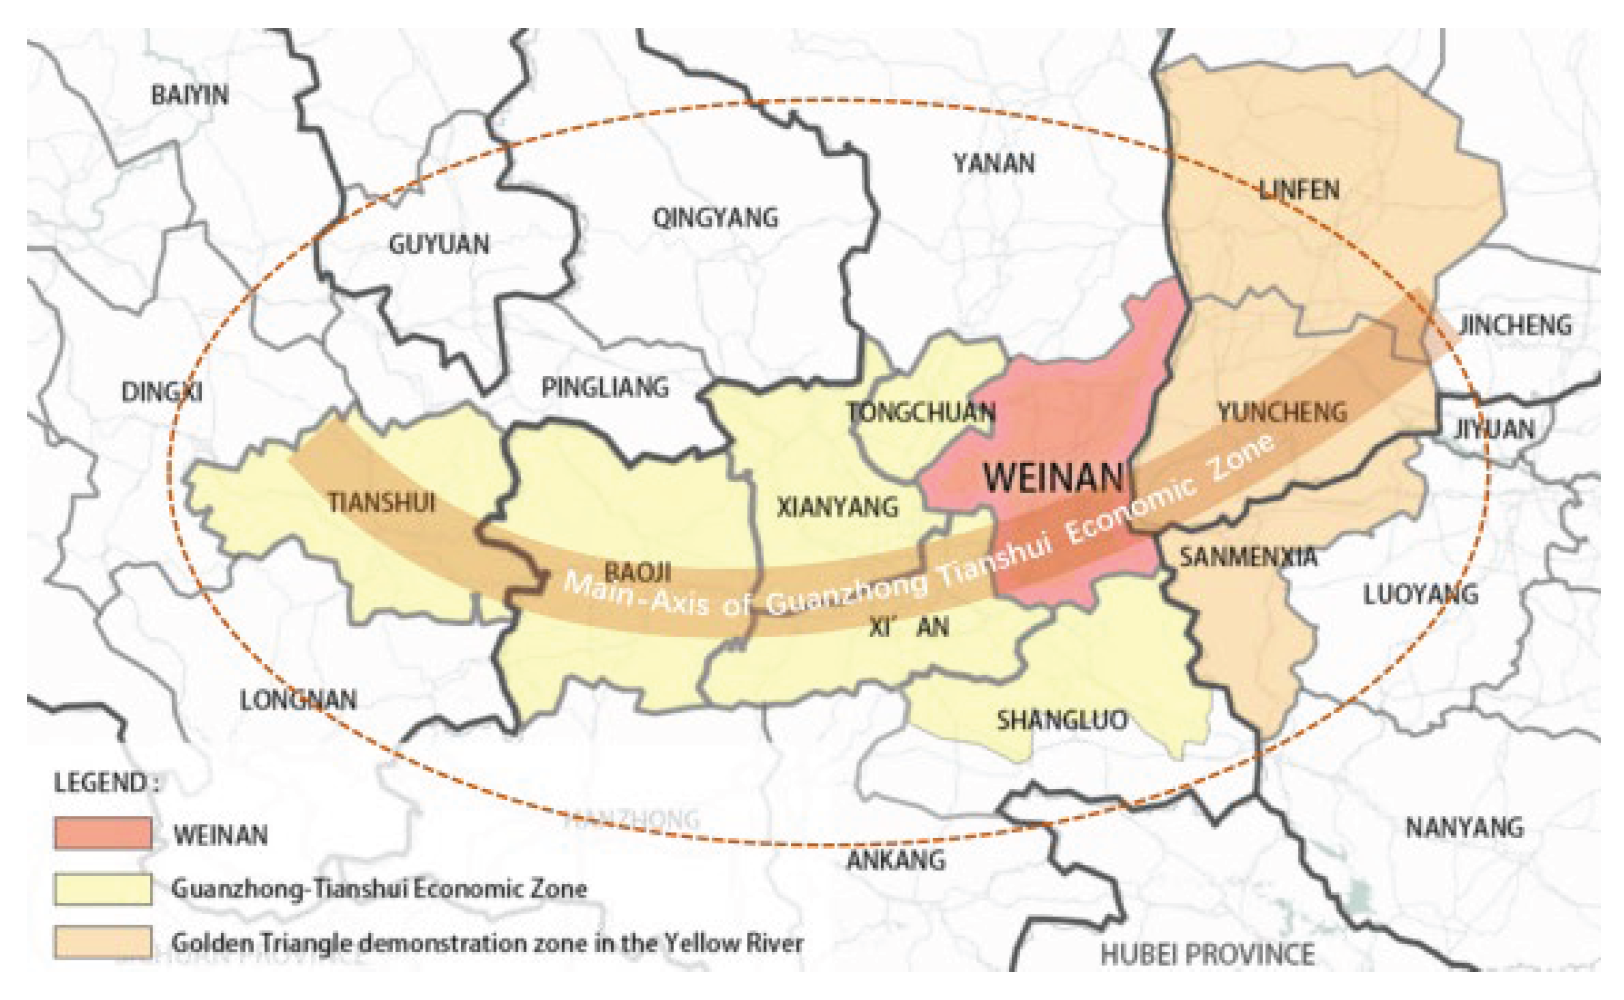
This study focuses on the Linwei District of Weinan City, defined by the city's Urban Master Plan (2016-2030). Weinan City, located in the east-central part of Shaanxi Province, China, covers 13,134km² and is the largest agricultural city in the province. With a population of 920,000 in 2020, Linwei District contributed to 23.68% of the city's GDP, thus acting as the primary commercial hub.
The study is centered on Linwei District for two key reasons. First, Weinan City is in a developmental phase, with the commercial space in Linwei District projected to expand further, requiring forecasting and simulation to form a well-distributed layout. The city's GDP and retail sales growth rates further underscore this need. Second, Weinan City's proximity to Xi'an and its growing commerce make it a valuable reference case for commercial spatial layout, especially for neighboring small-to-medium-sized cities and those near the metropolitan area.
Figure 1.
The District of Weinan City.
Figure 1.
The District of Weinan City.
2.2. Data
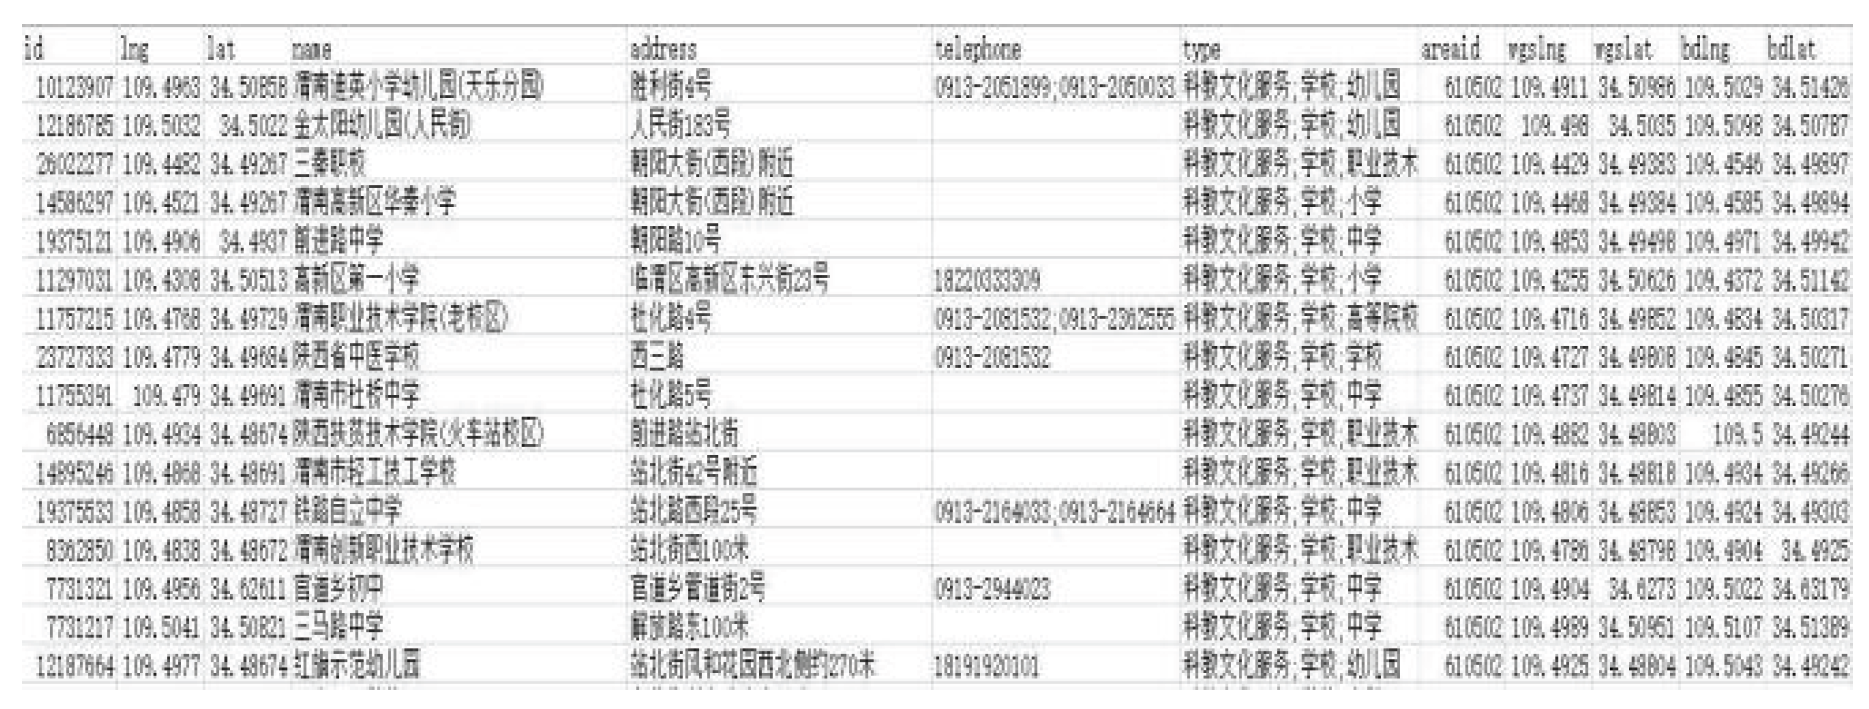
This study utilizes four primary data types: traditional data, geographic data, network data, and image data. Traditional data comprises statistical yearbooks, development bulletins, and city master plans from Weinan City's government units. Geographic data is mainly sourced from the China Geospatial Data Cloud, while network data includes POI data from GAODE Map and OSM road network data from OpenStreetMap. Image data consists of street view photos from Linwei District. For efficiency, these data were organized, calibrated, and integrated into Arc GIS 10.4, with the final coordinate system unified to WGS_1984_UTM_Zone_53N.
Figure 2.
Screenshots of selected POI data.
Figure 2.
Screenshots of selected POI data.
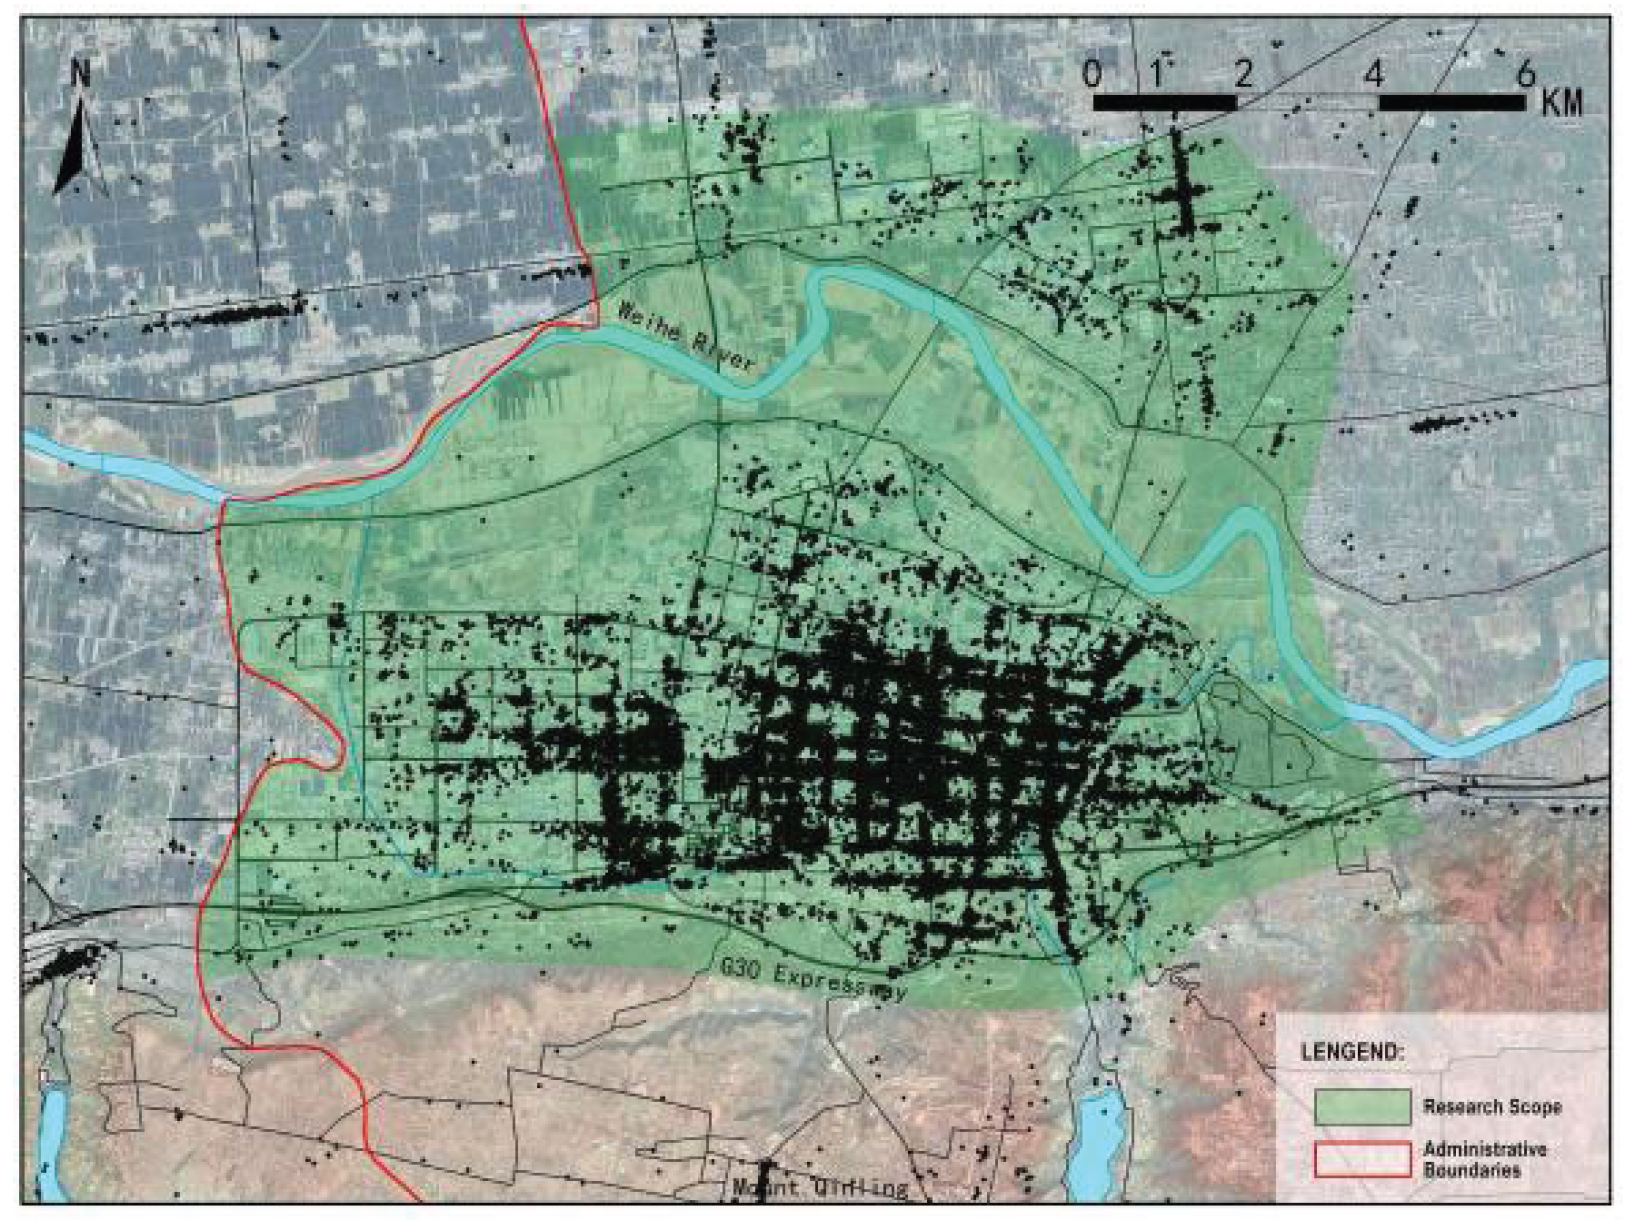
Figure 3.
POI Data diagram.
Figure 3.
POI Data diagram.
3. Methods
3.1. Back-propagation Neural Network
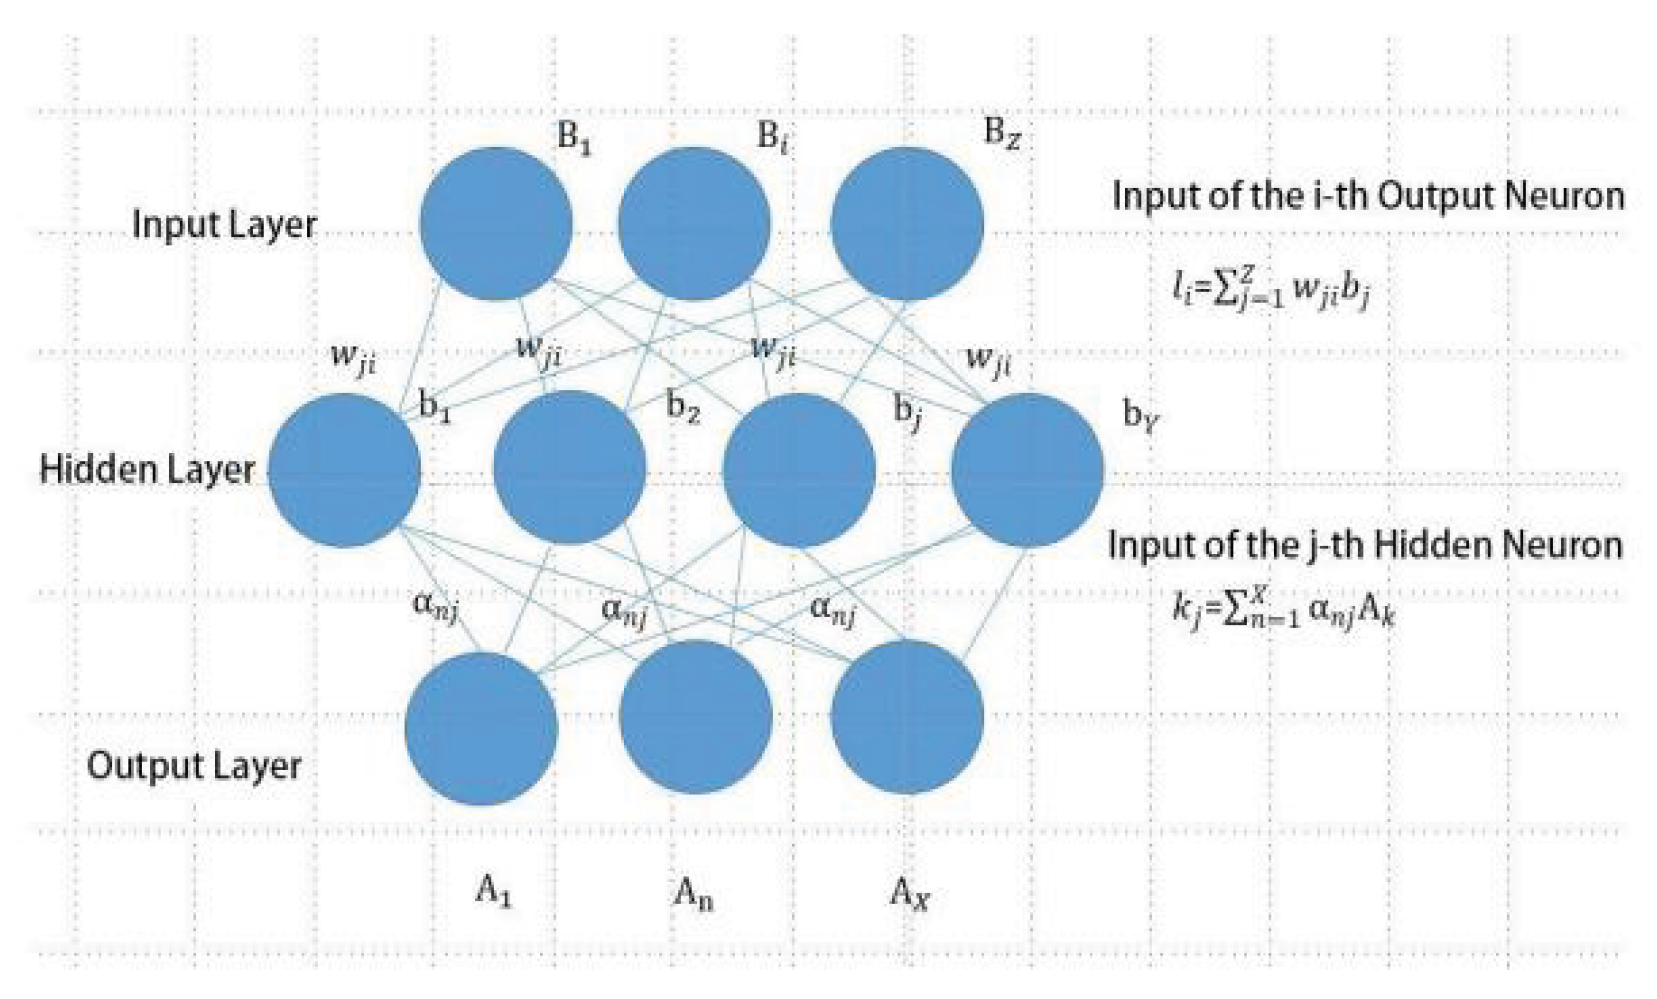
Data visualization was accomplished using Arc GIS 10.4, while data analysis and model optimization were performed using Python. BP neural networks, typically comprising three layers (input, hidden, output), are employed. Each node in the hidden layer usually uses an activation function. The execution of the BP neural network algorithm involves three main steps: feature value selection, parameter determination, and model prediction and output. The algorithm flow is as follows:
Identify the feature values and normalize all data.
Establish the parameters of the BP neural network in preparation for data simulation.
If the output data satisfies accuracy requirements, apply reverse normalization.
The BP algorithm is shown in
Figure 4, which is actually given a set of training set
in determining the X input neurons, Y output neurons, and Z output neurons, where the threshold of neurons in the output layer is denoted by θ
i, and the threshold of neurons in the hidden layer is denoted byμ
j, and the connection weights between the input layer and hidden layer neurons are α
nj, and the connection weights between the hidden layer and output layer neurons are ω
ji. The input of the hidden layer neuron is
, and the input of the output layer neuron is
,
for the hidden layer neuron output, assuming that both the hidden layer and the output layer neuron use the Sigmoid function.For the training set, the output of the neuron is:
Then the mean square error over the network is:
The BP neural network is an iterative algorithm and the parameters are updated and estimated after each iteration, so the estimation equation for any parameter update is:
Again, because of the Sigmoid function:
From equations (1) and (2):
Collating equations (1) to equations (8) yields:
The same reasoning applies:
3.2. Eigenvalue Selection
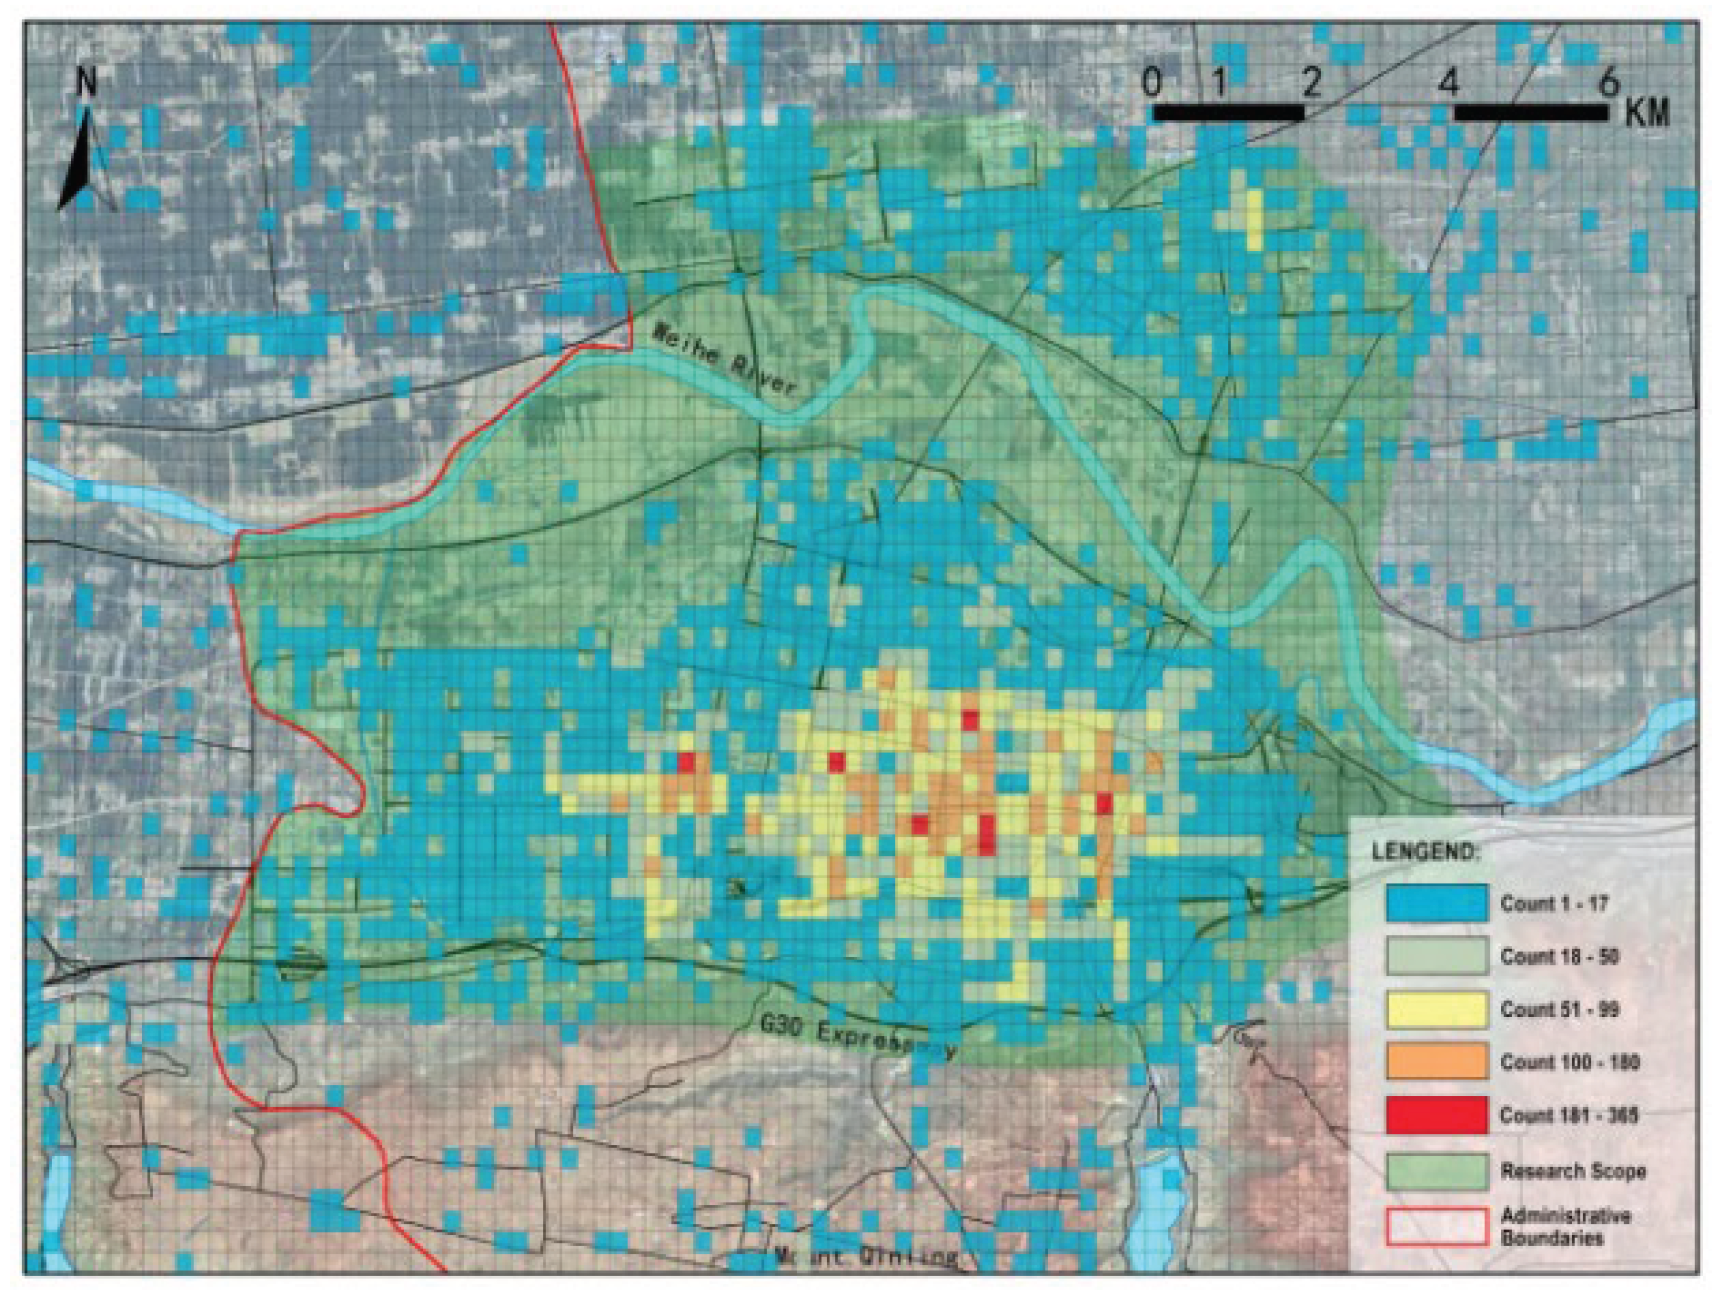
The study area was segmented into unique square cells based on the range of a five-minute living circle. Each cell was assigned a unique number, enabling the spatial correlation of the POI data. The POI data was sorted into eight functional categories: tourism, medical, science and education, commercial, administrative, office, transportation, and residential. Using the "spatial connection" tool in Arc GIS10.4, each POI datum was linked with spatially co-located cells, allowing the counting of each functional POI in each cell.
Statistical distribution of the POI data indicates a correlation between commercial POI and other functional POI. Pearson product-moment correlation coefficient analysis reveals a positive correlation when the coefficient is above 0, with values closer to 1 being stronger.
Based on this, commercial POI data generally showed high positive correlation (>0.5) with six categories (transportation, office, residential, administrative, scientific and educational, and medical), implying a mutual influence in their numbers. Notably, the office function had a high correlation of 0.82 with commercial function. In contrast, tourism showed weak correlation (~0.2) with other functions, indicating minimal influence. Hence, the six strongly correlated functions were selected as characteristic values.
3.3. Parameter Debugging
1) Number of nodes per layer
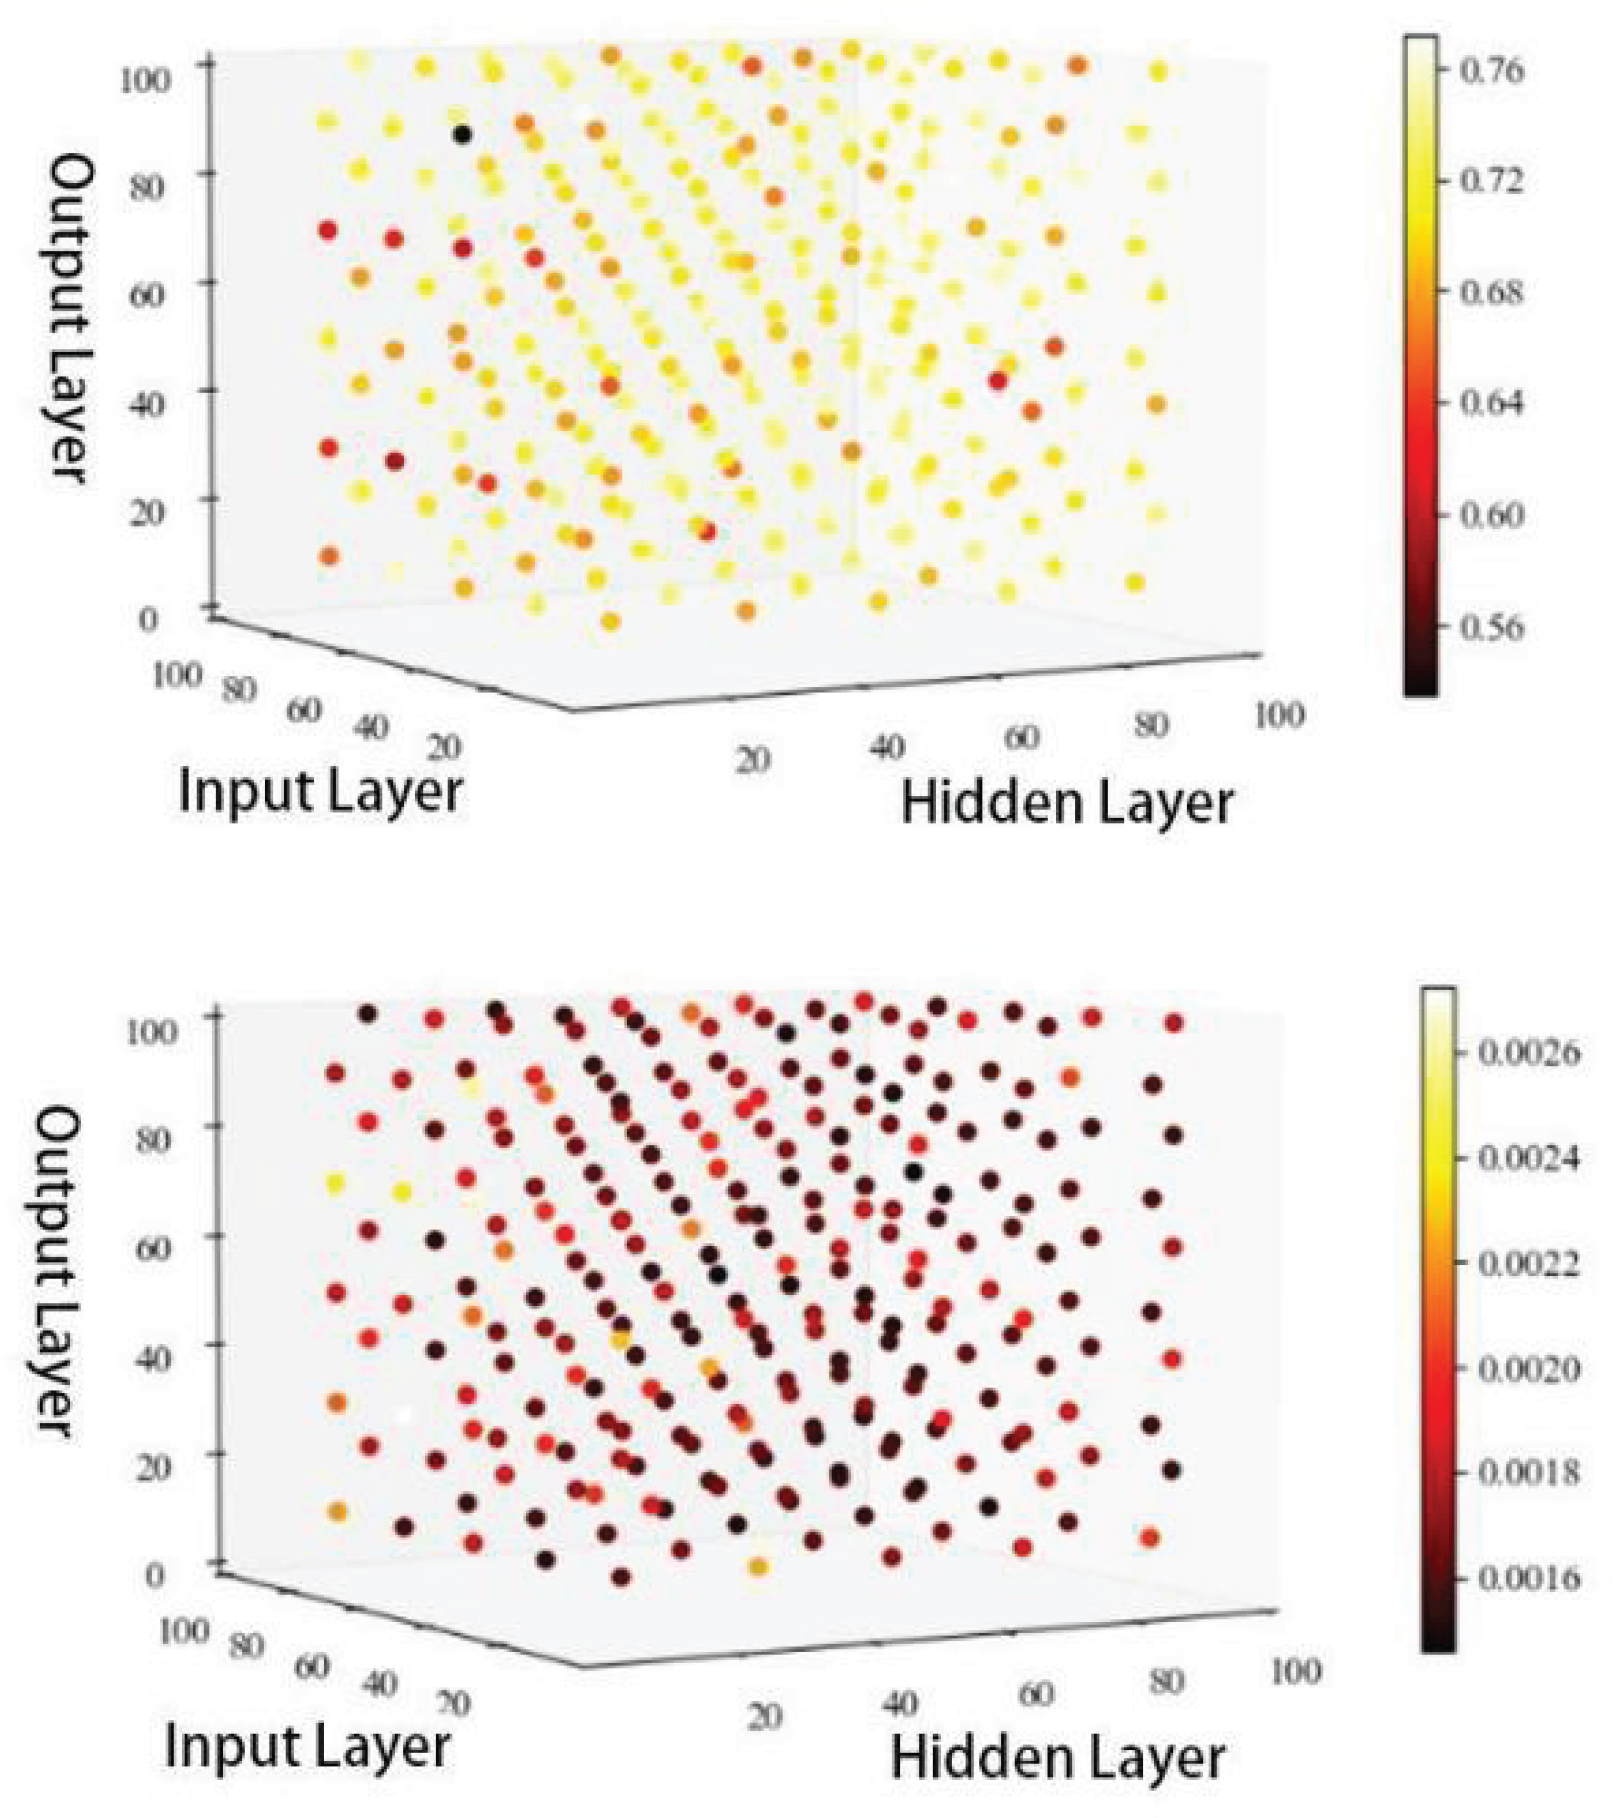
More neuron nodes enhance the training effectiveness of the BP neural network, reducing the final error. Typically, node numbers are iteratively adjusted in practice. After 250 trials, the optimal network configuration emerged with 50 nodes in the input layer, 90 in the hidden layer, and 90 in the output layer. This configuration yielded an R2 score of 0.7719 and an error of 0.0015.
Figure 5.
R2 score & Error of neurons in each layer.
Figure 5.
R2 score & Error of neurons in each layer.
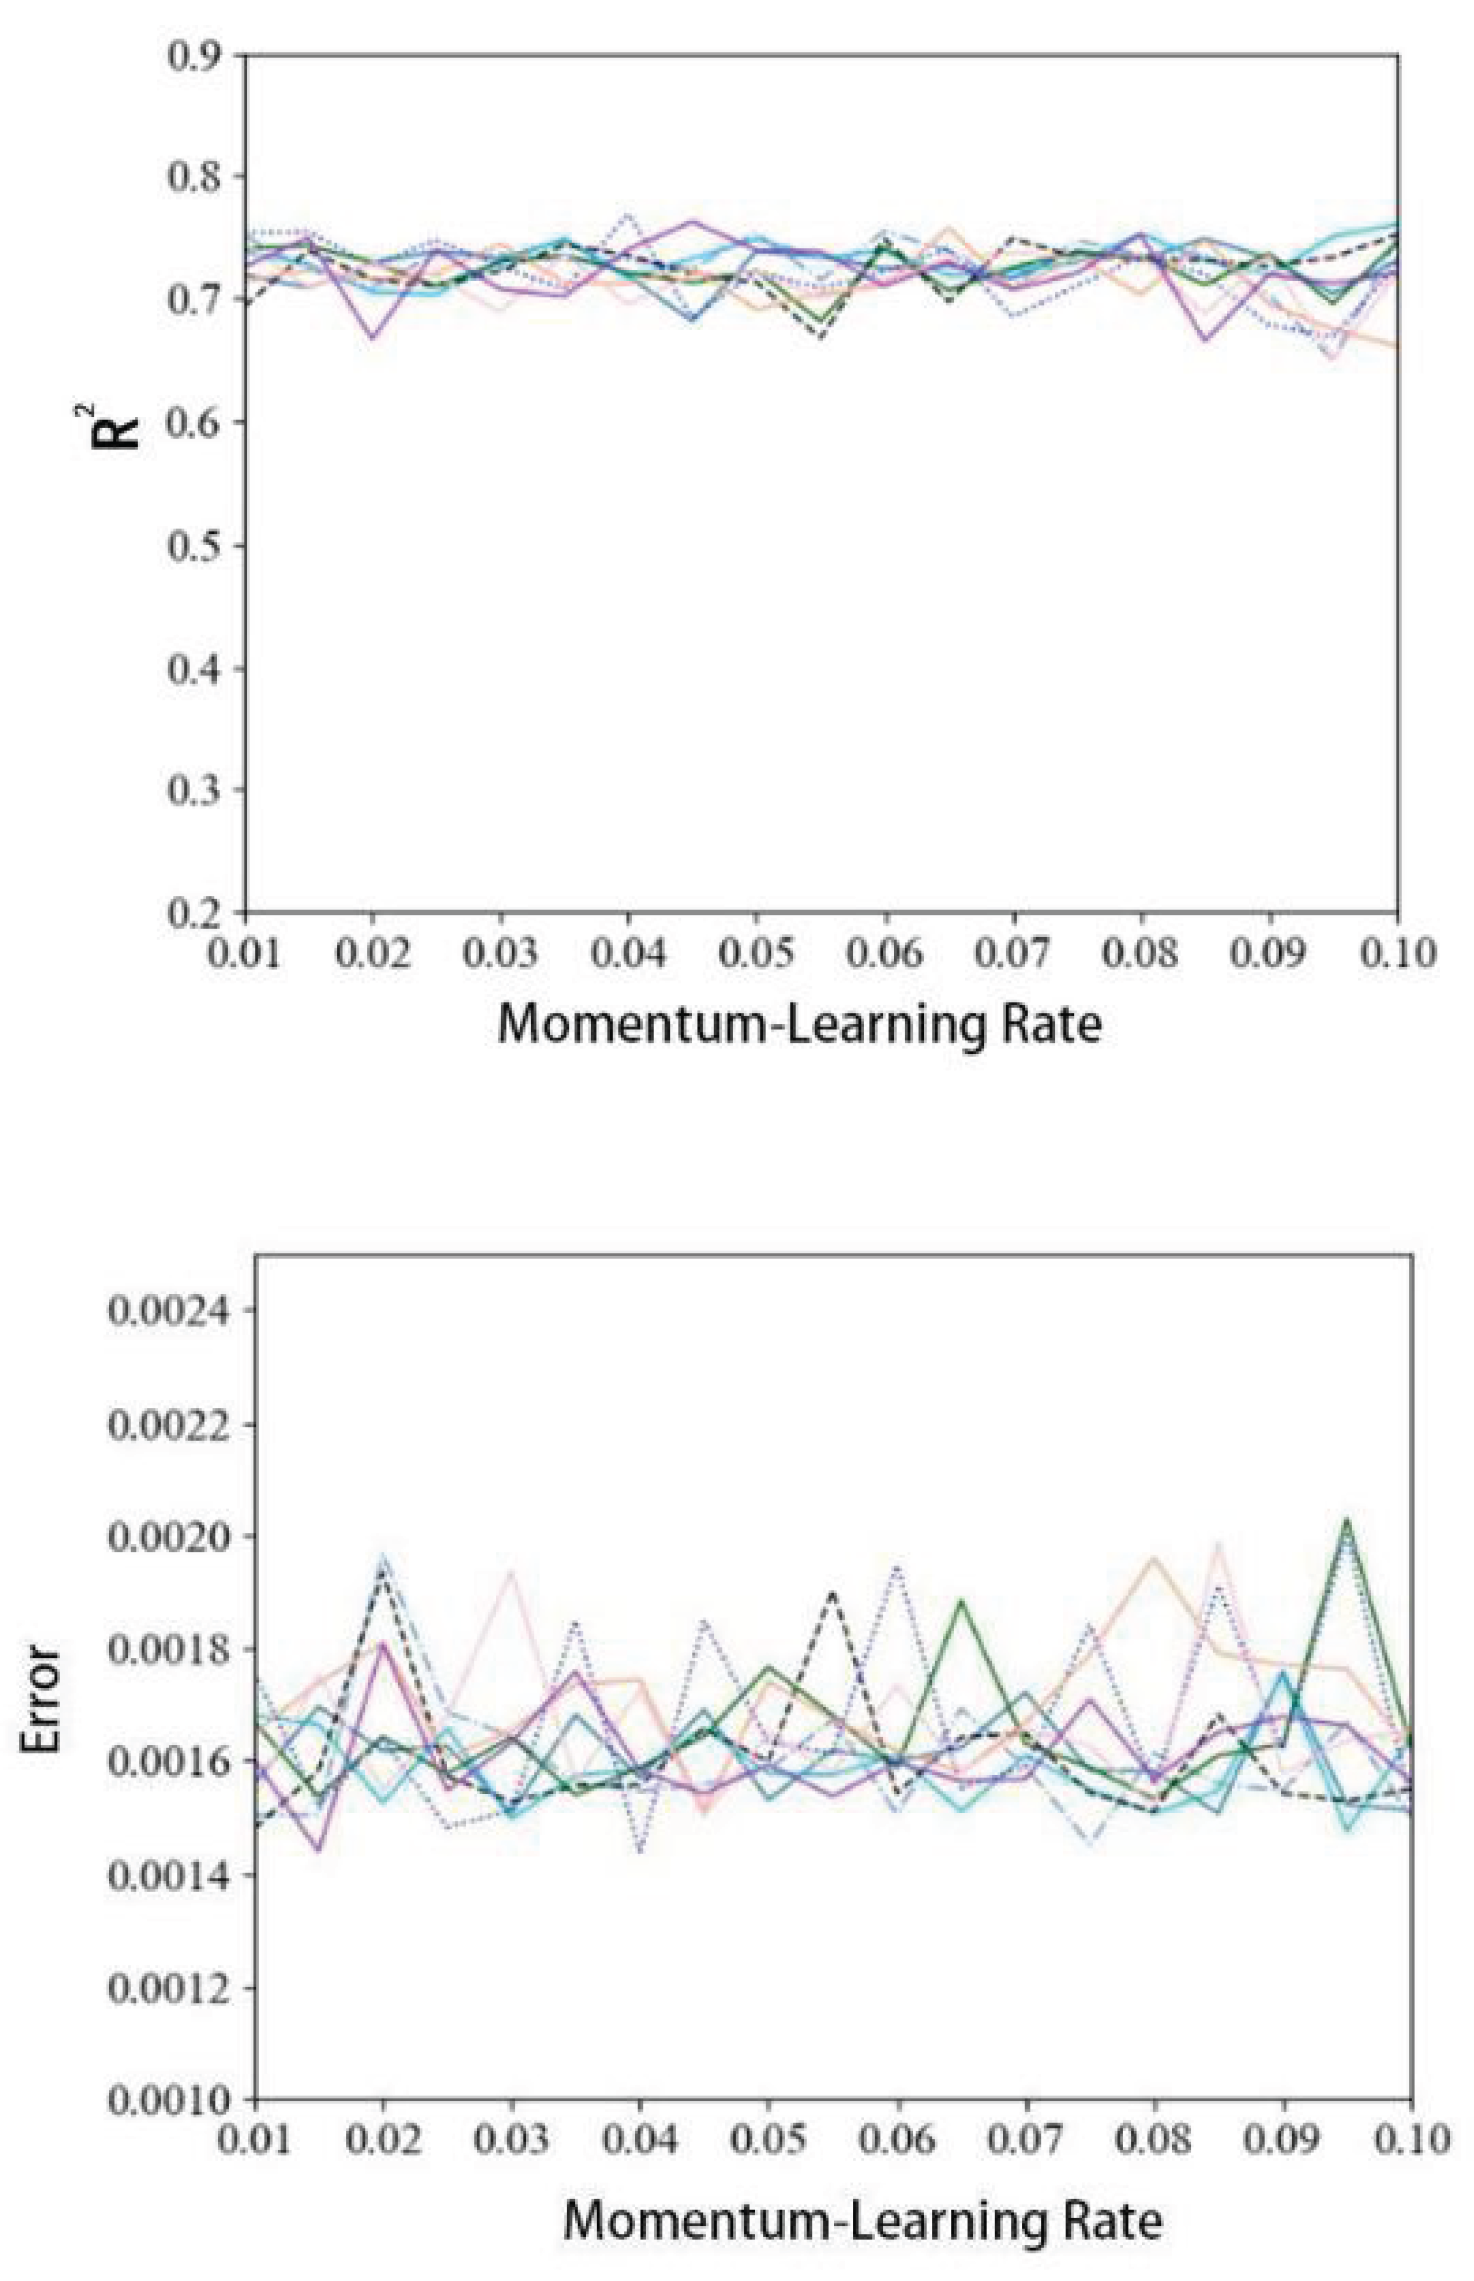
2) Learn the rate, momentum
The learning rate, a crucial neural network parameter, influences the weight changes' magnitude. Both overly high and low learning rates adversely affect the BP neural network. Momentum determines the consistency of gradient direction, boosting updates if consistent and reducing them otherwise.
Multiple tests were conducted on our BP neural network with momentum varying from 0.1 to 0.9 and learning rates from 0.01 to 0.1. The optimal result with an R2 score of 0.7688 was achieved at a momentum of 0.5 and a learning rate of 0.04.
Figure 6.
R2 score & Error line in Momentum-learning rate.
Figure 6.
R2 score & Error line in Momentum-learning rate.
3) Excitation function
In BP neural networks, excitation functions are utilized for non-linear processing. While the output layer typically uses sigmoid as default, this study tested various combinations of excitation functions. After nine trials, the optimal configuration was identified as tanh for the input layer and sigmoid for the output layer. This combination yielded an R2 score of 0.6952 and an error of 0.0018.
Table 1.
R2 Score and error of Excitation function.
Table 1.
R2 Score and error of Excitation function.
| Input layer |
Hidden layer |
Error |
R2 |
| sigmoid |
sigmoid |
0.006195 |
0.0238 |
| sigmoid |
rule |
0.003329 |
0.4171 |
| sigmoid |
tanh |
0.002153 |
0.6487 |
| rule |
sigmoid |
0.002409 |
0.5743 |
| rule |
rule |
0.002267 |
0.5972 |
| rule |
tanh |
0.001976 |
0.6877 |
| tanh |
sigmoid |
0.003035 |
0.5906 |
| tanh |
rule |
0.001943 |
0.6917 |
| tanh |
tanh |
0.001840 |
0.6952 |
4. Results
4.1. Model Prediction and Output
To avoid overlap between the training and prediction sets, the algorithm employed ten-fold cross-validation, which partitions the data into ten subsets, each in turn serving as a validation set while the remainder form the training set. This approach reduces bias and prevents the training set from coincidentally resembling the data condition, enhancing the reliability of the learning outcomes.
The BP neural network optimization model used the number of commercial POI facilities in each grid as the dependent variable and other functional POI facilities as independent variables. It was trained to optimize the 1097 grid commercial facilities within the study area. This resulted in an optimized commercial facility with an R2=0.7046, and an increase in the total number of commercial facilities from 46187 to 49871 - a more reasonable prediction.
Figure 7 displays the static density map of both the existing and optimized commercial spaces, with the density of commercial facilities in each cell indicated. The optimization results, categorized and visualized by the same criteria, were exported to the field properties in ArcGIS software. It revealed a prospective development of commercial space in Weinan's central city, centered around two agglomeration points in a multi-core pattern, with commercial complexes propelling the growth.
The optimized commercial space, spreading along traffic routes, exhibits a broader scope compared to the current state. Main expansions are westwards into the high-tech industrial development zone and northwards across the river into the economic and technological development zone.
Figure 8 overlays the optimized commercial facilities on the existing commercial space. This highlights the focus on Chaoyang Street and Lotian Street in Weinan's central city. While there are large commercial complexes on Chaoyang Street, Lotian Street lacks them. However, both areas show tight clustering of commercial facilities.
In line with traditional agglomeration theory and central place theory, both Chaoyang Street and Lotian Street emerge as future urban commercial hotspots, with Chaoyang Street demonstrating a higher level of clustering. The predicted commercial space aligns with the optimized space, thereby corroborating the agglomeration and central place theories.
4.2. Measures for the development of commercial space
1) Multi-Center Development
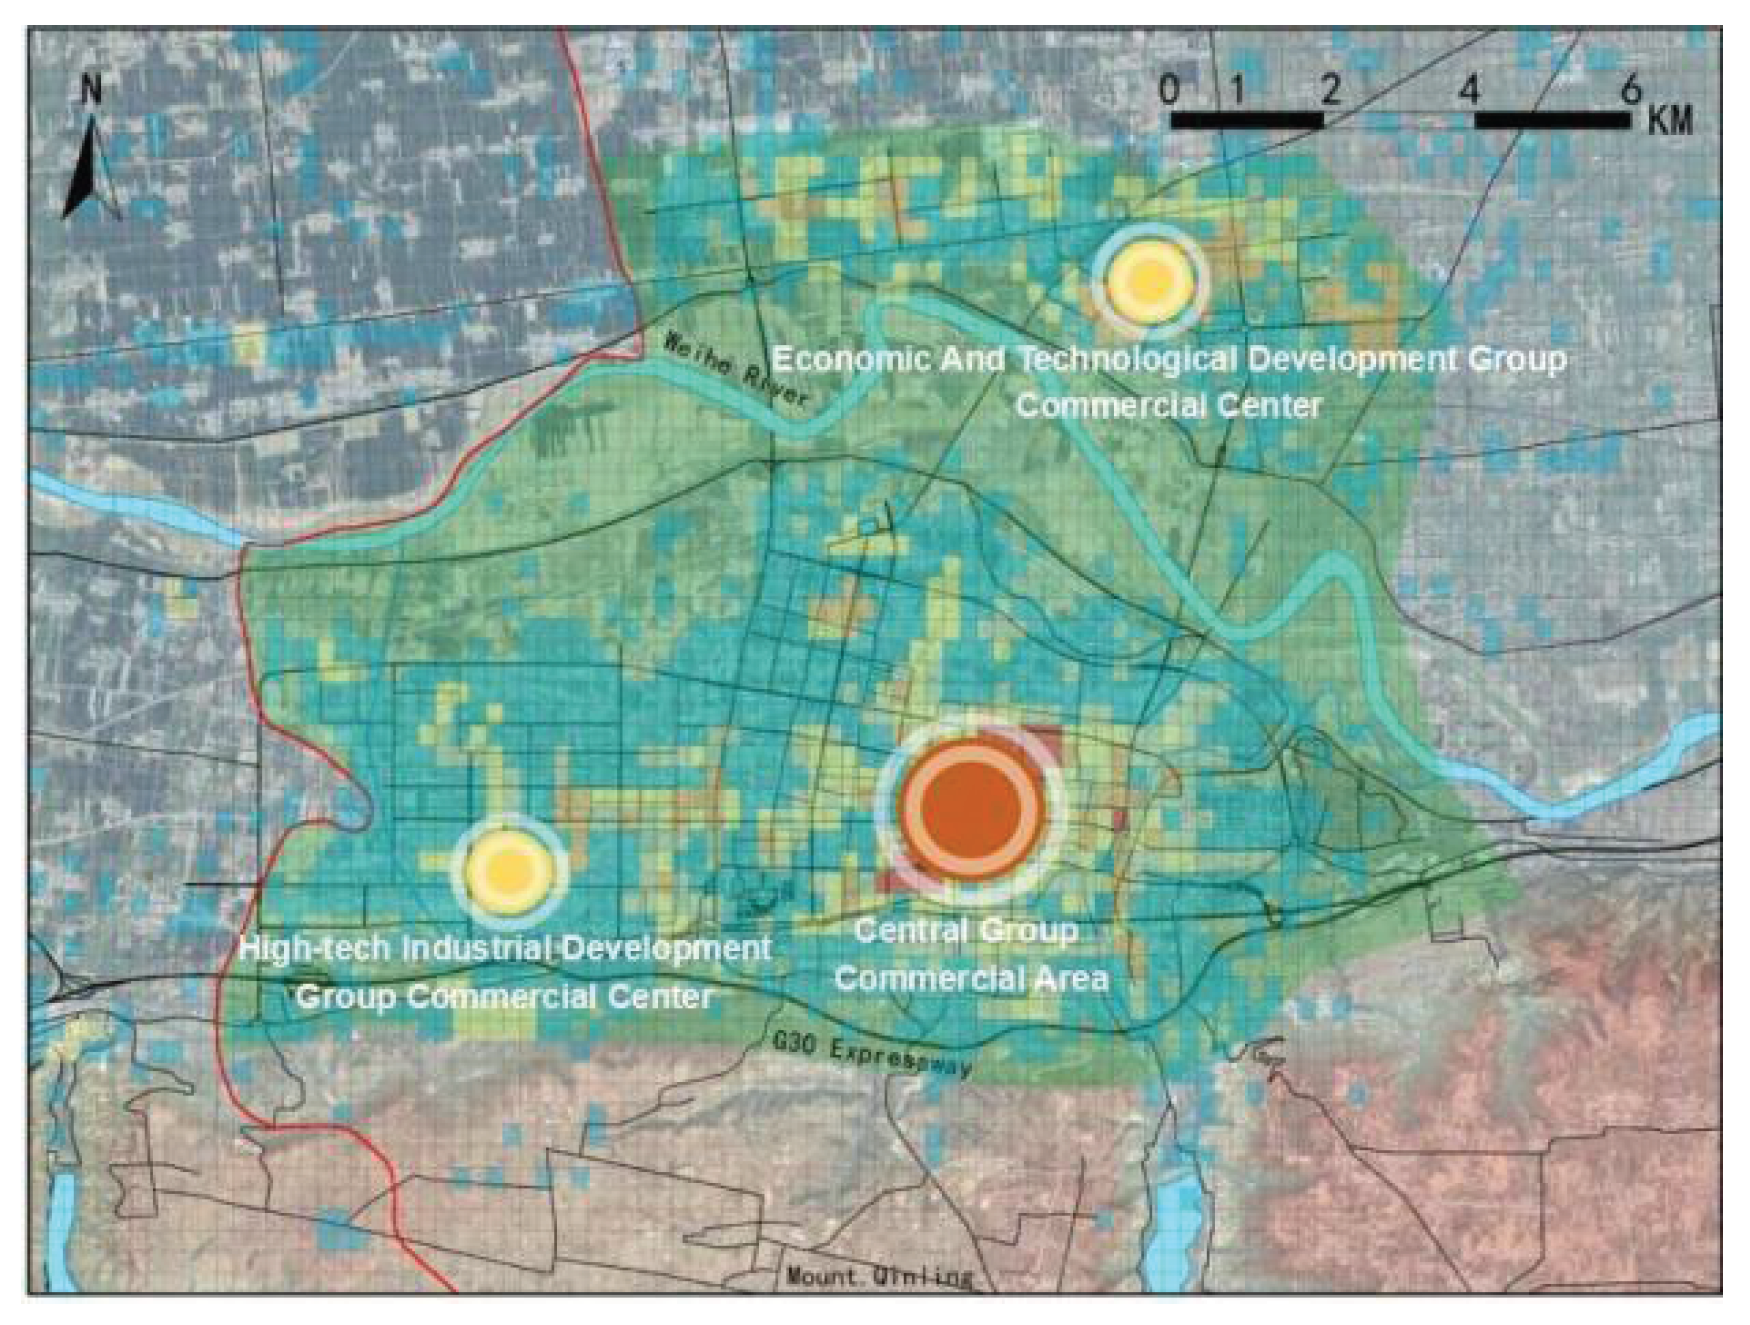
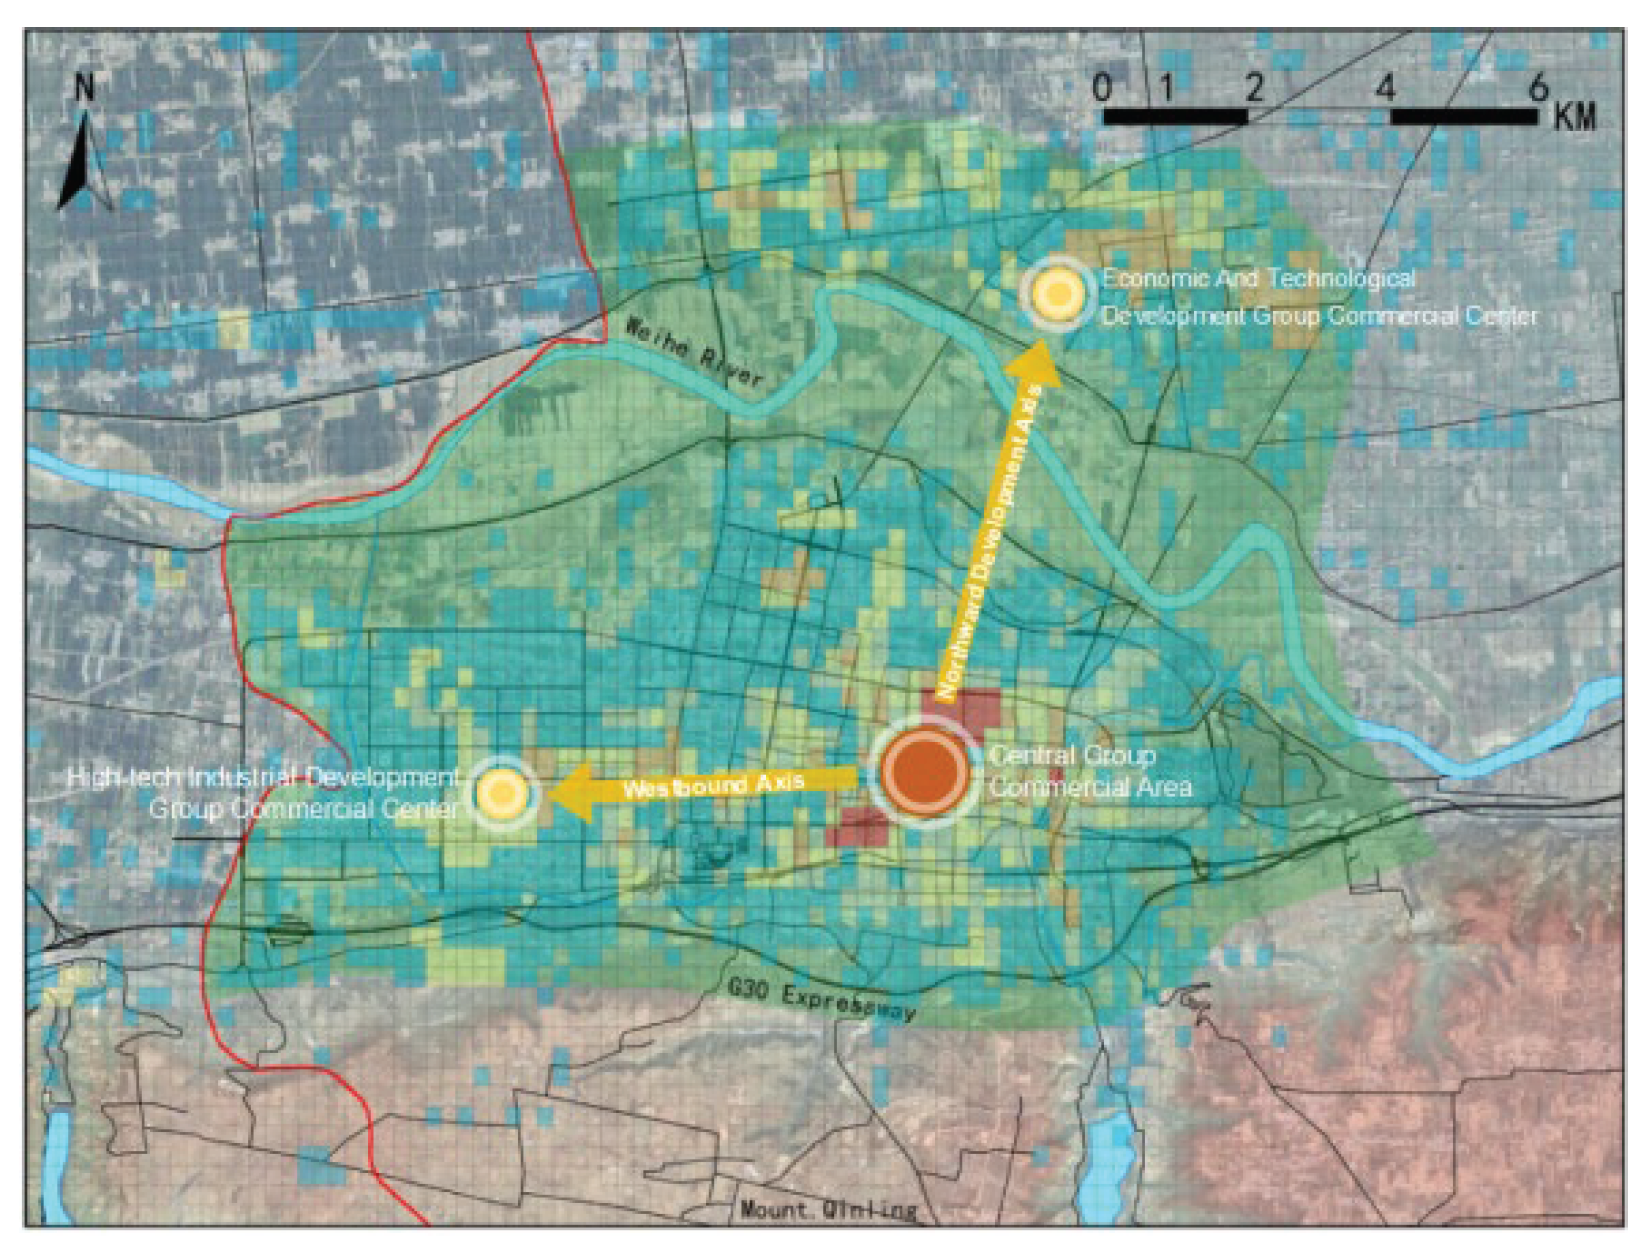
According to the optimization results, commercial space in Weinan's central city should be developed in a multi-center cluster, forming a spatial layout of "one primary and two secondary" centers as illustrated in
Figure 9.
The "primary" refers to the central group commercial area, which should continue along its current development trajectory, enhance the quality of its regional commercial facilities, and play a core driving role.
The "secondary" centers consist of the high-tech industrial development group commercial center and the economic and technological development group commercial center. The high-tech industrial development group commercial center is located in the high-tech industrial development zone, in proximity to Xi'an City, and is a significant layout area for the integration and development of Xi'an and Weinan Cities. The high-tech industrial development group should revolve around Wanda Plaza, continuously improving commercial facilities to spur the development of regional commercial space.
The economic and technological development group, located on the north bank of the Weihe River, should focus on enterprise-centered commercial facilities, enhance the degree of commercial facility aggregation, and establish a new commercial sub-center to drive the development of commercial space within the Economic and Technological Development Zone.
2) Multi-axis development
According to the optimization results, commercial space in Weinan's central city should adopt a "primary and secondary" spatial layout along the development axes.
Figure 10 illustrates these two development axes: one extending northward from the central group, and the other westward.
Commercial space development in central Weinan should primarily follow the westward axis, given its superior infrastructure environment and rapid expansion rate. Prioritizing this westward development axis can also accelerate the integration process between Xi'an and Weinan, which aligns with the planning of the Xi'an metropolitan area.
While the region north of the central group possesses abundant land resources, especially across the Weihe River, its slower development rate makes it a more suitable secondary development axis. Although the development of commercial space across the river is an inevitable trend, this area should serve as a complement to the main westward development axis.
3) Office Space Guides Business Development
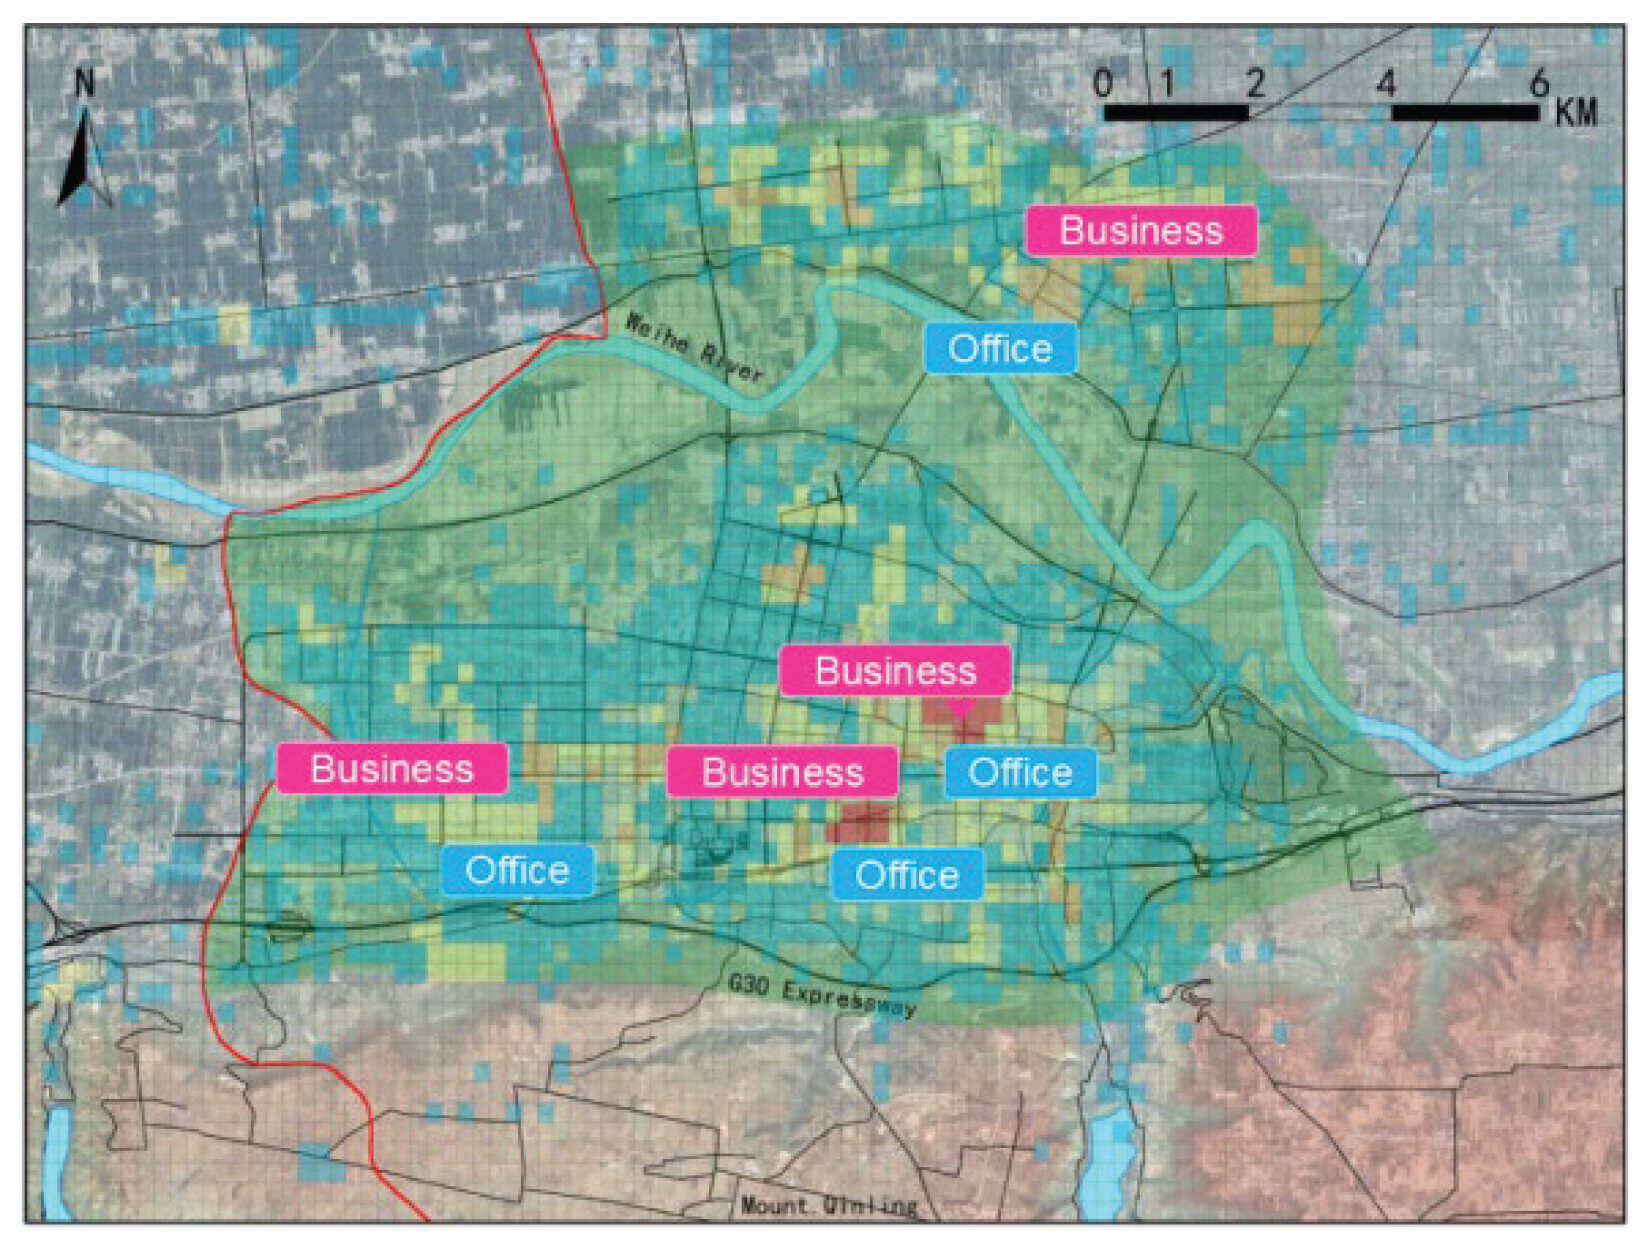
Results from related studies show that the strongest correlation between Office Function POI data and Commercial Function POI data occurs in Weinan City's central urban area. This suggests that areas with a concentration of office spaces should also be the sites for commercial facilities. Thus, when planning commercial space development, the central area of Weinan City should prioritize aligning with office spaces. This approach is both effective and sensible.
As demonstrated in
Figure 11, there is a considerable overlap between the concentration of office spaces and commercial spaces in the central cluster. This overlap will further enhance the densification of commercial spaces. Meanwhile, in the High-tech Industrial Development and the Economic and Technological Development clusters, the office and commercial spaces are somewhat distanced from each other. In these areas, the expansion of commercial spaces should progressively move toward office spaces.
5. Conclusions
The BP neural network algorithm, based on POI big data, has been leveraged to optimize the expansion of commercial space in the central urban area of Weinan City. The study reveals key insights that contribute significantly to urban development and commercial spatial planning research.
In this study, the city area of Weinan was divided into 1097 cells, and the optimization results of commercial spaces were attained through a machine learning algorithm model, achieving an R2 of 0.7046. The number of optimized commercial facilities rose from 46,187 to 49,871. This clearly indicates an upward trend in commercial development optimization. The alignment of the optimized results with reality underlines the high feasibility and robustness of the approach employed in this study. This finding expands on the existing literature on the application of machine learning in urban planning and emphasizes the importance of data-driven methods in informing spatial planning decisions.
The optimization of commercial space in Weinan's central city aligns with the agglomeration theory and central place theory. The optimized commercial space within Weinan City's downtown forms two agglomeration centers, which evolve in areas of significant original commercial clustering. The optimized commercial space of Weinan's central city displays a larger expansion area to the north and west than to the east and south, indicating the main direction of commercial space development. These findings echo prior research on urban spatial expansion that highlights the emergence of agglomeration economies in cities and reinforces the significance of agglomeration and central place theories in understanding commercial space distribution.
The optimization results suggest a threefold optimization strategy for commercial space in Weinan's central city: spatial structure, development direction, and guiding rules. The future of commercial space development in Weinan's central city is further elucidated. Regarding spatial structure, development should be multi-centered. In terms of the development direction, a multi-axis approach should be adopted. As for guiding rules, the principle of office space leading commercial space should be followed. This multi-pronged strategy offers a fresh perspective on the dynamics of urban commercial space development and suggests new ways to harmonize commercial and office space planning.
In conclusion, commercial space in Weinan's central city remains in its expansion stage. Achieving multi-center development, multi-axis development, and alignment with office space development is essential to the rational development of commercial space. This research contributes valuable insights to the understanding of urban commercial space development characteristics and the formulation of urban commercial space development plans, effectively adding to the body of literature on urban planning and development (Anas et al., 1998; Glaeser, 2010). Future research may further expand on these results and explore additional dimensions of commercial spatial planning.
References
- Yang, X.; Pu, F. Spatial Cognitive Modeling of the Site Selection for Traditional Rural Settlements: A Case Study of Kengzi Village, Southern China. J. Urban Plan. Dev. 2020, 146, 05020026. [Google Scholar] [CrossRef]
- Wang, Xiaochun. and Xiong, Feng. and Wang, Zhenwei. et al. (2021) Planning and layout of elderly care facilities based on POI big data and machine learning: the case of Wuhan City. Economic Geography, 41, 8-12.
- Rw, A. and Zf, A. and Jpa, B. etal. (2022) The distribution of green space quantity and quality and their association with neighbourhood socioeconomic conditions in Guangzhou, China: A new approach using deep learning method and street view images. Sustainable Cities and Society, 66.
- Babahajiani, P.; Fan, L.; Kämäräinen, J.-K.; Gabbouj, M. Urban 3D segmentation and modelling from street view images and LiDAR point clouds. Mach. Vis. Appl. 2017, 28, 679–694. [Google Scholar] [CrossRef]
- Saputra, Lee. (2019) Prediction of Land Use and Land Cover Changes for North Sumatra, Indonesia, Using an Artificial-Neural-Network-Based Cellular Automaton. Sustainability, 11, 3024.
- Wang, C.; Lei, S.; Elmore, A.J.; Jia, D.; Mu, S. Integrating Temporal Evolution with Cellular Automata for Simulating Land Cover Change. Remote. Sens. 2019, 11, 301. [Google Scholar] [CrossRef]
- Kamusoko, C.; Gamba, J. Simulating Urban Growth Using a Random Forest-Cellular Automata (RF-CA) Model. ISPRS Int. J. Geo-Inf. 2015, 4, 447–470. [Google Scholar] [CrossRef]
- Warth, G.; Braun, A.; Assmann, O.; Fleckenstein, K.; Hochschild, V. Prediction of Socio-Economic Indicators for Urban Planning Using VHR Satellite Imagery and Spatial Analysis. Remote. Sens. 2020, 12, 1730. [Google Scholar] [CrossRef]
- Shu, W.; Cai, K. A SVM Multi-Class Image Classification Method Based on DE and KNN in Smart City Management. IEEE Access 2019, 7, 132775–132785. [Google Scholar] [CrossRef]
- Chen, W.; Chai, H.; Zhao, Z.; Wang, Q.; Hong, H. Landslide susceptibility mapping based on GIS and support vector machine models for the Qianyang County, China. Environ. Earth Sci. 2016, 75, 1–13. [Google Scholar] [CrossRef]
- Al-Zahrani, M.A.; Abo-Monasar, A. Urban Residential Water Demand Prediction Based on Artificial Neural Networks and Time Series Models. Water Resour. Manag. 2015, 29, 3651–3662. [Google Scholar] [CrossRef]
- Kranjcic, N.; Medak, D.; Zupan, R.; Rezo, M. Machine learning methods for classification of the green infrastructure in city areas. IOP Conf. Series: Earth Environ. Sci. 2019, 362, 012079. [Google Scholar] [CrossRef]
- Li, L.; Ren, X. A Novel Evaluation Model for Urban Smart Growth Based on Principal Component Regression and Radial Basis Function Neural Network. Sustainability 2019, 11, 6125. [Google Scholar] [CrossRef]
- Li, C.; Gao, X.; Wu, J.; Wu, K. Demand prediction and regulation zoning of urban-industrial land: Evidence from Beijing-Tianjin-Hebei Urban Agglomeration, China. Environ. Monit. Assess. 2019, 191, 412. [Google Scholar] [CrossRef] [PubMed]
- Karamouz, M.; Kia, M.; Nazif, S. Prediction of Sea Level Using a Hybrid Data-Driven Model: New Challenges After Hurricane Sandy. Water Qual. Expo. Heal. 2014, 6, 63–71. [Google Scholar] [CrossRef]
- Jin, H. Prediction of direct carbon emissions of Chinese provinces using artificial neural networks. PLOS ONE 2021, 16, e0236685. [Google Scholar] [CrossRef] [PubMed]
- Zhao, X.; Song, M.; Liu, A.; Wang, Y.; Wang, T.; Cao, J. Data-Driven Temporal-Spatial Model for the Prediction of AQI in Nanjing. J. Artif. Intell. Soft Comput. Res. 2020, 10, 255–270. [Google Scholar] [CrossRef]
- Zhao J, Jin J, Xu J, et al. (2018) Risk assessment of flood disaster and forewarning model at different spatial-temporal scales. Theoretical & Applied Climatology, 132(3-4),791-808.
- Lecun Y, Bengio Y ,Hinton G .(2015) Deep learning.Nature, 521,436.
- Ganin, Y.; Ustinova, E.; Ajakan, H.; Germain, P.; Larochelle, H.; Laviolette, F.; Marchand, M.; Lempitsky, V. Domain-Adversarial Training of Neural Networks. J. Mach. Learn. Res. 2016, 17, 2096–2030. [Google Scholar] [CrossRef]
- Mohamed, A.-R.; Dahl, G.E.; Hinton, G. Acoustic Modeling Using Deep Belief Networks. IEEE Trans. Audio, Speech Lang. Process. 2011, 20, 14–22. [Google Scholar] [CrossRef]
- Rikiya Y, Mizuho N, Gian D, et al. (2018) Convolutional neural networks: an overview and application in radiology. Insights Into Imaging, 12,1-19.
- Pradhan B, Lee S. (2010) Landslide susceptibility assessment and factor effect analysis: backpropagation artificial neural networks and their comparison with frequency ratio and bivariate logistic regression modelling. Environmental Modelling & Software, 25 (6):747-759.
- Faruk, D.Ö. A hybrid neural network and ARIMA model for water quality time series prediction. Eng. Appl. Artif. Intell. 2010, 23, 586–594. [Google Scholar] [CrossRef]
- Sherstinsky A .(2021) Fundamentals of Recurrent Neural Network (RNN) and Long Short-Term Memory (LSTM) Network. Physica D: Nonlinear Phenomena, 1(1),404. [CrossRef]
- Aljarah, I.; Faris, H.; Mirjalili, S. Optimizing connection weights in neural networks using the whale optimization algorithm. Soft Comput. 2018, 22, 1–15. [Google Scholar] [CrossRef]
- Zhang Z, Wang H, Feng X,et al.(2017) Complex-Valued Convolutional Neural Network and Its Application in Polarimetric SAR Image Classification[J]. IEEE Transactions on Geoscience and Remote Sensing, PP(12):1-12.
- MK Goyal,B Bharti,J Quilty,etal. (2014) Modeling of daily pan evaporation in sub tropical climates using ANN, LS-SVR, Fuzzy Logic, and ANFIS. Expert Systems with Applications,3(1), 1-12.
|
Disclaimer/Publisher’s Note: The statements, opinions and data contained in all publications are solely those of the individual author(s) and contributor(s) and not of MDPI and/or the editor(s). MDPI and/or the editor(s) disclaim responsibility for any injury to people or property resulting from any ideas, methods, instructions or products referred to in the content. |
© 2024 by the authors. Licensee MDPI, Basel, Switzerland. This article is an open access article distributed under the terms and conditions of the Creative Commons Attribution (CC BY) license (http://creativecommons.org/licenses/by/4.0/).
