
You are currently viewing a beta version of our website. If you spot anything unusual, kindly let us know.
Preprint
Communication
Analyzing the Energy Consumption of Smart Home and Price Prediction
Altmetrics
Downloads
103
Views
32
Comments
0
A peer-reviewed article of this preprint also exists.

This version is not peer-reviewed
Abstract
This paper describes a system that is used to gather data from Smart Home sensors measuring energy consumption, analyze and predict future consumption by using machine learning algorithm for prediction. It focuses on the architecture of the system as well as the need for such system to exist in practice – why the consumption should be measured at all and how that measurement can be put to good use for achieving energy efficiency.
Keywords:
Subject: Computer Science and Mathematics - Artificial Intelligence and Machine Learning
1. Introduction
The emergence of a new computing era known as cloud computing, or more simply the cloud, was made possible by the advancement of technology and the incorporation of networks, storage, and processing power.
A technology paradigm known as "cloud computing" enables on-demand access to pooled computing resources over the internet. It is regarded as a role model for managing, storing, and analyzing data online. On-demand services, network connectivity through the Internet as a medium, shared resources, which are resources that are pooled together to be used by multiple clients, and scalability, which maintains resource elasticity, are some aspects of cloud computing. Three different delivery methods are used by cloud computing to offer various services, including:
- (1)
- Software as a service (SaaS): This enables cloud customers to access apps (PA) from providers online.
- (2)
- Platform as a Service (PaaS): This enables customers to publish their apps on a platform made available by a cloud service provider (SPC).
- (3)
- Infrastructure as a Service (IaaS): This lets users rent, store, and process data inside of SPC's infrastructure [1].
The main goal of this work is predictions, more precisely predictions for enhancing energy efficiency in smart homes through the use of machine learning algorithms. Regression and forecasting are two of the options that are accessible for this use. Regression makes predictions about the future by utilizing a model that has been trained on historical data. The model cannot be trained until sufficient historical data has been gathered. Because energy consumption patterns in these circumstances may exhibit persistent irregularities that may not have happened in the past, regression is significantly compromised. Regression depends on one or more input values to get a result, unlike forecasting. The forecasting algorithms handle the data as time series and attempt to predict the value without requiring an input parameter by using historical values.
The SSA method has been selected for the objective of forecasting. Forecasting the weather, predicting seasonal sales, and doing predictive maintenance are prominent uses for it. Achieving energy efficiency in a smart home requires forecasting, which looks at previously gathered monthly data as a time-series to estimate energy consumption for the upcoming month. More than a month ahead of time can be predicted by the algorithm. But the more points one chooses to guess, the greater the chance of receiving more wrong predictions for the points that follow the first one. Stated differently, the most accurate prediction will be made for the first value if the horizon value is greater than 1, and the accuracy will likely decrease for each subsequent value. It is advised to collect a minimum of 25 points (months) of data. In this manner, the algorithm will have sufficient information to assess the model and calculate the expected errors (Root Mean Squared Error and Mean Absolute Error).
Modern energy system management is faced with a variety of difficulties as a result of the advent of renewable energy sources and the quick change in load patterns. The gathering, processing, and archiving of a significant volume of data for system parameters and the quick and precise transmission of control information are of utmost significance for the long-term operation of complex systems like electricity and the individual components within them. A smart electric power grid's smart meter installation location for a residential customer is shown in Figure 1. A residential building's smart meter is situated at the point where the building connects to the electric grid. Data about metered electrical energy use can be transmitted to a power utility's distant data center, which is the main benefit of utilizing smart meters in a smart grid.
2. Materials and Methods
Numerous innovative use cases are possible with the automated gathering of customer electrical energy usage data and the artificial intelligence (AI) analysis of this data. A consumer-side monitoring system, like a building-level home energy management system (HEMS), is different from the smart meter in Figure 1 from the grid-level monitoring standpoint. In order to monitor household items like electrical home appliances in a home setting, such a HEMS can interface with monitoring devices such wirelessly networked plug-level power meters. A smart house is a new paradigm for a connected home environment. It is characterized as a dwelling designed with AIoT (Artificial Intelligence of Things) technologies to facilitate the provision of practical, user-centric services to its residents. As one such service applicable to appliance-level monitoring, this study analyzes time-series load modeling and forecasting for smart home automation, rather than addressing the building-level or grid-level monitoring perspective.
In order to monitor electrical energy consumption at the building and grid levels, the smart meter in Figure 1, which is situated at the building's electric grid connection entry point, can obtain circuit-level data. However, it is unable to separate this data into electrical energy consumption data at the appliance level. A standard HEMS uses plug-level power meters, or smart plugs, that are directly attached to electrical appliances to determine the electrical energy consumption of each relevant item in order to accomplish appliance-level monitoring. Installing and yearly maintenance expenses are included in the high investment burden of this load monitoring technique, which is an invasive load monitoring approach that necessitates the field deployment of these HEMS sensors [2].
Energy decomposition, which is a component of a (H)EMS, is the process of converting electrical energy consumption data at the circuit level, or smart meter data, into electrical energy consumption data at the appliance level without the need for additional plug-level power meters. This reduces the (H)EMS's installation and yearly maintenance costs. A thorough analysis of current developments in energy decomposition may be found in [3,4].
A number of practical user-centric use cases may be supported by smart meter data collected, for example, in residential settings and evaluated using energy decomposition based on signal processing and artificial intelligence techniques [3,5,6]. Home automation is one of these use cases, which includes activities of daily living (ADLs) identification for healthcare applications [7,8,9], and anomaly detection for home security [7].
The specialized cloud (private cloud) will provide services for summarizing and formatting of the data in a uniform format for storage in databases, making analyzes and forecasts. In this cloud NoSQL databases will be used, on which methods from the field of big data (BigData), such as MapReduce, Elastic Search, Data Fusion, to discover interesting relationships, patterns and dependencies in the data applicable to consumption planning of electricity and infrastructure development.
3. Results
Each of these sensors and subsystems consume electrical power, even if it is pretty small amount compared to the measured values, therefore it is wise for the results of the measuring to be put to good use to justify that extra expense. Some of the purposes are:
- Security/Stability;
- Scalability;
- Prediction.
The information about the consumed power can be used by the power supplier to decide if enough power can be provided to the system or reserved powers should be turned on in case of a shortage. Also, the electricity distribution company can use that information to ensure that the existing power supply network can handle the transmitted energy seamlessly. This is especially true during the winter when the weather is cold and therefore the consumed electrical power for heating may grow repeatedly. In this case, the current density may exceed the limit and a breakdown may occur.
where:
- J – the current density usually measured in A/mm2
- I – the current measure in A
- S – the cross section of the cable measure in mm2 or m2
If the current density exceeds curtain limit (usually 6A/mm2 for high voltage networks) then the cable melts or breaks. The electricity distribution company can place sensors on strategic positions and use their measurements in real time to determine the location or the area of eventual breakdown. Based on curtain measurements AI can decide to turn off some optional devices in order to lower down the consumption to achieve energy efficiency in Smart Home. Also, it can decide to turn on some of the devices during the specific time of the day (or night) when the cost of the consumed power is lower. The benefits and the downsides of the prediction will be discussed broadly in the next chapter of this paper.
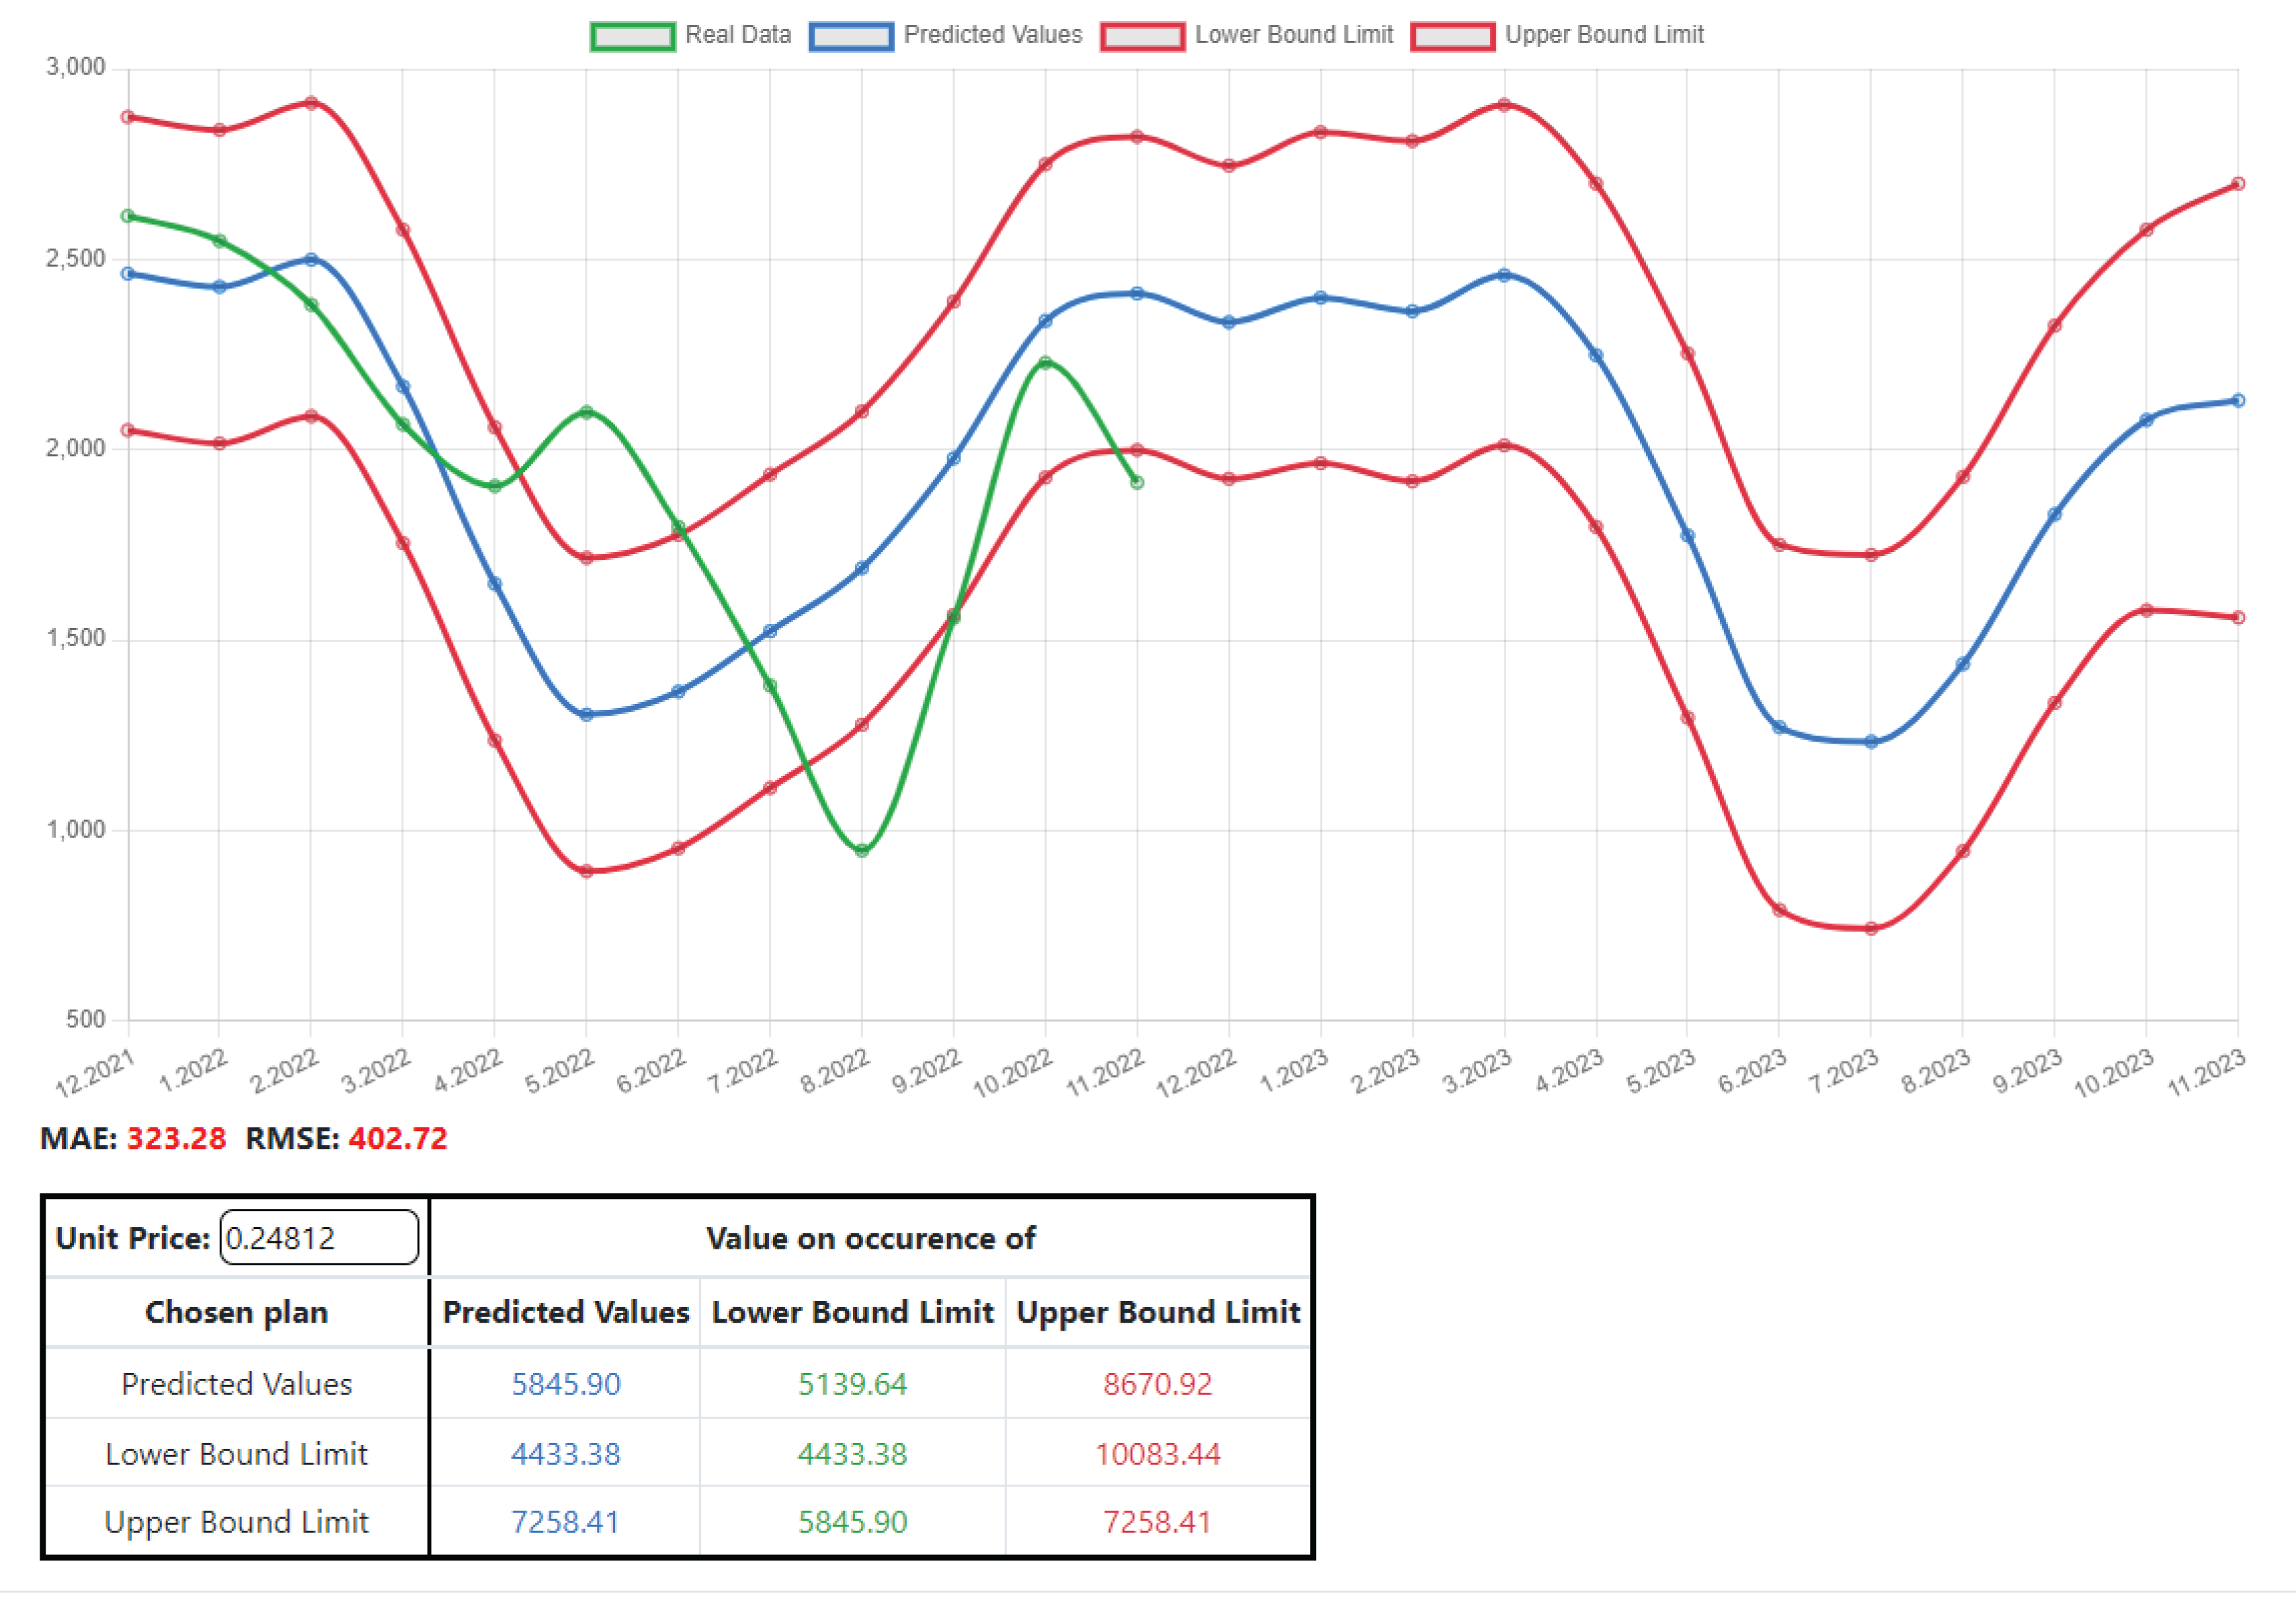
Figure 2 presents the results from the prediction. The chosen machine learning algorithm is SSA (Singular Spectrum Analysis). During the evaluation process, the two determined errors - Mean Absolute Error (MEA) and Root Mean Squared Error (RMSE) - determine how accurately the predictions were made. How closely predictions match the value actually observed is determined using the Mean Absolute Error. This integer's range is from 0 to infinity. In the direction of zero, the model's quality grows. Root Mean Squared Error is a useful tool for calculating model error. This integer's range is from 0 to infinity. In the direction of zero, the model's quality grows. These are computed in the manner described below:
where:
- n - the number of points,
- t - numbers starting from 1 to n (inclusive),
- f – forecasted values,
- d – actual (real) values, e – absolute errors
The SSA implementation in ML.NET is flexible, allowing users to choose different values for the parameters needed for prediction. These parameters are window size, with a suggested value of 12, train size, with a suggested value equal to the total number of records/points, and horizon, with a default value of 1. The window size, train size, and horizon parameters together define the number of predicted points. The user can also specify the confidence level, which the method uses to calculate the prediction's lower and upper bounds.
If data for the following month is accessible during the runtime, the user can "refresh" (add) the model without retrieving all previously obtained data.
4. Discussion
The measuring of consumed energy can be used for predictions. The main uses of which are achieving energy efficiency and best pricing. The former is done by the electric power suppliers – they can use the data to predict the consumption either in a long term or in ‘day ahead’ matter and ensure that there is enough energy produced and available. The best pricing is tight to the free market and the contracts with the electric power suppliers. The unit price on the free market varies, however, if a customer signs a contract, usually with a duration of at least one year with a power supplier or a trader then the unit price can be fixed and lower than the one on the free market, but the customer must announce the needed energy (for each individual month in advance). For such contracts, if a customer does not consume all of the announced energy, then the remaining (not consumed) energy gets sold back to the supplier at half price. If the customer consumes more than the announced energy, then the quantity that exceeds the announced one is paid by the customer at double price. This can make the use of AI to predict the future consumption extremely beneficial. This can also be combined with means of storing energy. For example, if one has a way to store energy usually in a battery, then the AI can decide to do it when the monthly consumption is lower than the announced one instead of selling it back at half price. Of course, in order to achieve that the AI must know how much energy it can store and how much time it takes to store it. Then during months when the consumed energy is about to exceed the announced one, this stored energy can be used for compensation instead of buying at double price. Such long term contracts have one disadvantage – they rely on the stability of the system. For example, if a new consumer is either is added to or removed from the system then the predicted (announced) quantities of energy will differ from the actual ones and this will affect the bills.
In practice, the proposed system utilizes a machine learning algorithm for prediction of consumed energy. By analyzing previously gathered monthly data as a time-series, forecasting algorithm is used to anticipate the amount of energy that will be consumed in the upcoming month. By default, the algorithm predicts the consumption for the next 12 months (a horizon of 12). The user can then see the quantities of energy for each month and their prices based on a unit price entered by the user. The algorithm also calculates and displays the lowest and the highest possible consumptions with a probability of 95%, so the user can decide which case suits him best. For instance, if the user expected a new consumer to be attached to the system, then picking up values around the highest possible consumption (upper bound limit) would be best.
5. Conclusions
With the help of ML.NET, this paper predicts the smart home's monthly energy consumption. Machine learning methods, such as forecasting and more specifically the SSA algorithm, are employed in smart homes to achieve energy efficiency. Making forecasts about future behavior involves using historical time-series data. The implementation of the UI application that displays the data graphically, predicts future usage and makes price prediction is presented in this study.
Acknowledgments
This work has been supported by the European Regional Development Fund within the Operational Programme “Science and Education for Smart Growth 2014 - 2020” under the Project Center of Competence “Intelligent mechatronics, eco- and energy-saving systems and technologies”BG05M2OP001-1.002-0023-C0.
References
- D. Mohamed, D. El-Menshawy, S. El-Abd, M. Ahmad, and M. Samir Abou El-Seoud, “I energy efficiency in cloud computing,” International Journal of Machine Learning and Computing, vol. 9, no. 1, 2019.
- Lin, Yu-Hsiu & Tang, Huei-Sheng & Shen, Ting-Yu & Hsia, Chih-Hsien. (2022). A Smart Home Energy Management System Utilizing Neurocomputing-Based Time-Series Load Modeling and Forecasting Facilitated by Energy Decomposition for Smart Home Automation. IEEE Access. PP. 1-1. [CrossRef]
- B. Völker, A. Reinhardt, A. Faustine, and L. Pereira, “Watt’s up at home? Smart meter data analytics from a consumer-centric perspective,” Energies, vol. 14, p. 719, 2021. [CrossRef]
- Tundis, A. Faizan, and M. Mühlhäuser, “A feature-based model for the identification of electrical devices in smart environments,” Sensors, vol. 19, p. 2611, 2019. [CrossRef]
- Y. Himeur, A. Alsalemi, F. Bensaali, A. Amira, and A. Al-Kababji, “Recent trends of smart non-intrusive load monitoring in buildings: a review, open challenges and future directions,” Int. J. Intell. Syst., Early Access, pp. 1-56, 2022.
- E. McKenna, I. Richardson, and M. Thomson, “Smart meter data: Balancing consumer privacy concerns with legitimate applications,” Energy Policy, vol. 41, pp. 807-814, 2012.
- L. G. Fahad and S. F. Tahir, “Activity recognition and anomaly detection in smart homes,” Neurocomputing, vol. 423, pp. 362-372, 2021.
- Y. H. Lin, “An advanced smart home energy management system considering identification of ADLs based on non-intrusive load monitoring,” Electr. Eng., Early Access, 2022.
- M. Amayri, S. Ploix, H. Kazmi, Q. D. Ngo, and E. A. E. Safadi, “Estimating occupancy from measurements and knowledge using the Bayesian network for energy management,” J. Sensors, vol. 2019, p. 7129872, 2019.
- Zeeshan Ahmed, Saeed Amizadeh, Mikhail Bilenko, Rogan Carr, Wei-Sheng Chin, Yael Dekel, Xavier Dupre, Vadim Eksarevskiy, Senja Filipi, Tom Finley, Abhishek Goswami, Monte Hoover, Scott Inglis, Matteo Interlandi, Najeeb Kazmi, Gleb Krivosheev, Pete Luferenko, Ivan Matantsev, Sergiy Matusevych, Shahab Moradi, Gani Nazirov, Justin Ormont, Gal Oshri, Artidoro Pagnoni, Jignesh Parmar, Prabhat Roy, Mohammad Zeeshan Siddiqui, Markus Weimer, Shauheen Zahirazami, and Yiwen Zhu. 2019. Machine Learning at Microsoft with ML.NET. In Proceedings of the 25th ACM SIGKDD International Conference on Knowledge Discovery & Data Mining (KDD '19). Association for Computing Machinery, New York, NY, USA, 2448–2458. [CrossRef]
- Xinlong Bao. 2009. Applying machine learning for prediction, recommendation, and integration. Ph.D. Dissertation. Oregon State University, USA. Advisor(s) Tom Dietterich. Order Number: AAI3380852.
Figure 1.
Smart meter installed for a residential consumer in a smart electric power grid.
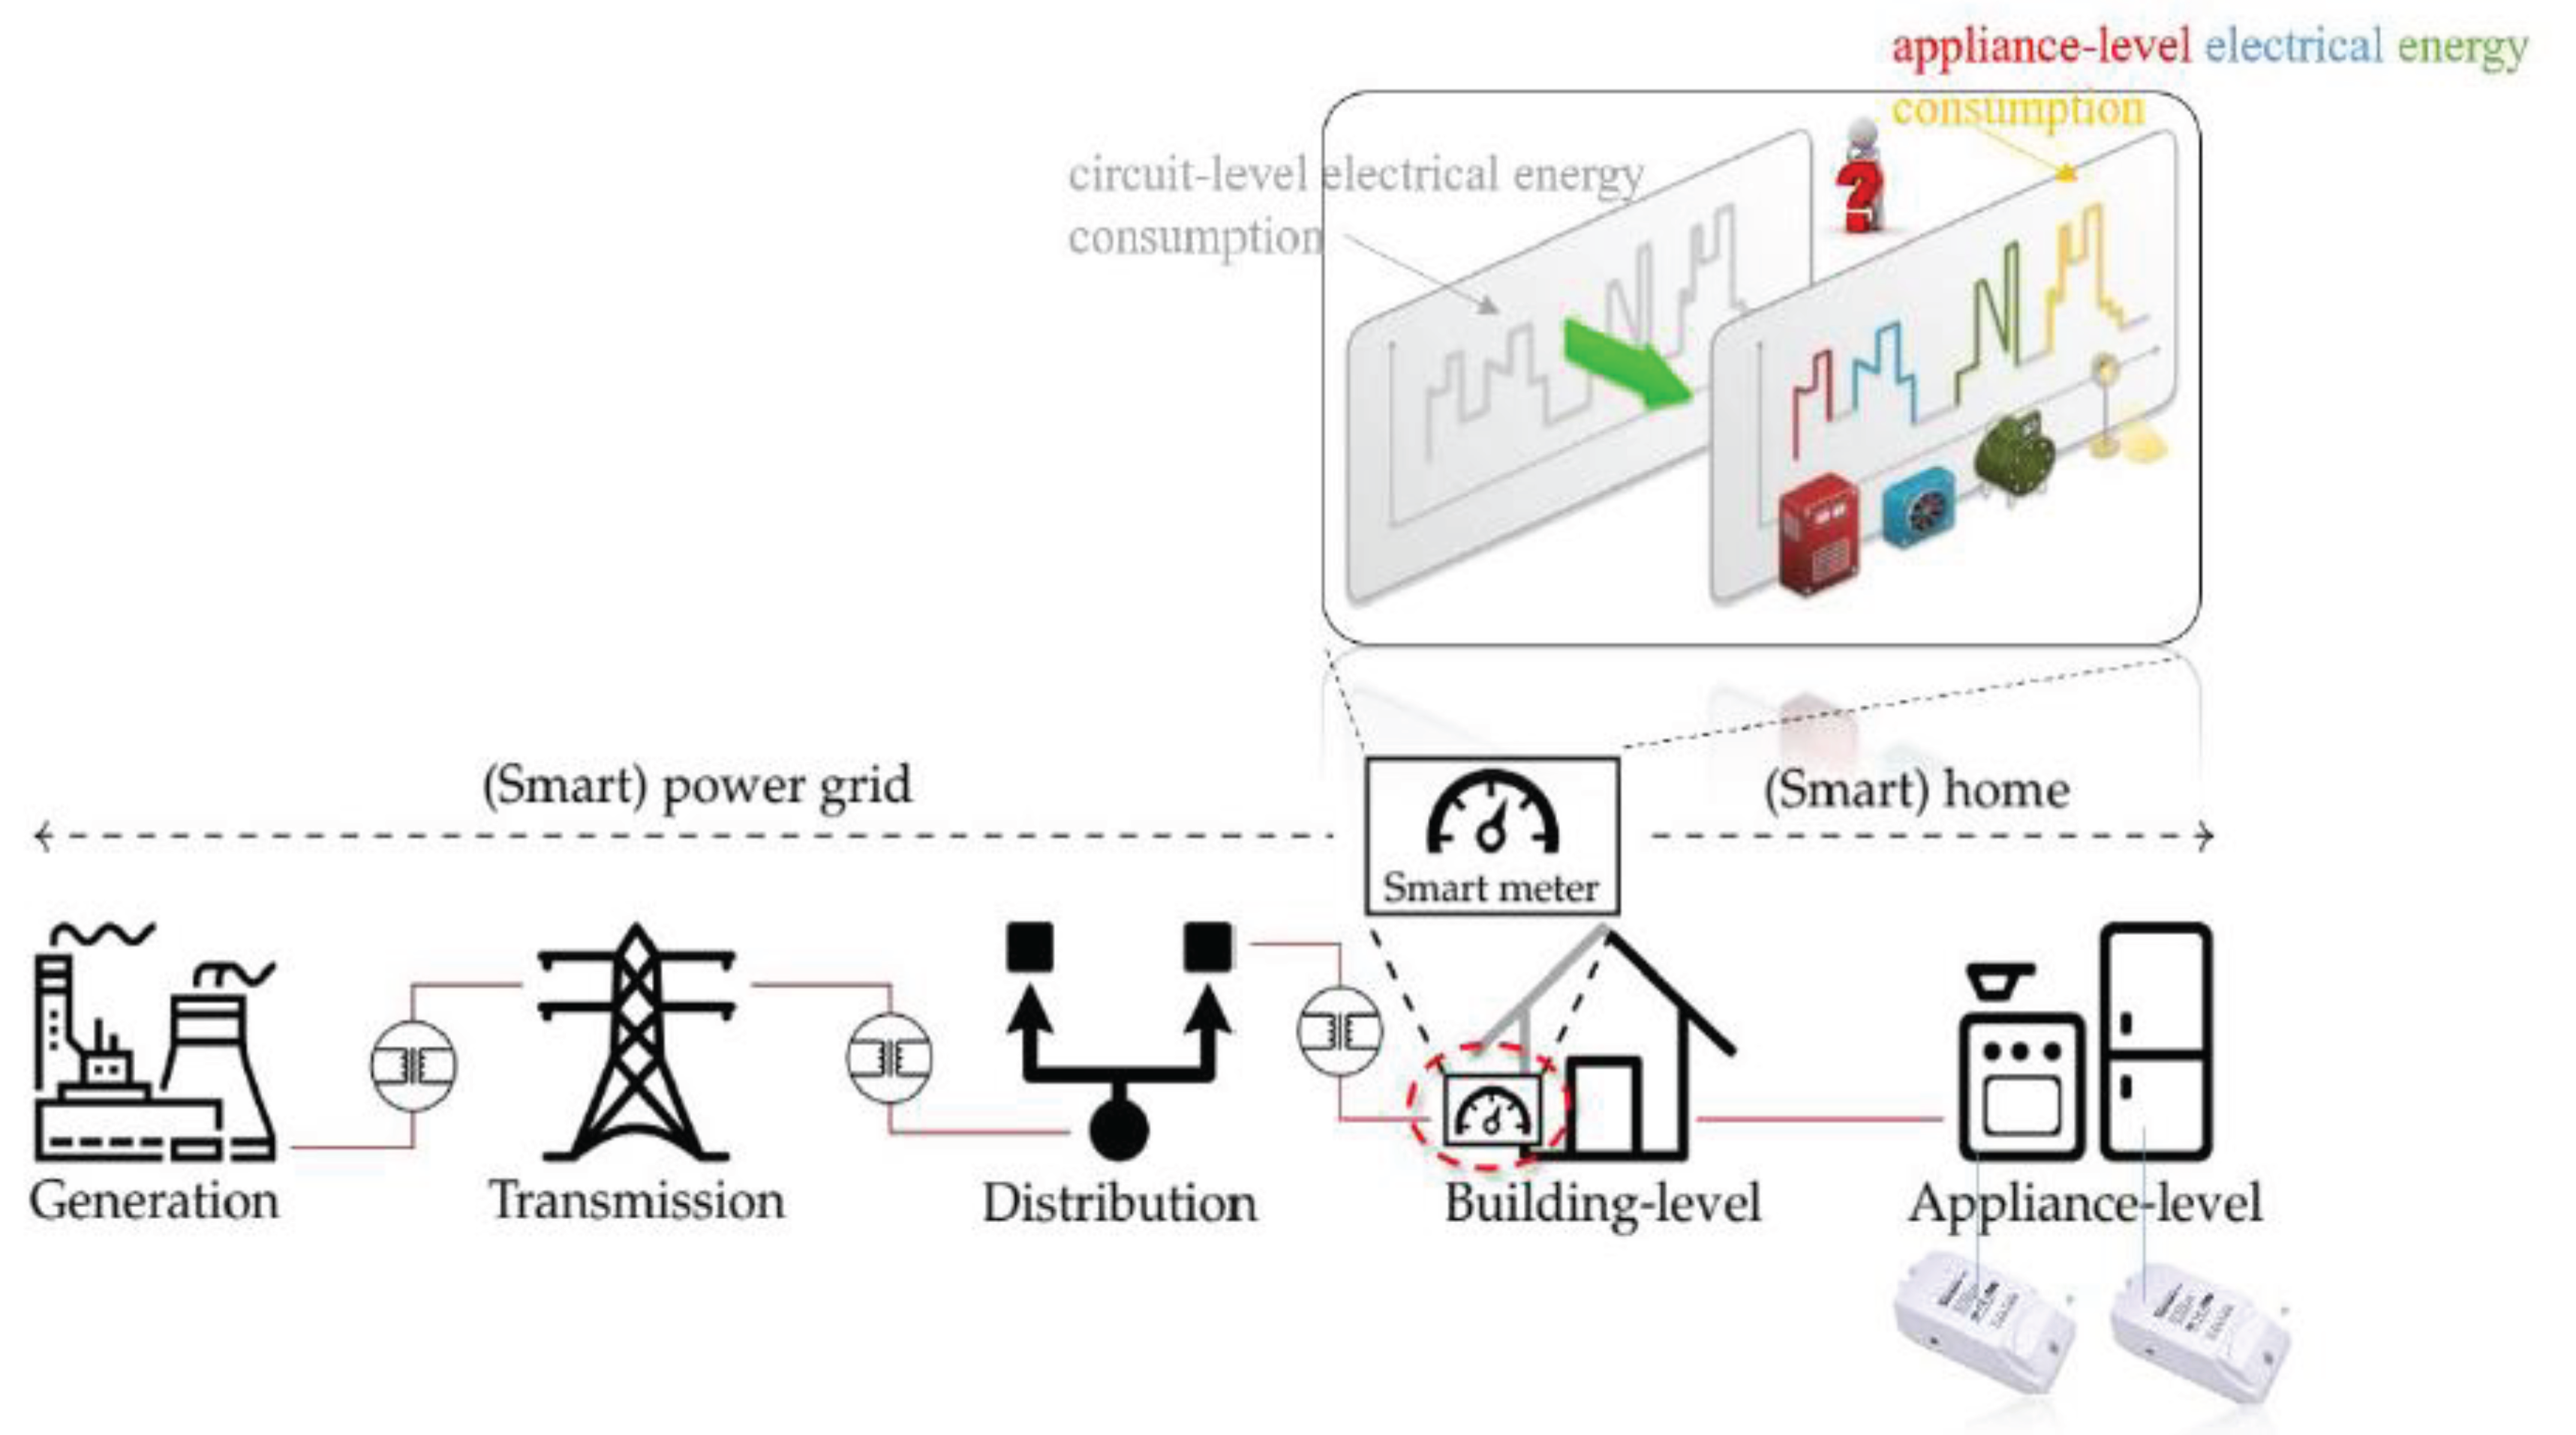
Figure 2.
Results from prediction.
Disclaimer/Publisher’s Note: The statements, opinions and data contained in all publications are solely those of the individual author(s) and contributor(s) and not of MDPI and/or the editor(s). MDPI and/or the editor(s) disclaim responsibility for any injury to people or property resulting from any ideas, methods, instructions or products referred to in the content. |
© 2024 by the authors. Licensee MDPI, Basel, Switzerland. This article is an open access article distributed under the terms and conditions of the Creative Commons Attribution (CC BY) license (http://creativecommons.org/licenses/by/4.0/).
Copyright: This open access article is published under a Creative Commons CC BY 4.0 license, which permit the free download, distribution, and reuse, provided that the author and preprint are cited in any reuse.
Submitted:
21 March 2024
Posted:
22 March 2024
You are already at the latest version
Alerts
A peer-reviewed article of this preprint also exists.
This version is not peer-reviewed
Submitted:
21 March 2024
Posted:
22 March 2024
You are already at the latest version
Alerts
Abstract
This paper describes a system that is used to gather data from Smart Home sensors measuring energy consumption, analyze and predict future consumption by using machine learning algorithm for prediction. It focuses on the architecture of the system as well as the need for such system to exist in practice – why the consumption should be measured at all and how that measurement can be put to good use for achieving energy efficiency.
Keywords:
Subject: Computer Science and Mathematics - Artificial Intelligence and Machine Learning
1. Introduction
The emergence of a new computing era known as cloud computing, or more simply the cloud, was made possible by the advancement of technology and the incorporation of networks, storage, and processing power.
A technology paradigm known as "cloud computing" enables on-demand access to pooled computing resources over the internet. It is regarded as a role model for managing, storing, and analyzing data online. On-demand services, network connectivity through the Internet as a medium, shared resources, which are resources that are pooled together to be used by multiple clients, and scalability, which maintains resource elasticity, are some aspects of cloud computing. Three different delivery methods are used by cloud computing to offer various services, including:
- (1)
- Software as a service (SaaS): This enables cloud customers to access apps (PA) from providers online.
- (2)
- Platform as a Service (PaaS): This enables customers to publish their apps on a platform made available by a cloud service provider (SPC).
- (3)
- Infrastructure as a Service (IaaS): This lets users rent, store, and process data inside of SPC's infrastructure [1].
The main goal of this work is predictions, more precisely predictions for enhancing energy efficiency in smart homes through the use of machine learning algorithms. Regression and forecasting are two of the options that are accessible for this use. Regression makes predictions about the future by utilizing a model that has been trained on historical data. The model cannot be trained until sufficient historical data has been gathered. Because energy consumption patterns in these circumstances may exhibit persistent irregularities that may not have happened in the past, regression is significantly compromised. Regression depends on one or more input values to get a result, unlike forecasting. The forecasting algorithms handle the data as time series and attempt to predict the value without requiring an input parameter by using historical values.
The SSA method has been selected for the objective of forecasting. Forecasting the weather, predicting seasonal sales, and doing predictive maintenance are prominent uses for it. Achieving energy efficiency in a smart home requires forecasting, which looks at previously gathered monthly data as a time-series to estimate energy consumption for the upcoming month. More than a month ahead of time can be predicted by the algorithm. But the more points one chooses to guess, the greater the chance of receiving more wrong predictions for the points that follow the first one. Stated differently, the most accurate prediction will be made for the first value if the horizon value is greater than 1, and the accuracy will likely decrease for each subsequent value. It is advised to collect a minimum of 25 points (months) of data. In this manner, the algorithm will have sufficient information to assess the model and calculate the expected errors (Root Mean Squared Error and Mean Absolute Error).
Modern energy system management is faced with a variety of difficulties as a result of the advent of renewable energy sources and the quick change in load patterns. The gathering, processing, and archiving of a significant volume of data for system parameters and the quick and precise transmission of control information are of utmost significance for the long-term operation of complex systems like electricity and the individual components within them. A smart electric power grid's smart meter installation location for a residential customer is shown in Figure 1. A residential building's smart meter is situated at the point where the building connects to the electric grid. Data about metered electrical energy use can be transmitted to a power utility's distant data center, which is the main benefit of utilizing smart meters in a smart grid.
2. Materials and Methods
Numerous innovative use cases are possible with the automated gathering of customer electrical energy usage data and the artificial intelligence (AI) analysis of this data. A consumer-side monitoring system, like a building-level home energy management system (HEMS), is different from the smart meter in Figure 1 from the grid-level monitoring standpoint. In order to monitor household items like electrical home appliances in a home setting, such a HEMS can interface with monitoring devices such wirelessly networked plug-level power meters. A smart house is a new paradigm for a connected home environment. It is characterized as a dwelling designed with AIoT (Artificial Intelligence of Things) technologies to facilitate the provision of practical, user-centric services to its residents. As one such service applicable to appliance-level monitoring, this study analyzes time-series load modeling and forecasting for smart home automation, rather than addressing the building-level or grid-level monitoring perspective.
In order to monitor electrical energy consumption at the building and grid levels, the smart meter in Figure 1, which is situated at the building's electric grid connection entry point, can obtain circuit-level data. However, it is unable to separate this data into electrical energy consumption data at the appliance level. A standard HEMS uses plug-level power meters, or smart plugs, that are directly attached to electrical appliances to determine the electrical energy consumption of each relevant item in order to accomplish appliance-level monitoring. Installing and yearly maintenance expenses are included in the high investment burden of this load monitoring technique, which is an invasive load monitoring approach that necessitates the field deployment of these HEMS sensors [2].
Energy decomposition, which is a component of a (H)EMS, is the process of converting electrical energy consumption data at the circuit level, or smart meter data, into electrical energy consumption data at the appliance level without the need for additional plug-level power meters. This reduces the (H)EMS's installation and yearly maintenance costs. A thorough analysis of current developments in energy decomposition may be found in [3,4].
A number of practical user-centric use cases may be supported by smart meter data collected, for example, in residential settings and evaluated using energy decomposition based on signal processing and artificial intelligence techniques [3,5,6]. Home automation is one of these use cases, which includes activities of daily living (ADLs) identification for healthcare applications [7,8,9], and anomaly detection for home security [7].
The specialized cloud (private cloud) will provide services for summarizing and formatting of the data in a uniform format for storage in databases, making analyzes and forecasts. In this cloud NoSQL databases will be used, on which methods from the field of big data (BigData), such as MapReduce, Elastic Search, Data Fusion, to discover interesting relationships, patterns and dependencies in the data applicable to consumption planning of electricity and infrastructure development.
3. Results
Each of these sensors and subsystems consume electrical power, even if it is pretty small amount compared to the measured values, therefore it is wise for the results of the measuring to be put to good use to justify that extra expense. Some of the purposes are:
- Security/Stability;
- Scalability;
- Prediction.
The information about the consumed power can be used by the power supplier to decide if enough power can be provided to the system or reserved powers should be turned on in case of a shortage. Also, the electricity distribution company can use that information to ensure that the existing power supply network can handle the transmitted energy seamlessly. This is especially true during the winter when the weather is cold and therefore the consumed electrical power for heating may grow repeatedly. In this case, the current density may exceed the limit and a breakdown may occur.
where:
- J – the current density usually measured in A/mm2
- I – the current measure in A
- S – the cross section of the cable measure in mm2 or m2
If the current density exceeds curtain limit (usually 6A/mm2 for high voltage networks) then the cable melts or breaks. The electricity distribution company can place sensors on strategic positions and use their measurements in real time to determine the location or the area of eventual breakdown. Based on curtain measurements AI can decide to turn off some optional devices in order to lower down the consumption to achieve energy efficiency in Smart Home. Also, it can decide to turn on some of the devices during the specific time of the day (or night) when the cost of the consumed power is lower. The benefits and the downsides of the prediction will be discussed broadly in the next chapter of this paper.
Figure 2 presents the results from the prediction. The chosen machine learning algorithm is SSA (Singular Spectrum Analysis). During the evaluation process, the two determined errors - Mean Absolute Error (MEA) and Root Mean Squared Error (RMSE) - determine how accurately the predictions were made. How closely predictions match the value actually observed is determined using the Mean Absolute Error. This integer's range is from 0 to infinity. In the direction of zero, the model's quality grows. Root Mean Squared Error is a useful tool for calculating model error. This integer's range is from 0 to infinity. In the direction of zero, the model's quality grows. These are computed in the manner described below:
where:
- n - the number of points,
- t - numbers starting from 1 to n (inclusive),
- f – forecasted values,
- d – actual (real) values, e – absolute errors
The SSA implementation in ML.NET is flexible, allowing users to choose different values for the parameters needed for prediction. These parameters are window size, with a suggested value of 12, train size, with a suggested value equal to the total number of records/points, and horizon, with a default value of 1. The window size, train size, and horizon parameters together define the number of predicted points. The user can also specify the confidence level, which the method uses to calculate the prediction's lower and upper bounds.
If data for the following month is accessible during the runtime, the user can "refresh" (add) the model without retrieving all previously obtained data.
4. Discussion
The measuring of consumed energy can be used for predictions. The main uses of which are achieving energy efficiency and best pricing. The former is done by the electric power suppliers – they can use the data to predict the consumption either in a long term or in ‘day ahead’ matter and ensure that there is enough energy produced and available. The best pricing is tight to the free market and the contracts with the electric power suppliers. The unit price on the free market varies, however, if a customer signs a contract, usually with a duration of at least one year with a power supplier or a trader then the unit price can be fixed and lower than the one on the free market, but the customer must announce the needed energy (for each individual month in advance). For such contracts, if a customer does not consume all of the announced energy, then the remaining (not consumed) energy gets sold back to the supplier at half price. If the customer consumes more than the announced energy, then the quantity that exceeds the announced one is paid by the customer at double price. This can make the use of AI to predict the future consumption extremely beneficial. This can also be combined with means of storing energy. For example, if one has a way to store energy usually in a battery, then the AI can decide to do it when the monthly consumption is lower than the announced one instead of selling it back at half price. Of course, in order to achieve that the AI must know how much energy it can store and how much time it takes to store it. Then during months when the consumed energy is about to exceed the announced one, this stored energy can be used for compensation instead of buying at double price. Such long term contracts have one disadvantage – they rely on the stability of the system. For example, if a new consumer is either is added to or removed from the system then the predicted (announced) quantities of energy will differ from the actual ones and this will affect the bills.
In practice, the proposed system utilizes a machine learning algorithm for prediction of consumed energy. By analyzing previously gathered monthly data as a time-series, forecasting algorithm is used to anticipate the amount of energy that will be consumed in the upcoming month. By default, the algorithm predicts the consumption for the next 12 months (a horizon of 12). The user can then see the quantities of energy for each month and their prices based on a unit price entered by the user. The algorithm also calculates and displays the lowest and the highest possible consumptions with a probability of 95%, so the user can decide which case suits him best. For instance, if the user expected a new consumer to be attached to the system, then picking up values around the highest possible consumption (upper bound limit) would be best.
5. Conclusions
With the help of ML.NET, this paper predicts the smart home's monthly energy consumption. Machine learning methods, such as forecasting and more specifically the SSA algorithm, are employed in smart homes to achieve energy efficiency. Making forecasts about future behavior involves using historical time-series data. The implementation of the UI application that displays the data graphically, predicts future usage and makes price prediction is presented in this study.
Acknowledgments
This work has been supported by the European Regional Development Fund within the Operational Programme “Science and Education for Smart Growth 2014 - 2020” under the Project Center of Competence “Intelligent mechatronics, eco- and energy-saving systems and technologies”BG05M2OP001-1.002-0023-C0.
References
- D. Mohamed, D. El-Menshawy, S. El-Abd, M. Ahmad, and M. Samir Abou El-Seoud, “I energy efficiency in cloud computing,” International Journal of Machine Learning and Computing, vol. 9, no. 1, 2019.
- Lin, Yu-Hsiu & Tang, Huei-Sheng & Shen, Ting-Yu & Hsia, Chih-Hsien. (2022). A Smart Home Energy Management System Utilizing Neurocomputing-Based Time-Series Load Modeling and Forecasting Facilitated by Energy Decomposition for Smart Home Automation. IEEE Access. PP. 1-1. [CrossRef]
- B. Völker, A. Reinhardt, A. Faustine, and L. Pereira, “Watt’s up at home? Smart meter data analytics from a consumer-centric perspective,” Energies, vol. 14, p. 719, 2021. [CrossRef]
- Tundis, A. Faizan, and M. Mühlhäuser, “A feature-based model for the identification of electrical devices in smart environments,” Sensors, vol. 19, p. 2611, 2019. [CrossRef]
- Y. Himeur, A. Alsalemi, F. Bensaali, A. Amira, and A. Al-Kababji, “Recent trends of smart non-intrusive load monitoring in buildings: a review, open challenges and future directions,” Int. J. Intell. Syst., Early Access, pp. 1-56, 2022.
- E. McKenna, I. Richardson, and M. Thomson, “Smart meter data: Balancing consumer privacy concerns with legitimate applications,” Energy Policy, vol. 41, pp. 807-814, 2012.
- L. G. Fahad and S. F. Tahir, “Activity recognition and anomaly detection in smart homes,” Neurocomputing, vol. 423, pp. 362-372, 2021.
- Y. H. Lin, “An advanced smart home energy management system considering identification of ADLs based on non-intrusive load monitoring,” Electr. Eng., Early Access, 2022.
- M. Amayri, S. Ploix, H. Kazmi, Q. D. Ngo, and E. A. E. Safadi, “Estimating occupancy from measurements and knowledge using the Bayesian network for energy management,” J. Sensors, vol. 2019, p. 7129872, 2019.
- Zeeshan Ahmed, Saeed Amizadeh, Mikhail Bilenko, Rogan Carr, Wei-Sheng Chin, Yael Dekel, Xavier Dupre, Vadim Eksarevskiy, Senja Filipi, Tom Finley, Abhishek Goswami, Monte Hoover, Scott Inglis, Matteo Interlandi, Najeeb Kazmi, Gleb Krivosheev, Pete Luferenko, Ivan Matantsev, Sergiy Matusevych, Shahab Moradi, Gani Nazirov, Justin Ormont, Gal Oshri, Artidoro Pagnoni, Jignesh Parmar, Prabhat Roy, Mohammad Zeeshan Siddiqui, Markus Weimer, Shauheen Zahirazami, and Yiwen Zhu. 2019. Machine Learning at Microsoft with ML.NET. In Proceedings of the 25th ACM SIGKDD International Conference on Knowledge Discovery & Data Mining (KDD '19). Association for Computing Machinery, New York, NY, USA, 2448–2458. [CrossRef]
- Xinlong Bao. 2009. Applying machine learning for prediction, recommendation, and integration. Ph.D. Dissertation. Oregon State University, USA. Advisor(s) Tom Dietterich. Order Number: AAI3380852.
Figure 1.
Smart meter installed for a residential consumer in a smart electric power grid.
Figure 2.
Results from prediction.
Disclaimer/Publisher’s Note: The statements, opinions and data contained in all publications are solely those of the individual author(s) and contributor(s) and not of MDPI and/or the editor(s). MDPI and/or the editor(s) disclaim responsibility for any injury to people or property resulting from any ideas, methods, instructions or products referred to in the content. |
© 2024 by the authors. Licensee MDPI, Basel, Switzerland. This article is an open access article distributed under the terms and conditions of the Creative Commons Attribution (CC BY) license (http://creativecommons.org/licenses/by/4.0/).
Copyright: This open access article is published under a Creative Commons CC BY 4.0 license, which permit the free download, distribution, and reuse, provided that the author and preprint are cited in any reuse.
New Method of Modeling Daily Energy Consumption
Krzysztof Karpio
et al.
Energies,
2023
Machine Learning for Identifying Demand Patterns of Home Energy Management Systems with Dynamic Electricity Pricing
Derck Koolen
et al.
Applied Sciences,
2017
Home Energy Forecast Performance Tool for Smart Living Services Suppliers under an Energy 4.0 and CPS Framework
Filipe Rodrigues
et al.
Energies,
2022


MDPI Initiatives
Important Links
© 2024 MDPI (Basel, Switzerland) unless otherwise stated