Submitted:
20 March 2024
Posted:
22 March 2024
You are already at the latest version
Abstract
Keywords:
1. Introduction
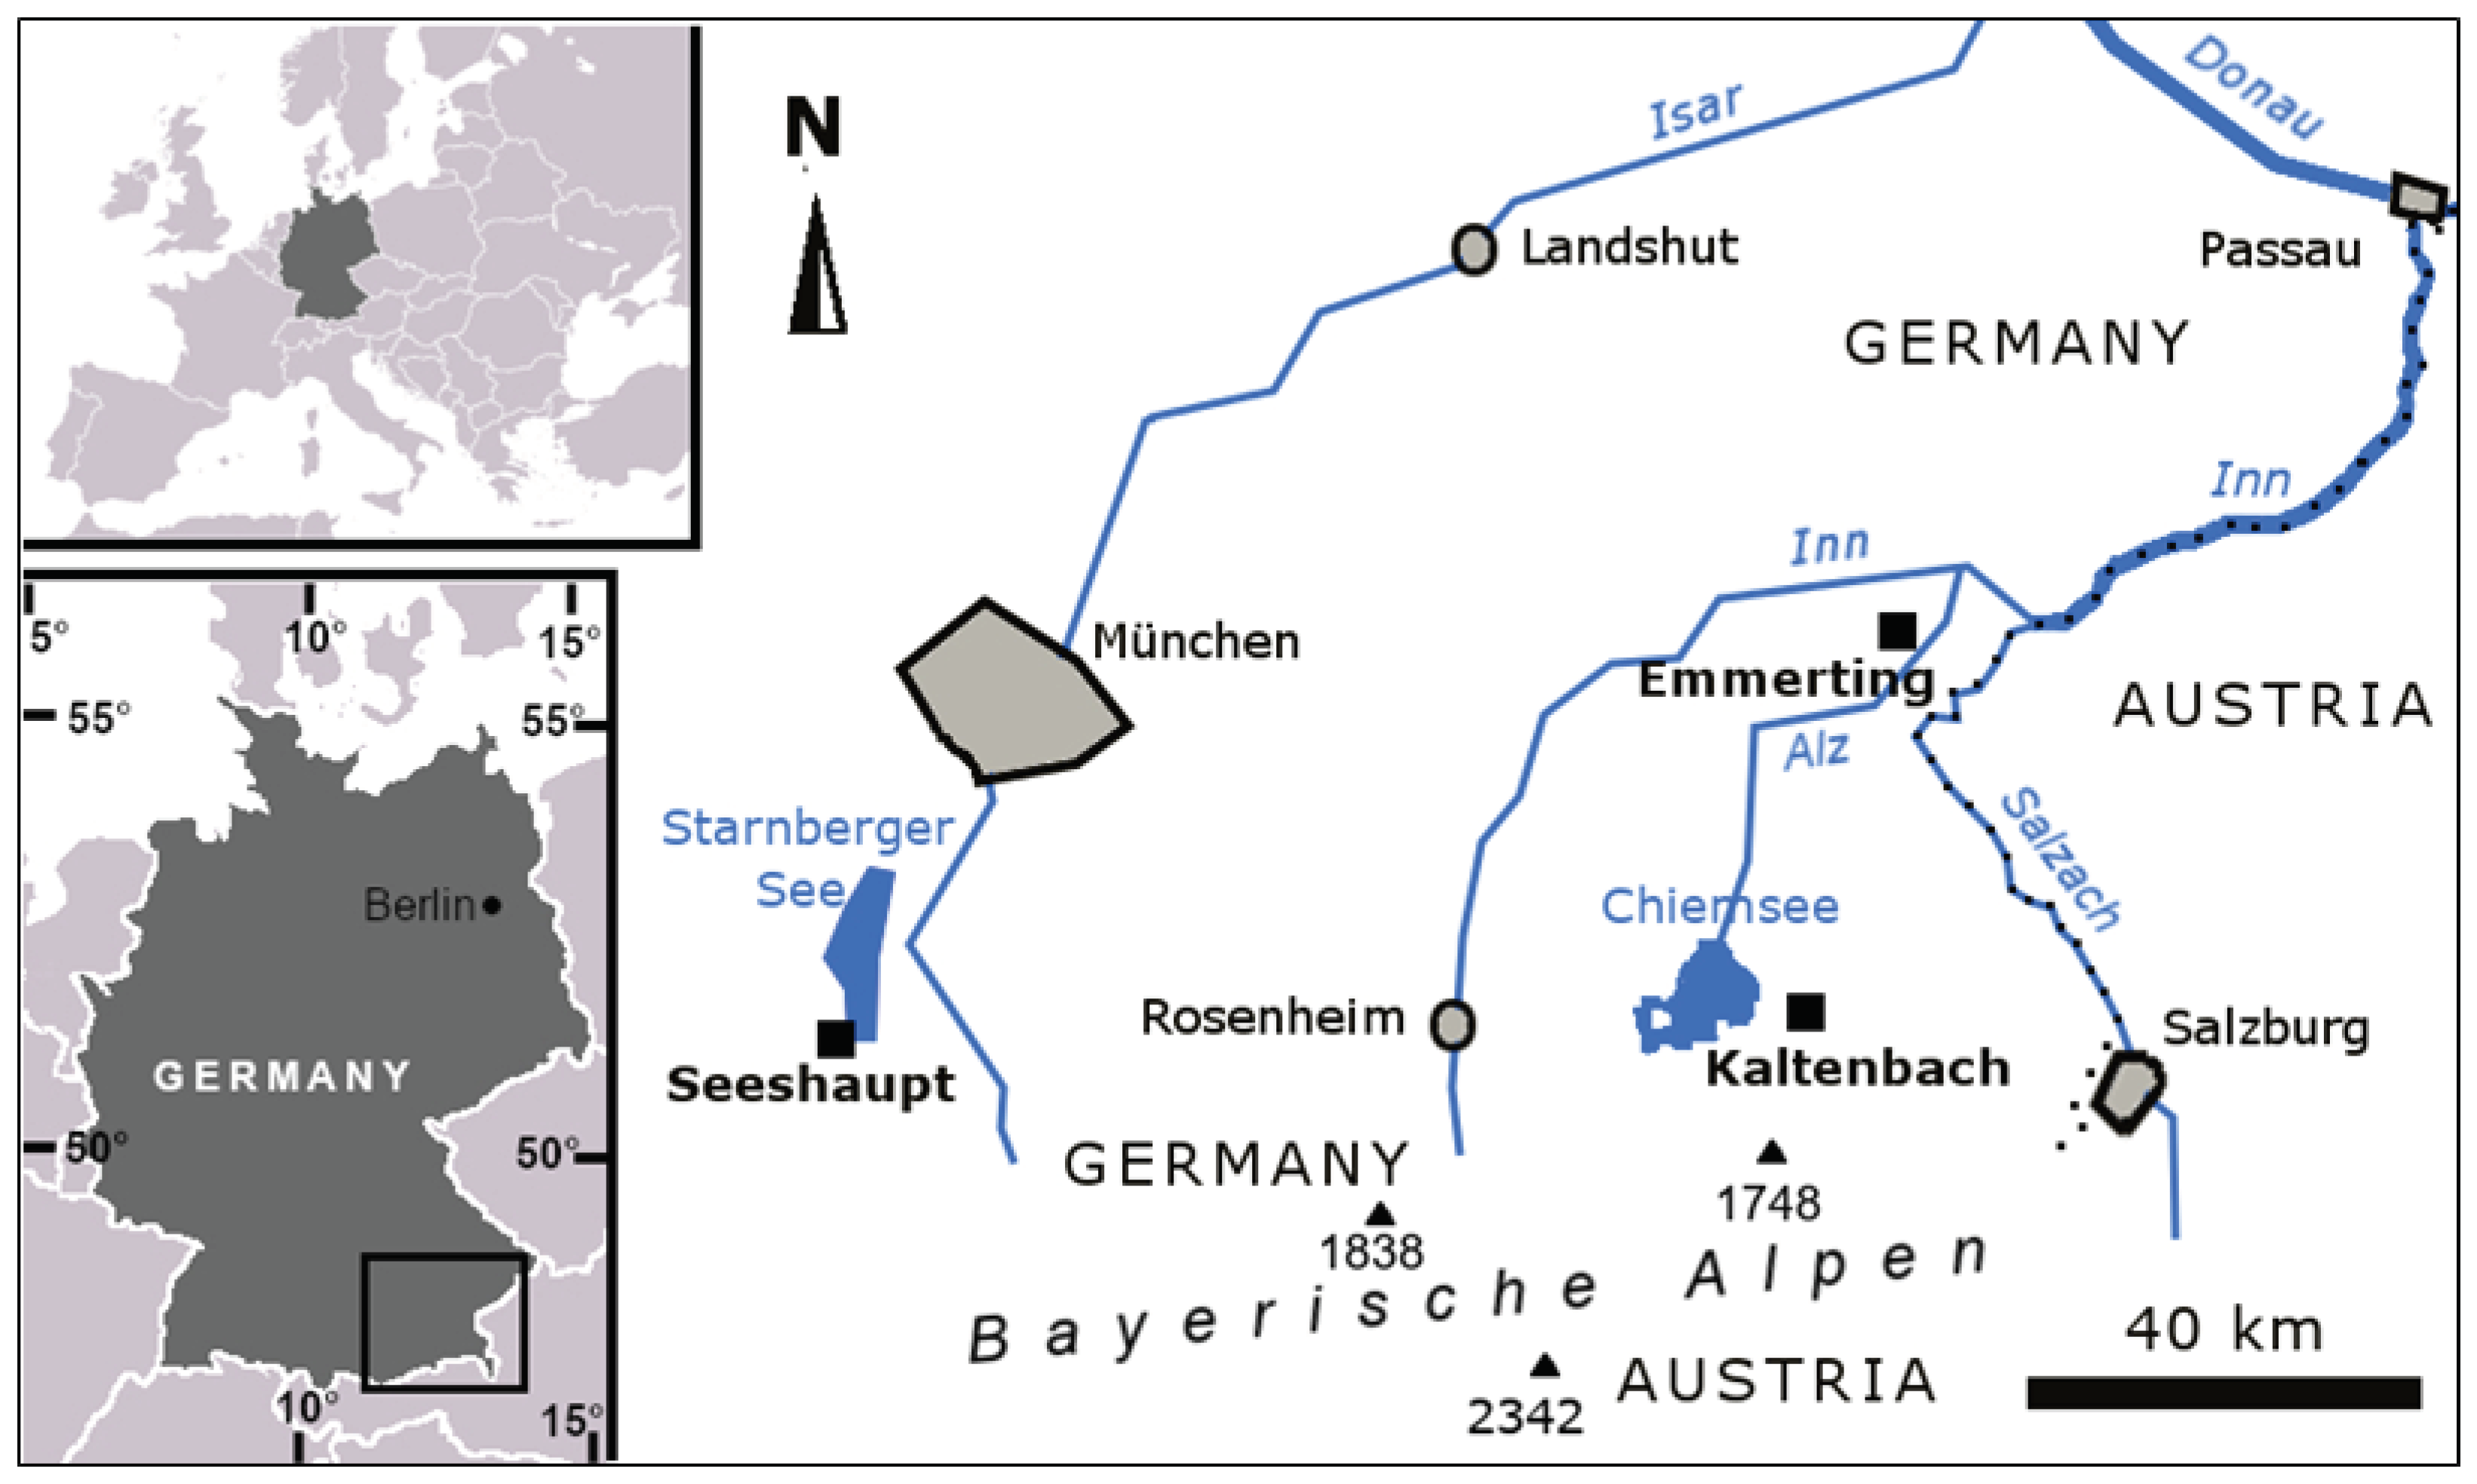
1.1. Limekilns in the Surroundings of Seeshaupt
1.2. Craters at Emmerting and Potential Crater at Grabenstätt-Kaltenbach
2. Site and Sampling Description
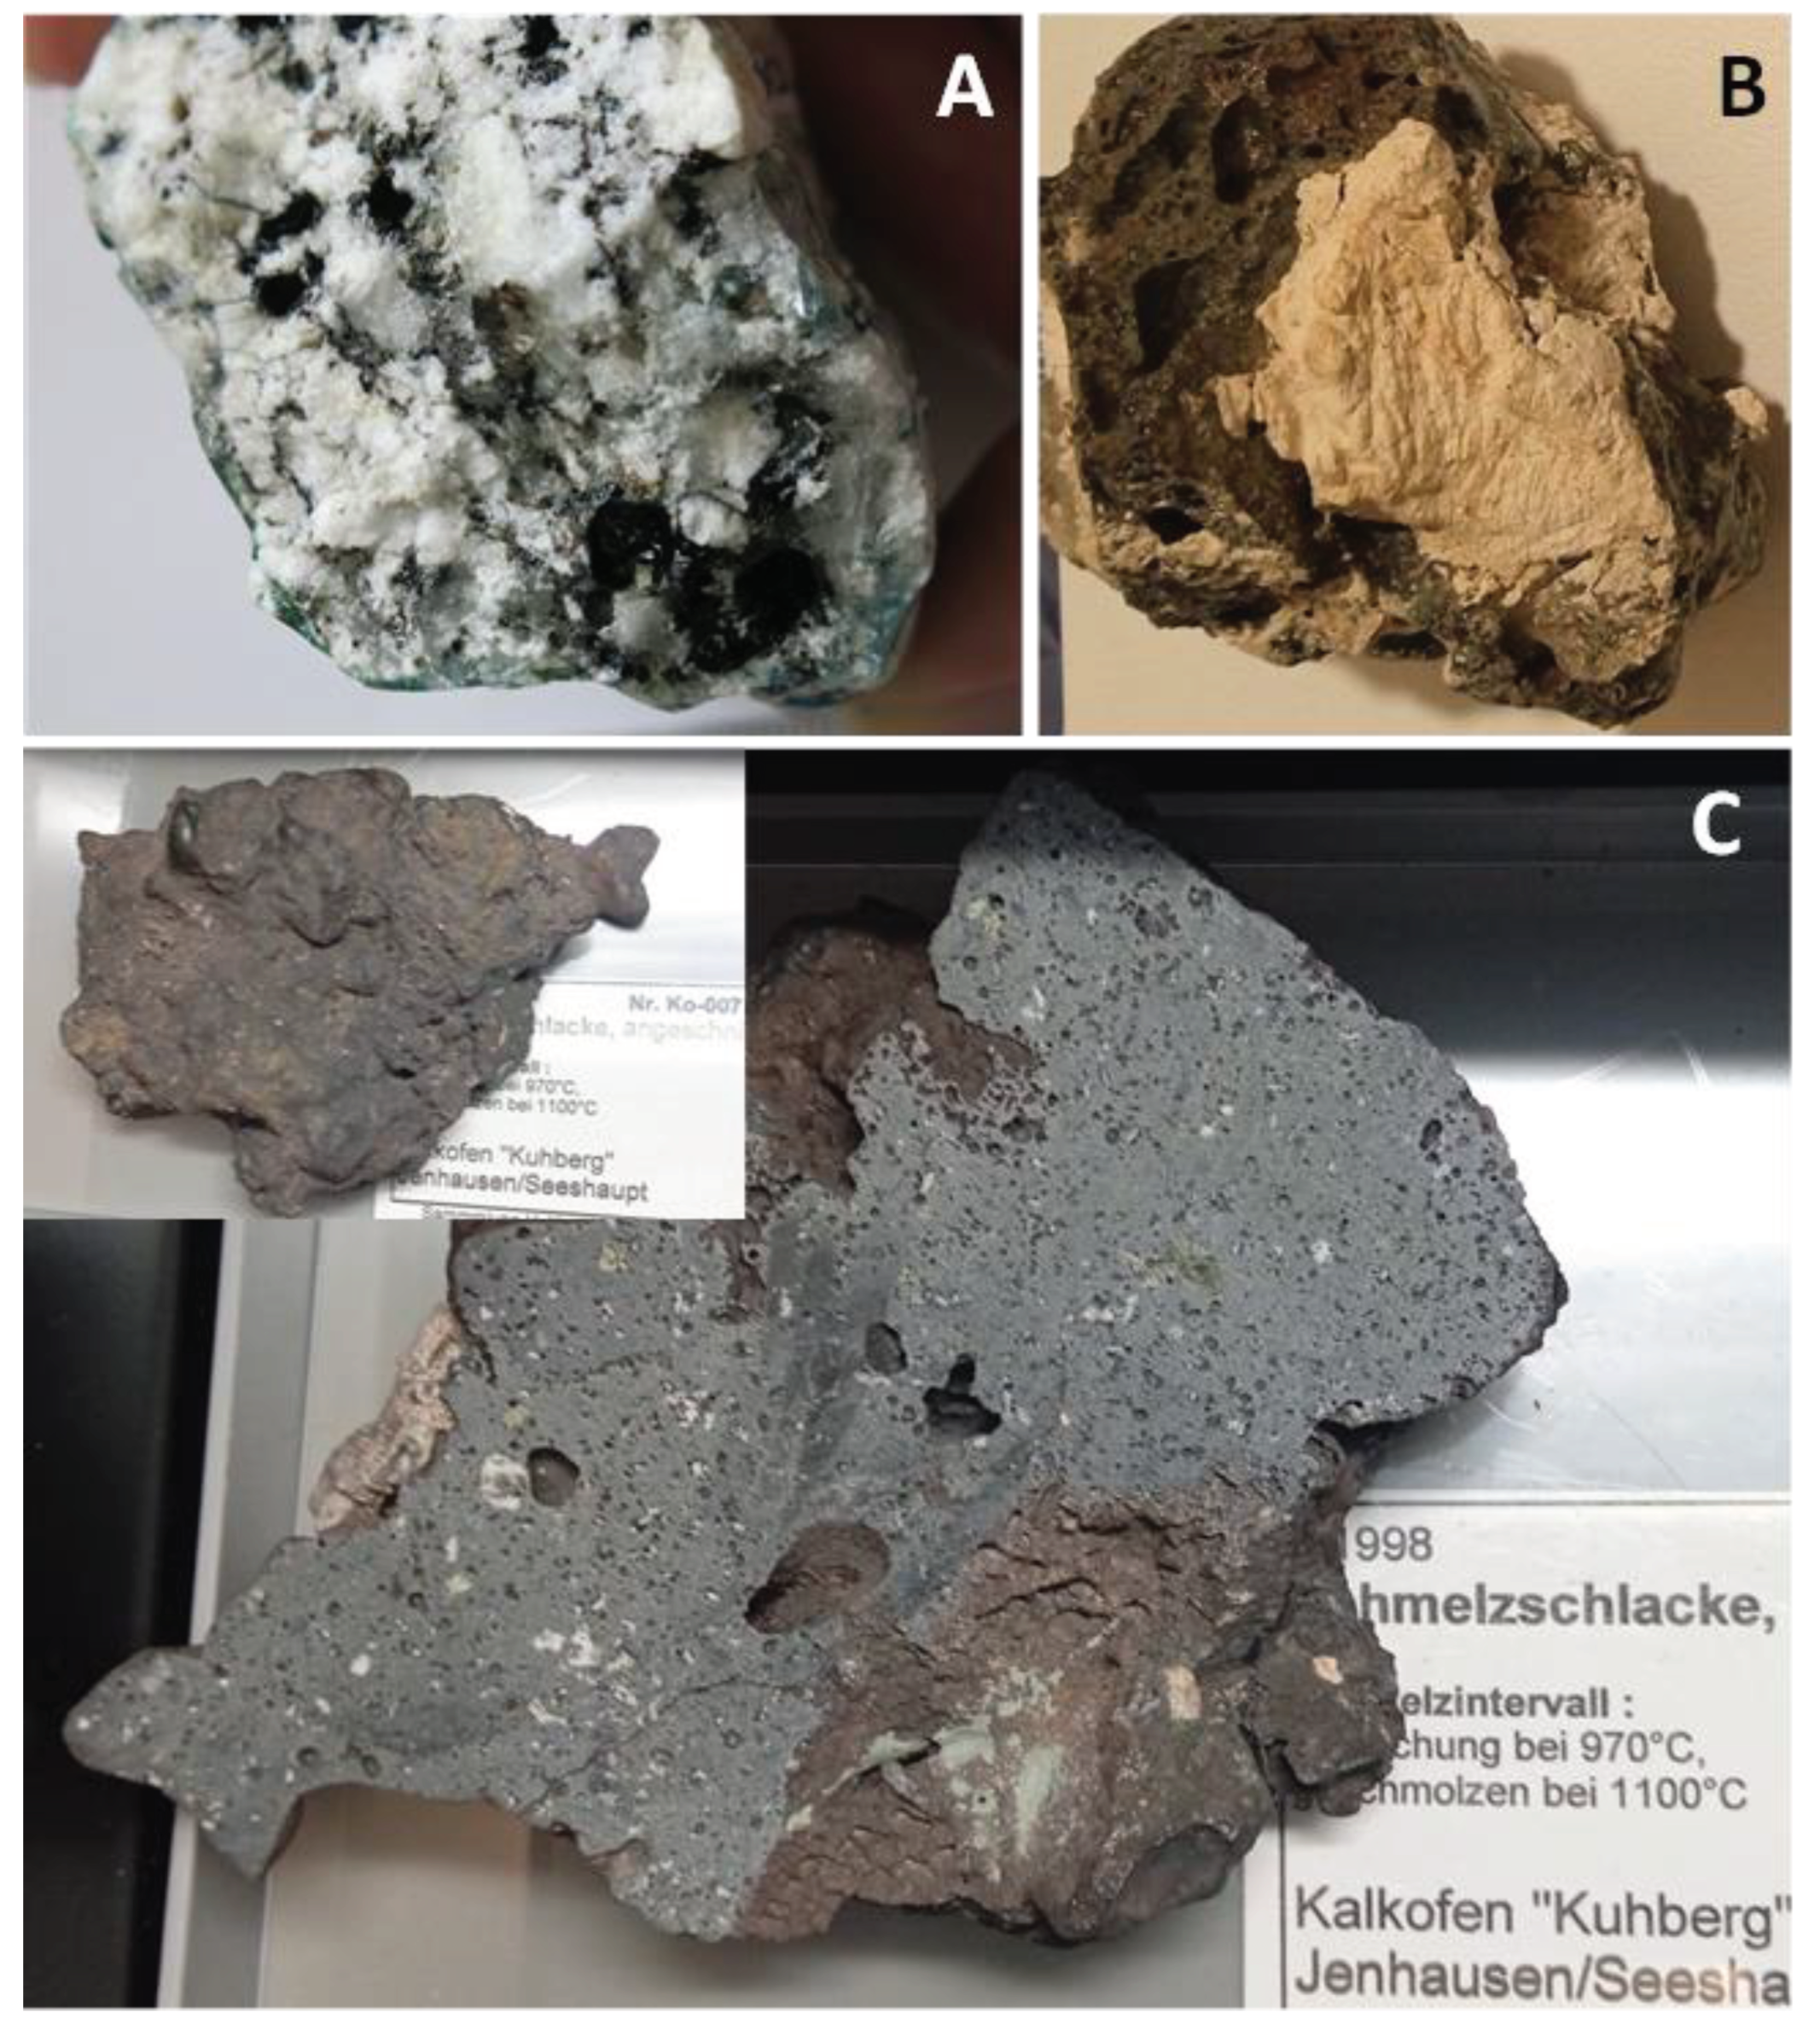
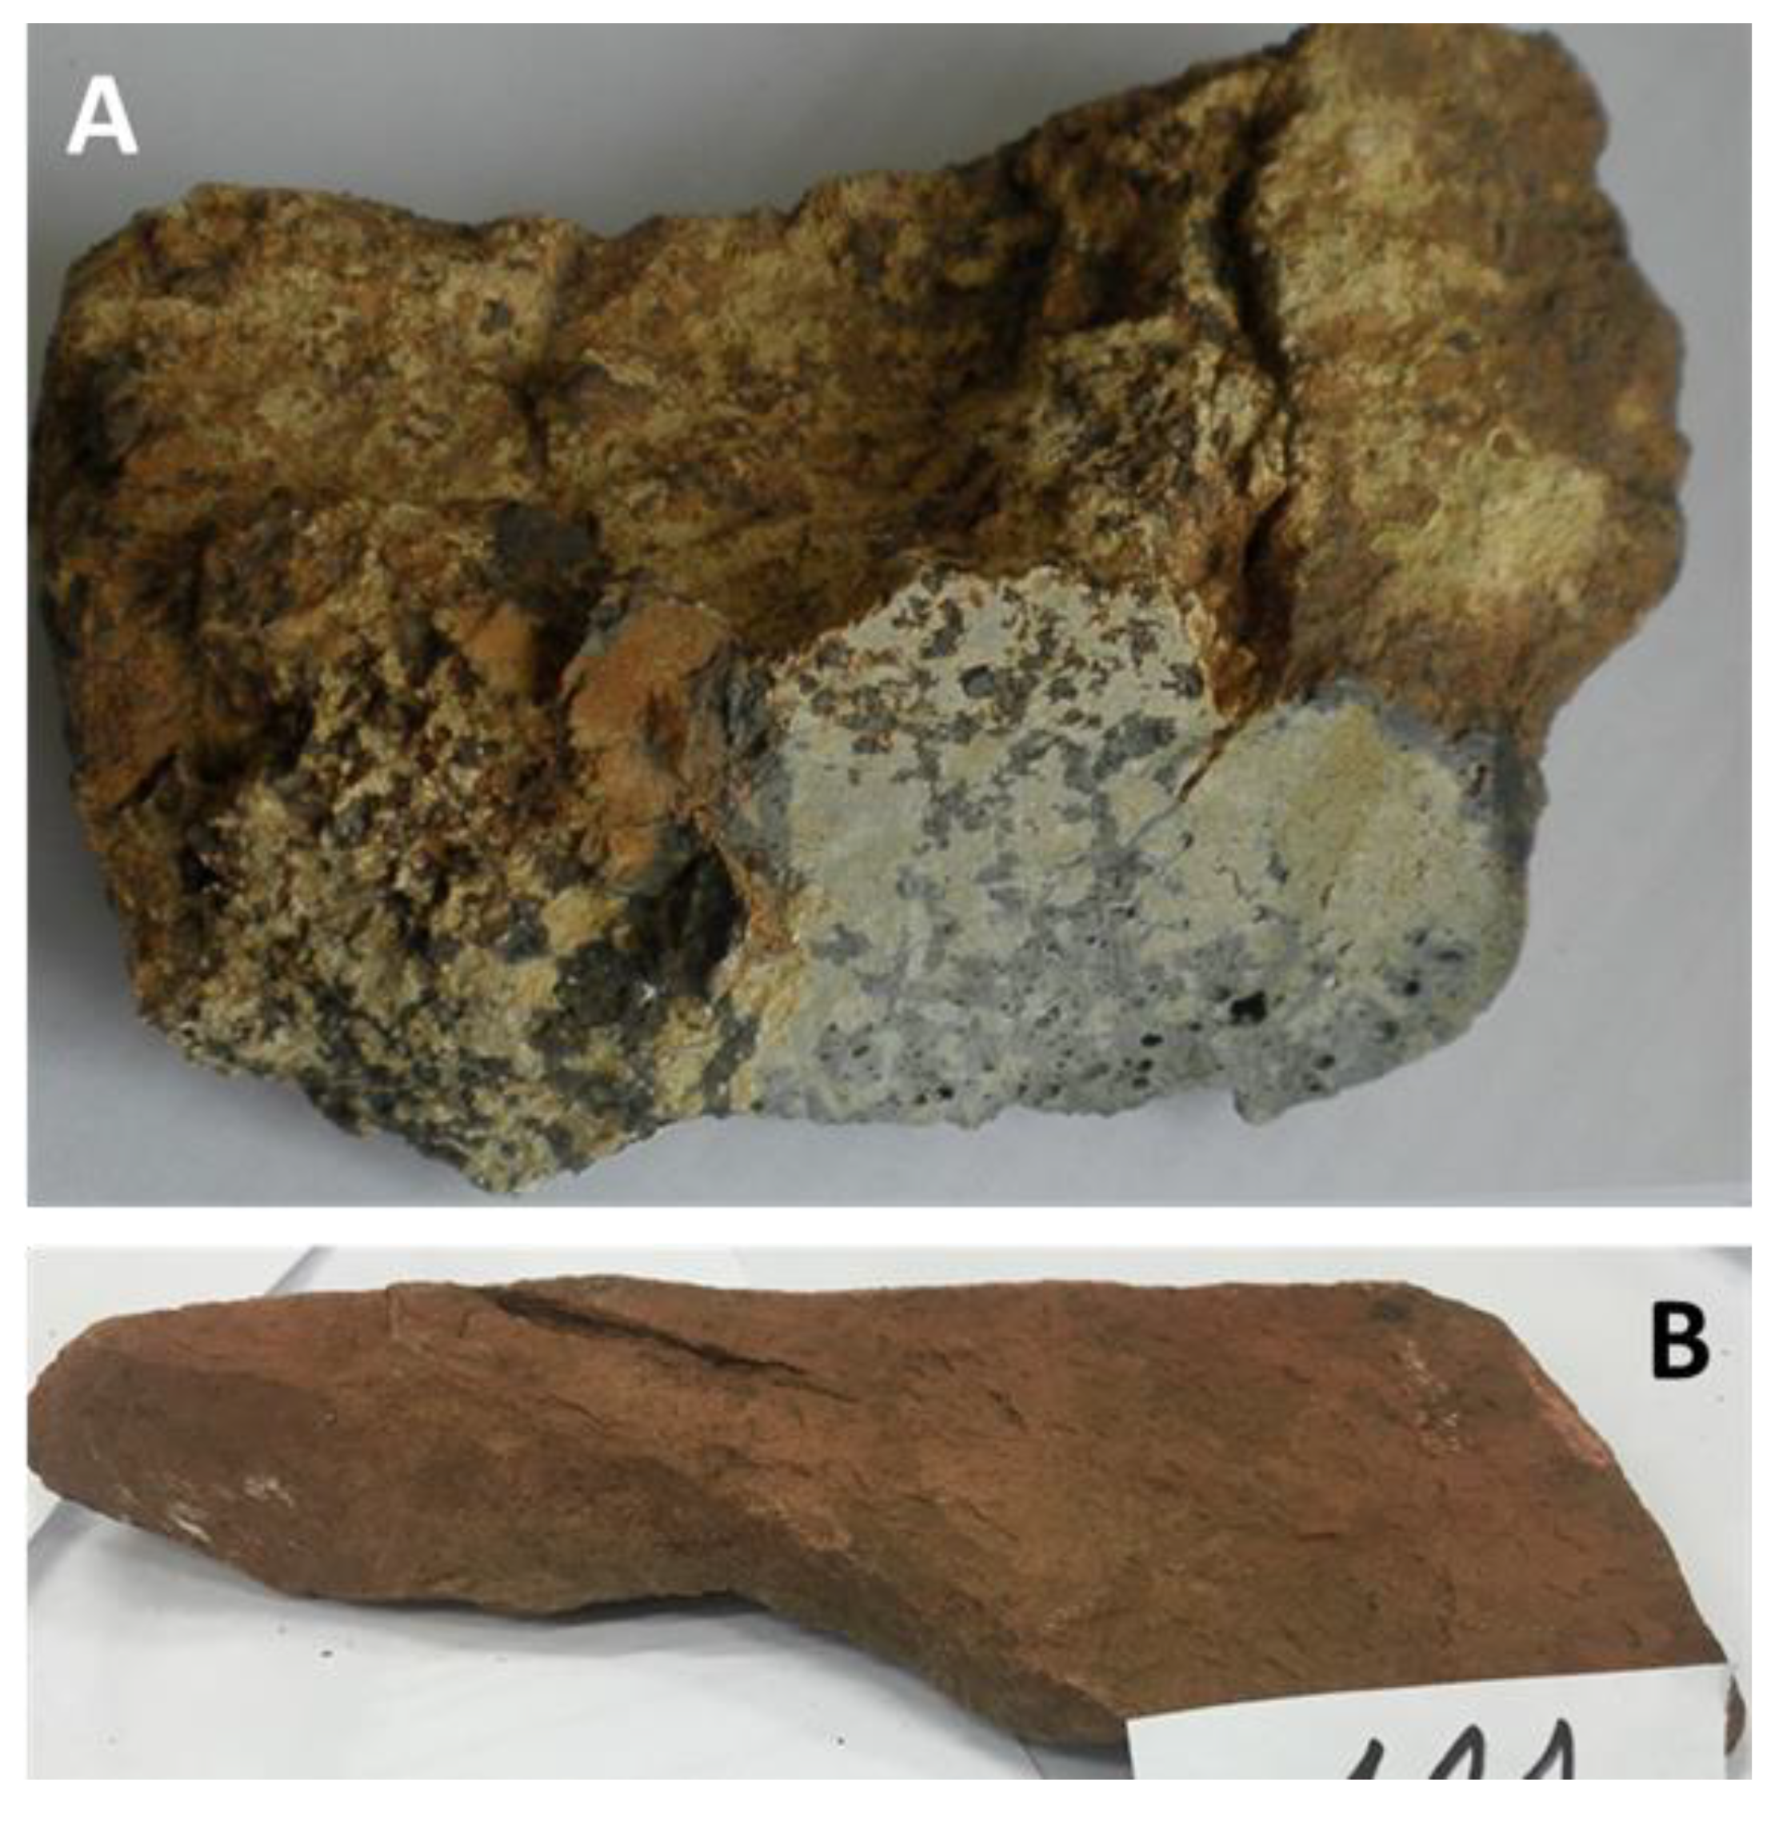
2.1. Limekilns
2.2. Emmerting: Crater No. 4
2.3. Emmerting: Crater No. 5
2.4. Depression at Grabenstätt-Kaltenbach (the Kaltenbach Structure)
2.5. Sampling at Emmerting and Kaltenbach
3. Analytical Methods
3.1. Field Gamma-Ray Spectrometry
3.2. Magnetic Susceptibility (MS)
3.3. X-ray Fluorescence (XRF)
3.4. Scanning Electron Microscopy (SEM), Electron Microprobe (EMP)
3.5. Computer Tomography (CT)
3.6. Determination of Glass Melting Temperature
4. Results and Discussion
4.1. Field Gamma-Ray Spectrometry
4.2. Petrography and In Situ Transformations - Limekilns
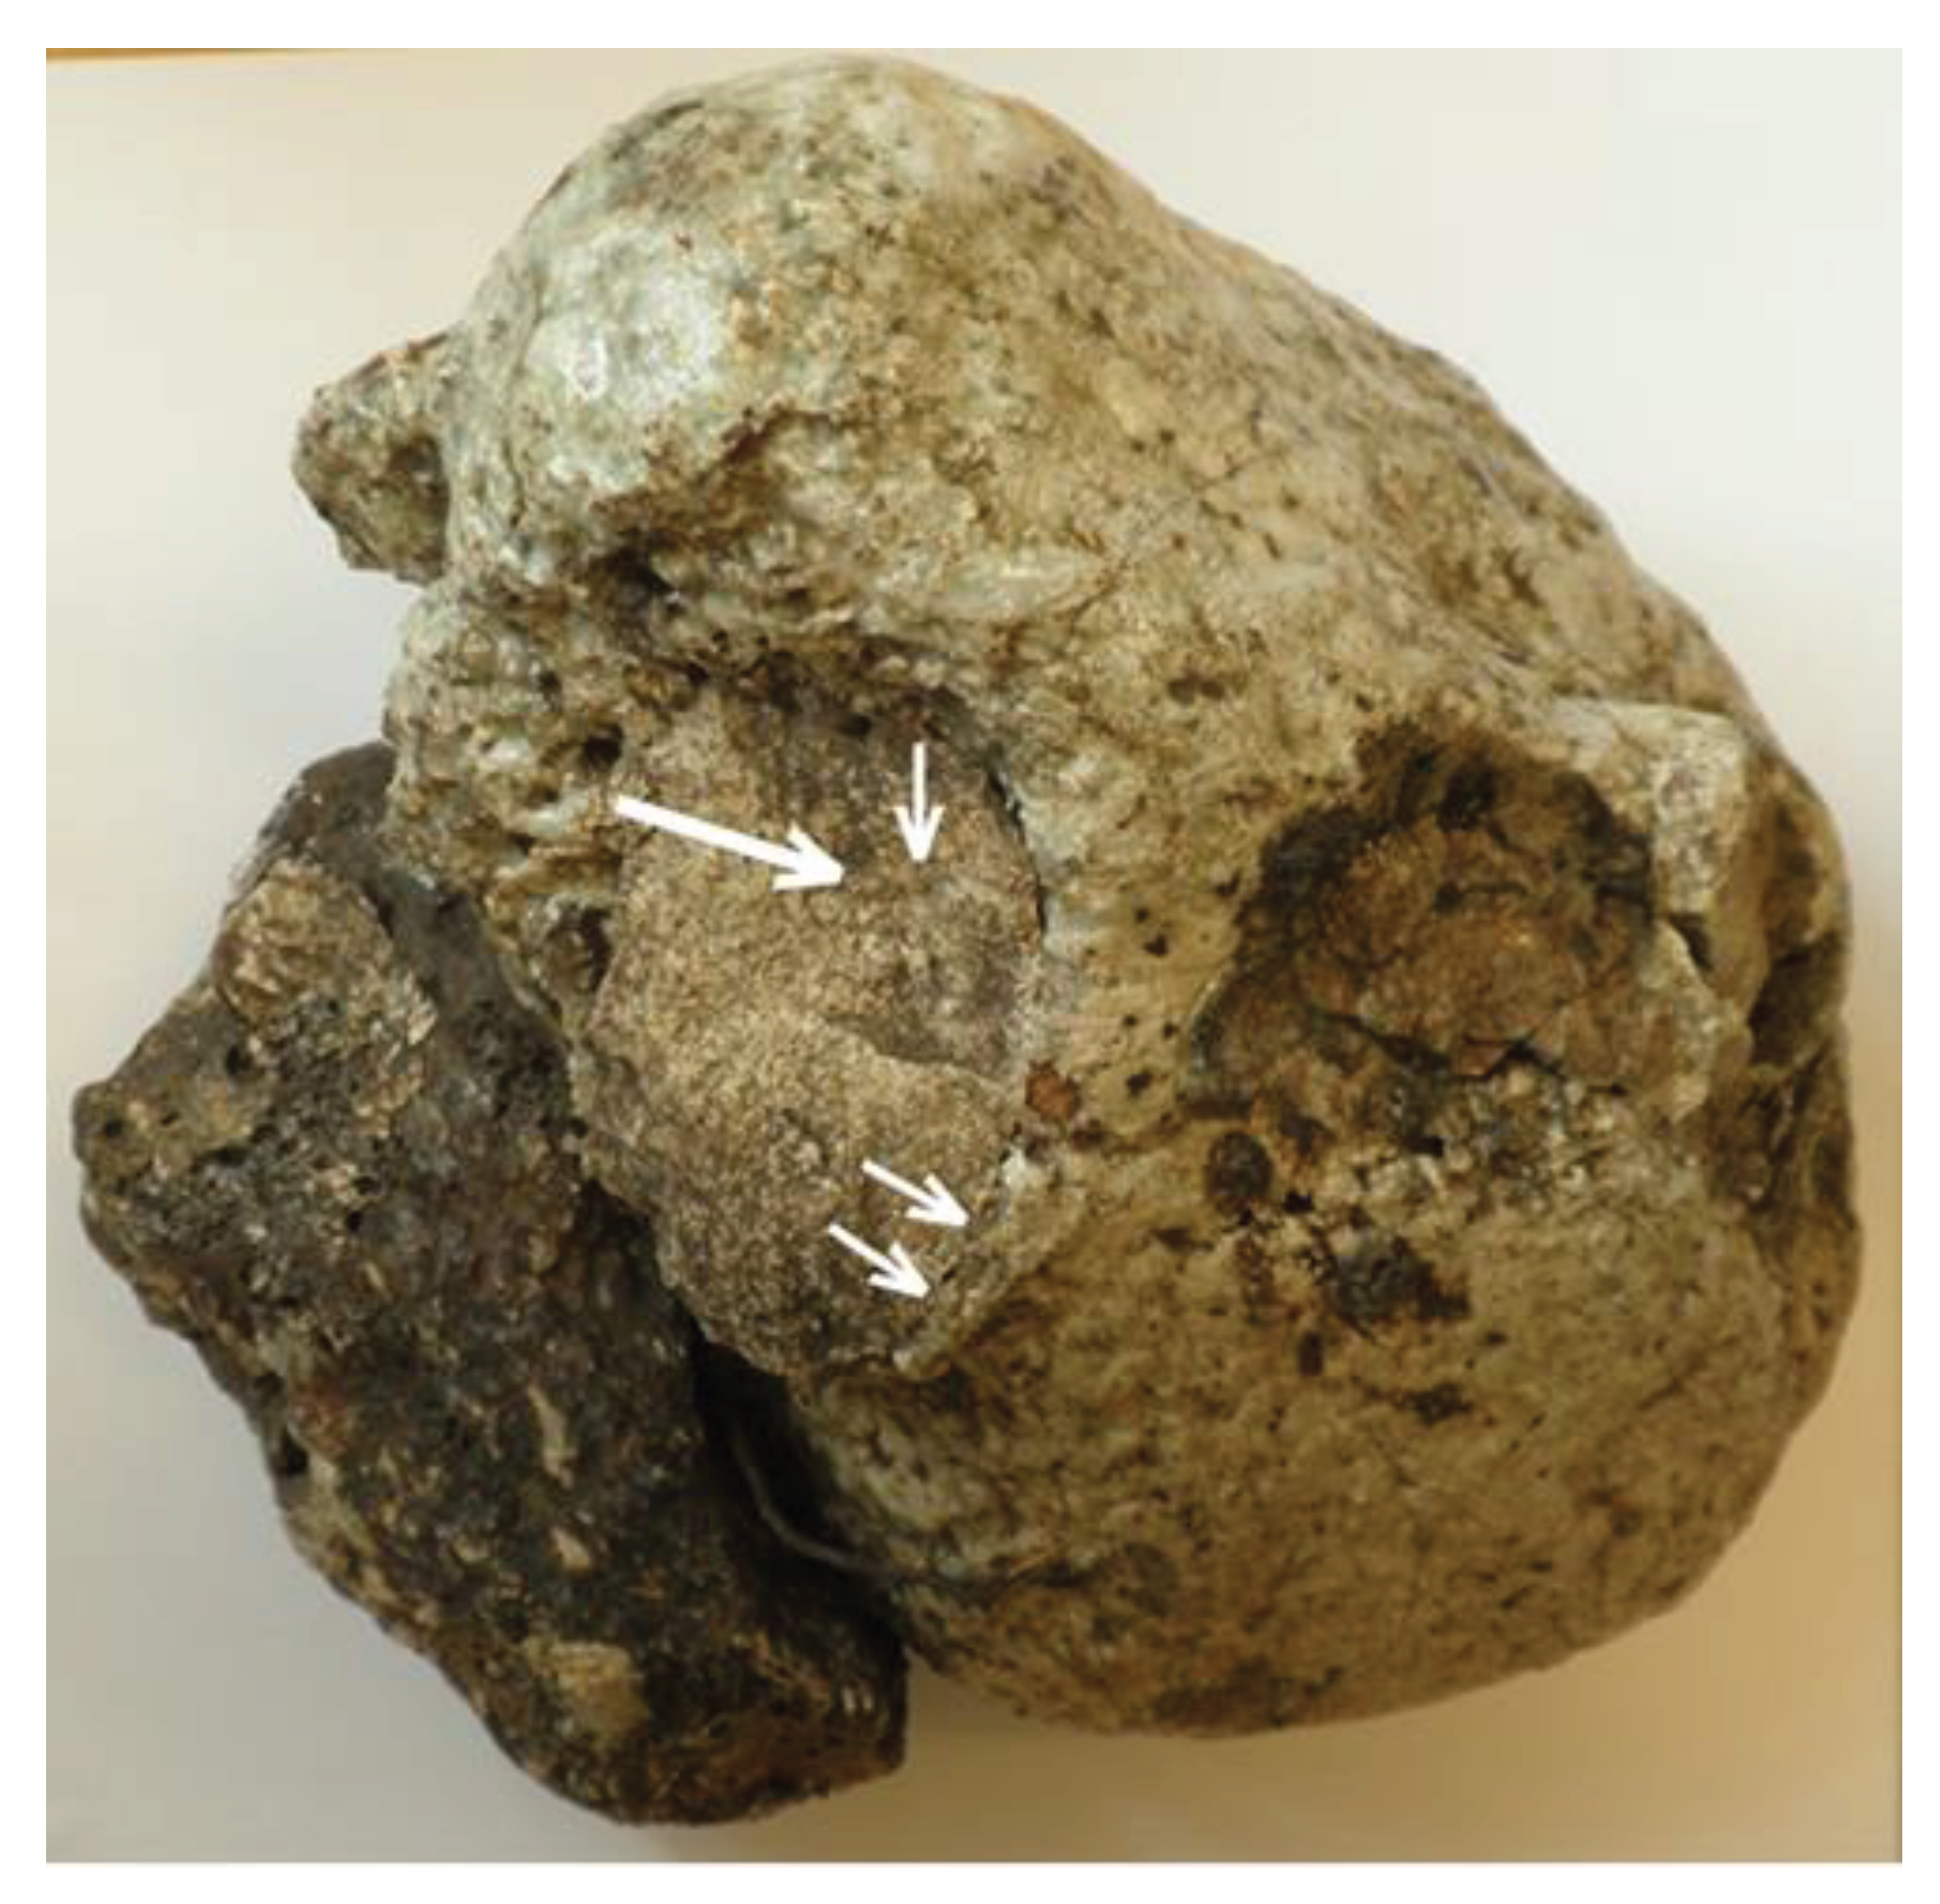
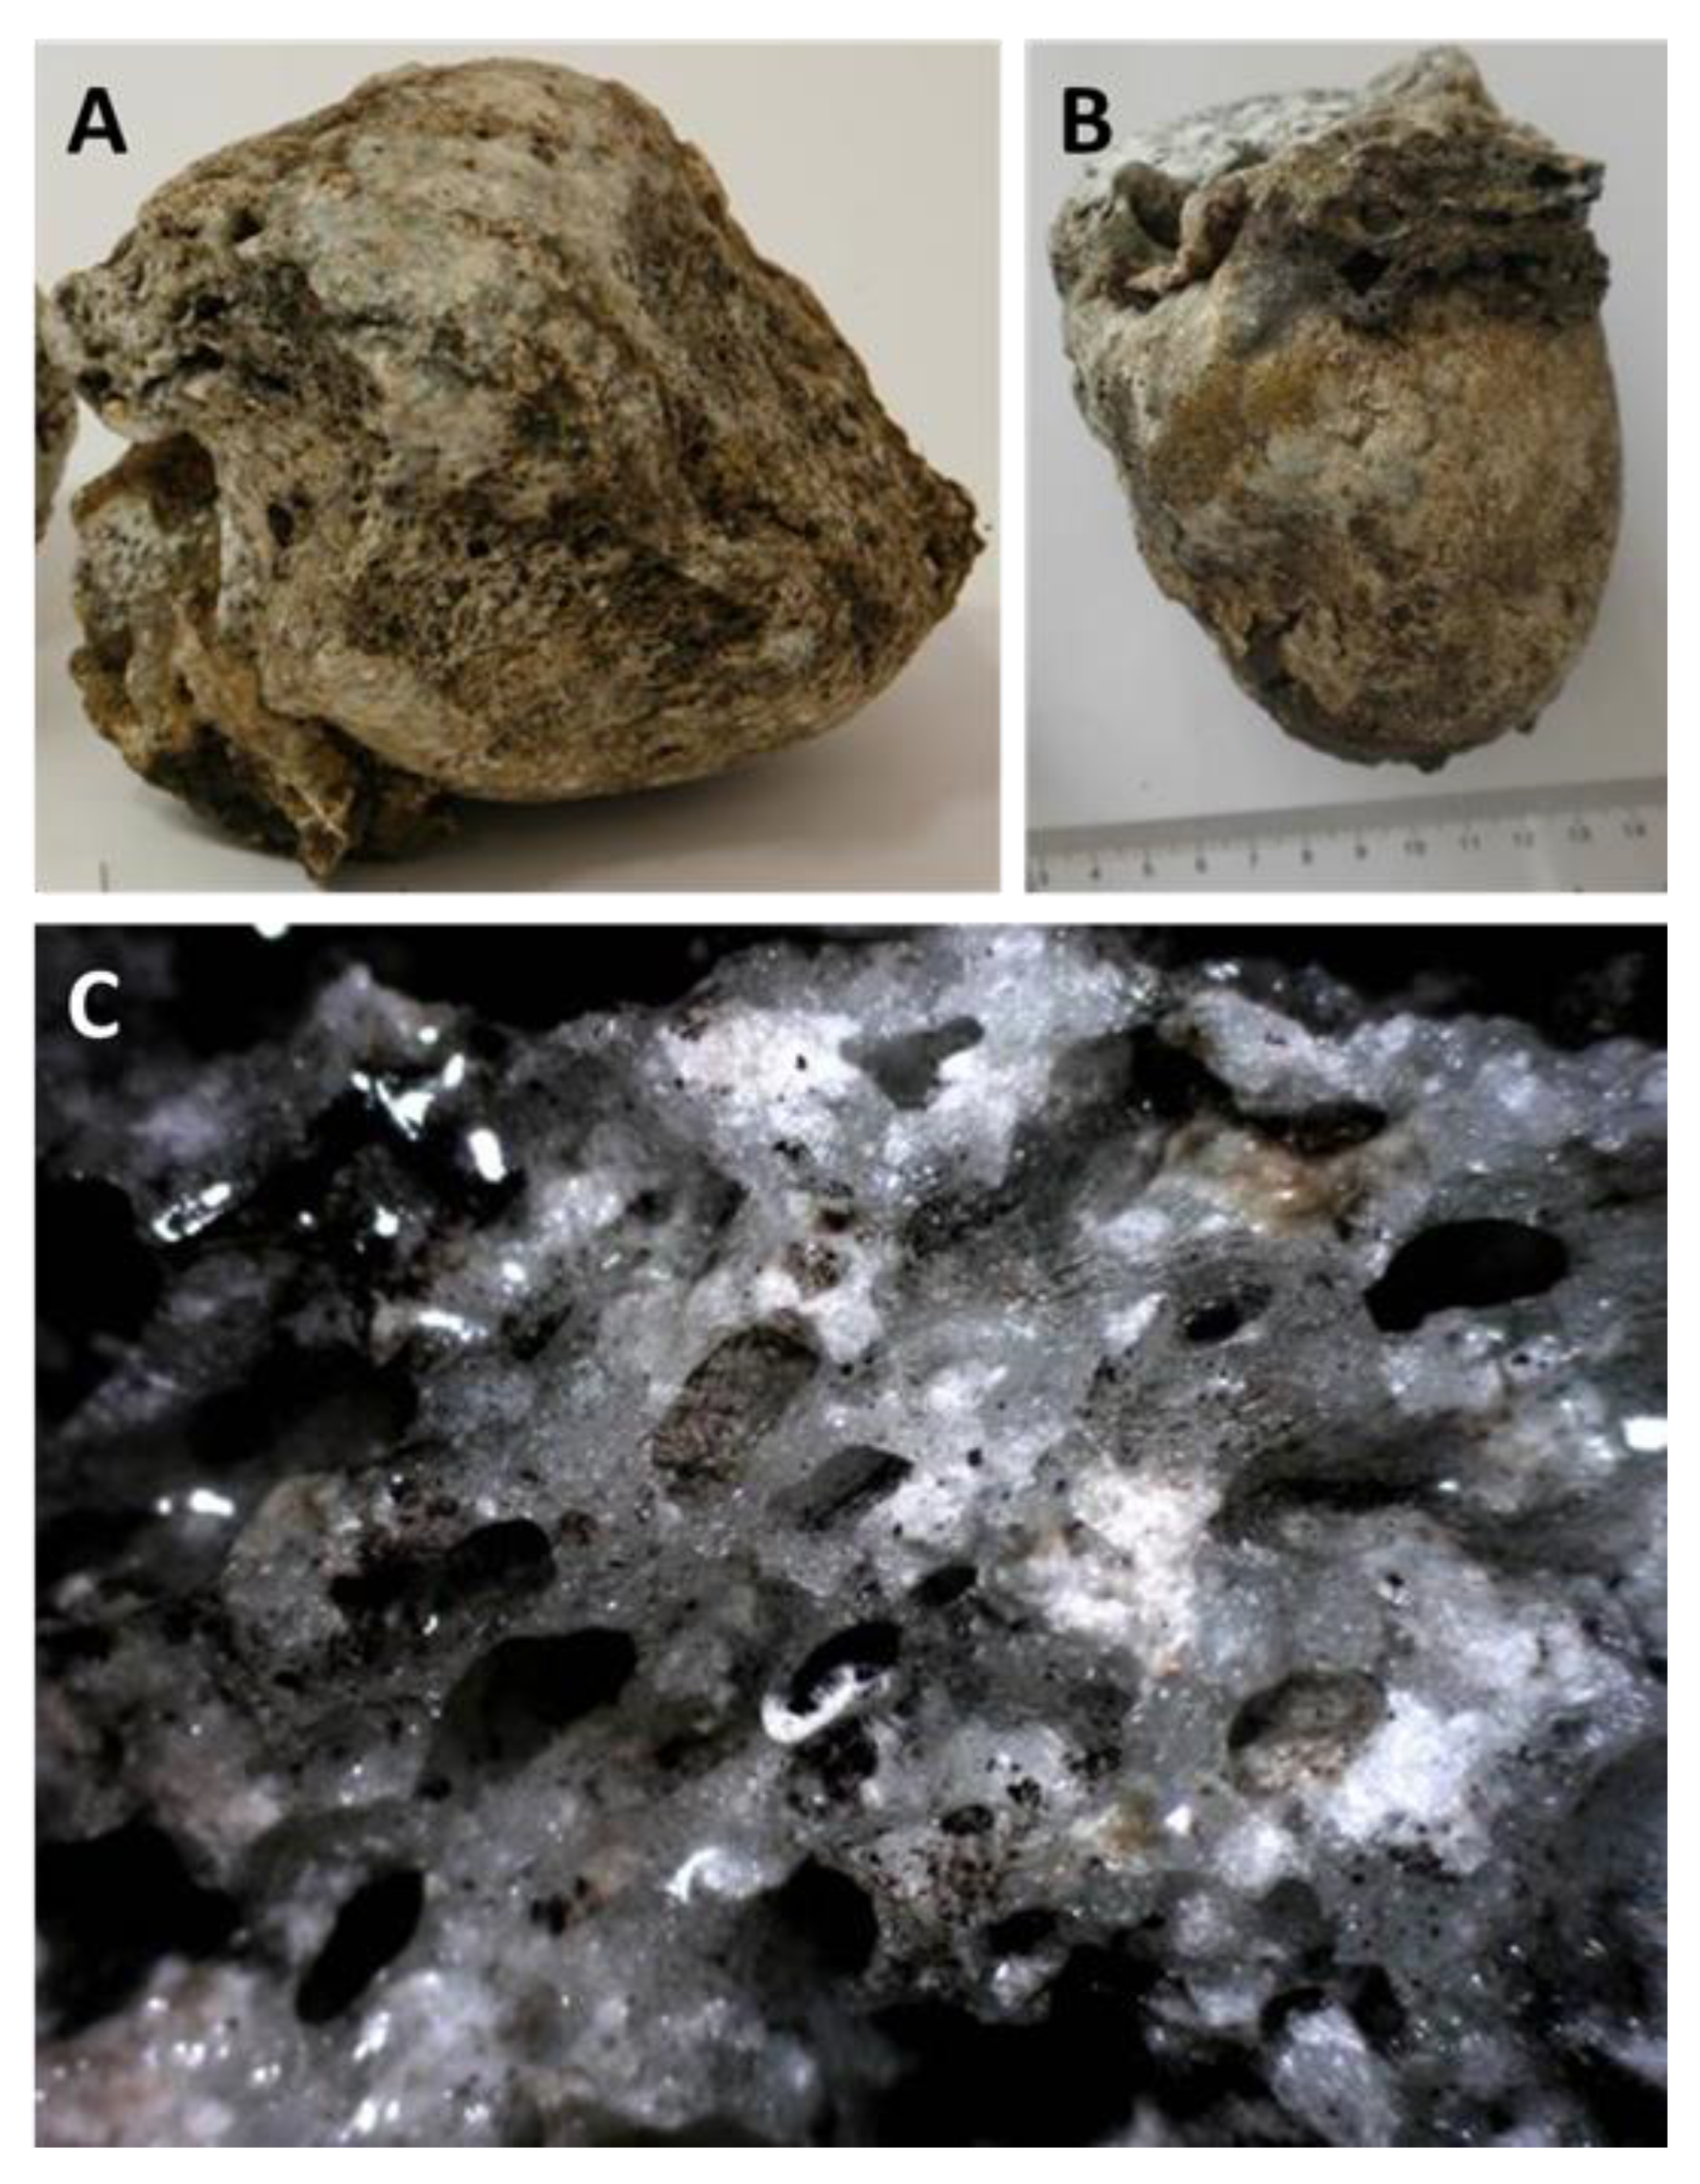
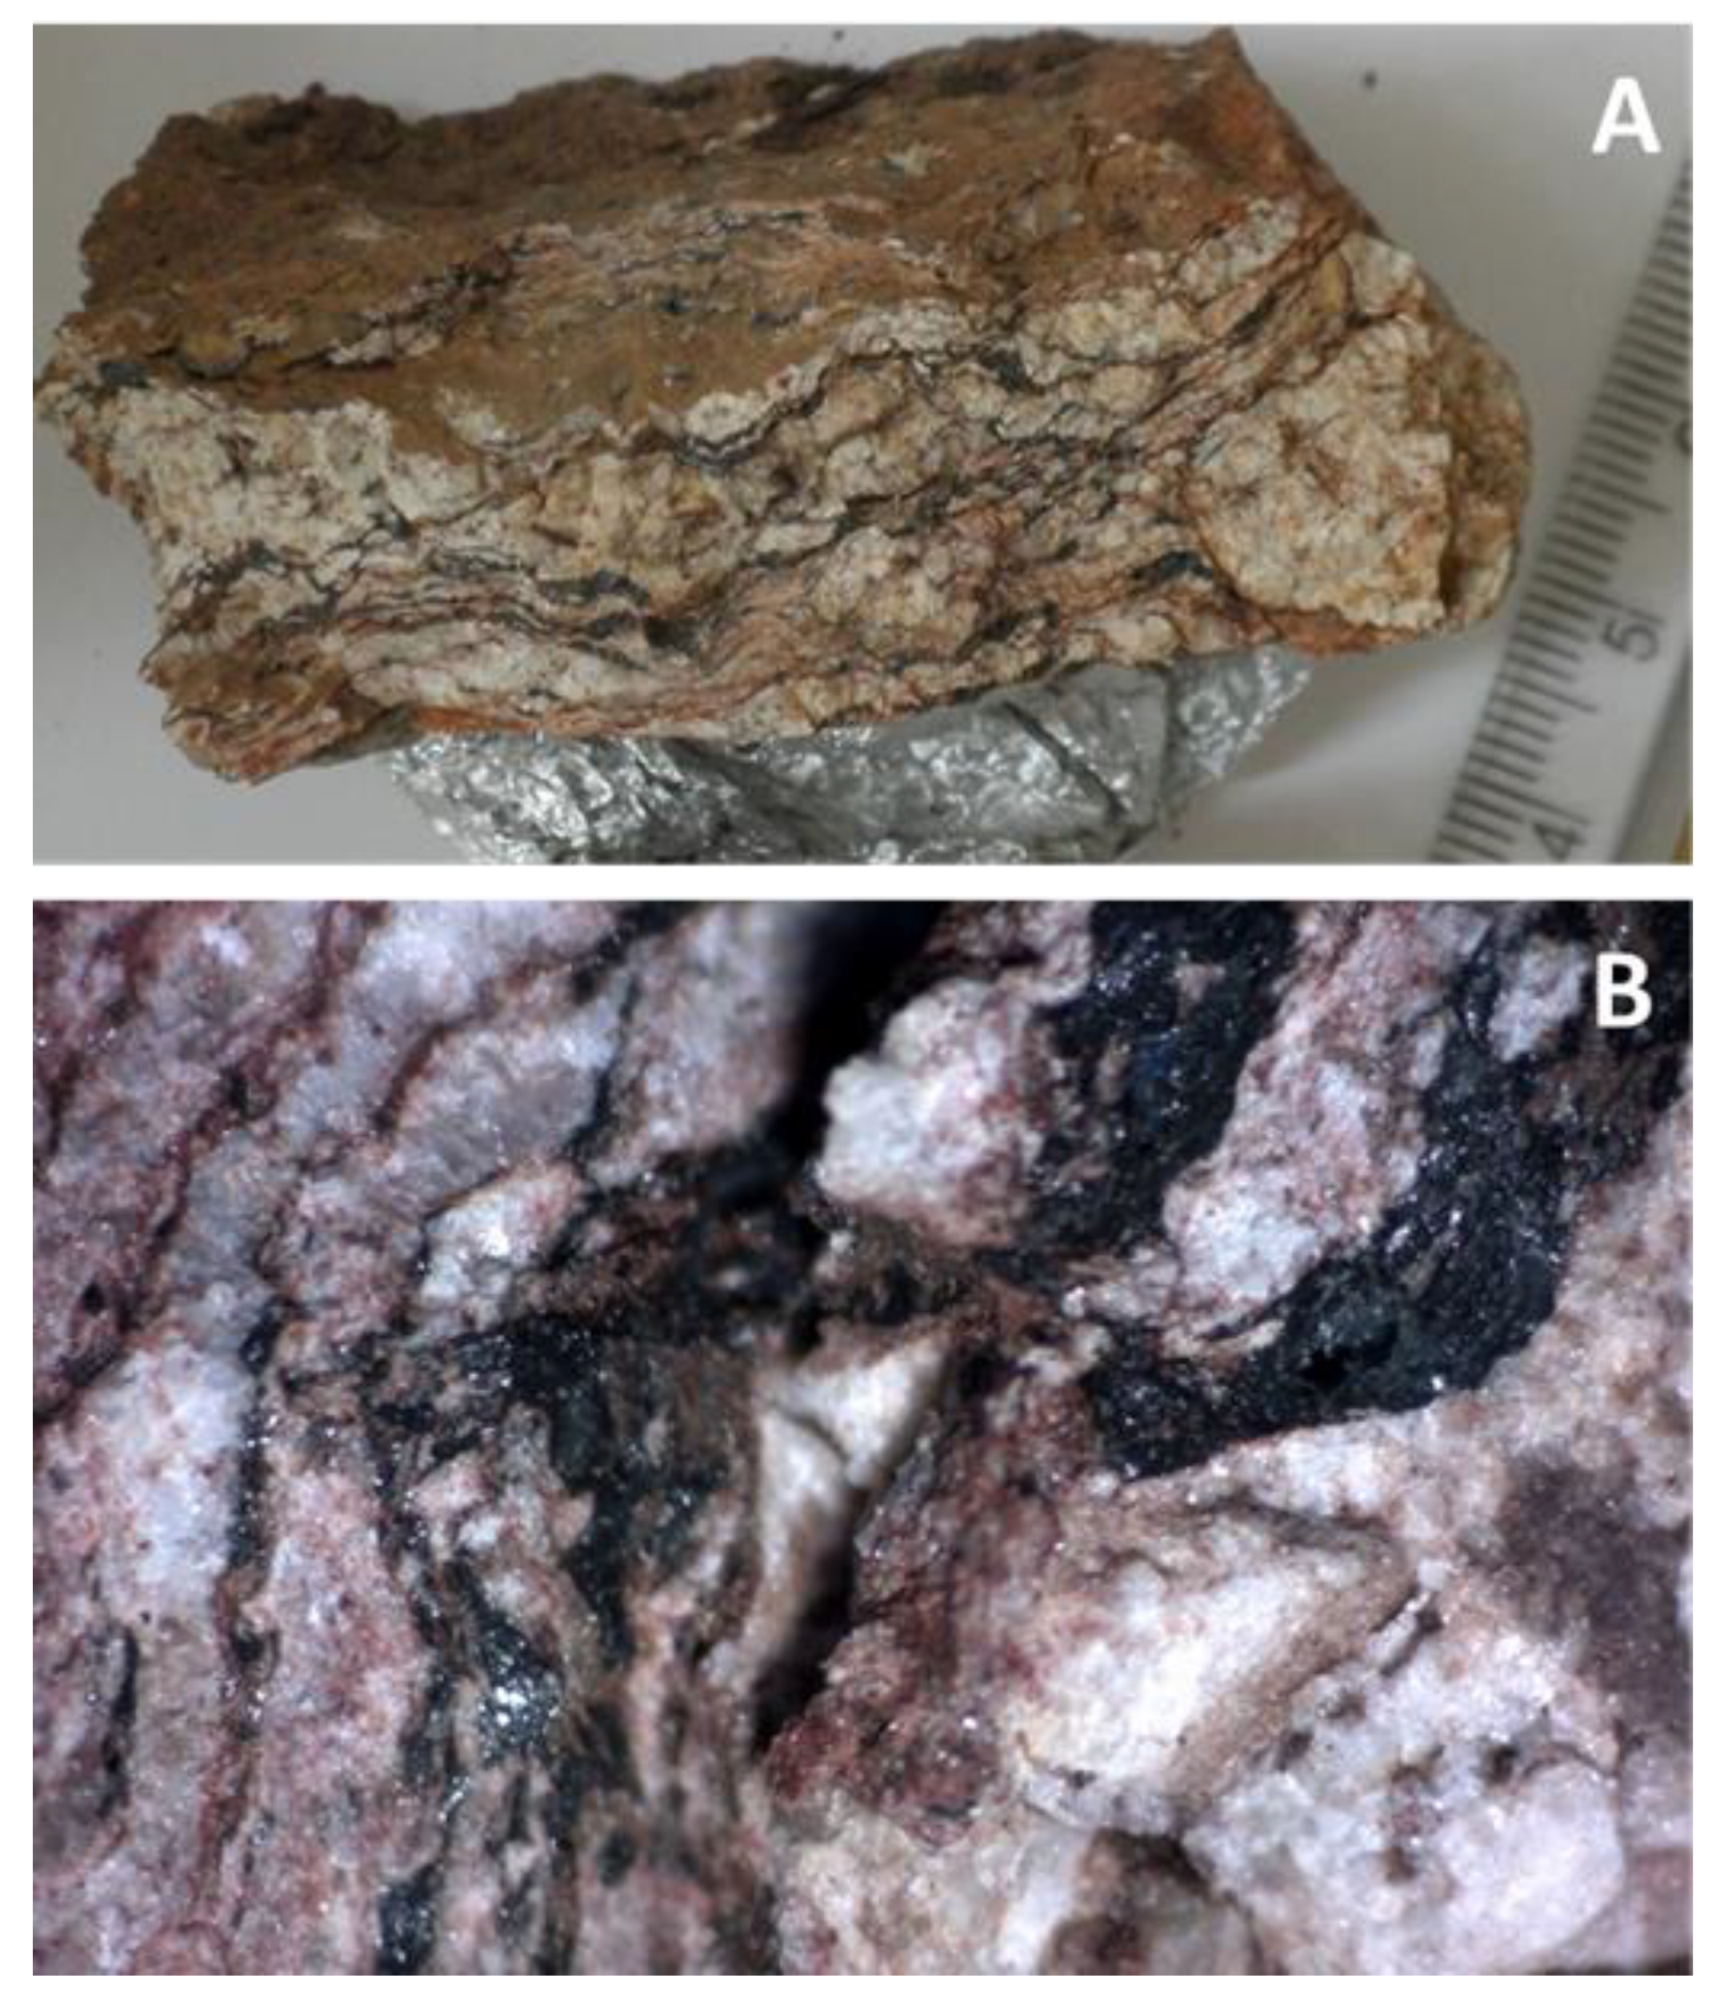
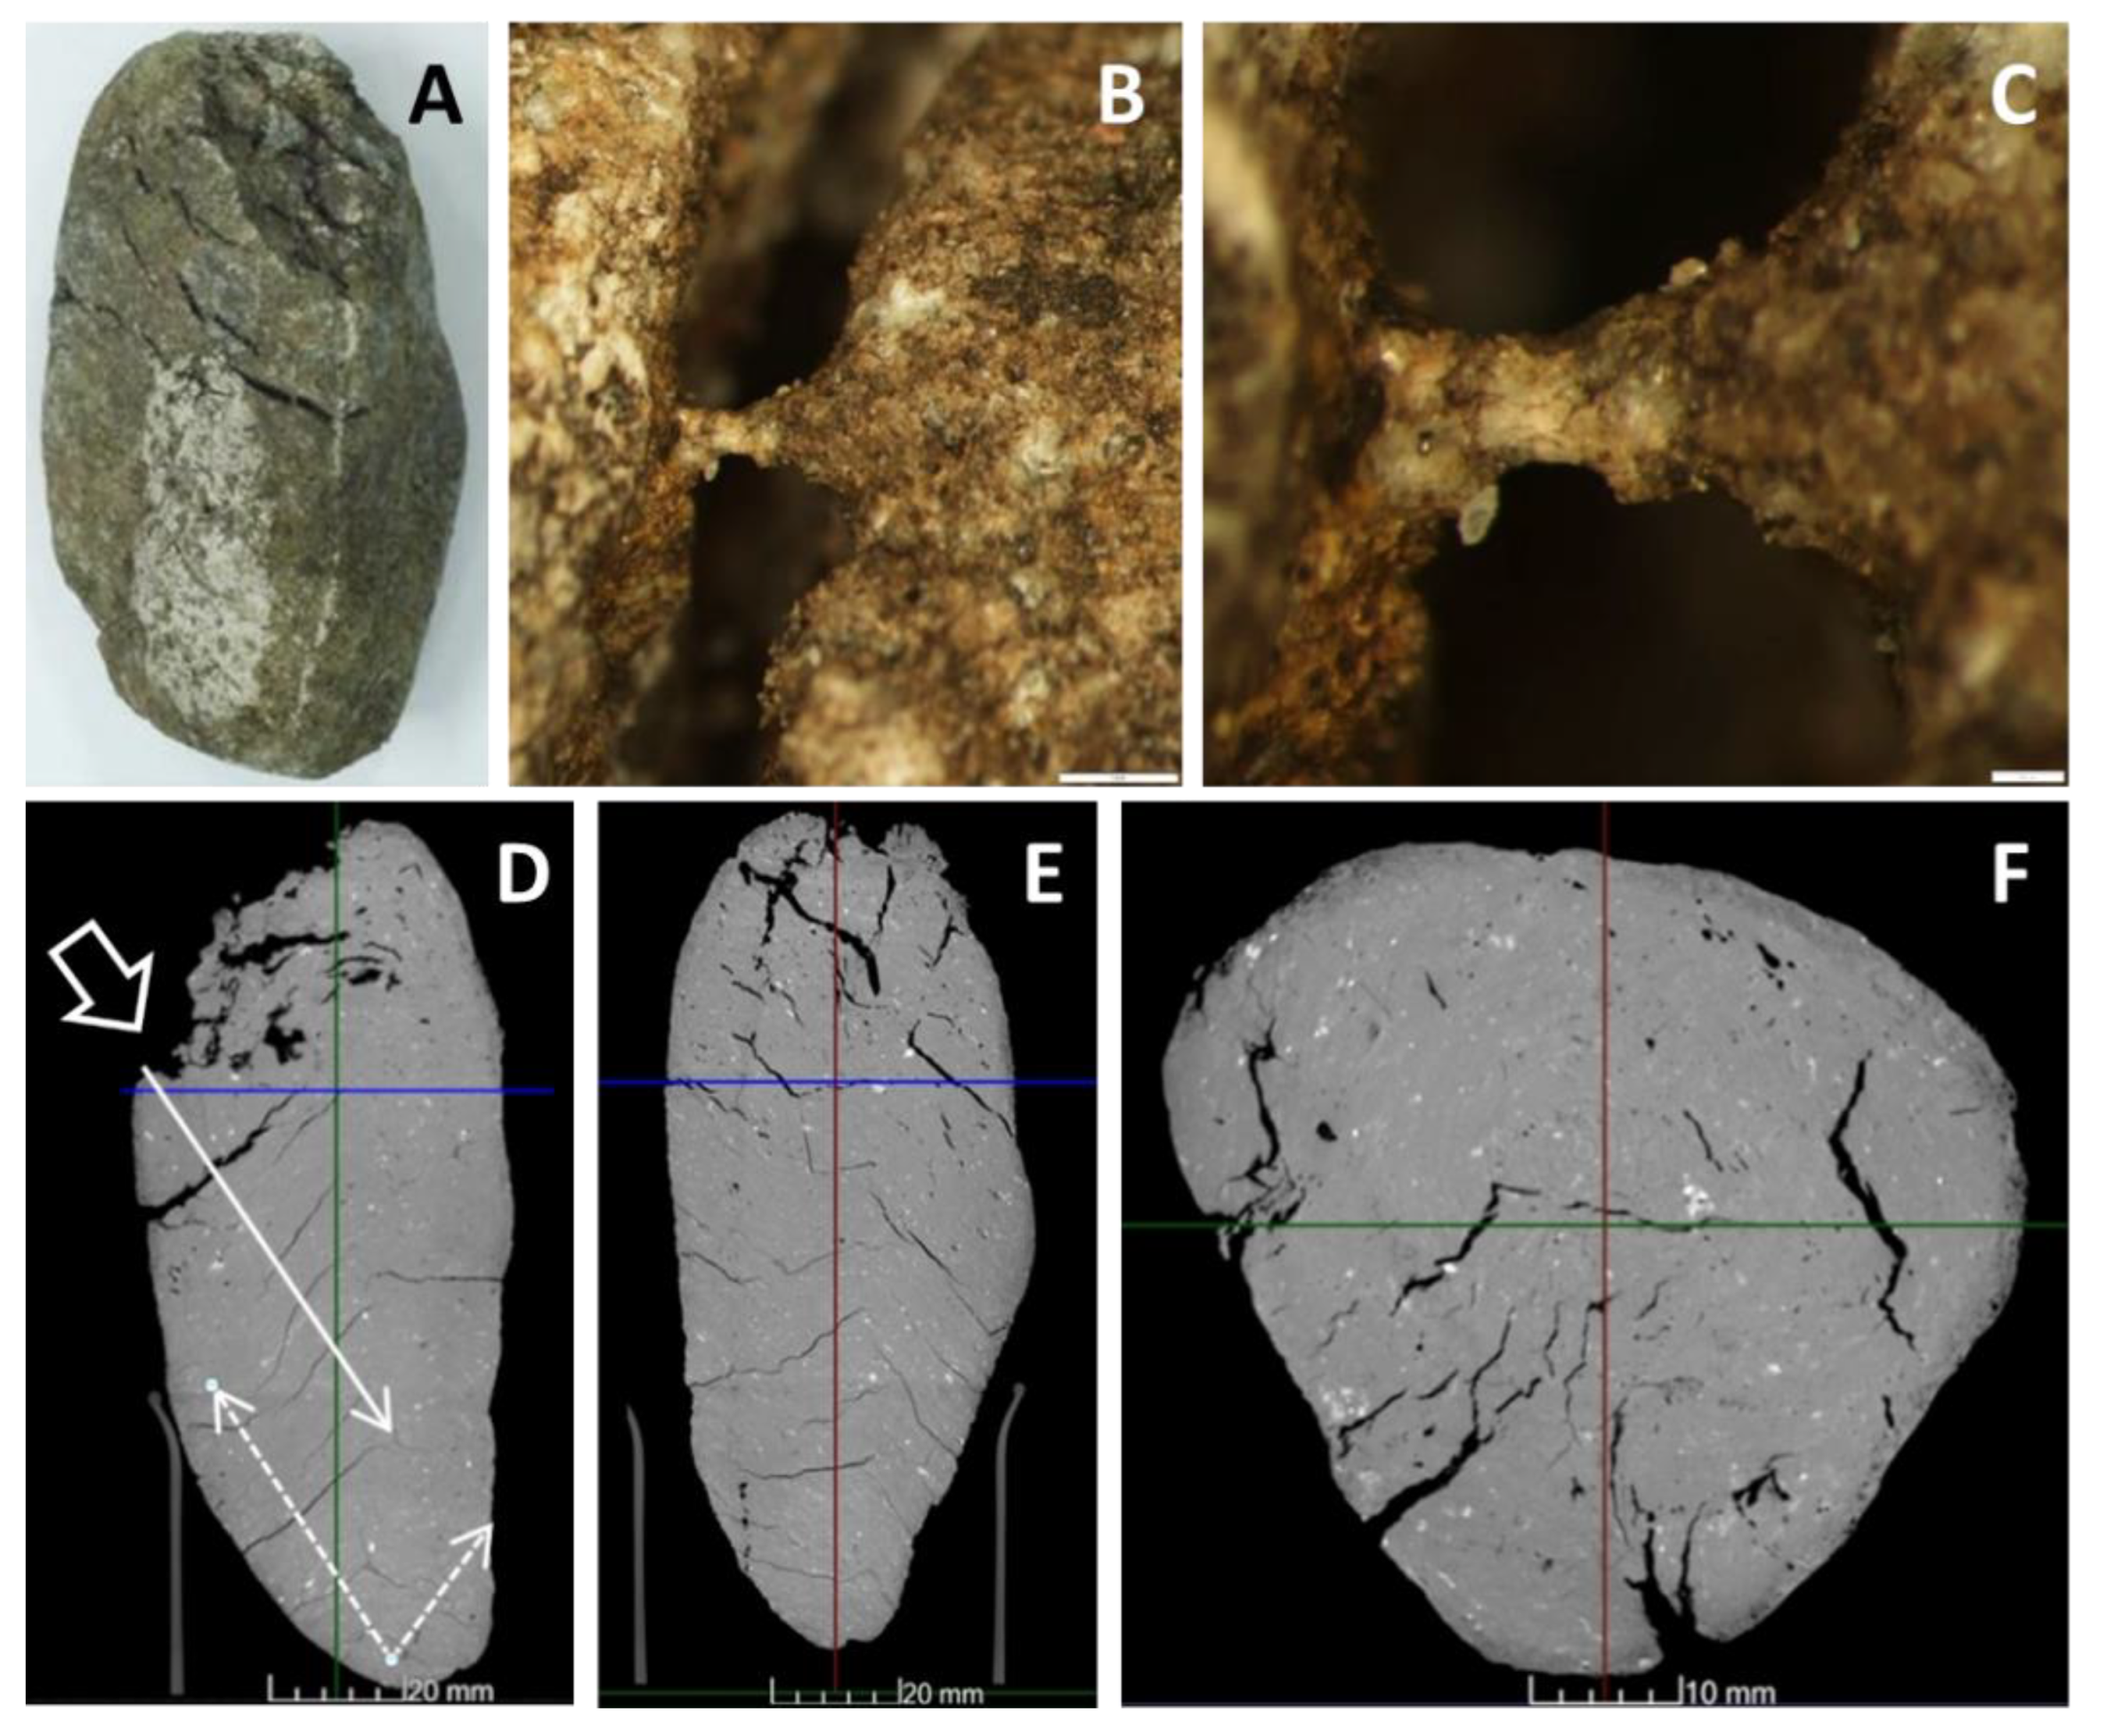
4.2.1. Structural and Textural Characteristics
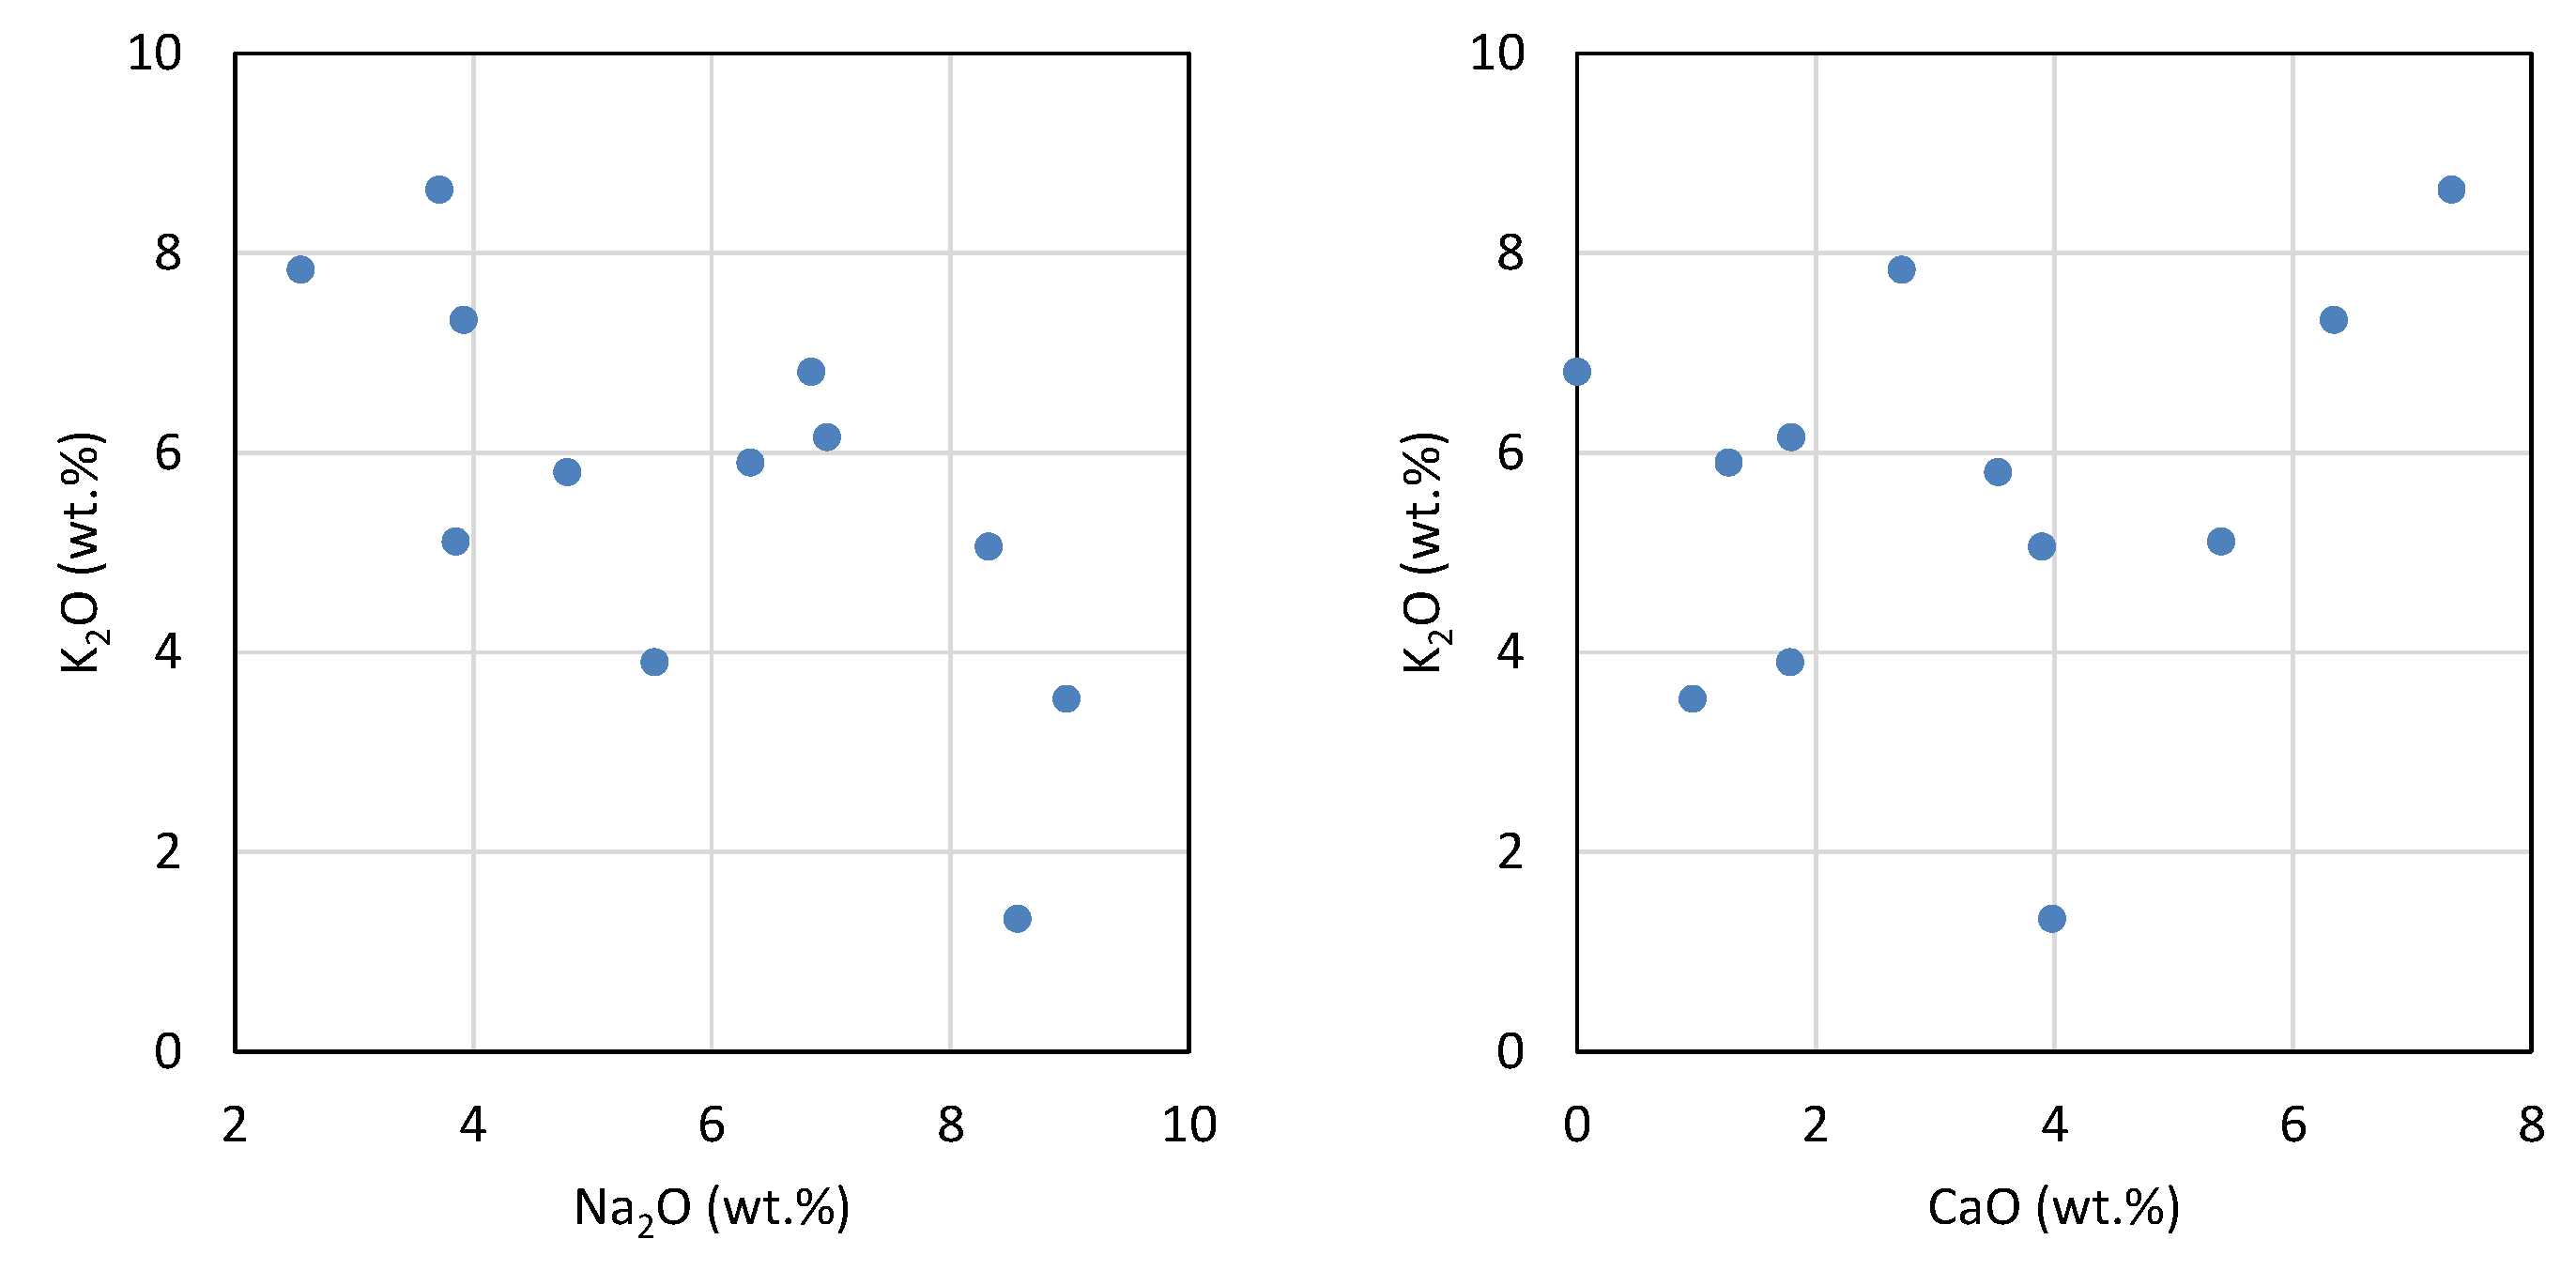
4.2.2. X-Ray Fluorescence (XRF), Electron Microprobe (EMP)
4.2.3. Glass Melting Temperature
4.3. Petrography and In Situ Transformations – Emmerting and Kaltenbach
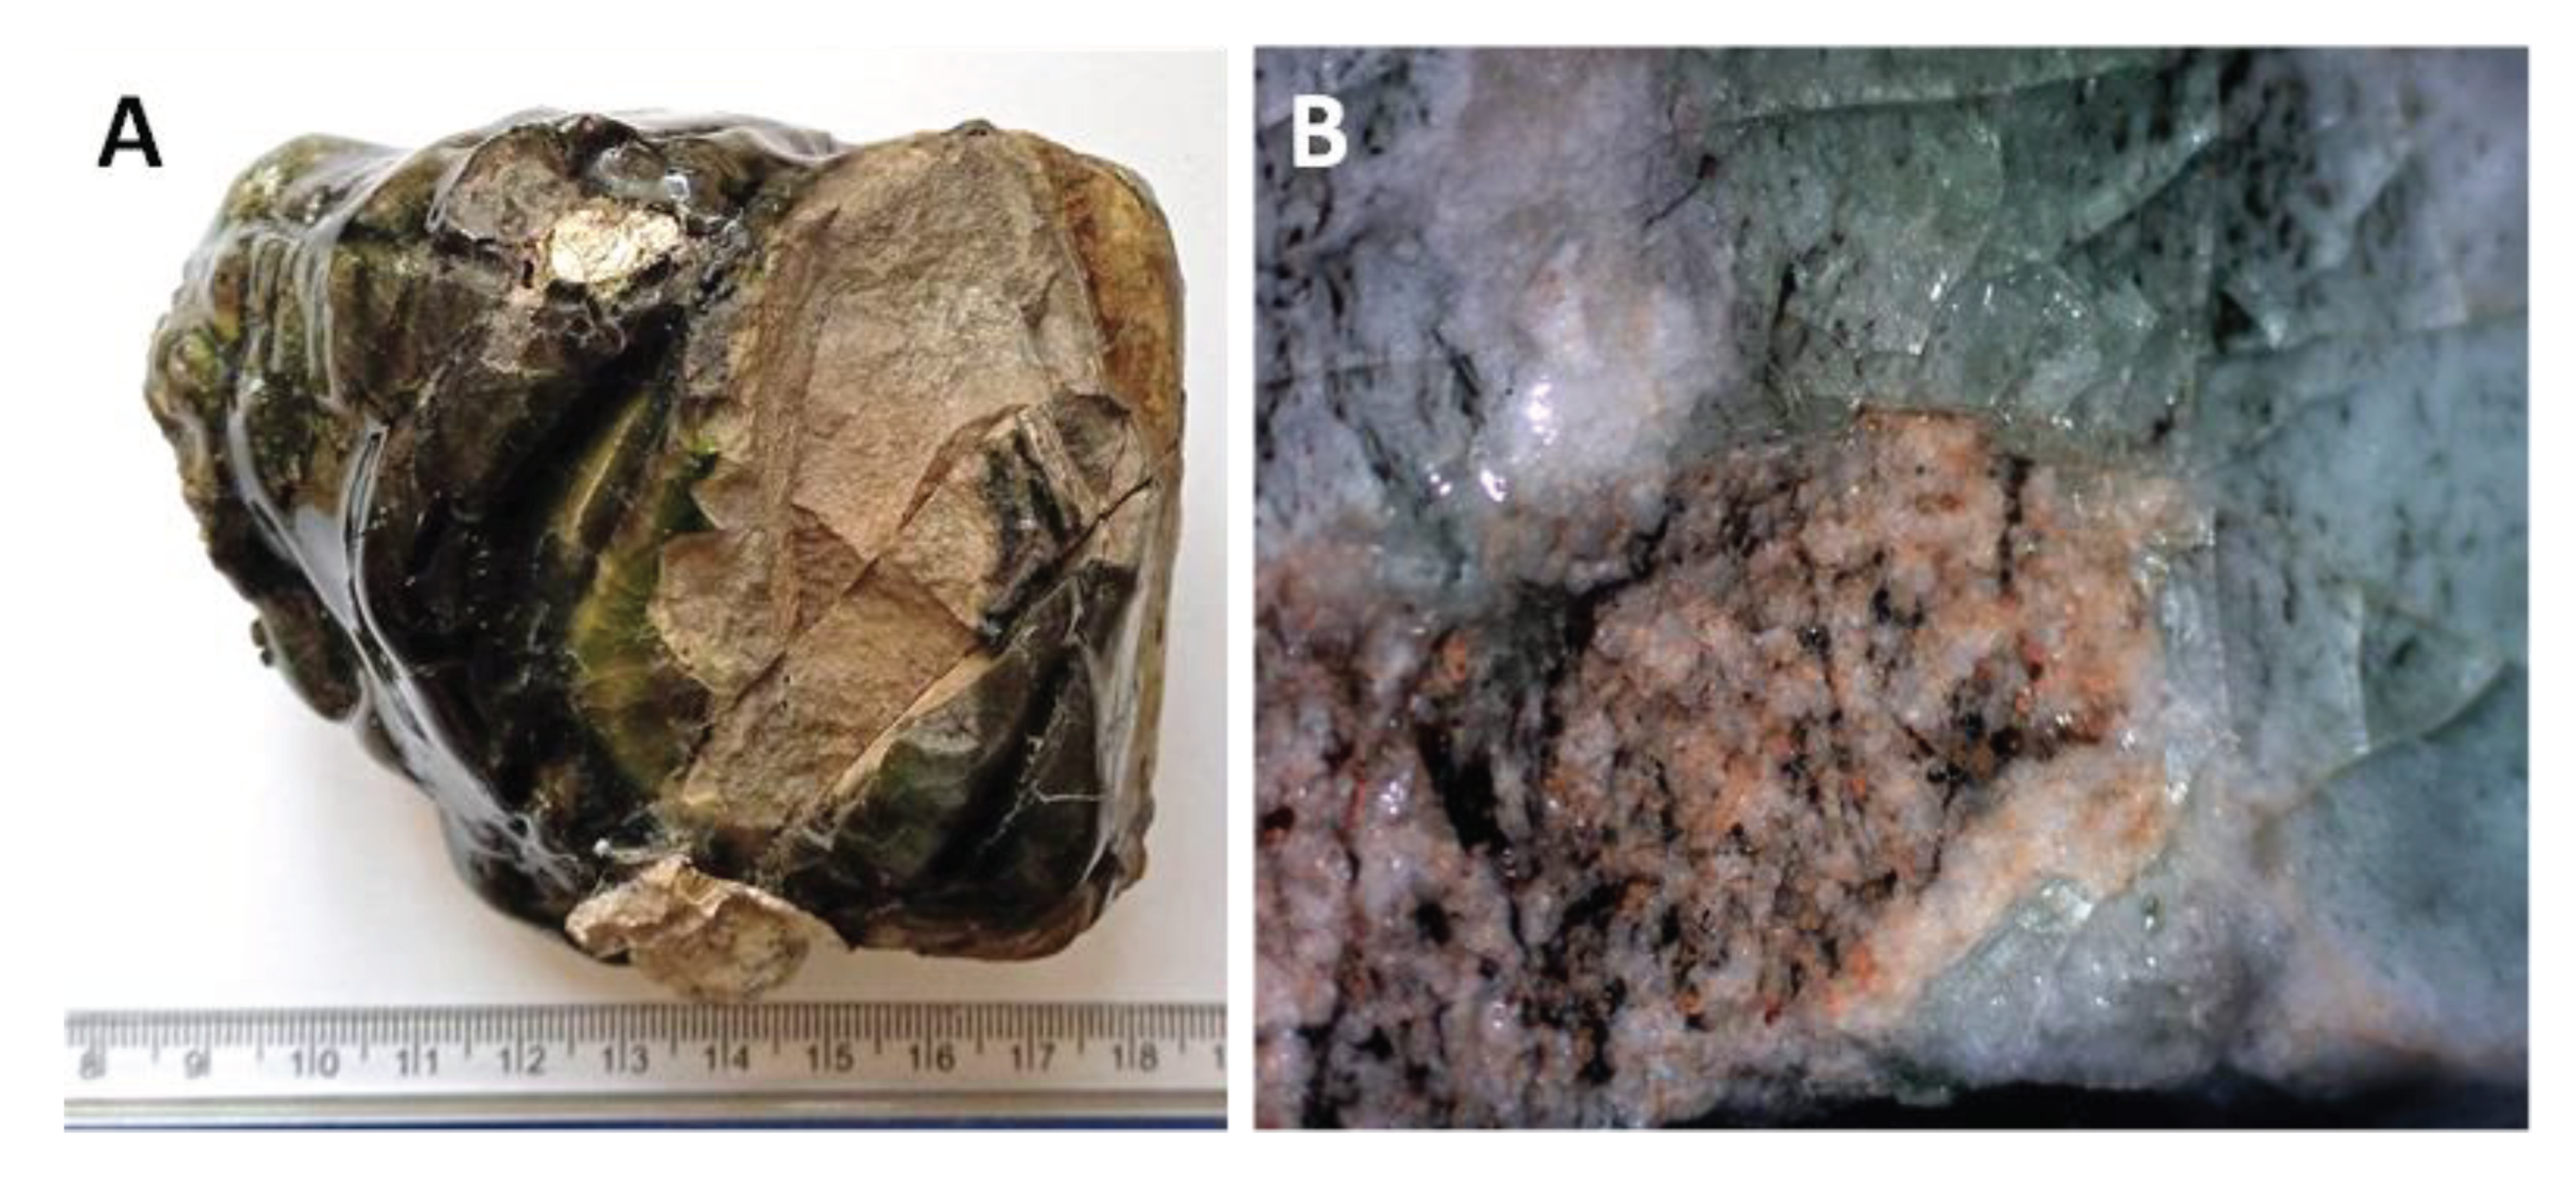
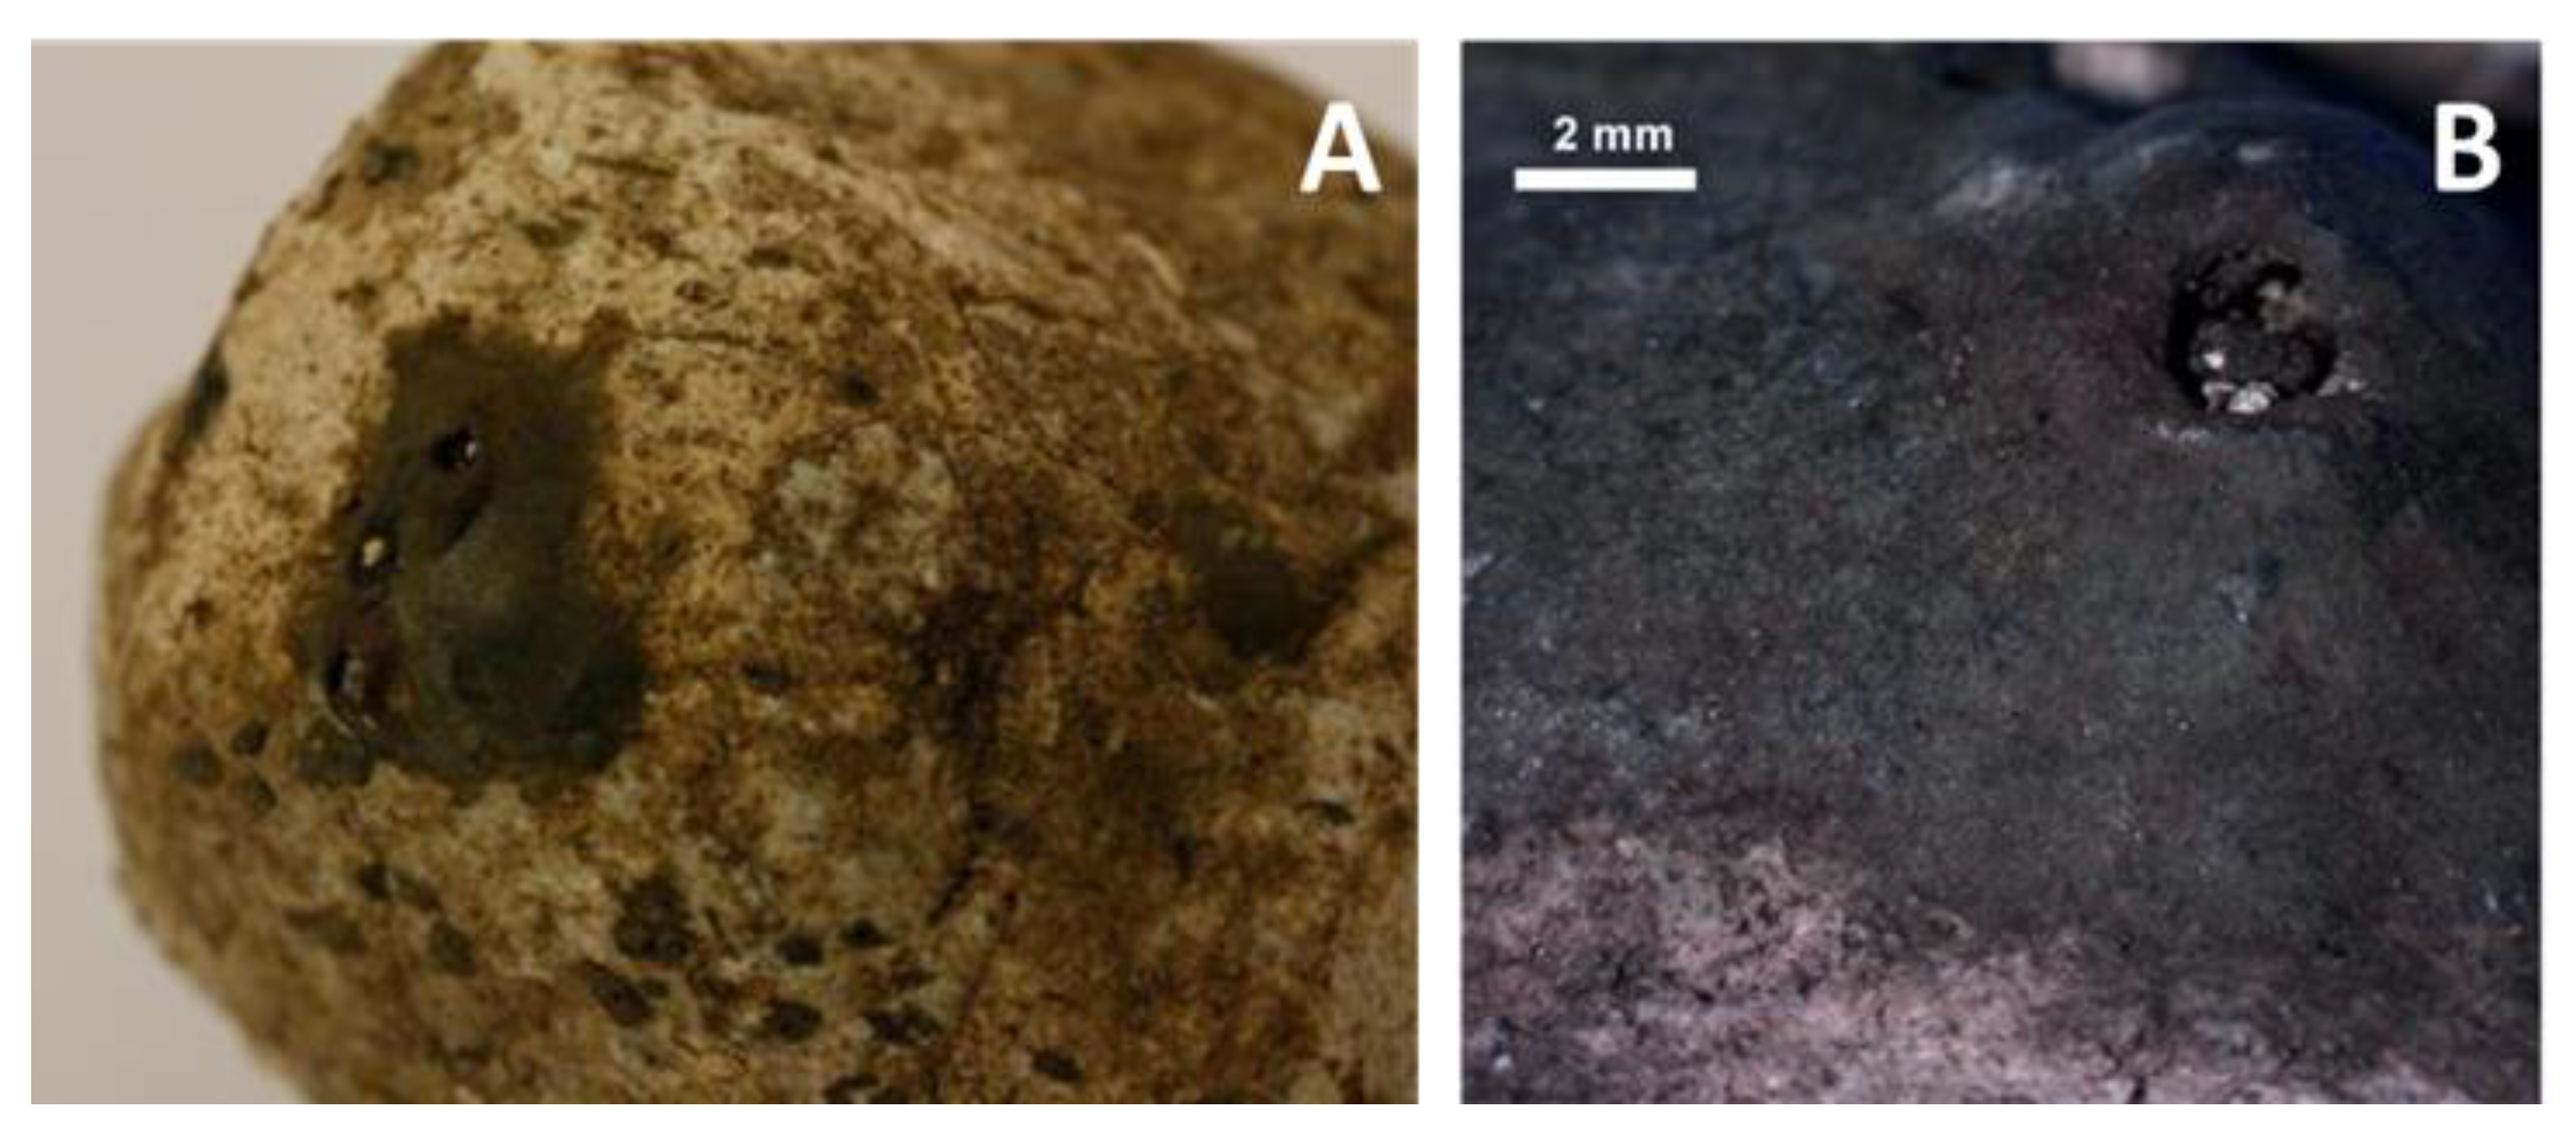
4.3.1. Macroscopic Deformation and High-Temperature Effects
4.3.2. Decarbonization
4.3.3. Mineralogy: Primary Minerals and Their Transformations
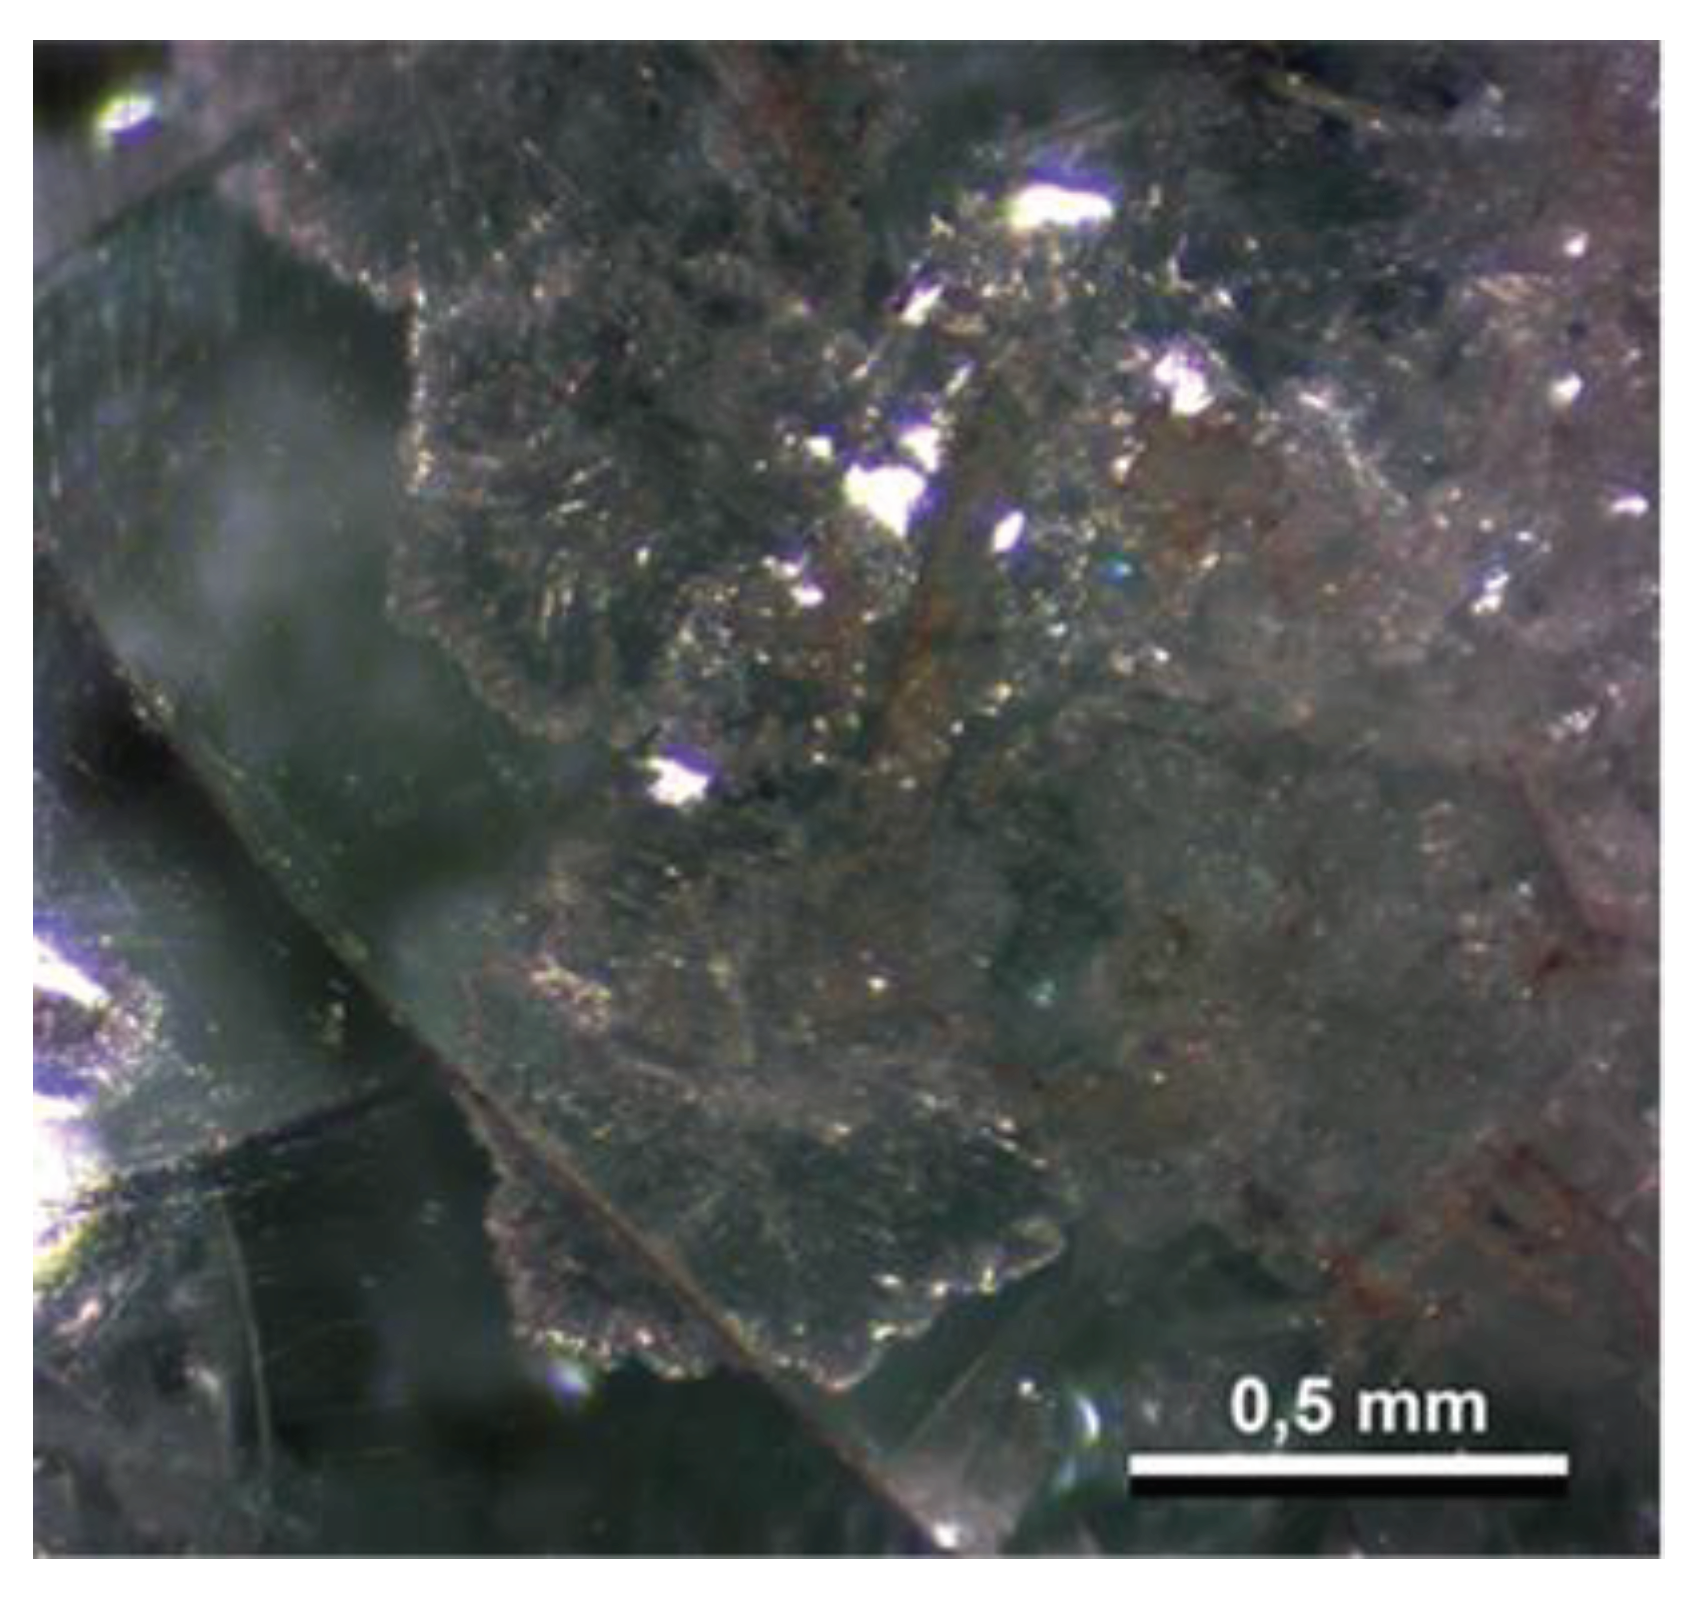
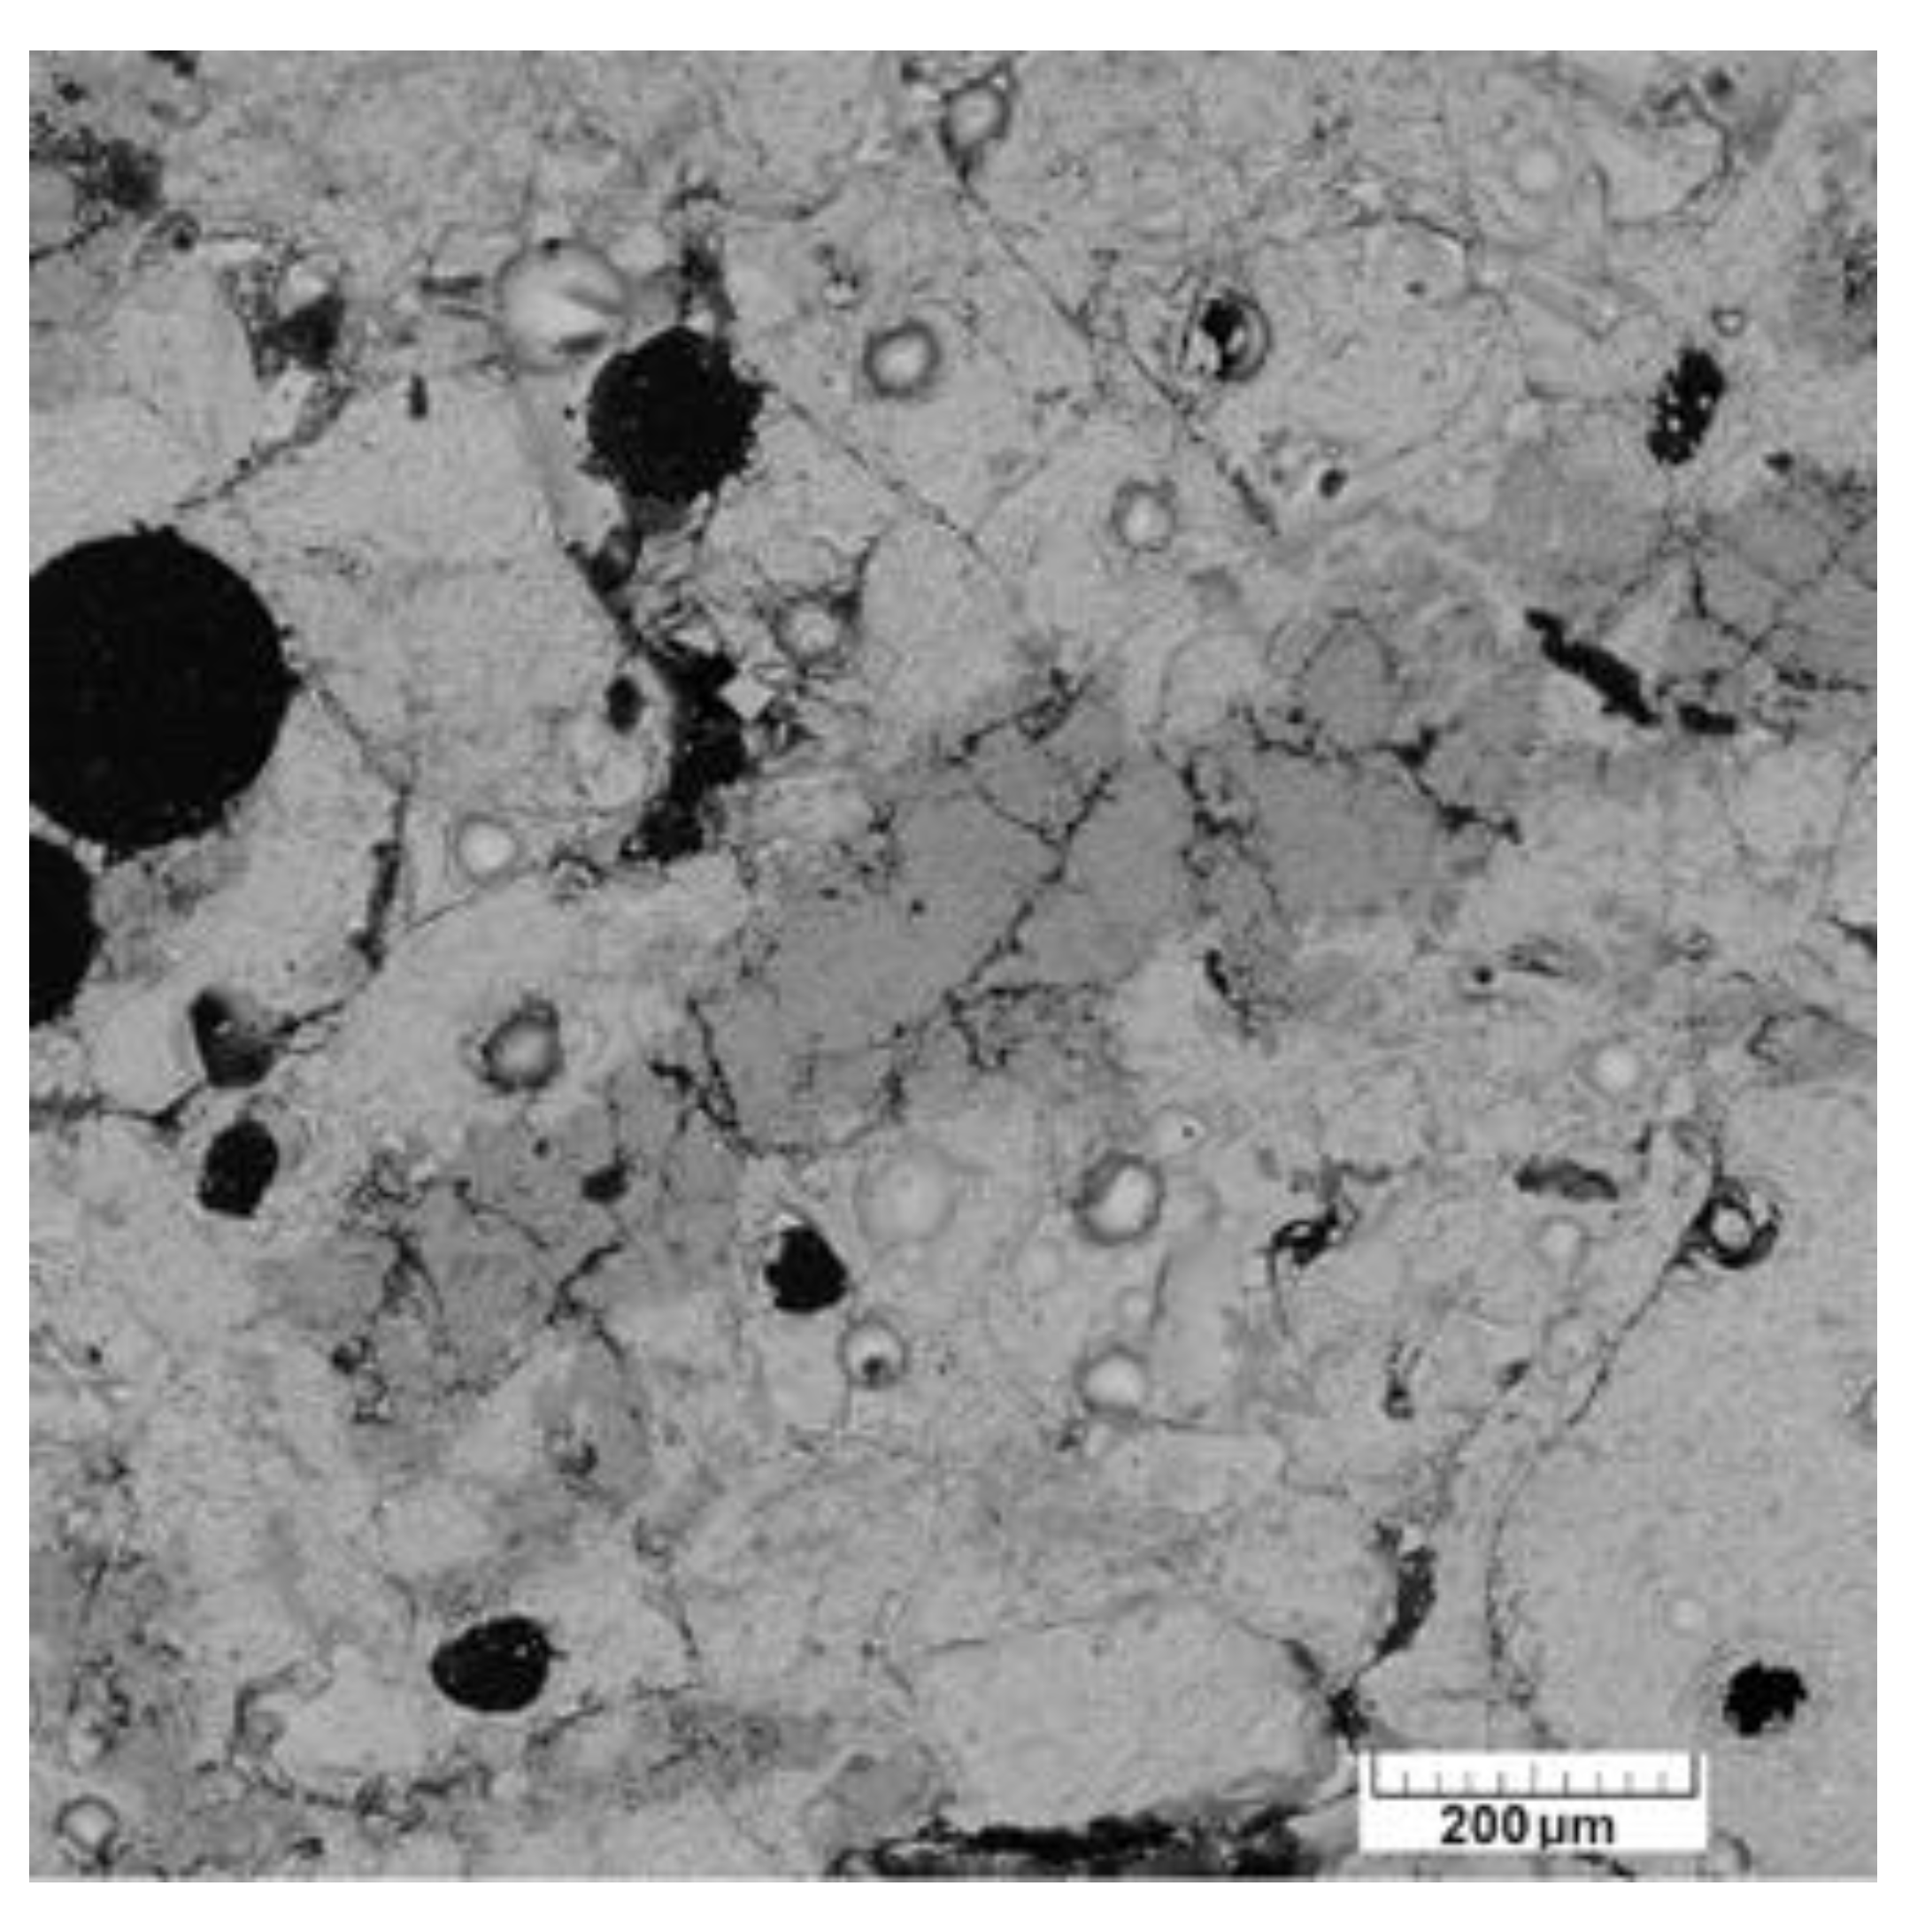
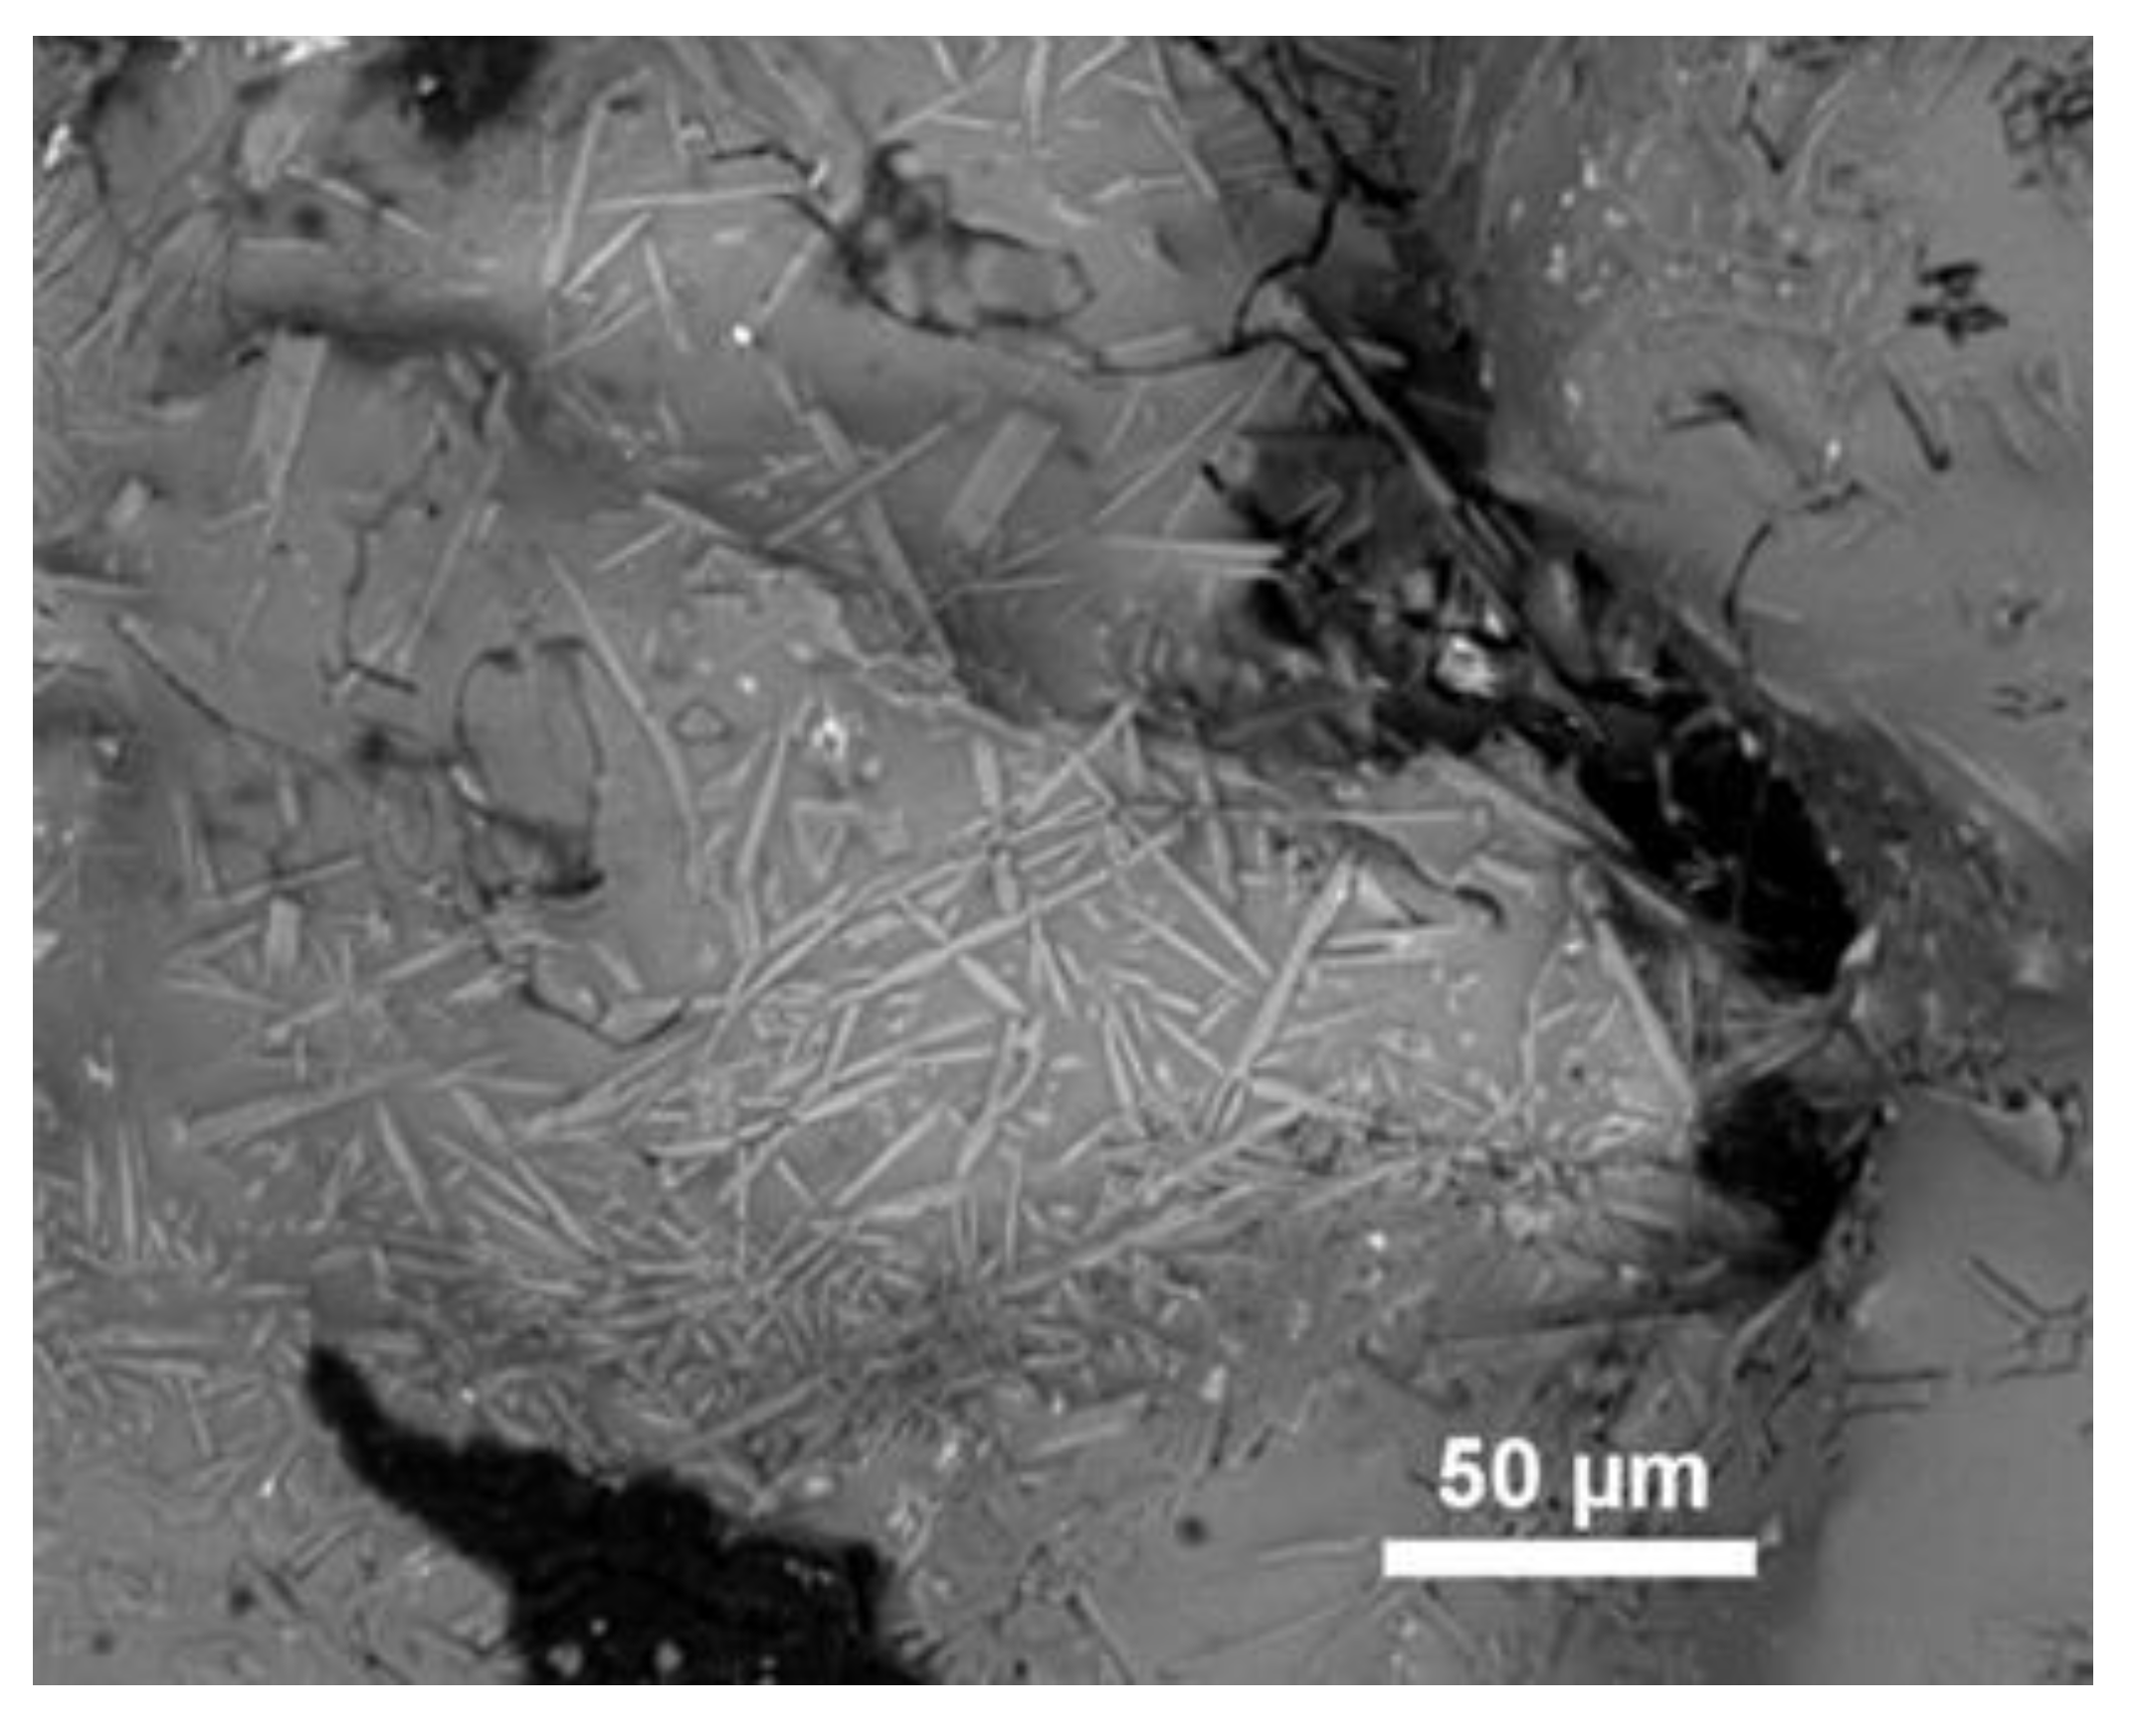
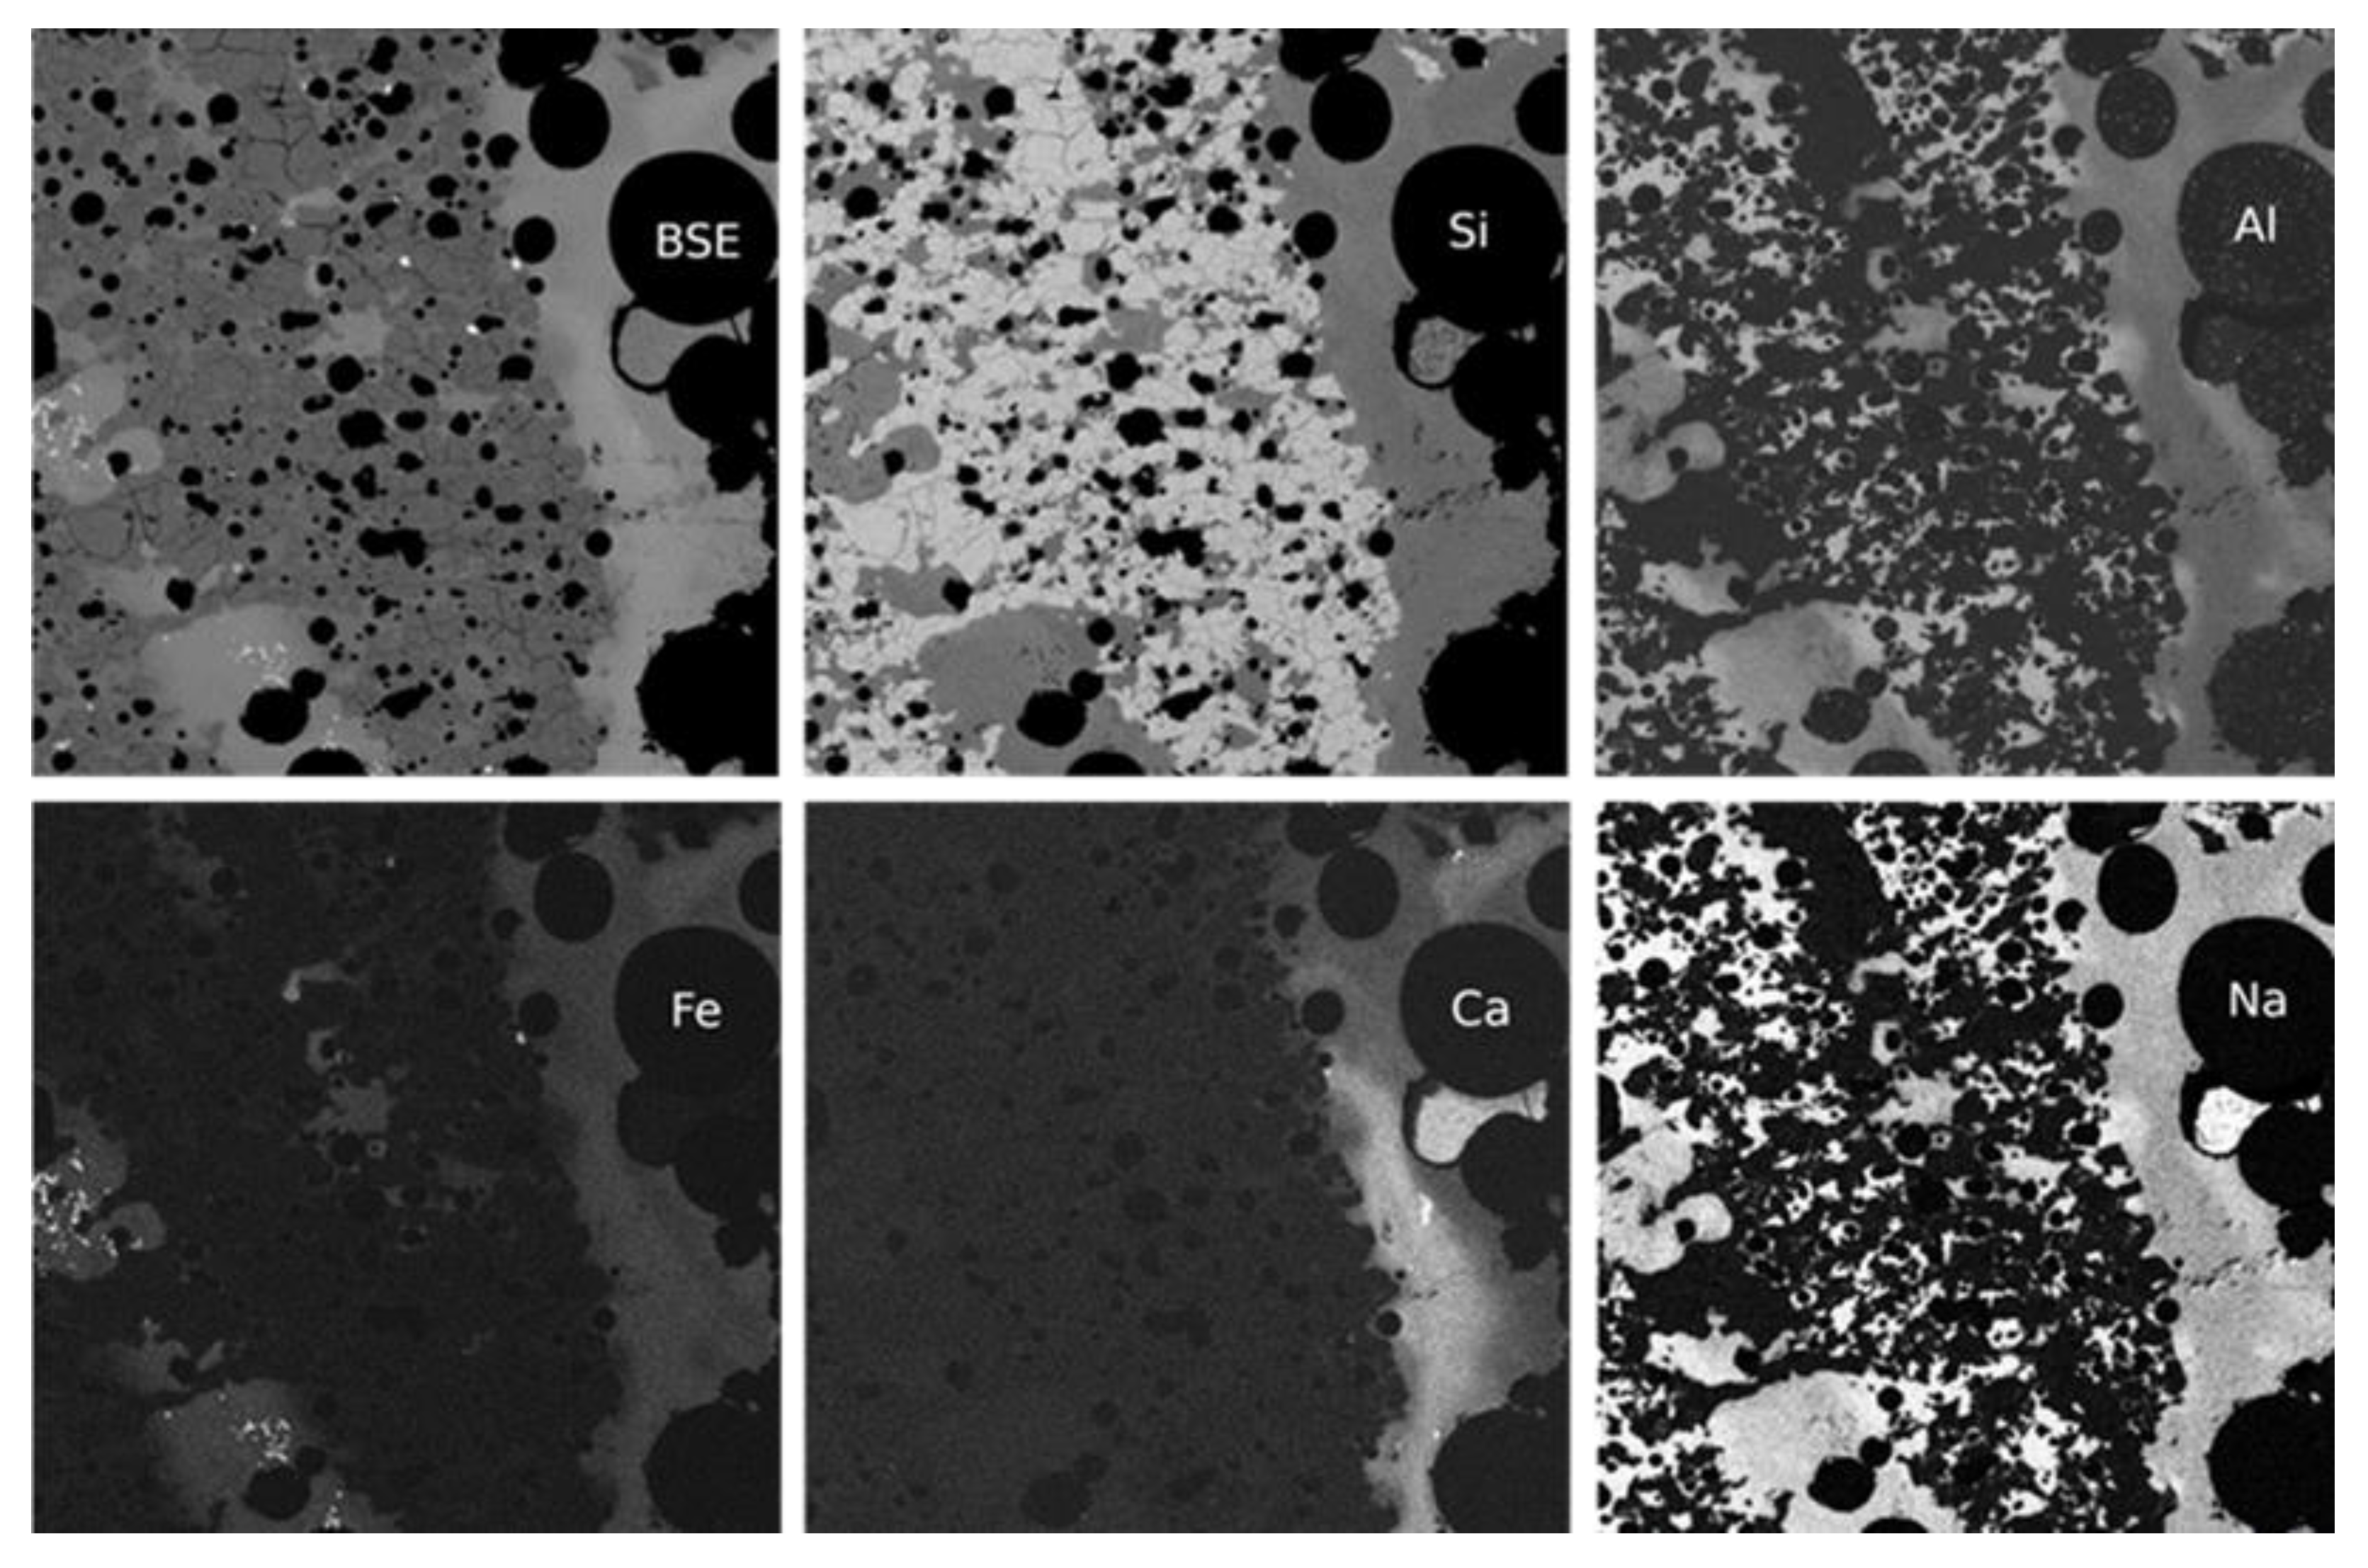
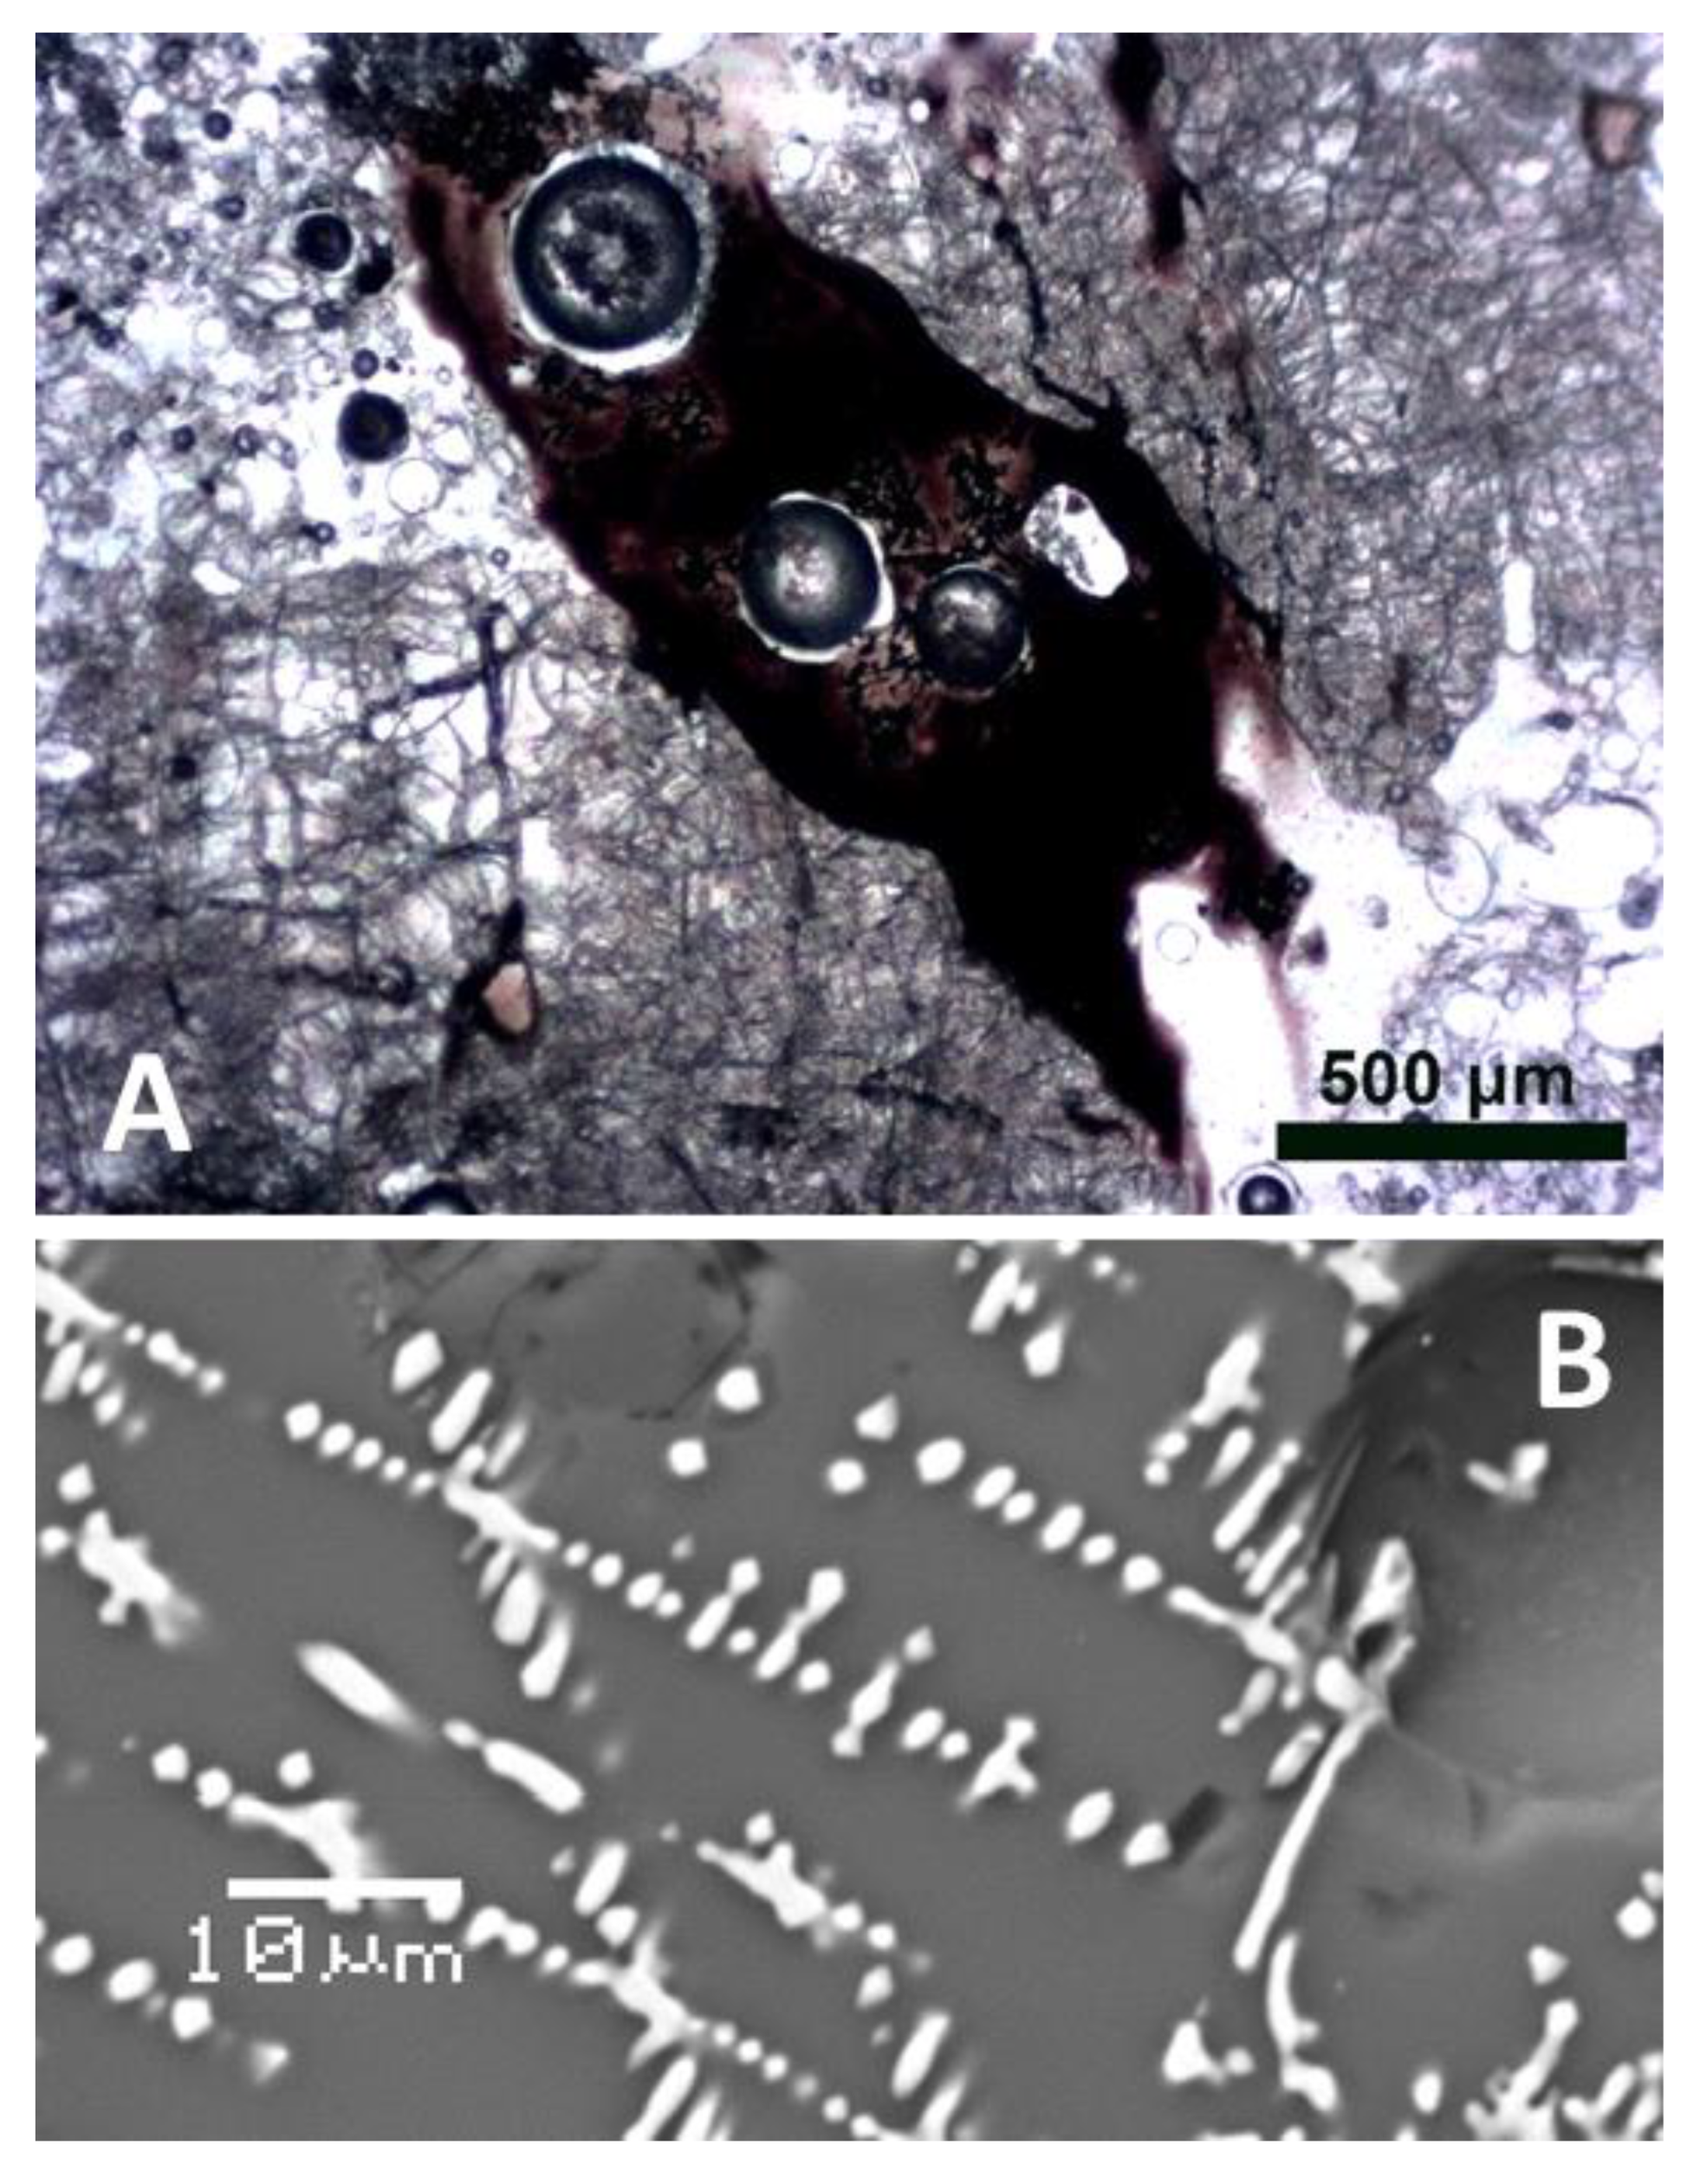
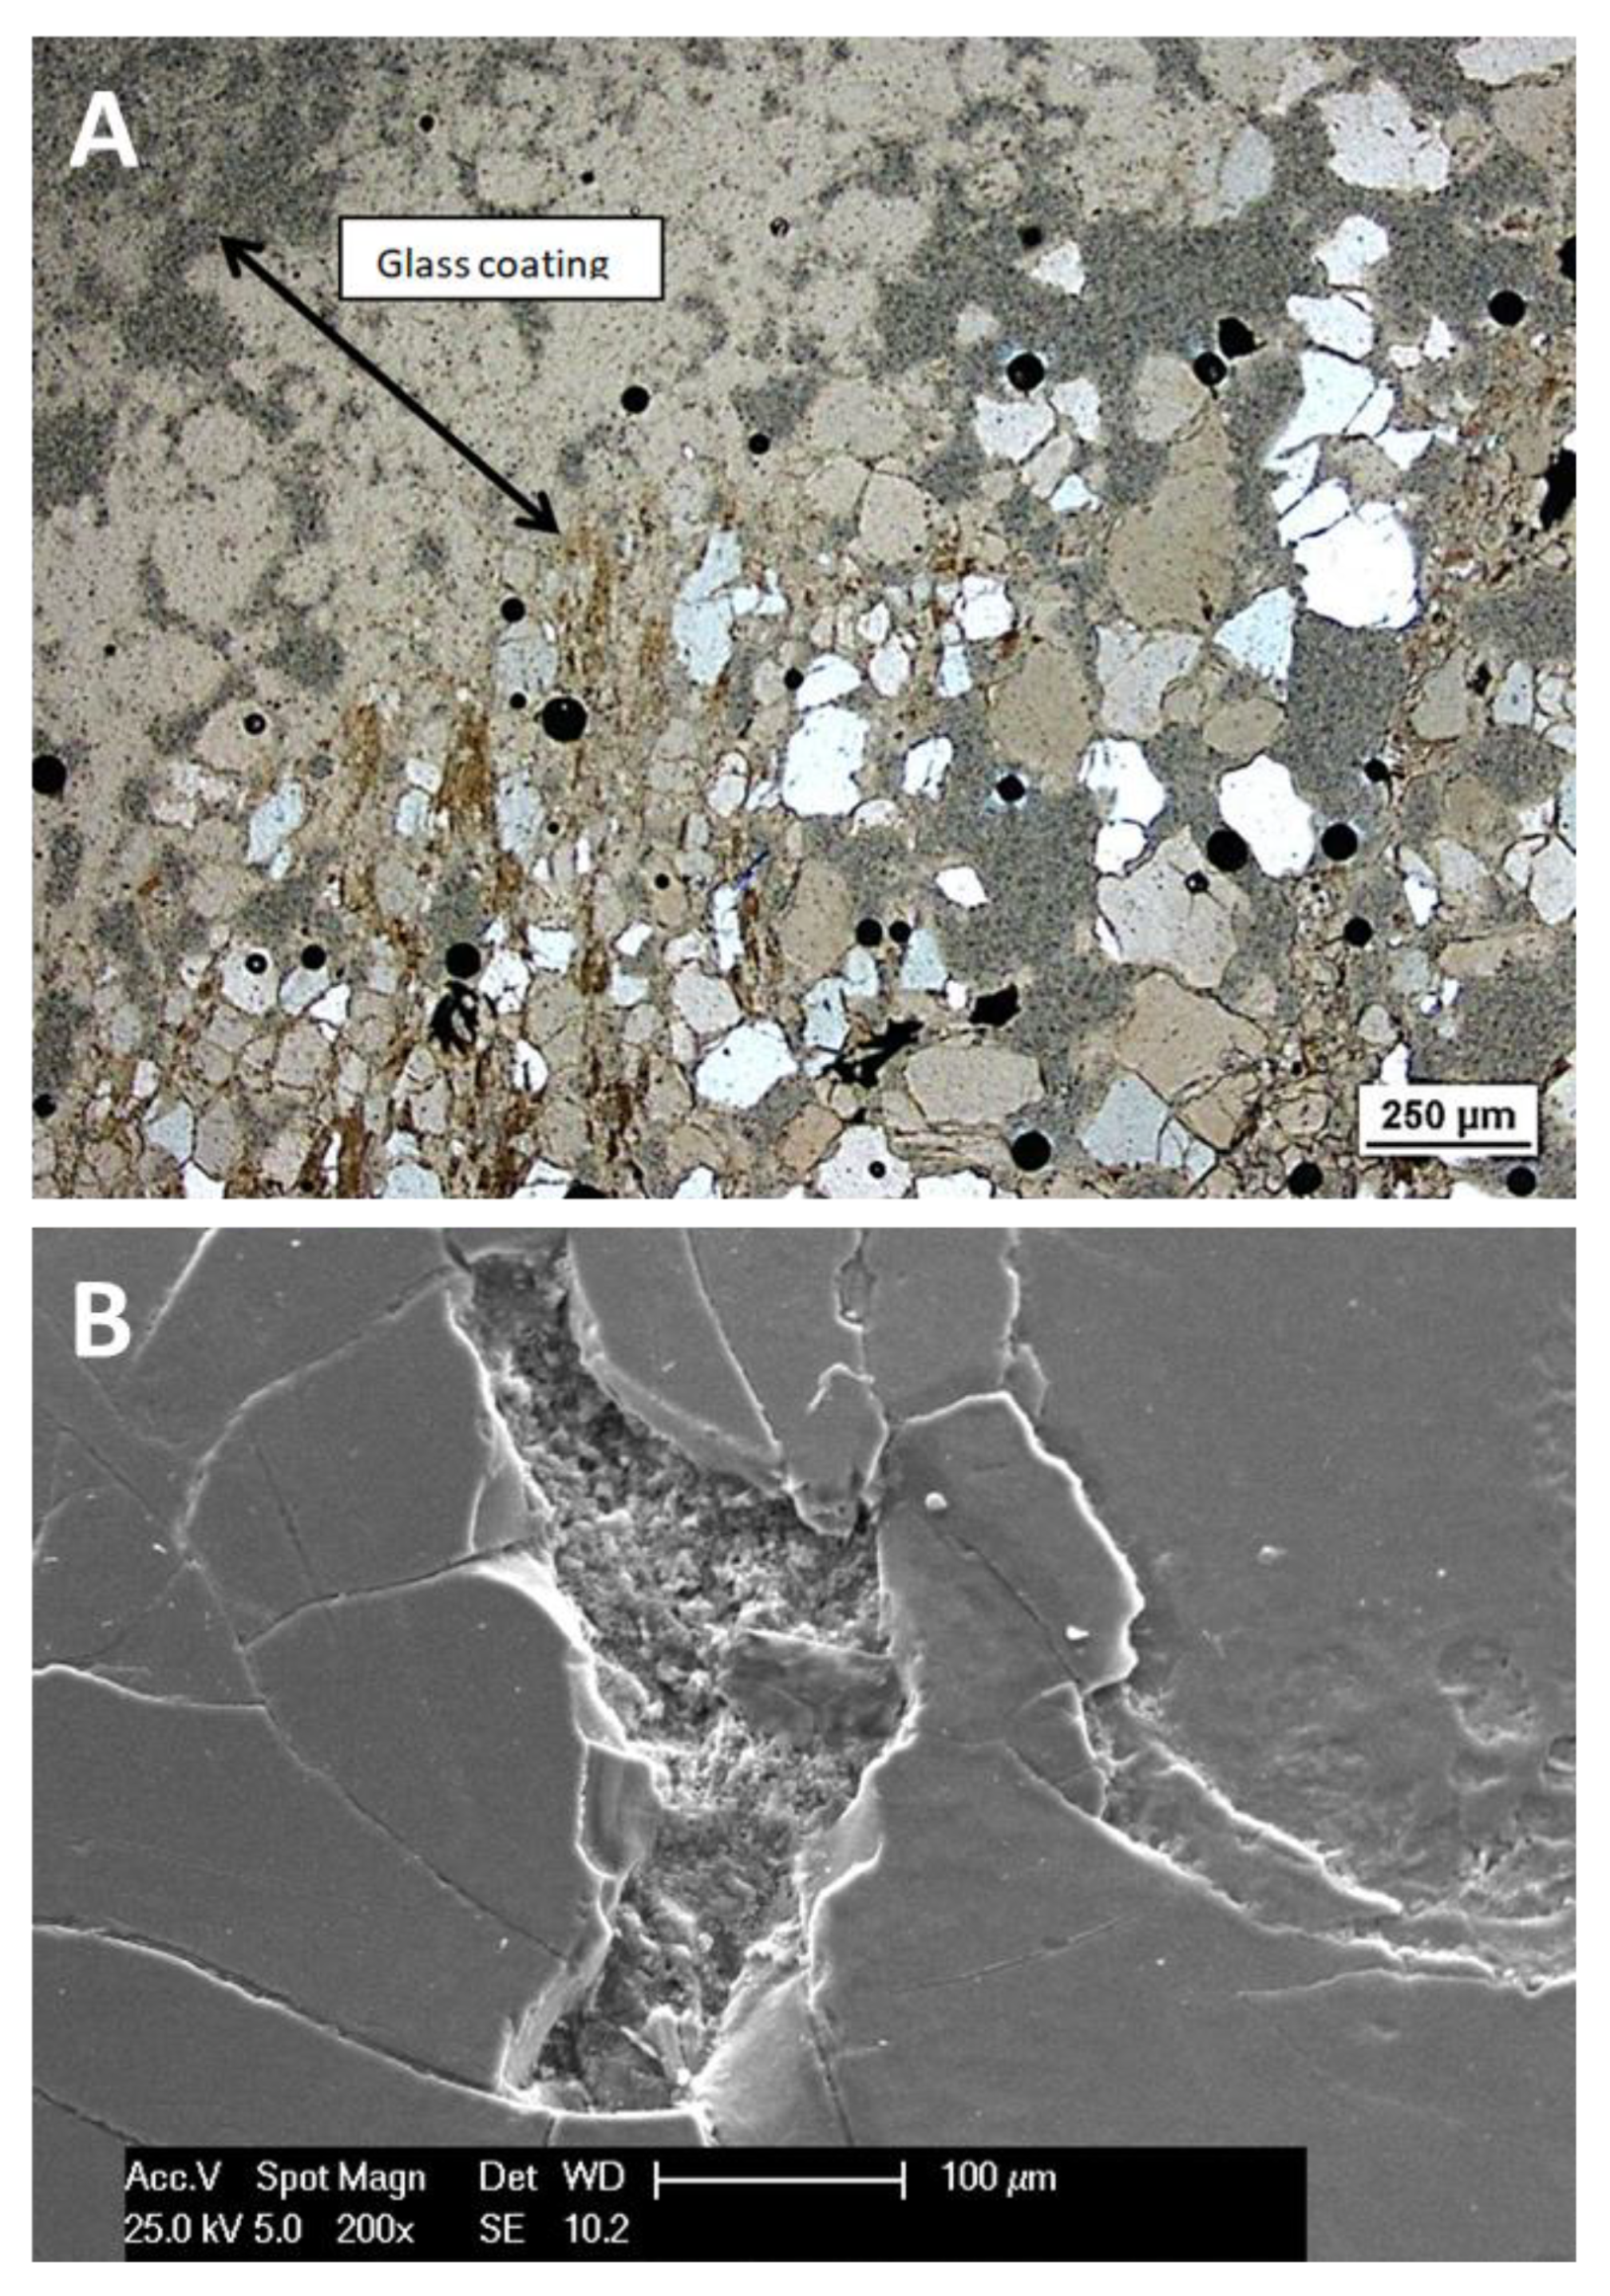
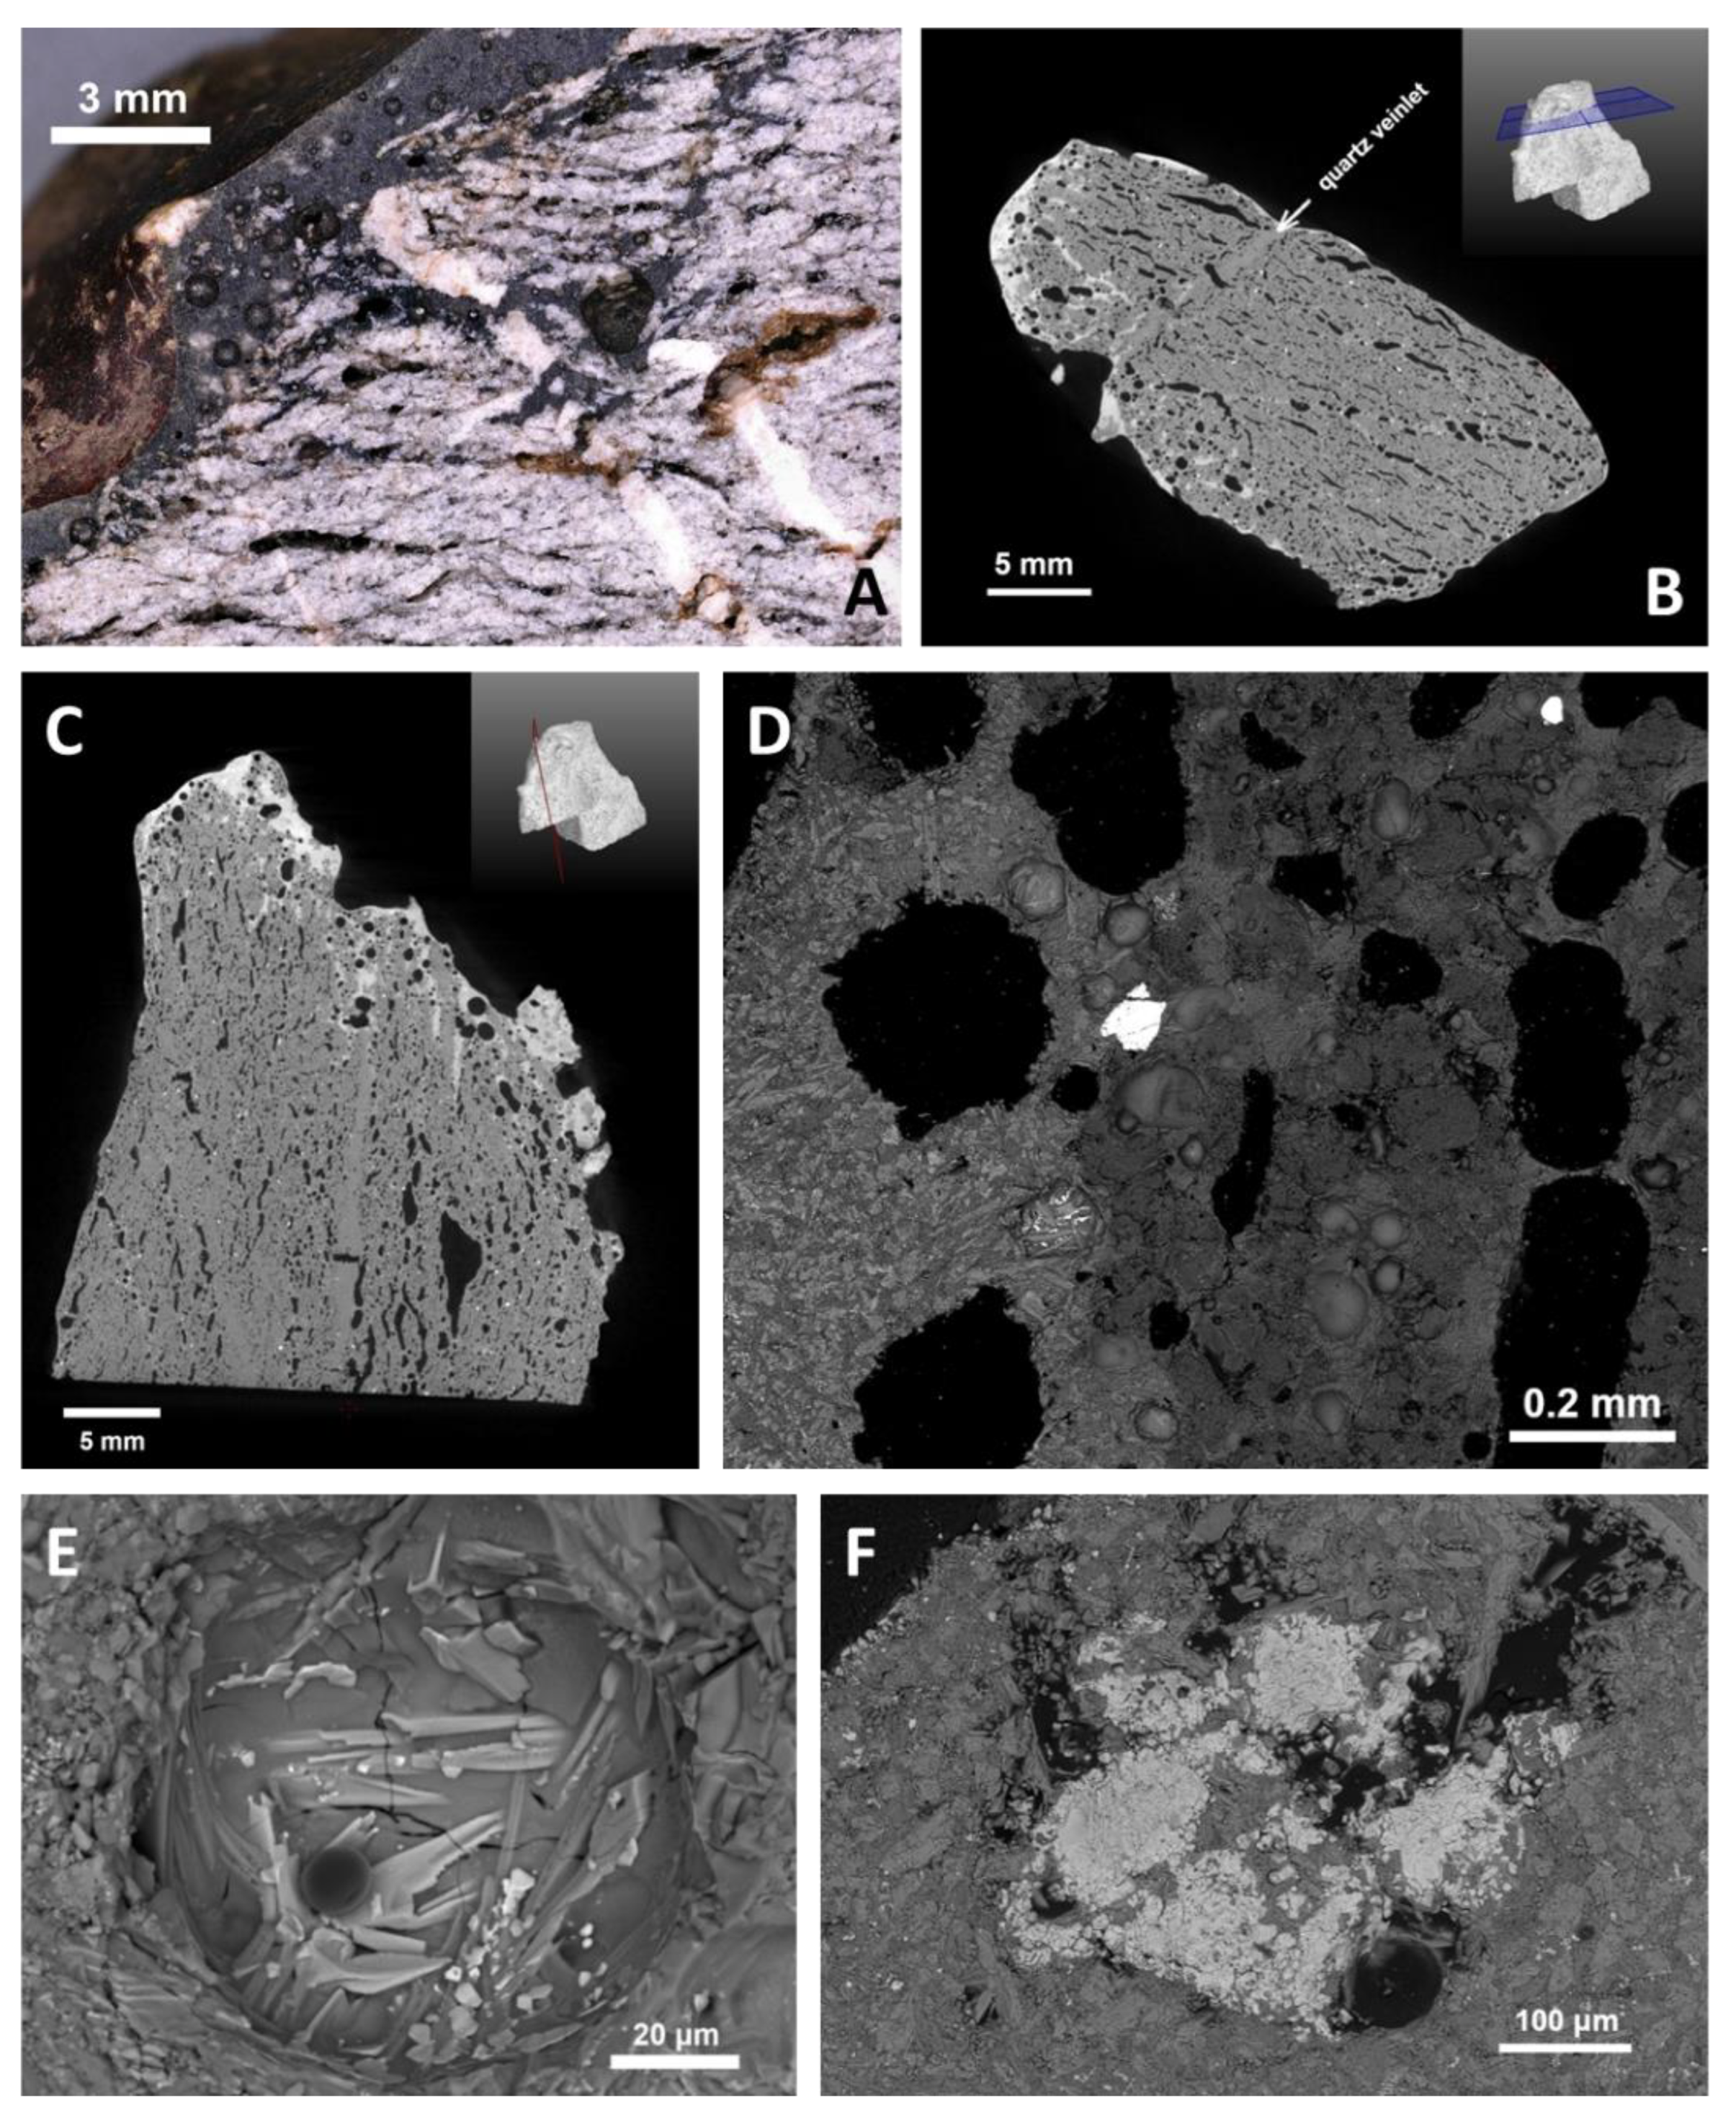
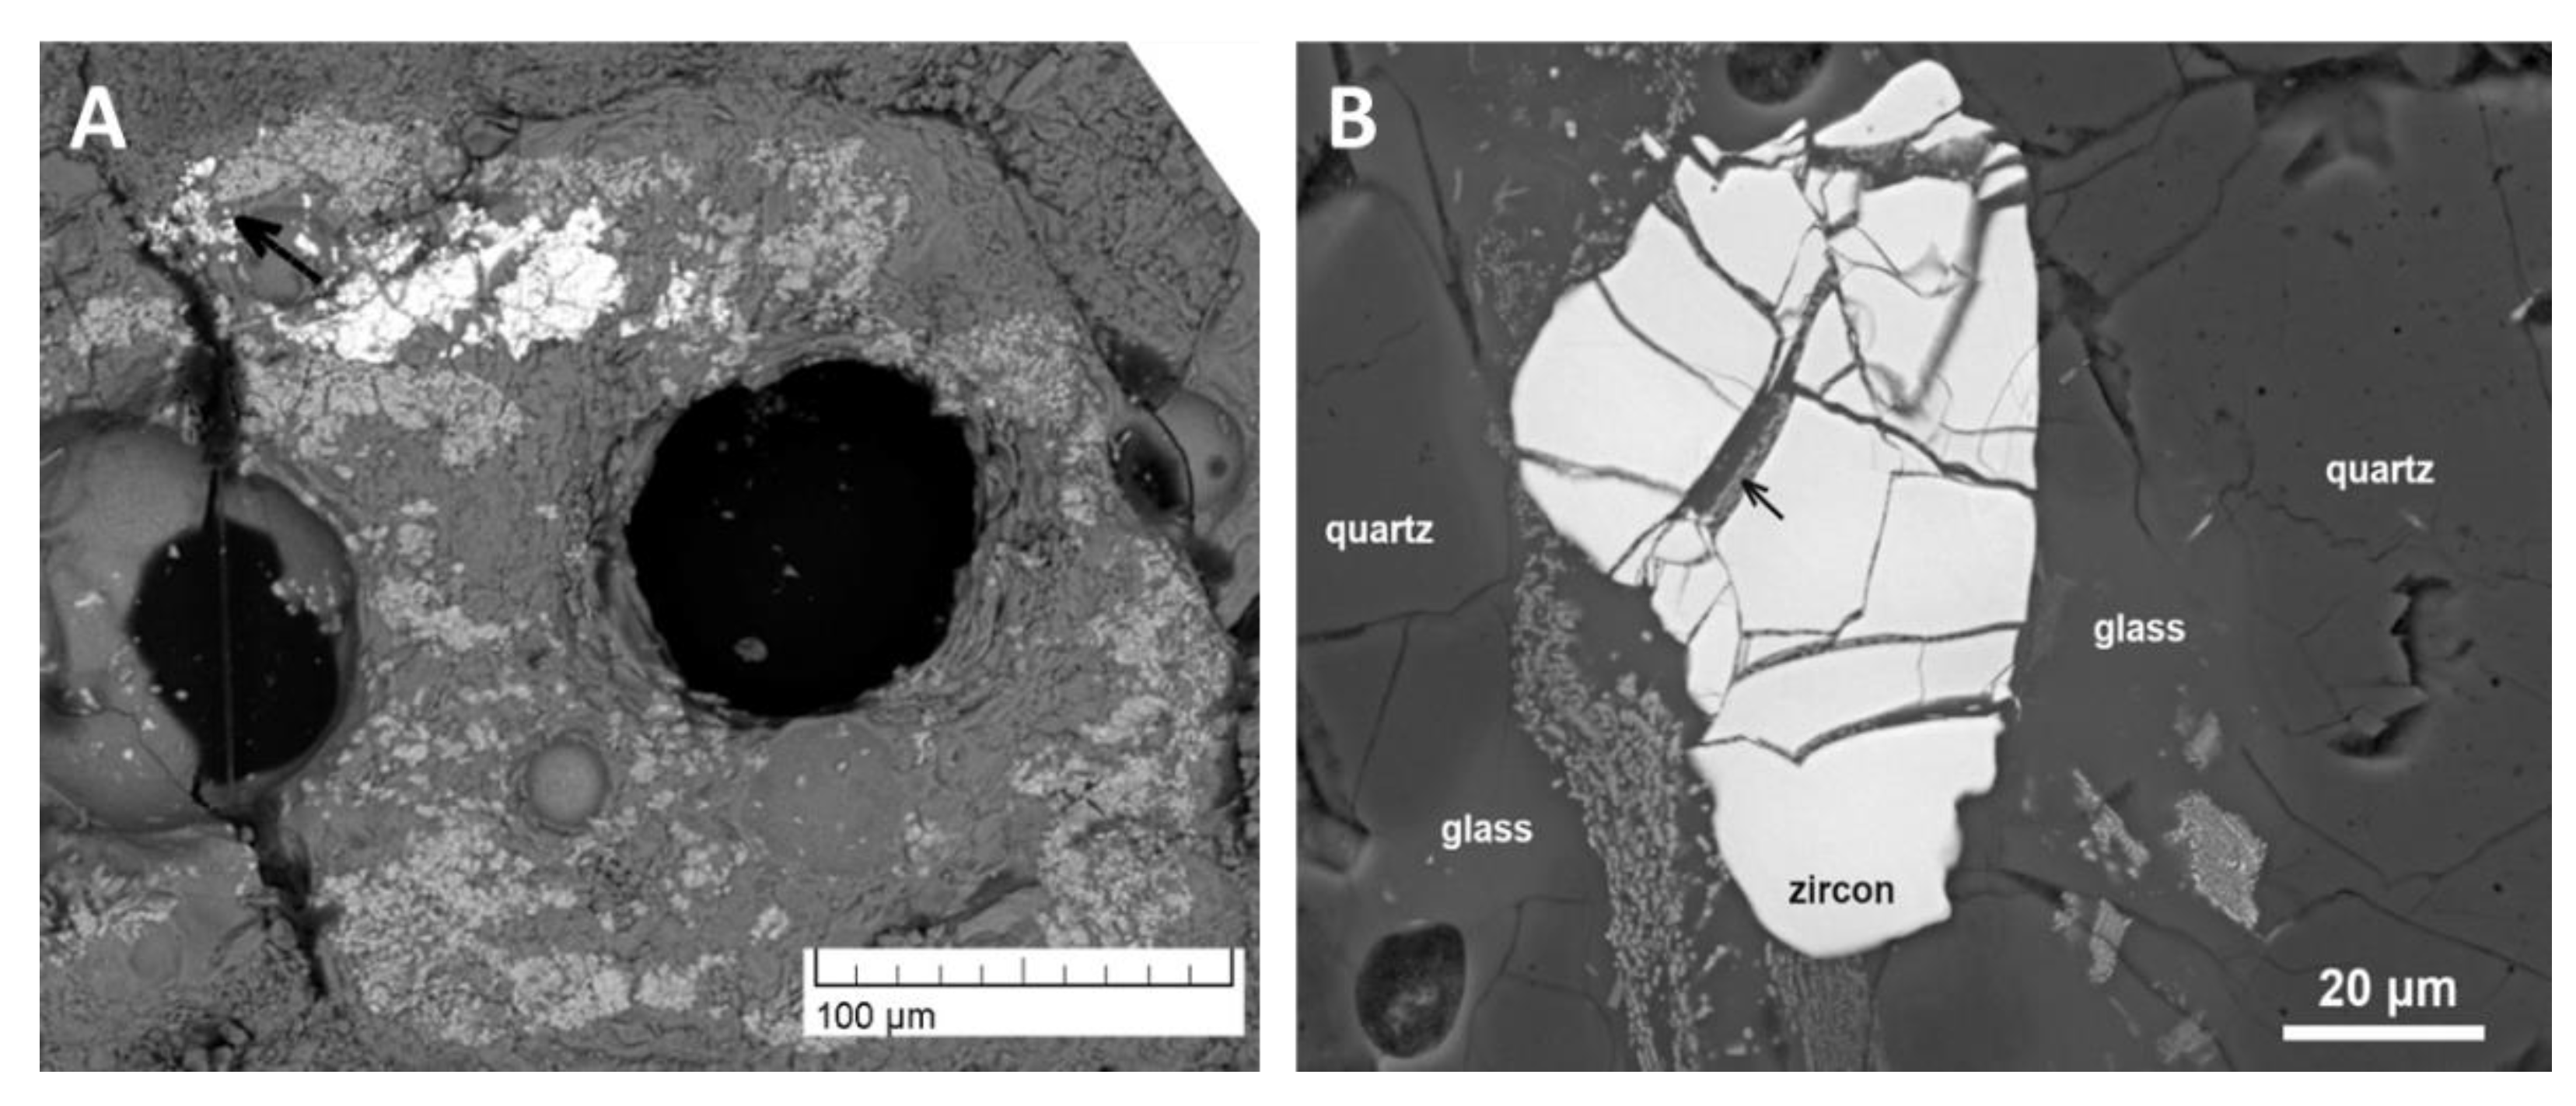
4.3.4. Glasses and Secondary Minerals: Microscopy, Microchemistry
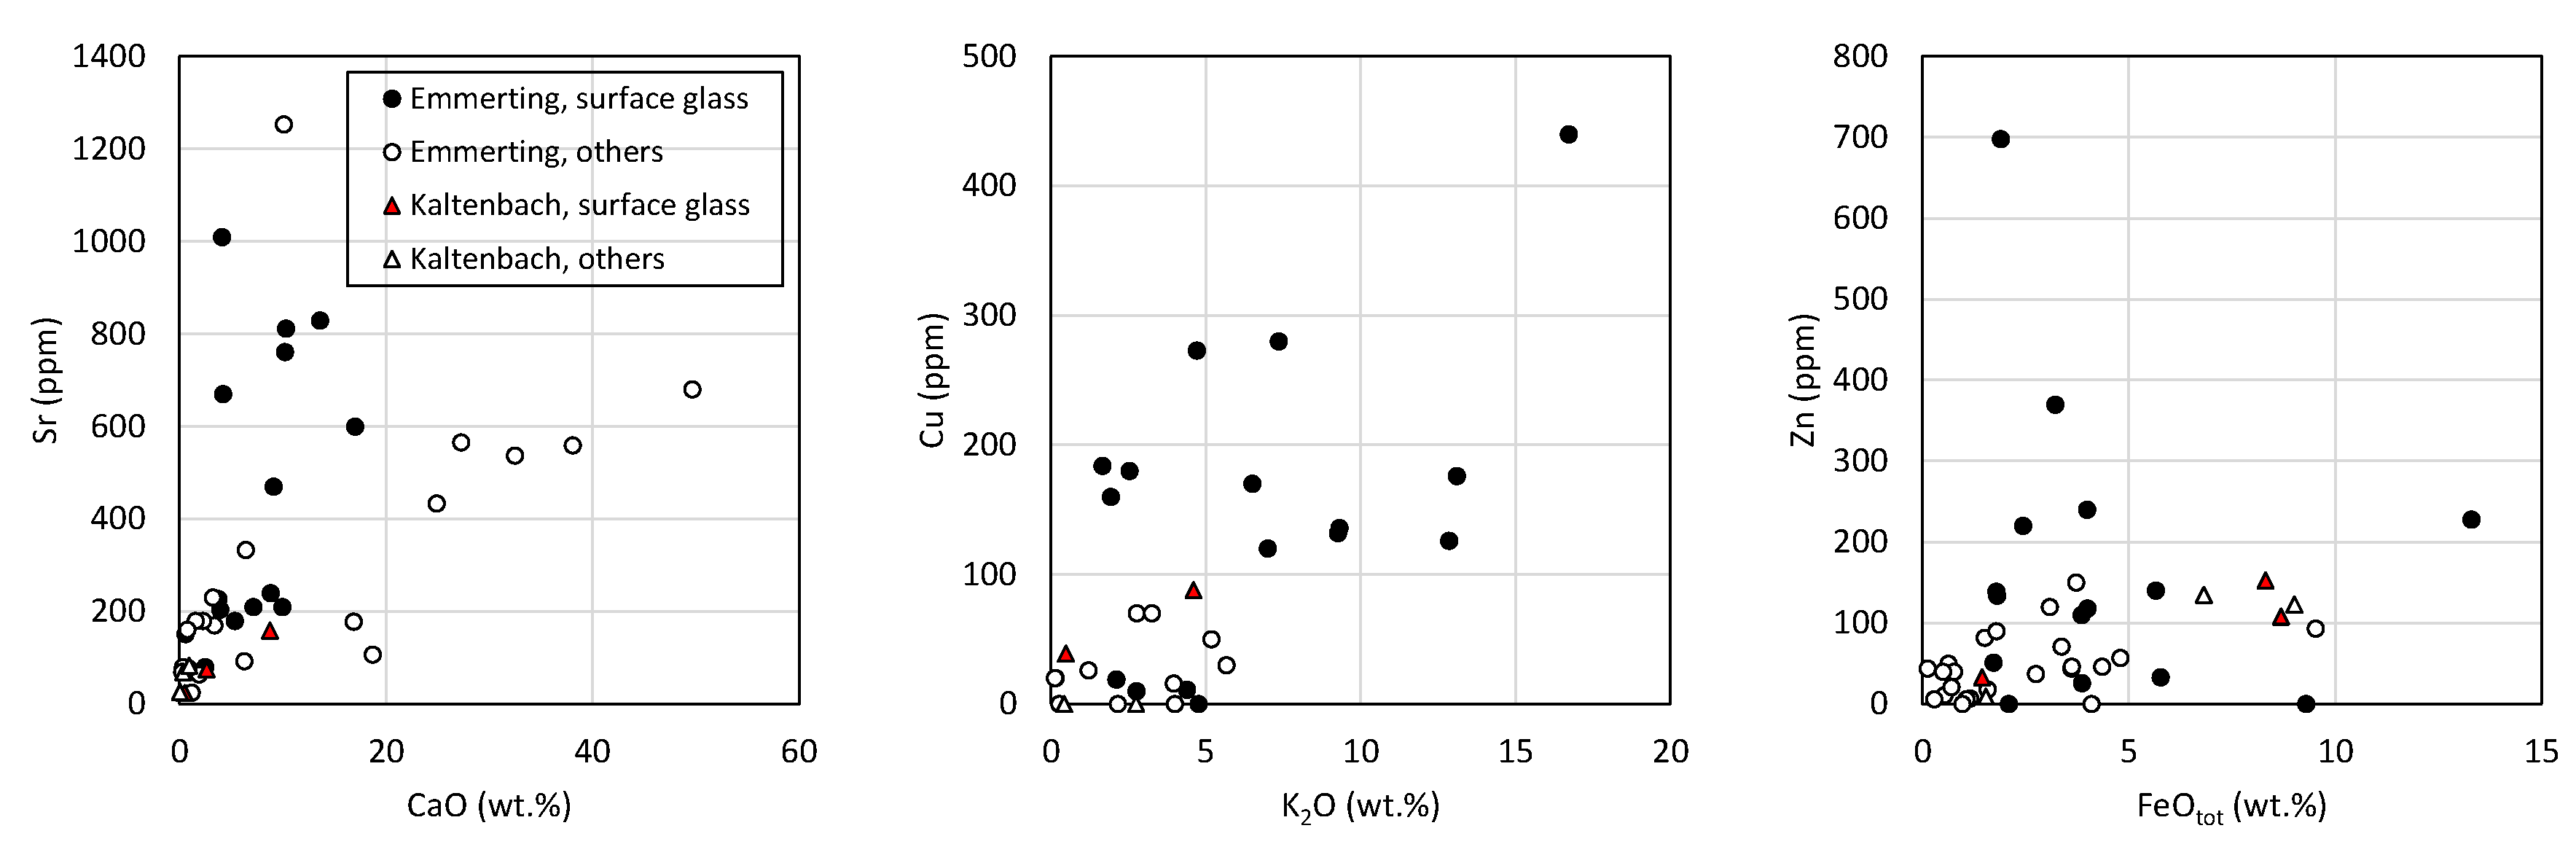
4.3.5. Bulk Composition of Surface Glasses and Comparison to Pebble Interior
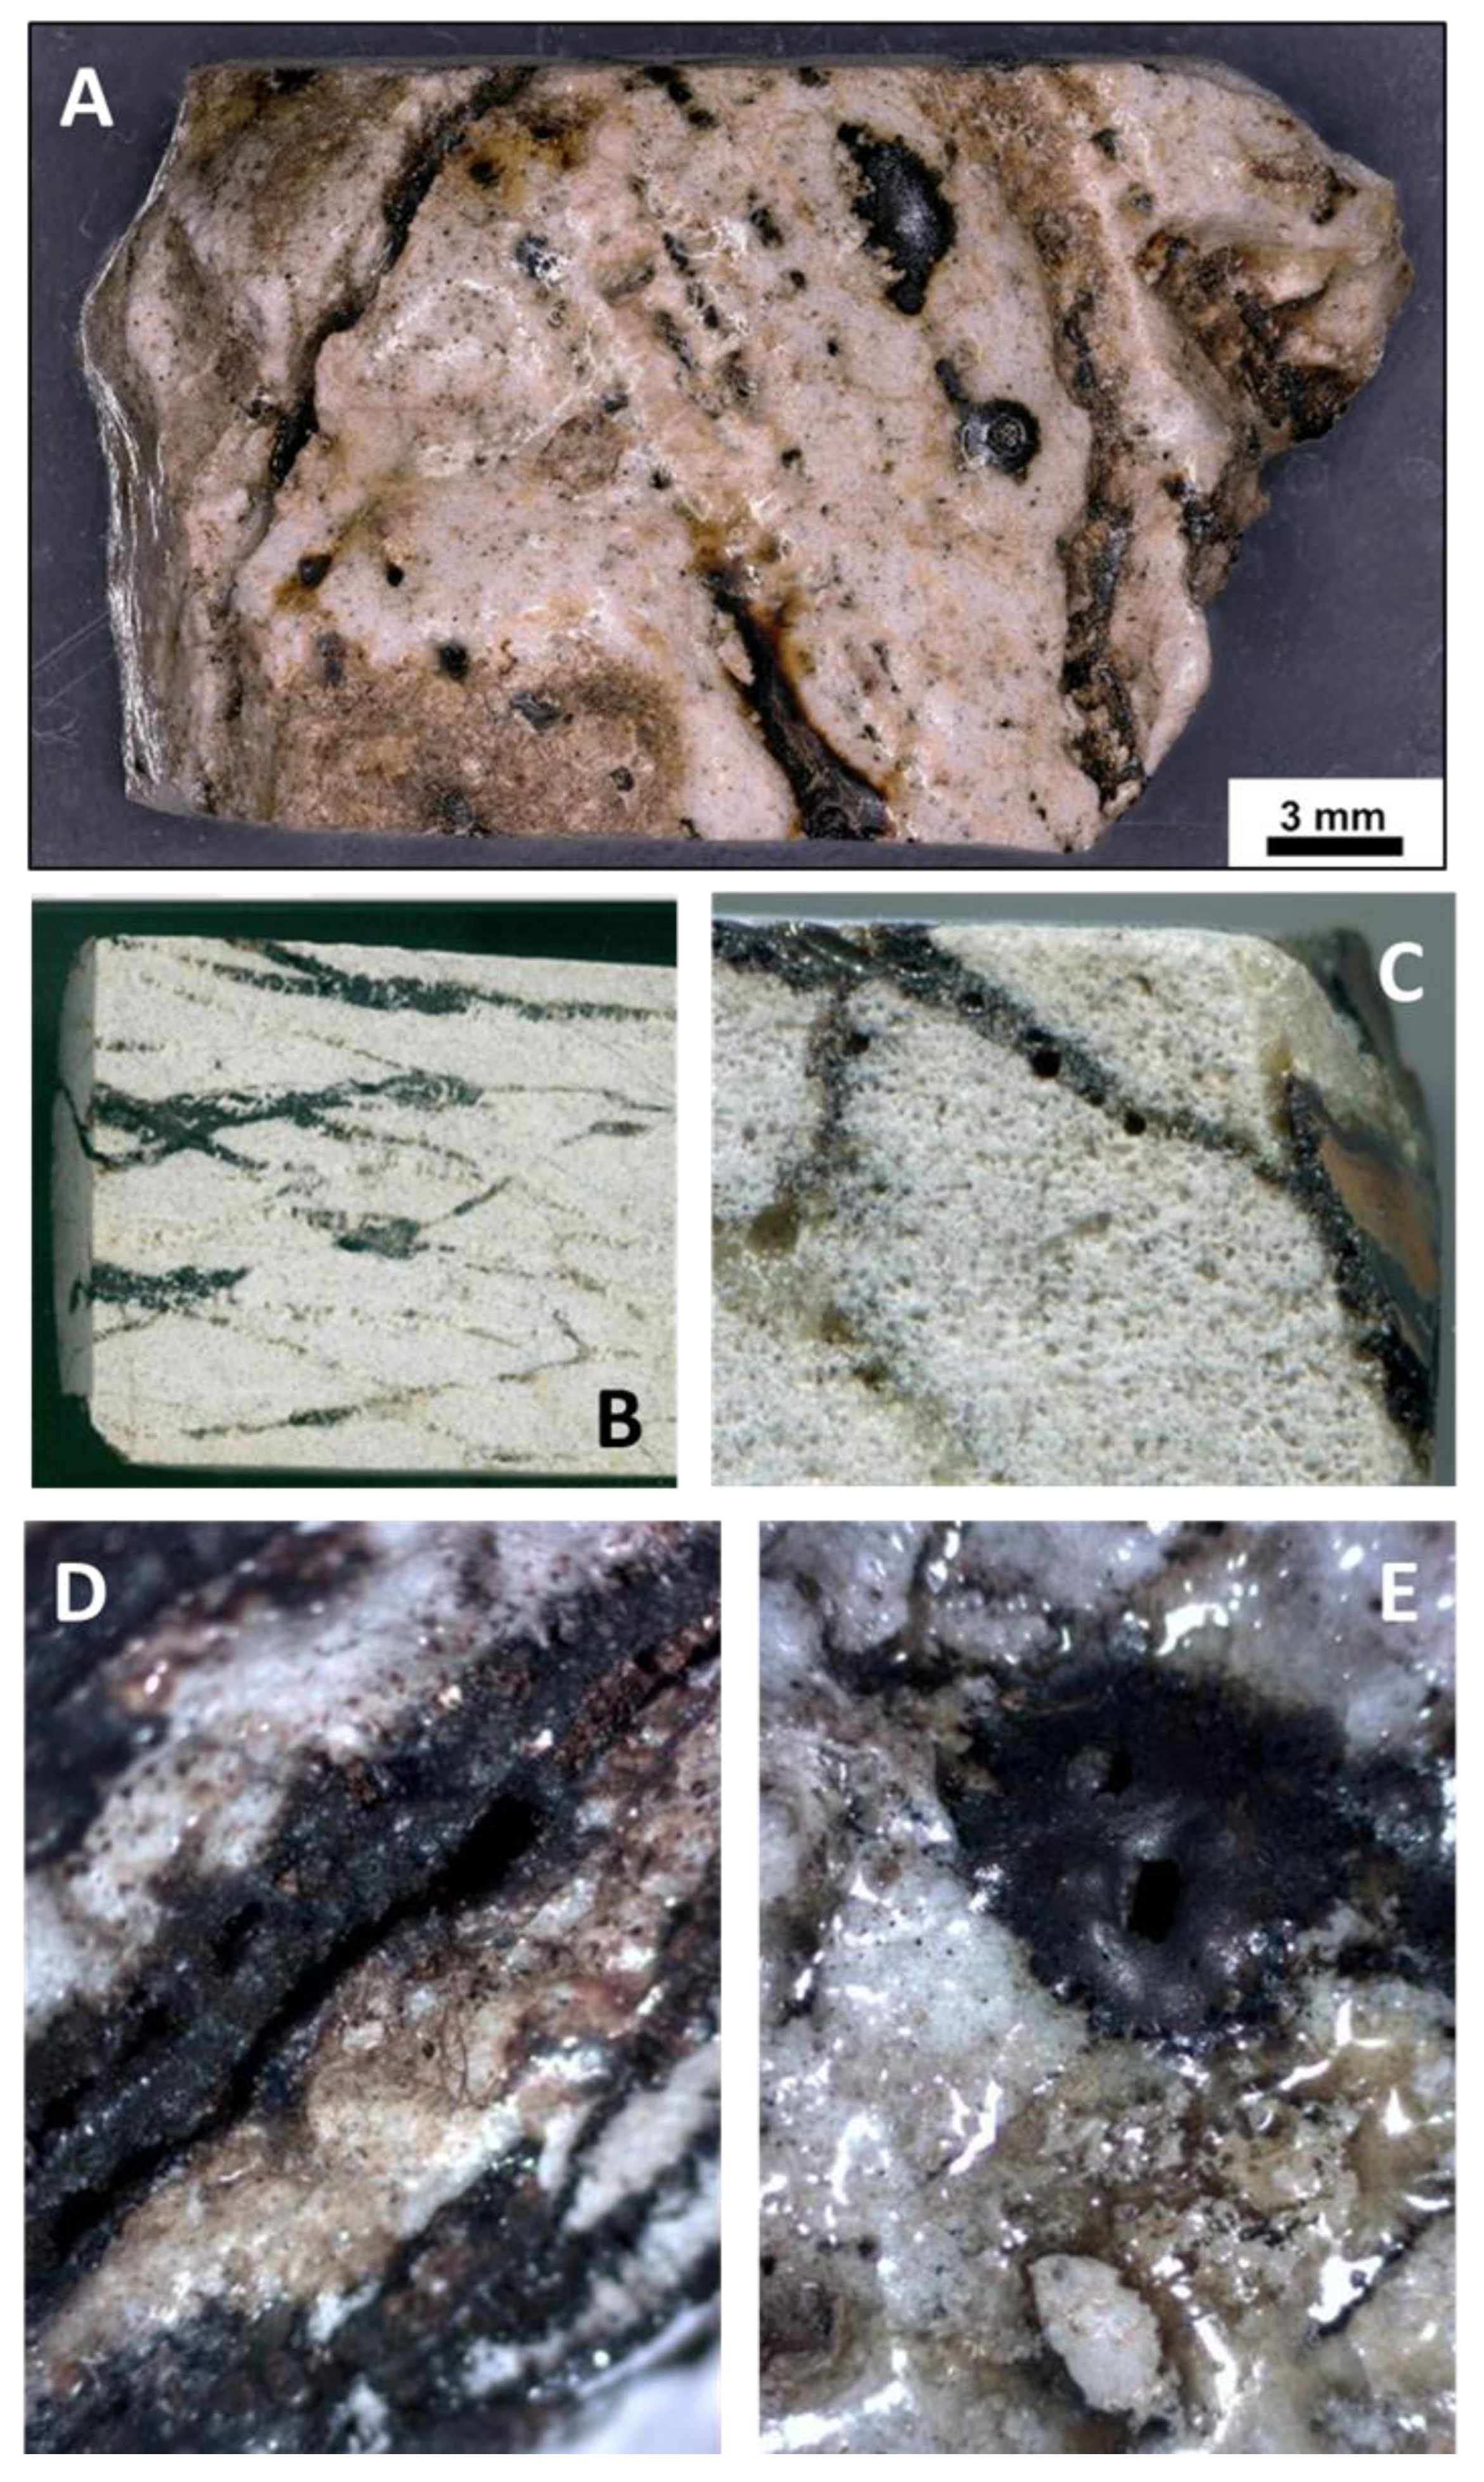
4.3.6. Closer View of Deformation and Melt Movement in Pebbles
4.3.7. Glass Melting Temperature
4.4. Magnetometry
4.5. Disequilibrium Character of Melting and Evaporation, and Its Implications
4.6. Decarbonization in Craters
4.7. Composition of Glasses
4.8. Origin of the Kaltenbach Structure: Crater or Limekiln?
4.9. Other Anthropogenic Processes
4.10. Possible Convergence of Impact and Anthropogenic Processes
5. Conclusions
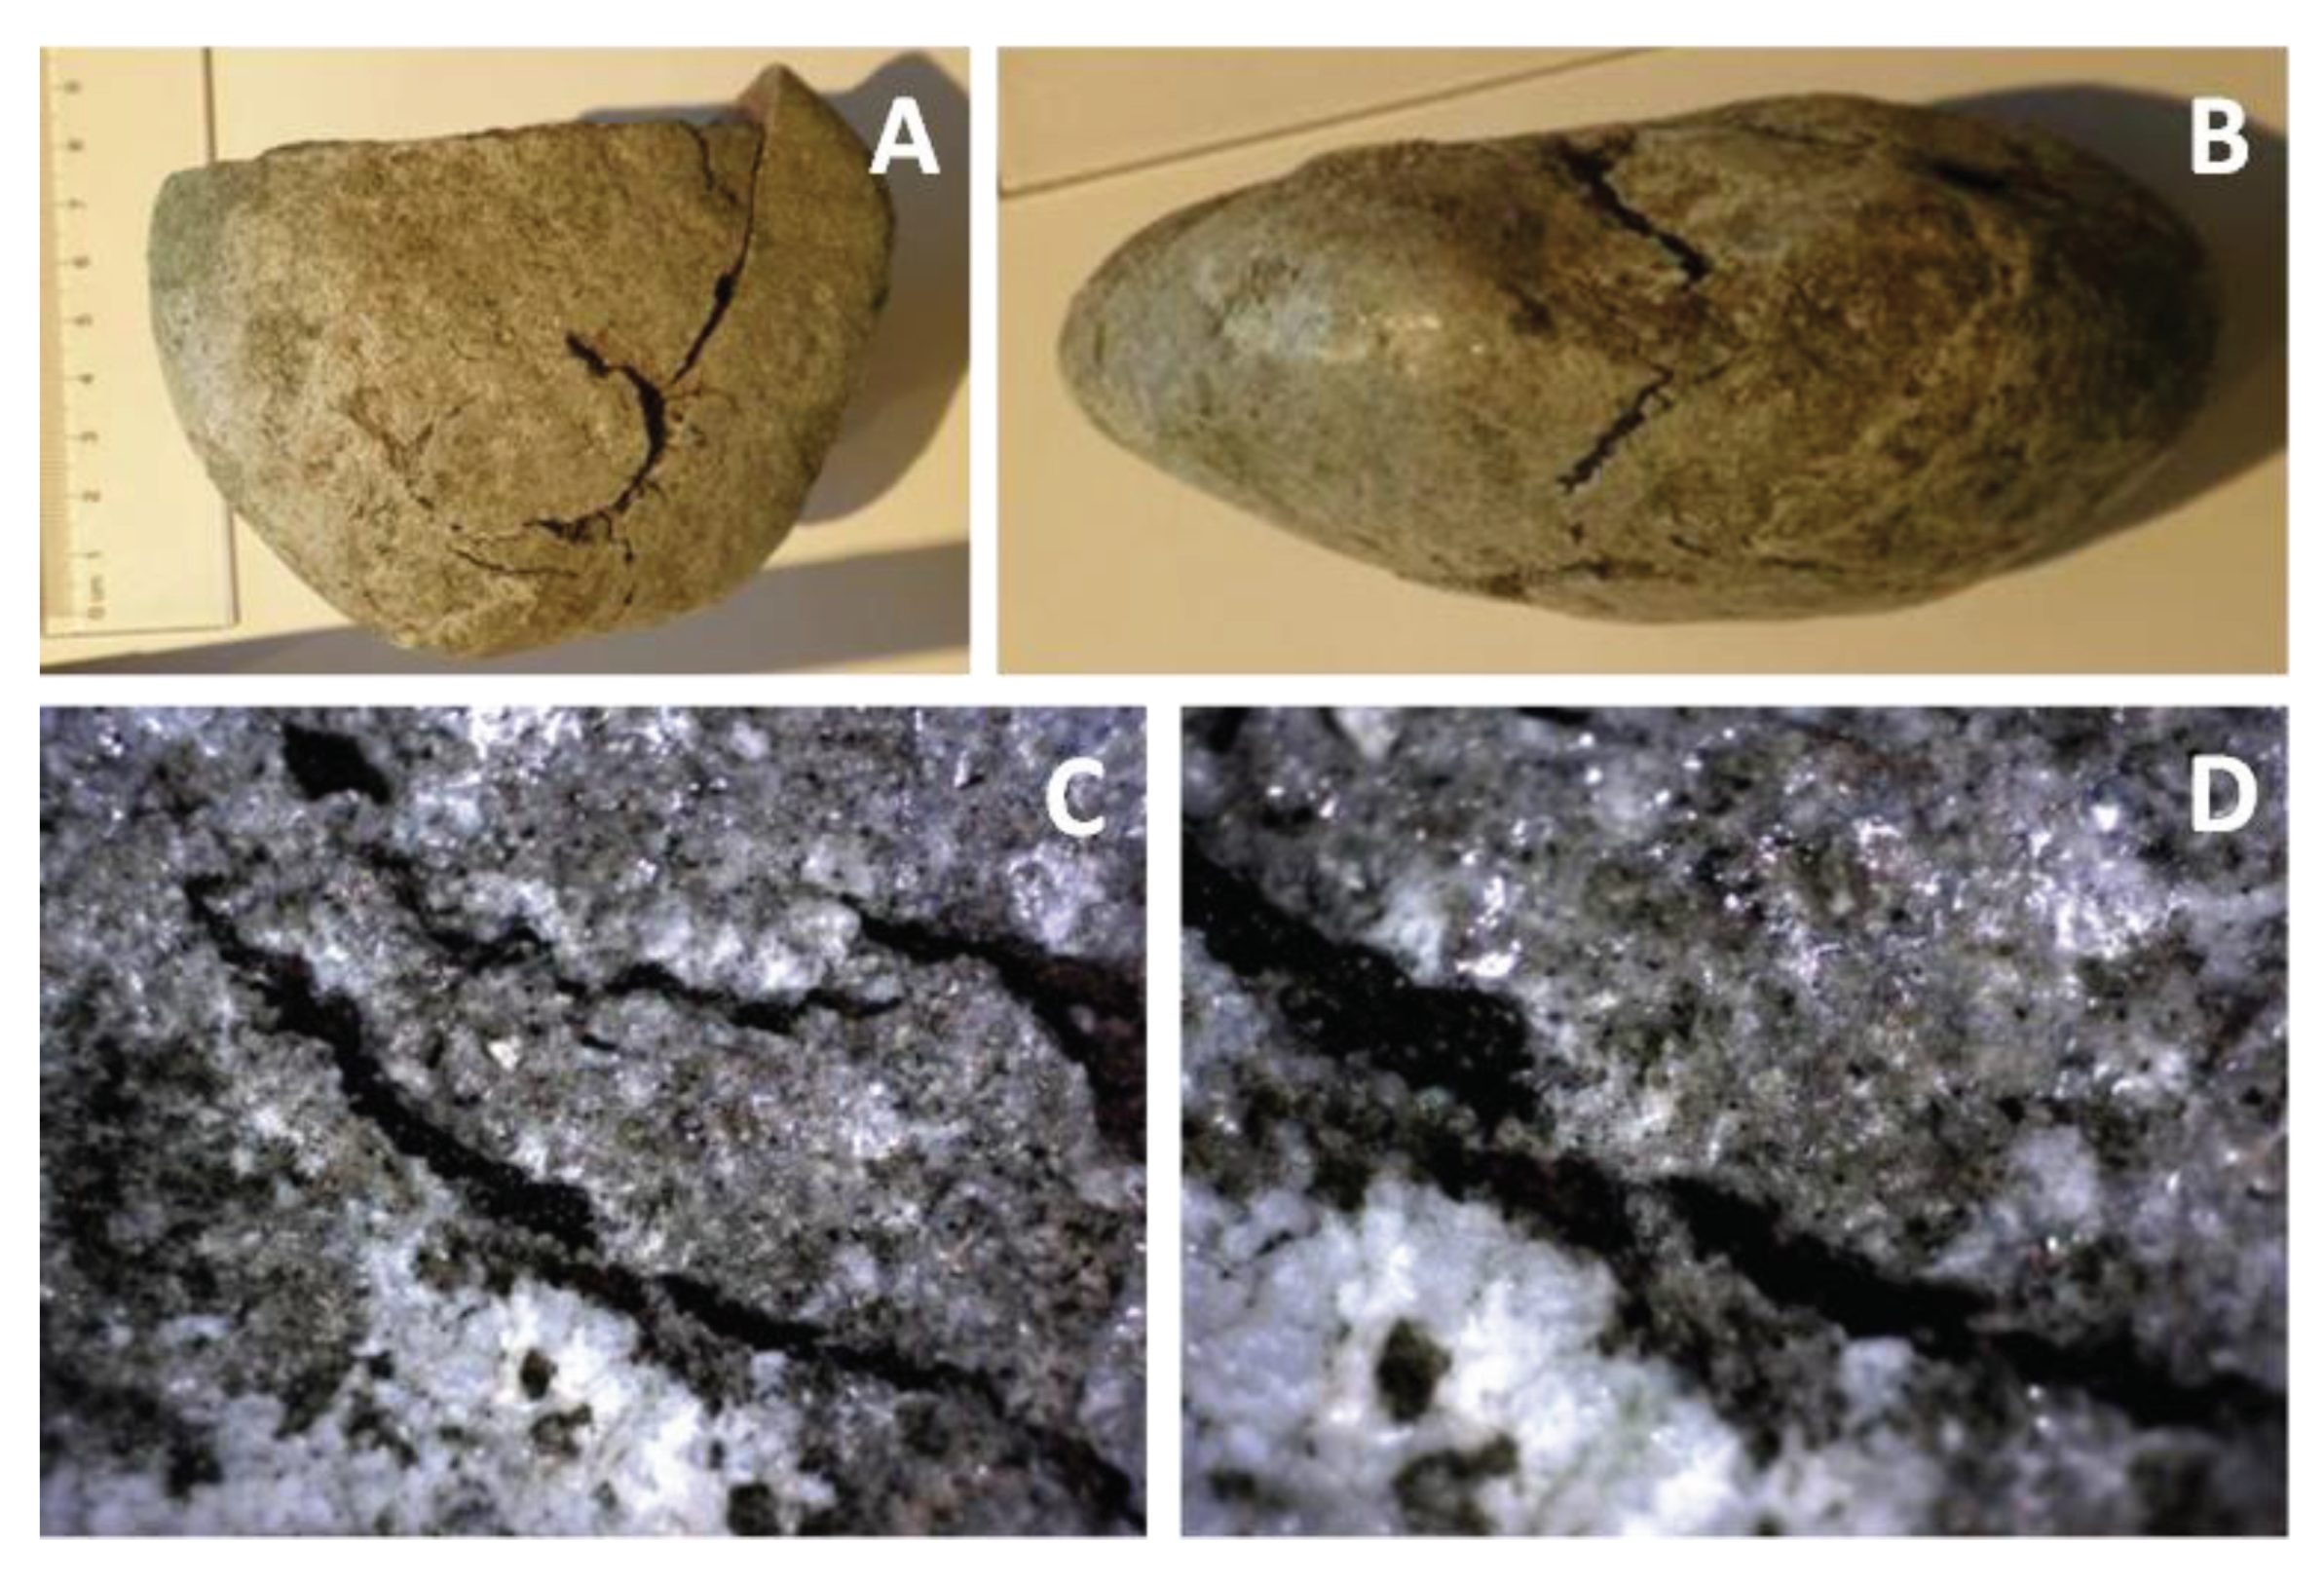
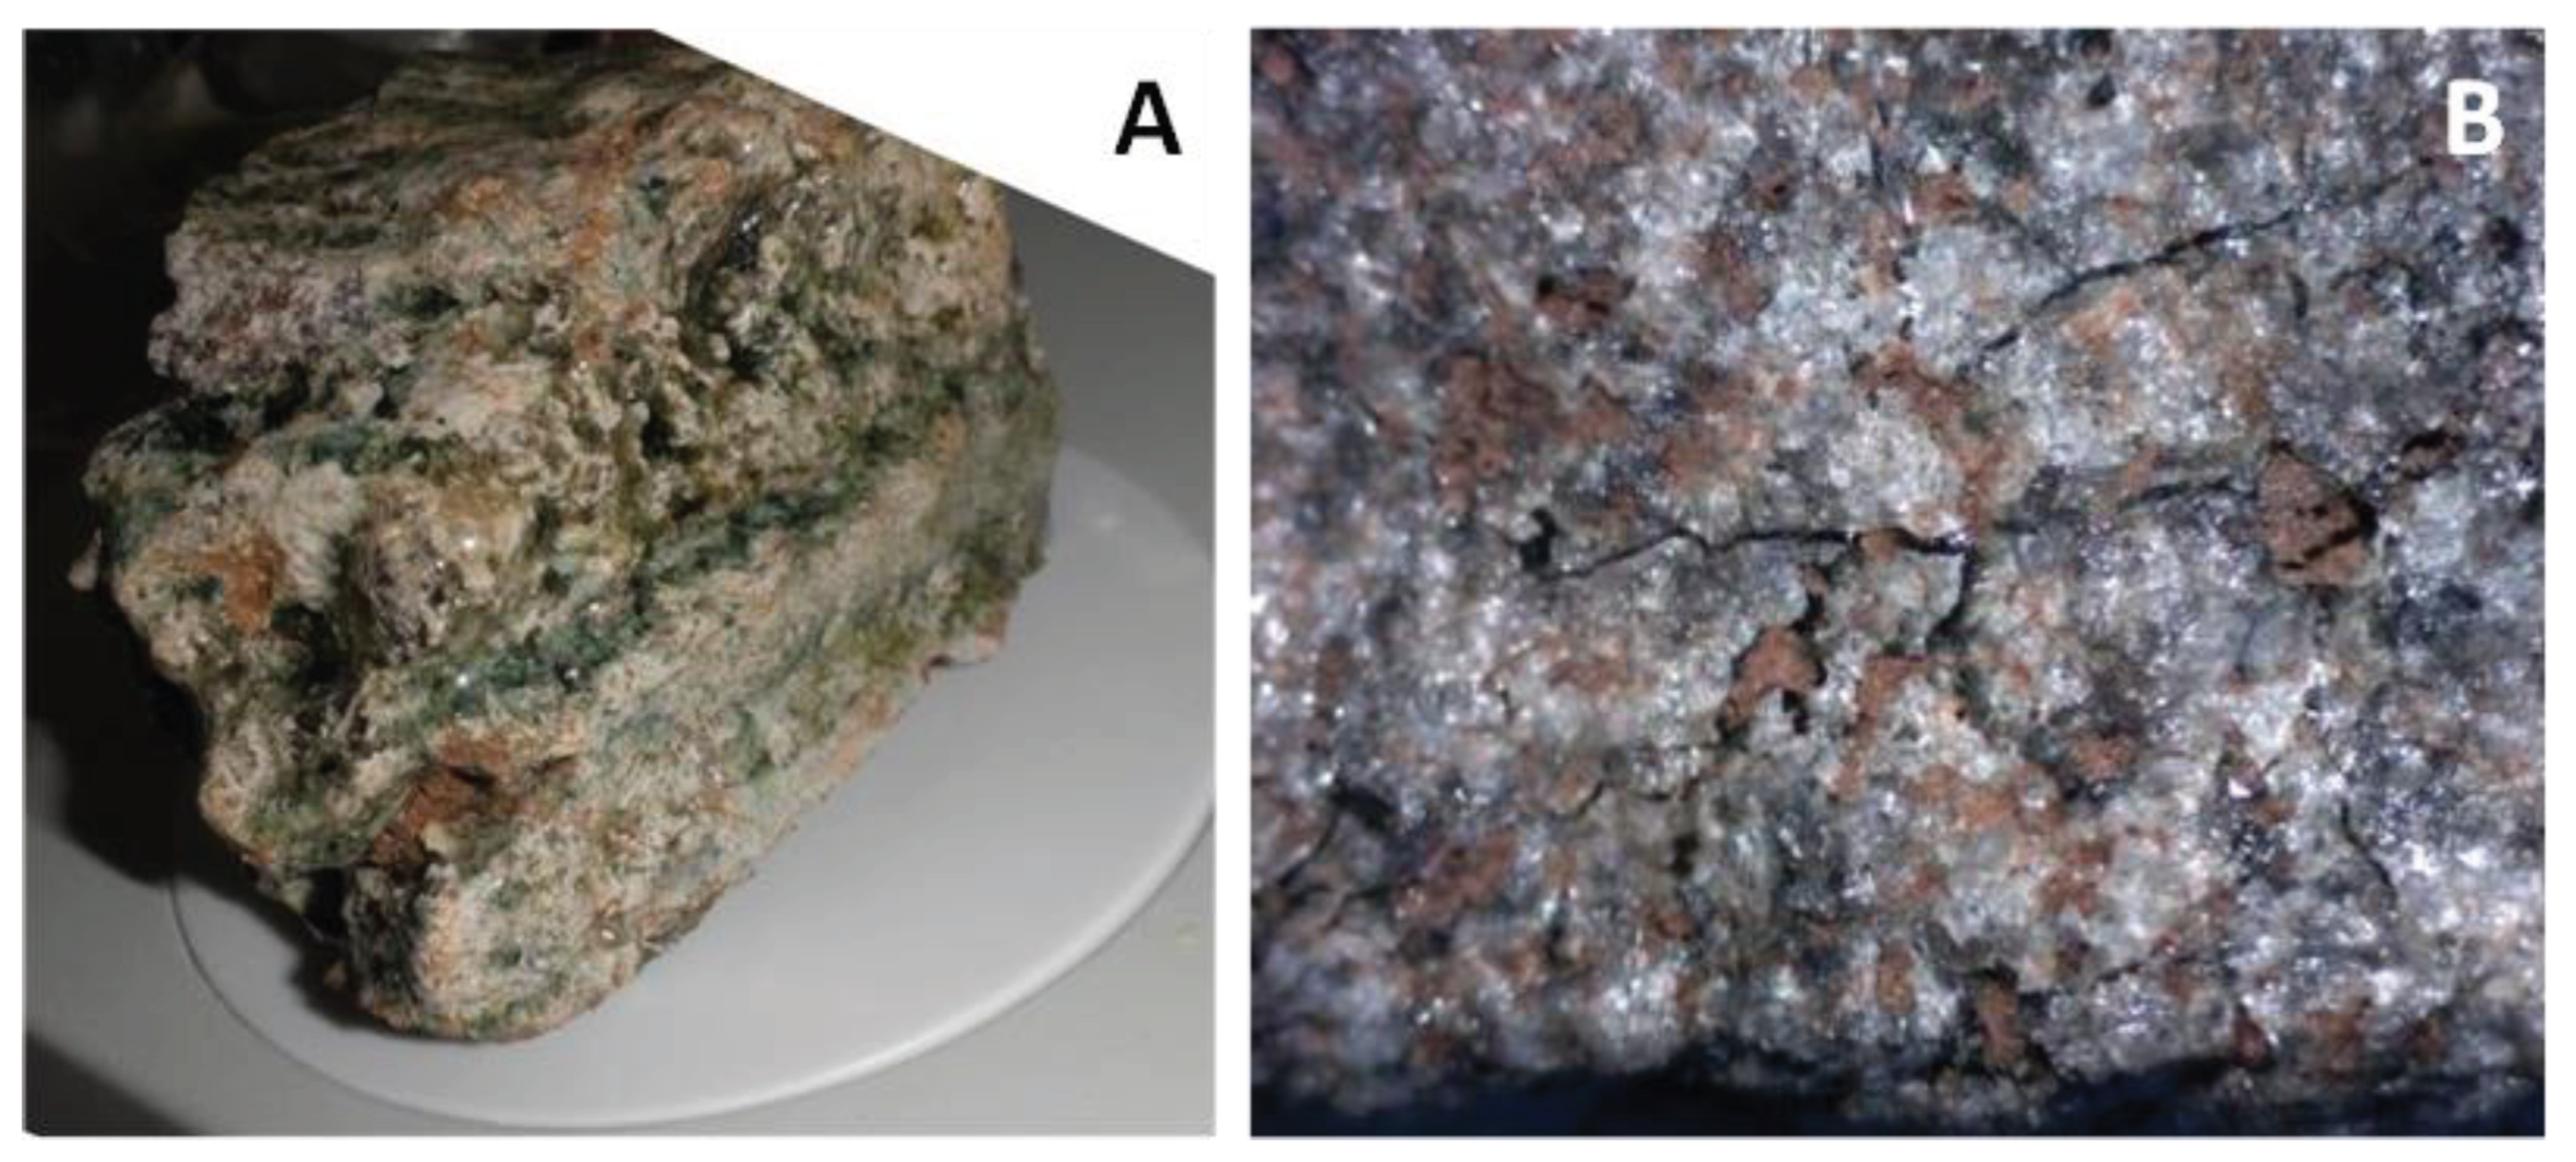
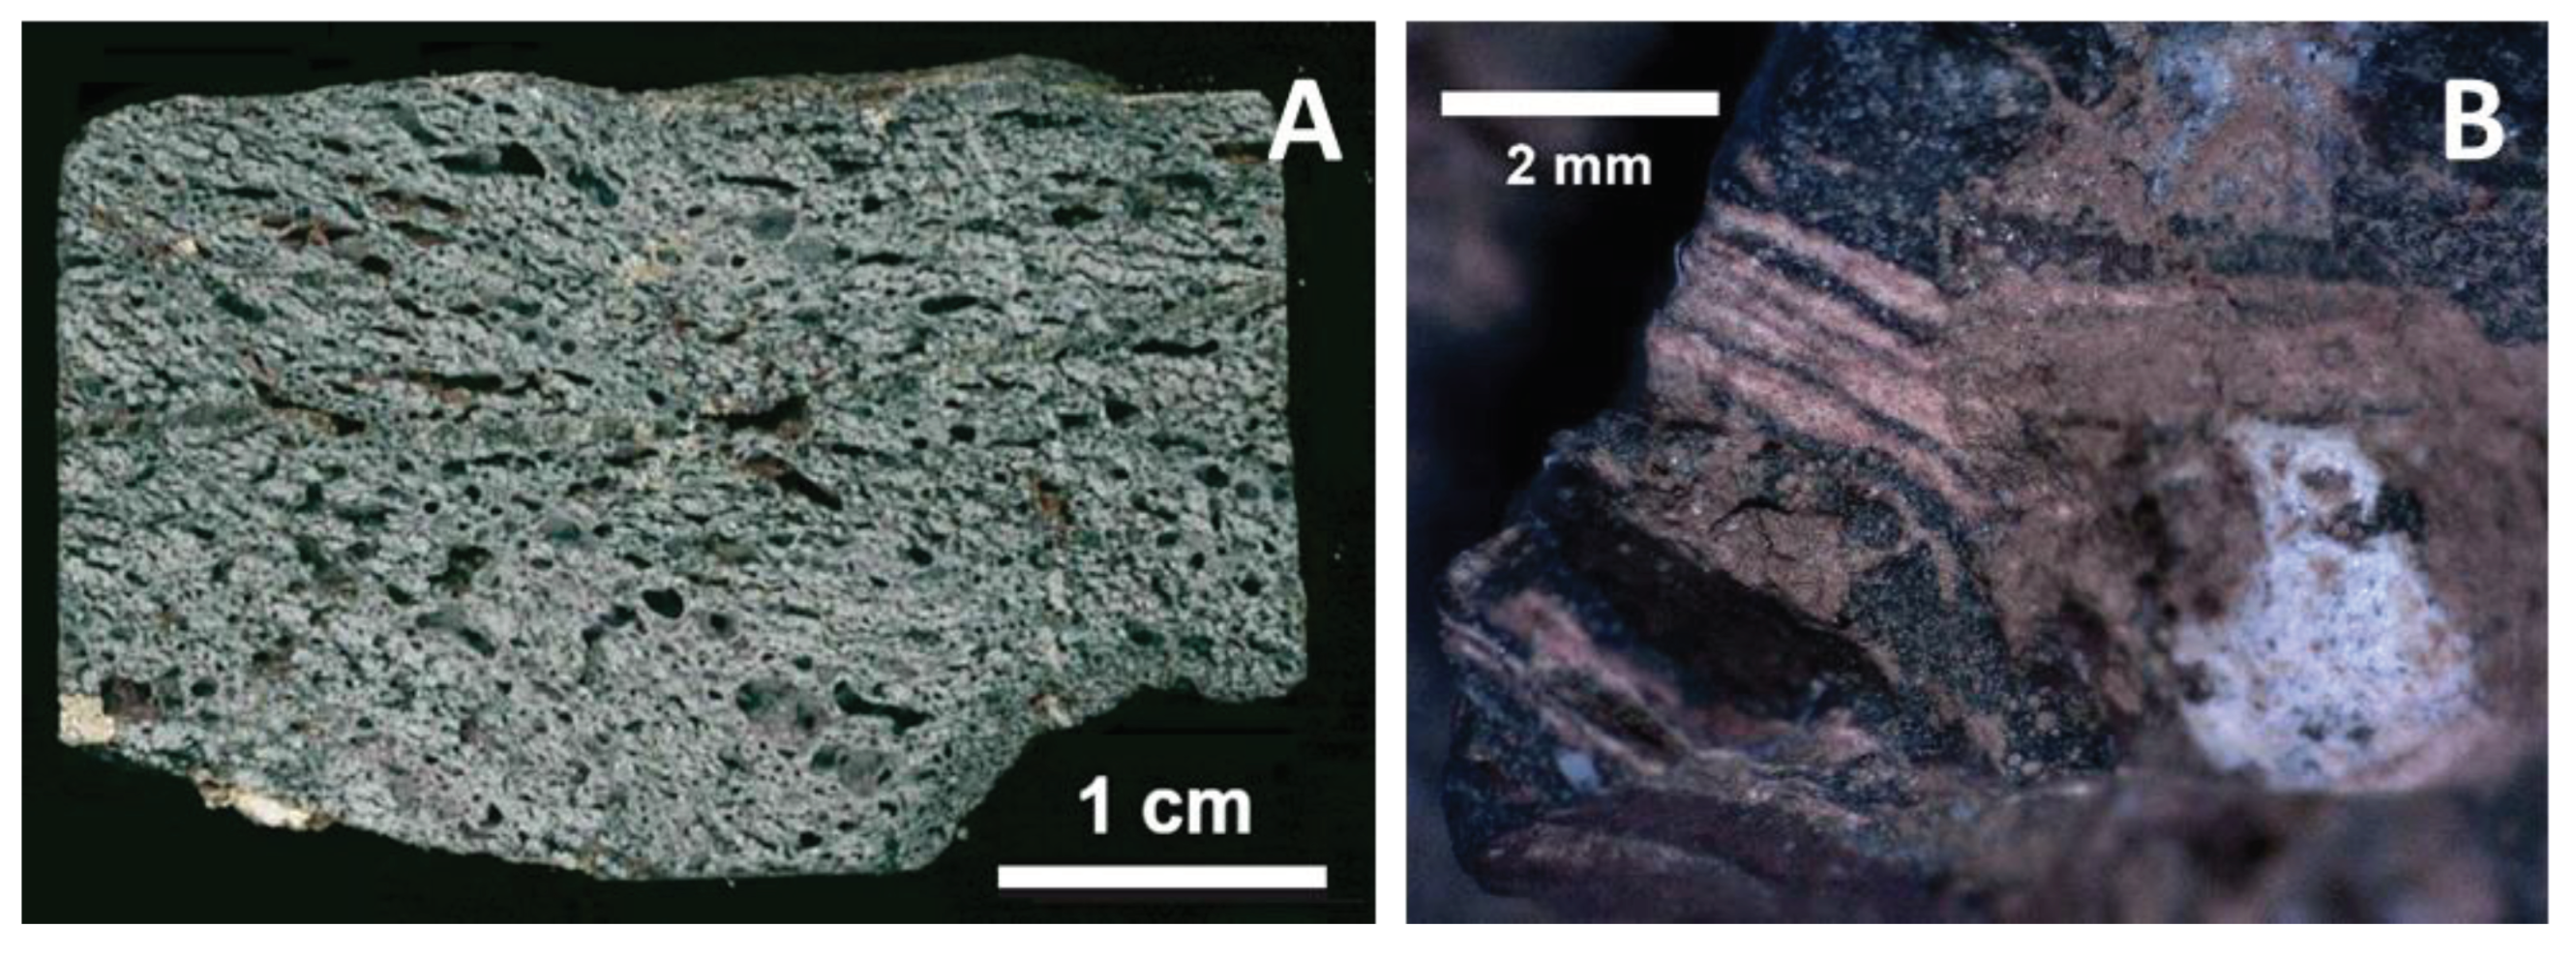
- Deposition of hot material which solidified to glass (usually thin and transparent), or reacted with carbonate to form expanded “pumice”, on the surface of pebbles (usually not on the whole surface – typically the bottom side was sheltered). The surface glass coatings may have started to form by thermal wave shortly before the impact.
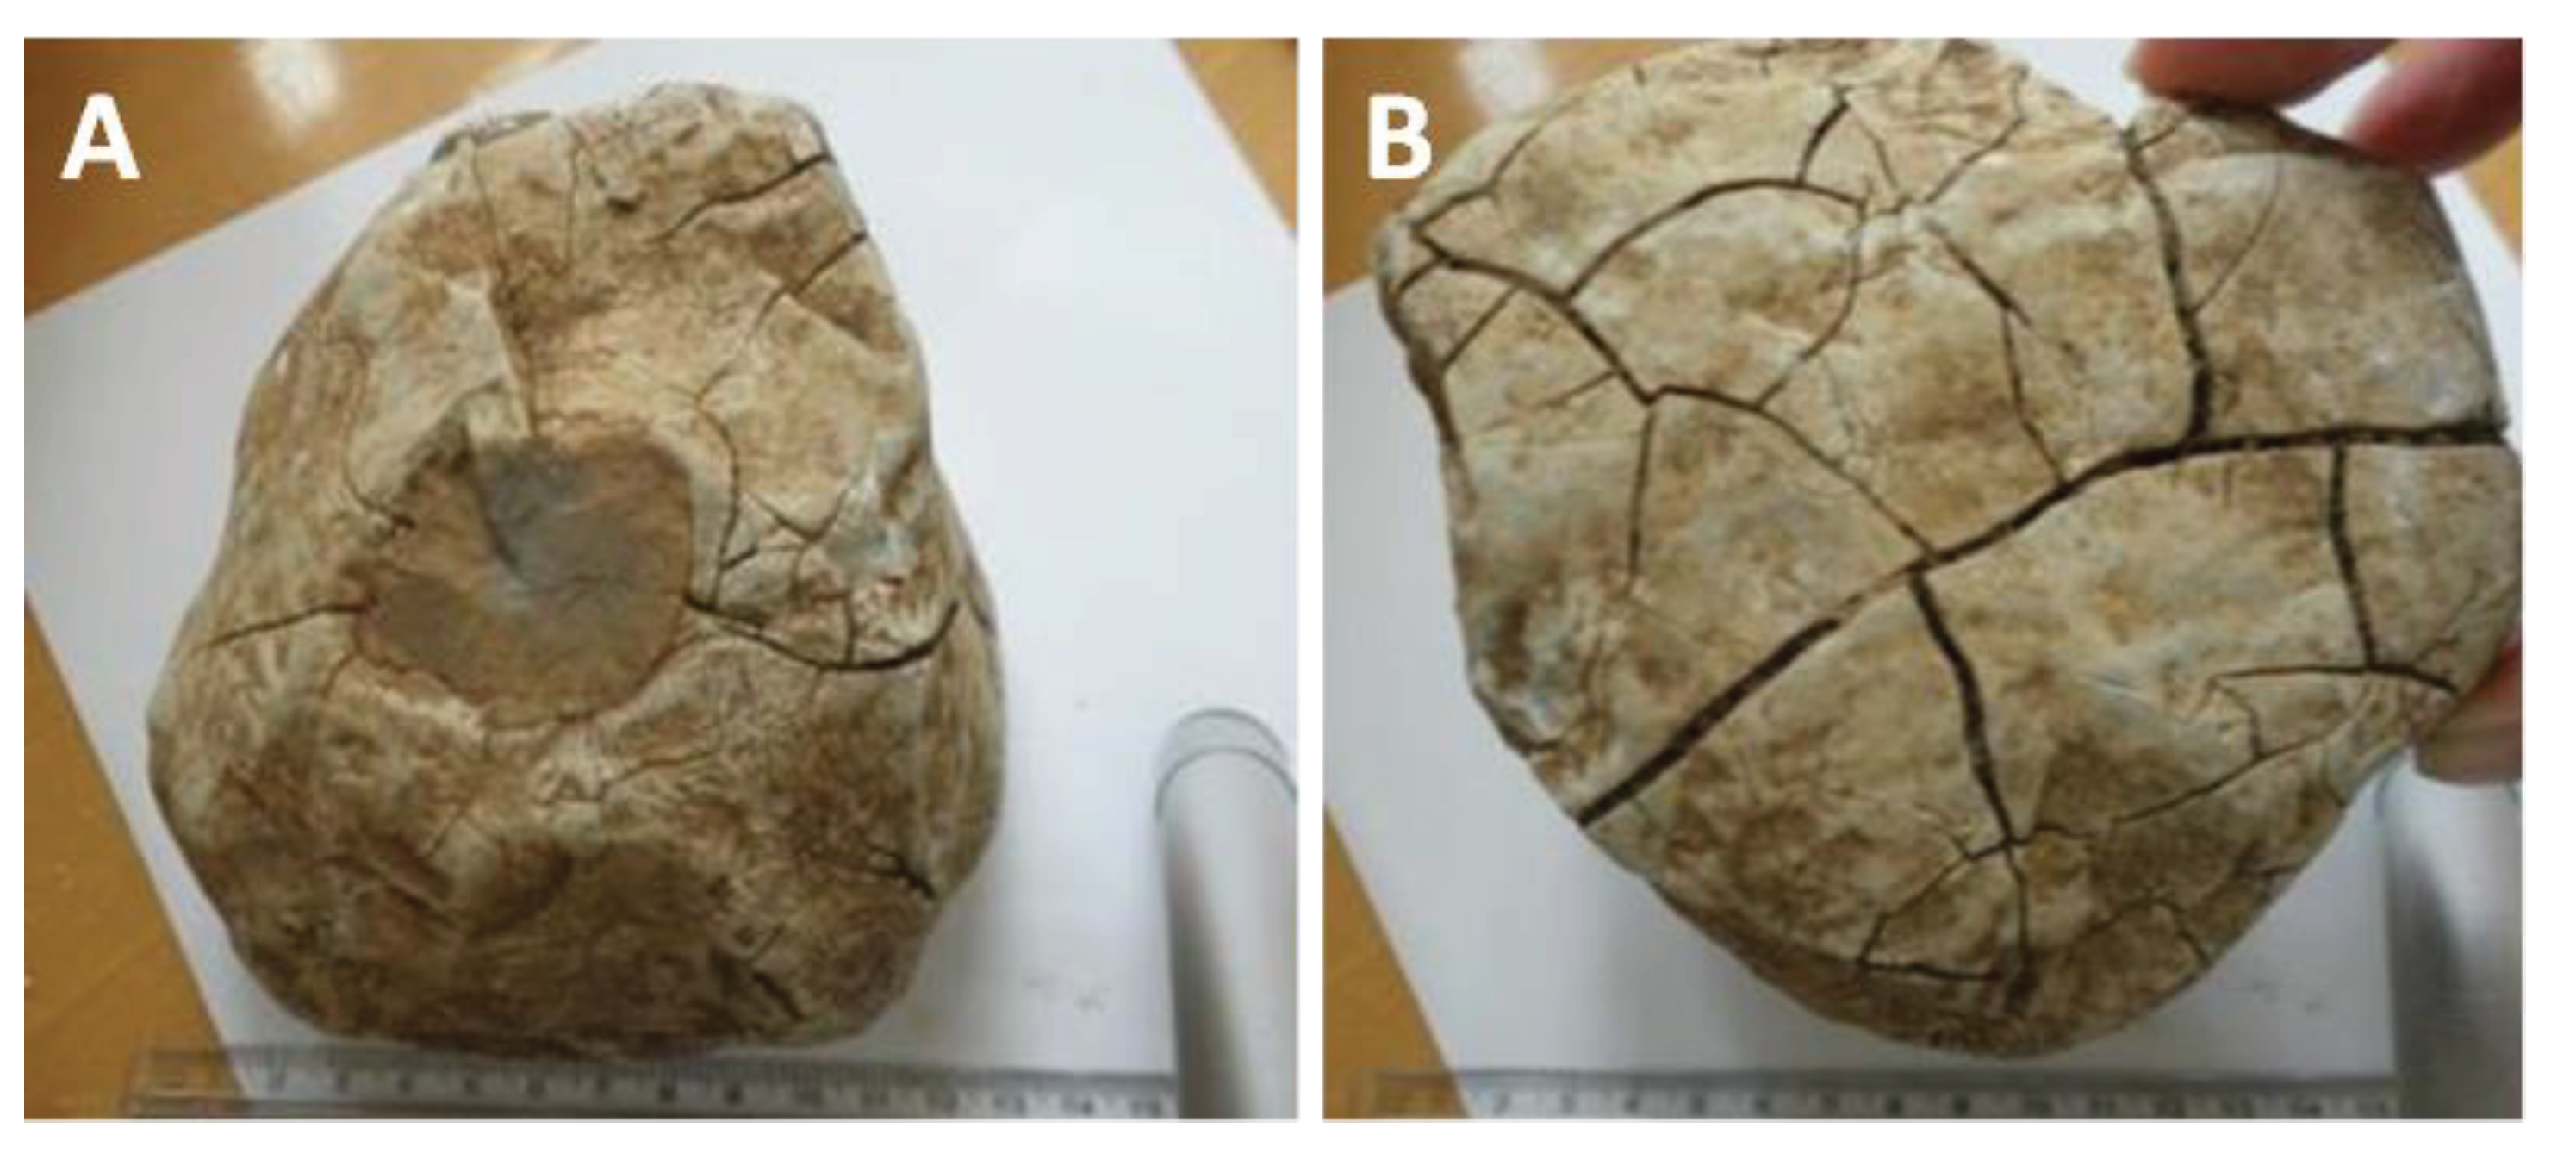
- Ductile deformation of variable intensity (with limited fragile deformation but intense fracturing of mineral grains), using older as well as newly formed discontinuities; in some cases this deformation had to be associated with extreme strain, excluding explanation by any realistically possible human activity. The ductile character of the deformation points to a high temperature, which however did not always cause melting.
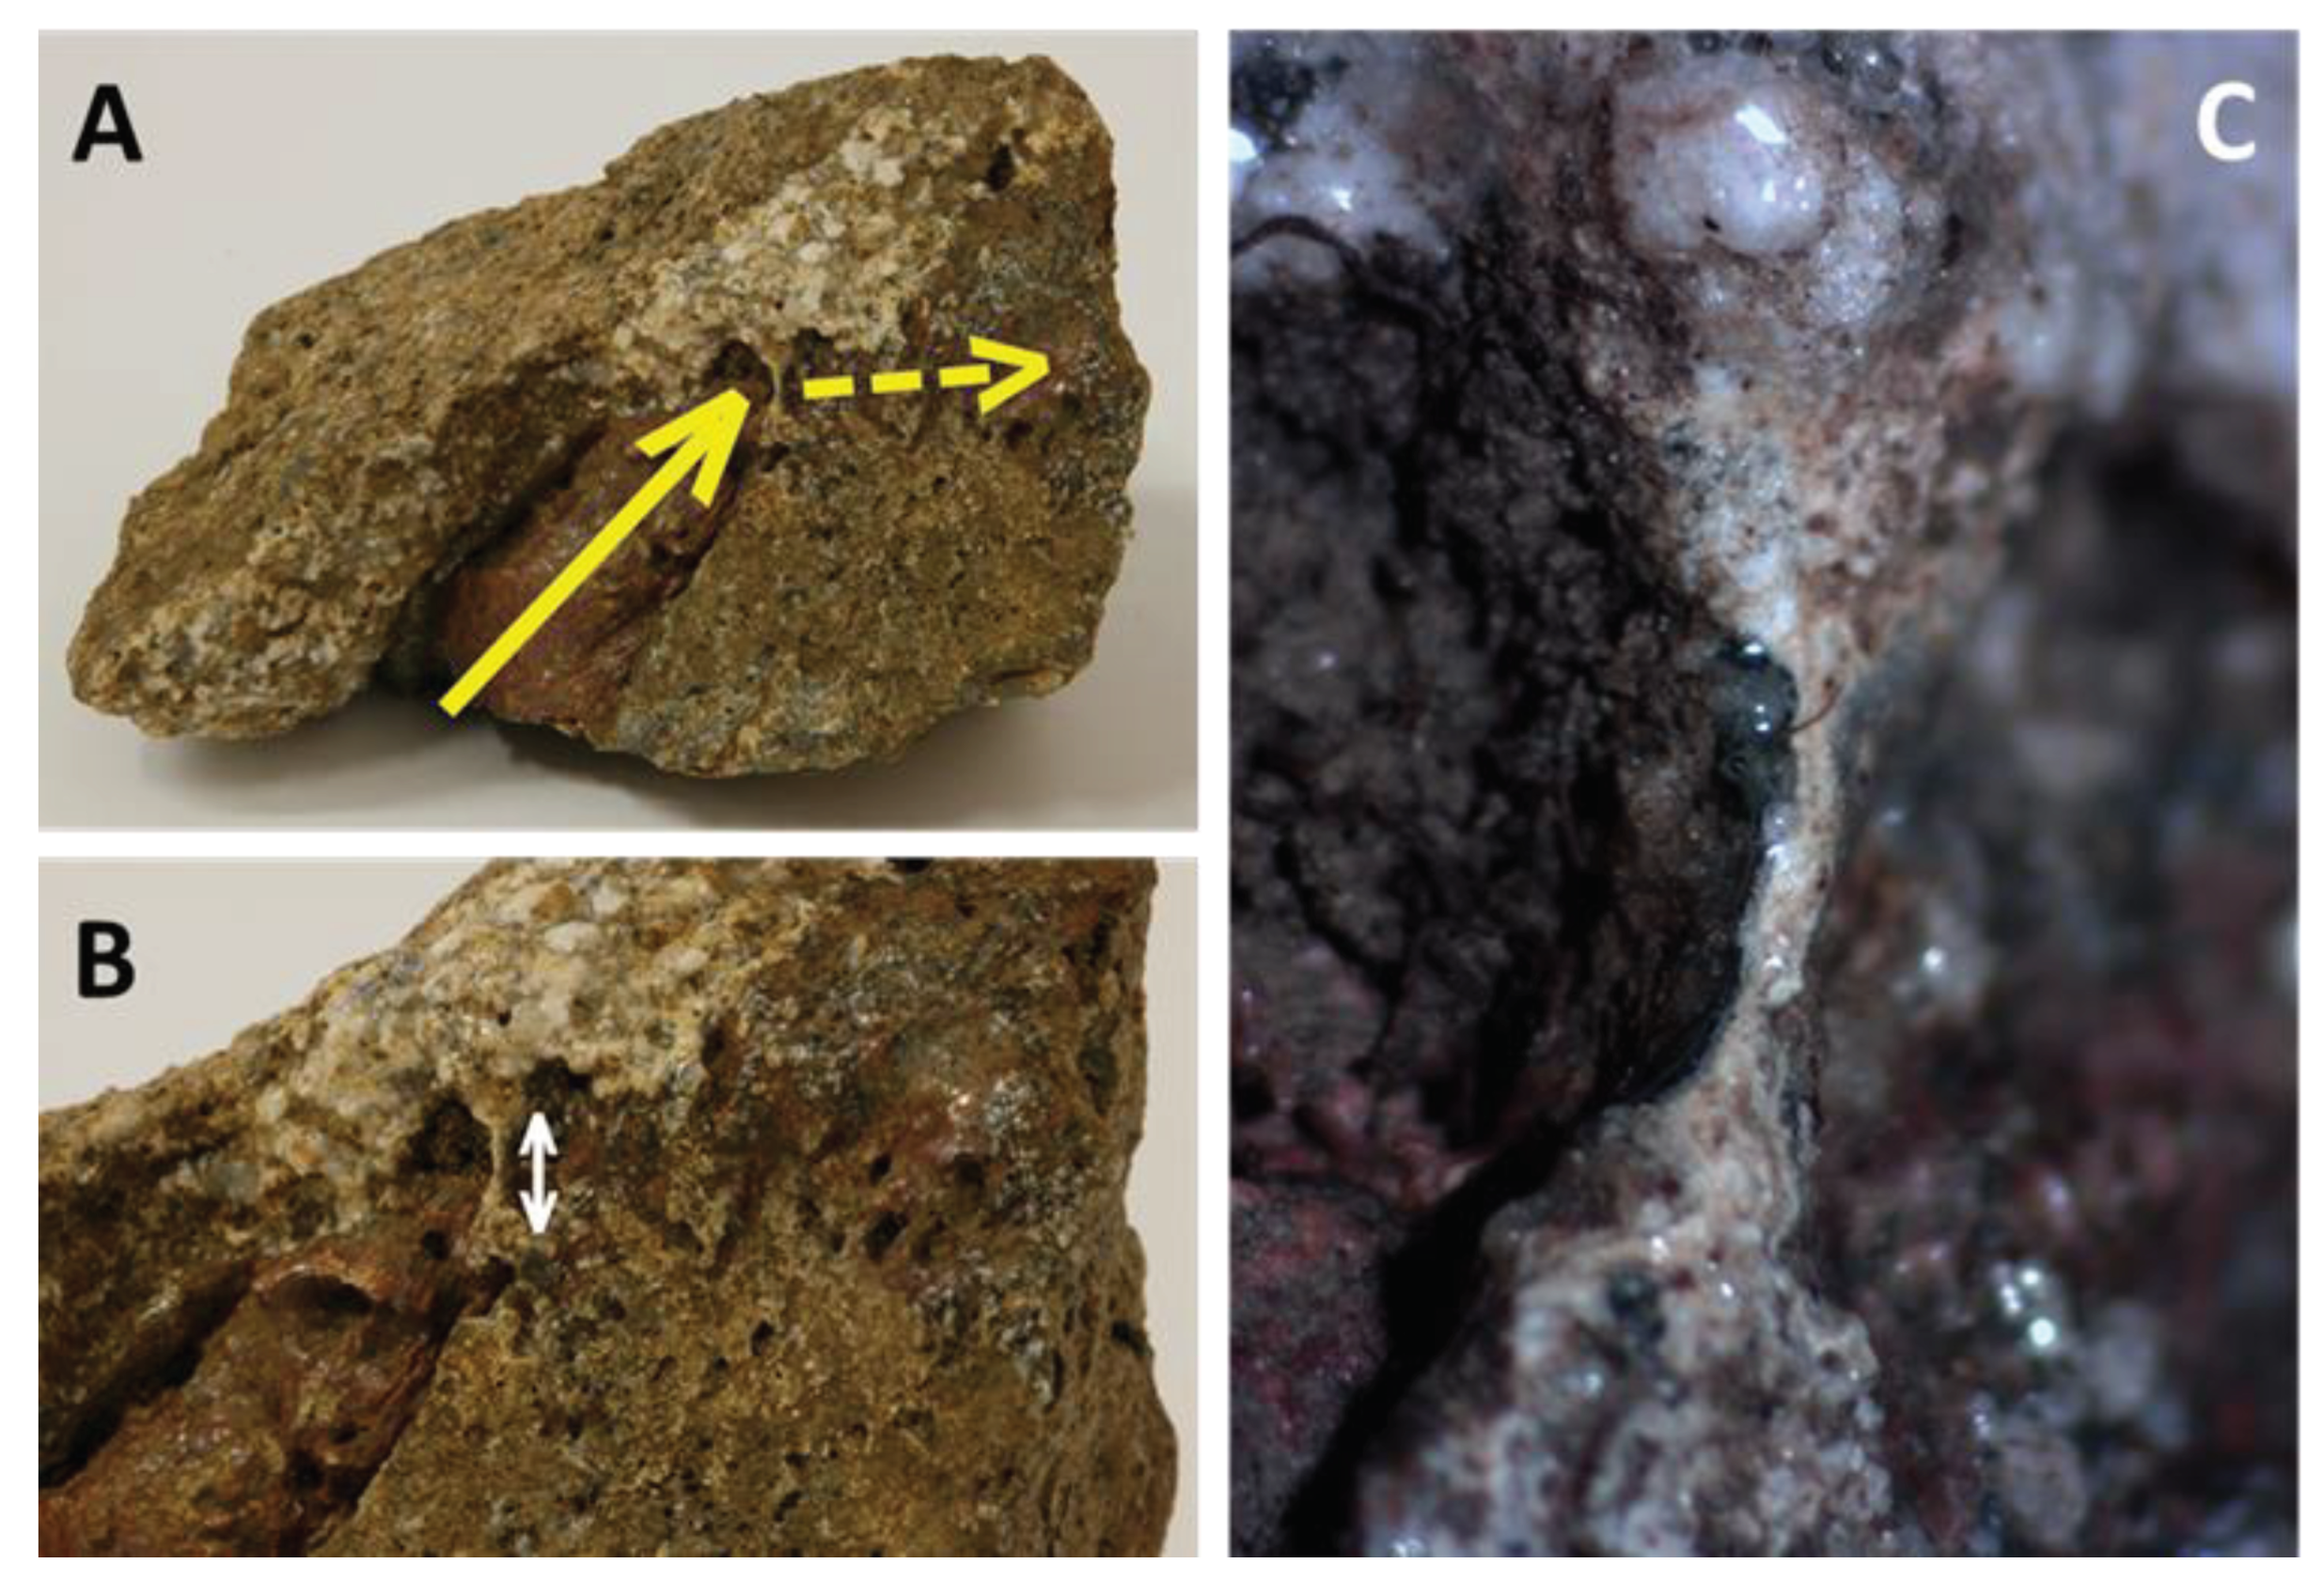
- Solidification of melts formed inside the pebbles or from secondary projectiles. These melts, despite being far from equilibrium, were also able to fill even thin fractures in individual mineral grains (perhaps owing to underpressure during rebound of the compressed rock); expansion of gases also lead to extrusions and formation of miniature “cinder cones” on the surface of some pebbles. The role of under-pressure in melt evaporation is also possible.
Supplementary Materials
Author Contributions
Funding
Data Availability Statement
Acknowledgments
Conflicts of Interest
References
- Kos, P. Research of High Middle Ages lime kilns in the south part of the Moravian Karst in consideration of Mokrá Village region. Archeol. Tech. 2005, 26, 27–68. In Czech, available online: http://archeologiatechnica.cz/sites/default/files/2018-04/Kos%2027_68.pdf (accessed on 17 October 2023).
- Herrmann, H. Kalkbrandstellen in der Eiszerfallandschaft südlich und westlich von Seeshaupt. Bernried am Starnberger See, Germany, 2021.
- BayernAtlas. Landesamt für Digitalisierung, Breitband und Vermessung, München. Available online: https://atlas.bayern.de (accessed on 17 October 2023).
- Geologische Karte von Bayern 1:500.000, 4. Auflage. Bayerisches Geologisches Landesamt, München, Germany, 1996.
- Válek, J.; van Halem, E.; Viani, A.; Pérez-Estébanez, M.; Ševčík, R.; Šašek, P. Determination of optimal burning temperature ranges for production of natural hydraulic limes. Constr. Build. Mater. 2014, 66, 771–780. [CrossRef]
- Rappenglück, M.A.; Ernstson, K.; Mayer, W.; Beer, R.; Benske, G.; Siegl, C., Sporn, R.; Bliemetsrieder, T.; Schüssler, U. The Chiemgau impact event in the Celtic Period: evidence of a crater strewnfield and a cometary impactor containing presolar matter. Available online: https://www.chiemgau-impakt.de/pdfs/Chiemgau_impact.pdf (accessed on 17 October 2023).
- Fehr, K.T.; Pohl, J.; Mayer, W.; Hochleitner, R.; Faßbinder, J.; Geiß, E.; Kerscher, Y. A meteorite impact crater field in eastern Bavaria? A preliminary report. Meteorit. Planet. Sci. 2005, 40, 187–194. [CrossRef]
- Ernstsson, K.; Mayer, W.; Neumair, A.; Rappenglück, B.; Rappenglück, M.A.; Sudhaus, D.; Zeller, K.W. The Chiemgau crater strewn field: evidence of a Holocene large impact event in southeast Bavaria, Germany. J. Sib. Fed. Univ. - Eng. Technol. 2010, 1, 72–103. Available online: https://core.ac.uk/download/pdf/38633216.pdf (accessed on 17 October 2023).
- Osinski, G.R.; et al. Impact Earth: A review of the terrestrial impact record. Earth Sci. Rev. 2022, 232, 104112. [CrossRef]
- Rösler, W.; Patzelt, A.; Hoffmann, V.; Raeymaekers, B. Characterization of a small crater-like structure in S.E. Bavaria, Germany. In Proceedings of the First International Conference on Impact Cratering in the Solar System, Noordwijk, Netherlands, 8-12 May 2006. Available online: https://sci.esa.int/documents/33321/35974/1567255423911-ESLAB40-Proc_295499-Roesler.pdf (accessed on 18 October 2023).
- Procházka, V.; Martinec, P.; Štorc, R.; Kalenda, P.; Thinová, L.; Tengler, R.; Mizera, J. Holocene impact crater at Emmerting (Bavaria): mineralogy of the filling including meteorite and a possible explanation of the compact body below the crater bottom. In Proceedings of the 27th Quaternary Seminary Meeting, Brno, Czech Republic, 2 December 2022. In Czech, available online: https://www.researchgate.net/publication/368358601 (accessed on 18 October 2023).
- Procházka, V. Melt behavior in two impact craters at Emmerting, Germany: Deformation, expansion, injections, and the role of underpressure and mutual collisions of pebbles. In Proceedings of the 54th Lunar and Planetary Science Conference, The Woodlands, TX, USA, 13–17 March 2023. Available online: https://www.hou.usra.edu/meetings/lpsc2023/pdf/2102.pdf (accessed on 18 October 2023).
- Procházka, V.; Kalenda, P.; Martinec, P.; Mizera, J.; Thinová, L.; Trojek, T.; Kletetschka, G.; Štorc, R.; Adámek, J.; Švanda, P. Meteoritic matter and spherules in a presumed impact crater at Emmerting, Germany. Minerals 2024 (to be submitted).
- Van Husen, D. Die Ostalpen in den Eiszeiten; Geologische Bundesanstalt: Vienna, Austria: pp. 1–24. Available online: https://opac.geologie.ac.at/ais312/dokumente/Husen_1987_Eiszeiten_1.pdf (accessed on 18 October 2023).
- Cicconi, M.R.; McCloy, J.S.; Neuville, D.R. Non-Magmatic glasses. Rev. Mineral. 2022, 87, 965–1014. [CrossRef]
- Kalenda, P.; Thinová, L.; Tengler, R.; Procházka, V.; Mizera, J.; Martinec, P.; Kletetschka, G.; Trojek, T. Two impact craters at Emmerting, Germany: Field documentation and geophysics. Geodynamics 2024 (in press).
- Neumair, A.; Waitzinger, M.; Finger F. Interesting glass coatings on cobbles and rock fragments from the Alpine foreland, SE-Bavaria, Germany, and their possible origin. In Proceedings of GeoTirol2016 - Annual Meeting of DGGV (German Geological Society) and PANGEO Austria, 25-28. September 2016, Innsbruck, Austria, 25–28 September 2016. Available online: https://www.researchgate.net/publication/308674645 (accessed on 18 October 2023).
- Rappenglück, B.; Hiltl, M.; Poßekel, J.; Rappenglück, M.A.; Ernstson, K. People experienced the prehistoric Chiemgau Meteorite Impact – Geoarchaeological evidence from Southeastern Germany: a Review. Mediterr. Archaeol. Archaeom. 2023, 23, 209–234. [CrossRef]
- Ernstson, K. The Digital Terrain Model (DTM) and the evaluation of known and the search for new craters in the Chiemgau meteorite impact strewn field. Chiemgau Impact Research Team, 2017. Available online: https://www.chiemgau-impakt.de/wp-content/uploads/2017/01/DGM-1-final-1.pdf (accessed on 18 October 2023).
- Doppler, G.; Geiss, E. Der Tüttensee im Chiemgau - Toteiskessel statt Impaktkrater. Bayerisches Landesamt für Umwelt, 2005. Available online: https://www.lfu.bayern.de/geologie/meteorite/bayern/doc/tuettensee.pdf (accessed on 18 October 2023).
- Huber, R.; Darga, R.; Lauterbach, H. Der späteiszeitliche Tüttensee-Komplex als Ergebnis der Abschmelzgeschichte am Ostrand des Chiemsee-Gletschers und sein Bezug zum “ Chiemgau Impakt ” (Landkreis Traunstein, Oberbayern). E&G Quaternary Sci. J. 2020, 69, 93–120. [CrossRef]
- Rösch, M.; Friedmann, A.; Rieckhoff, S.; Stojakowits, P.; Sudhaus, D. A Late Würmian and Holocene pollen profile from Tüttensee, Upper Bavaria, as evidence of 15 Millennia of landscape history in the Chiemsee glacier region. Acta Palaeobot. 2021, 61, 136–147. [CrossRef]
- Schüssler, U. Chiemgau-Impakt: Petrographie und Geochemie von Geröllen mit Deformationsmerkmalen und starker thermischer Beanspruchung aus dem nördlichen Bereich des Impakt-Areals. Chiemgau Impact Research Team, 2005. Available online: http://www.chiemgau-impact.com/wp-content/uploads/2011/08/Petrographie-und-Geochemie.pdf (accessed on 18 October 2023).
- Neumair, A.; Ernstson, K. Geomagnetic and morphological signature of small crateriform structures in the Alpine Foreland, Southeast Germany. In Proceedings of the American Geophysical Union Fall Meeting 2011, 5–12 December 2011, San Francisco, CA, USA. Available online: https://www.academia.edu/2643037 (accessed on 18 October 2023).
- Bartuška, M. Vady skla (Glass defects); Práh: Prague, Czech Republic; 606 pp.
- Knobloch, V.; Knoblochová, Z.; Kučera, J.; Tláskal, J.; Urbanec, Z. Lechatelierite inclusions in moldavites and lechatelierite fragments in host sediments. In Proceedings of the 2nd International Conference on Natural Glasses, Prague, Czech Republic, 21–23 September 1987.
- French, B.M. Traces of catastrophe. A Handbook of Shock-Metamorphic Effects in Terrestrial Meteorite Impact Structures. LPI Contribution 954; Lunar and Planetary Institute: Houston, TX, USA, 1998; 120 pp. Available online: https://ntrs.nasa.gov/citations/19990071201.
- Procházka, V.; Trojek, T. XRF- and EMP- investigation of glass coatings and melted domains of pebbles from craters in Chiemgau, Germany. In Proceedings of the 48th Lunar and Planetary Science Conference, The Woodlands, TX, USA, 20–24 March 2017. Available online: https://www.hou.usra.edu/meetings/lpsc2017/pdf/2401.pdf (accessed on 18 October 2023).
- Schairer, J.F.; Bowen N.L. The system K2O-A12O3-SiO2. Am. J. Sci. 1955, 253, 681–746.
- Dressler, B.O.; Reimold, W.U. Terrestrial impact melt rocks and glasses. Earth Sci. Rev. 2001, 56, 205–284. [CrossRef]
- Kiefer, S.W. Shock metamorphism of the Coconino Sandstone at Meteor Crater, Arizona. J. Geophys. Res. 1971, 76, 5449–5473. [CrossRef]
- Acevedo, R.D.; et al. The Bajada del Diablo astrobleme-strewn field, central Patagonia, Argentina: Extending the exploration to surrounding areas. Geomorphology 2012, 169–170, 151–164. [CrossRef]
- Anfinogenov, J.; Budaeva, L.; Kuznetsov, D.; Anfinogenova, Y. John’s Stone: A possible fragment of the 1908 Tunguska meteorite. Icarus 2014, 243, 139–147. [CrossRef]
- Haack, H.; Greenwood, R.C.; Busemann, H. Comment on “John's stone: A possible fragment of the 1908 Tunguska meteorite” (Anfinogenov et al., 2014, Icarus 243, 139–147). Icarus 2016, 265, 238–240. [CrossRef]
- Housen, K.R.; Sweet, W.J.; Holsapple, K.A. Impacts into porous asteroids. Icarus 2018, 300, 72–96. [CrossRef]
- Harris, R.S.; Schultz, P.H.; Tancredi, G.; Ishitsuka, J. Preliminary petrologic analysis of impact deformation in the Carancas (Peru) cratering event. In Proceedings of the 39th Lunar and Planetary Science Conference. League City, TX, USA, 10–14 March 2008. Available online: https://www.lpi.usra.edu/meetings/lpsc2008/pdf/2446.pdf (accessed on 17 March 2024).
- Kowitz, A.; Güldemeister, N.; Reimold, W.U.; Schmitt, R.T.; Wünnemann, K. Diaplectic quartz glass and SiO2 melt experimentally generated at only 5 GPa shock pressure in porous sandstone: laboratory observations and meso-scale numerical modeling. Earth Planet. Sci. Lett. 2013, 384, 17–26. [CrossRef]
- Freude, F. Strukturgeologisch-petrographische Untersuchungen an Karbonatgeröllen einer Schotterterrasse im Chiemgau und Diskussion der Ergebnisse im Rahmen der Impakt-Streufeld-Hypothese. Master Thesis, Friedrich-Alexander-Universität, Erlangen-Nürnberg, Germany, 2007.
- Neuman, M.; Holzheid, A.; Lodders, K.; Fegley, B.; Jolliff, B.; Koefoed, P.; Chen, H.; Wang, K. High temperature evaporation and isotopic fractionation of K and Cu. Geochim. Cosmochim. Ac. 2021, 316, 1–20. [CrossRef]
- Dauphas, N.; Nie, N.X.; Blanchard, M.; Zhang, Z.J.; Zeng, H.; Hu, J.Y.; Meheut, M.; Visscher, C.; Canup, R.; Hopp, T. The extent, nature, and origin of K and Rb depletions and isotopic fractionations in Earth, the Moon, and other planetary bodies. Planet. Sci. J. 2022, 3, 29. [CrossRef]
- Feldman, V.I. Petrology of Impactites (in Russian); Moscow University Press: Moscow, Russia, 1990; 297 pp.
- Mizera, J.; Řanda Z. Geochemical indicators of biogenic component in source materials of moldavites. In In the Footsteps of Warren B. Hamilton: New Ideas in Earth Science; Foulger, G.R.; Hamilton, L.C.; Jurdy, D.M.; Stein, C.A.; Howard, K.A.; Stein, S., Eds.; Geological Society of America: Boulder, CO, USA, 2022; GSA Special Paper 553, ch. 26, pp. 335–346. [CrossRef]
- Gregerová, M.; et al. Petroarchaeology of Ceramics in the Historical Past of Moravia and Silesia (in Czech). Masaryk University: Brno, Czech Republic, 2010; 311 pp.
- Gerasimov, M.V.; Dikov, Yu.P.; Yakovlev, O.I. New experimental evidence on cluster-type vaporization of feldspars. Petrology 2016, 24, 49–74. [CrossRef]
- Vassilev, S.V.; Baxter, D.; Andersen, L.K.; Vassileva, C.G. An overview of the chemical composition of biomass: Fuel 2010, 89, 913–933. [CrossRef]
- Sucharová, J.; Suchara, I.; Holá, M.; Maříková, Š.; Reimann, C.; Boyd, R.; Filzmoser, P.; Englmaier, P. Top-/bottom-soil ratios and enrichment factors: What do they really show? Appl. Geochem. 2012, 27, 138–145. [CrossRef]
- Cílová, Z.; Woitsch, J. Potash – a key raw material of glass batch for Bohemian glasses from 14th–17th centuries? J. Archaeol. Sci. 2012, 39, 371–380. [CrossRef]
- Tyler, G. Changes in the concentrations of major, minor and rare-earth elements during leaf senescence and decomposition in a Fagus sylvatica forest. For. Ecol. Manag. 2005, 206, 167–177. [CrossRef]
- Řanda, Z.; Mizera, J.; Frána, J.; Kučera, J. Geochemical characterization of moldavites from a new locality, the Cheb Basin, Czech Republic. Meteorit. Planet. Sci. 2008, 43, 461–477. [CrossRef]
- Misra, M.K.; Ragland, K.W.; Baker, A.J. Wood ash composition as a function of furnace temperature. Biomass Bioenergy 1993, 4, 103–116. [CrossRef]
- Jenkins, B.M.; Bakker, R.R.; Wei, J.B. On the properties of washed straw. Biomass Bioenergy 1996, 10, 177–200. [CrossRef]
- Procházka, V.; Kletetschka, G. Evidence for superparamagnetic nanoparticles in limestones from Chiemgau crater field, SE Germany. In Proceedings of the 47th Lunar and Planetary Science Conference, The Woodlands, TX, USA, 21–25 March 2016. Available online: https://www.hou.usra.edu/meetings/lpsc2016/pdf/2763.pdf (accessed on 20 October 2023).
- Childe, V.G.; Thorneycroft, W. The experimental production of the phenomena distinctive of vitrified forts. Proc. Soc. Antiq. Scot. 1938, 72, 44–55. [CrossRef]
- Friend, C.; Dye, J.; Fowler, M. New field and geochemical evidence from vitrified forts in South Morar and Moidart, NW Scotland: further insight into melting and the process of vitrification. J. Archaeol. Sci. 2007, 34, 1685–1701. [CrossRef]
- Strassburger, M.; Wieser, J. Early and high medieval iron production in the Grubet near Aichach. Acta Rer. Natur. 2014, 16, 33–50. Available online: https://actarerumnaturalium.cz/wp-content/uploads/2019/12/archiv_2014-16__02.pdf (accessed on 20 October 2023).
- Langenscheidt, E.; Stahr, A. Berchtesgadener Land und Chiemgau: Eine Geschichte von Bergen, Tälern und Seen; Spektrum Akademischer Verlag: Heidelberg, Germany, 2011; 200 pp.
- Piatak, N.; Ettler, V. Metallurgical Slags: Environmental Geochemistry and Resource Potential. Royal Society of Chemistry: Cambridge, UK, 2021; 305 pp.
- Bunch, T.E.; et al. A Tunguska sized airburst destroyed Tall el Hammam a Middle Bronze Age city in the Jordan Valley near the Dead Sea. Sci. Rep. 2021, 11, 18632. [CrossRef]




| Location | Object | n | K | eTh | eU | Th/U | 137Cs |
|---|---|---|---|---|---|---|---|
| Eichendorf (Eberfing) | limekiln 6 (Tradfranz 1) | 1 | 0.33 | 1.88 | 2.52 | 0.75 | 4.86 |
| limekiln 22 (Eichendorf) | 1 | 0.55 | 2.75 | 2.53 | 1.09 | 7.80 | |
| Emmerting | Crater No. 4 and surroundings | 90 | 0.60 | 4.75 | 2.17 | 2.19 | 5.18 |
| Crater No. 5 and surroundings | 62 | 0.50 | 2.50 | 1.50 | 1.67 | 5.84 | |
| Niederterasse far from craters | 3 | 0.55 | 4.43 | 2.41 | 1.84 | 5.47 | |
| Kaltenbach (Grabenstätt) | depression | 4 | 0.56 | 4.13 | 2.68 | 1.54 | n.a. |
| surroundings | 6 | 0.74 | 5.57 | 2.90 | 1.93 | n.a. |
| Sample No. | Glass Type | n | SiO2 | TiO2 | Al2O3 | FeOtot | MgO | MnO | CaO | Na2O | K2O |
|---|---|---|---|---|---|---|---|---|---|---|---|
| 123 | feldspar-equivalent | 10 | 65.08 | 19.00 | 1.10 | 5.32 | 8.45 | ||||
| 123 | Fe-enriched | 6 | 65.72 | 15.41 | 6.05 | 0.08 | 0.08 | 4.70 | 6.70 | ||
| 420 | most analyses near surface | 12 | 65.13 | ≤ 0.20 | 14.62 | 3.34* | 0.99 | ≤ 0.20 | 3.25 | 5.86 | 5.62 |
| 421 | dark glass | 4 | 66.82 | 0.36 | 10.12 | 16.86 | 0.25 | 1.28 | 0.17 | 2.97 | 0.06 |
| 421 | relatively bright, interior | 5 | 70.72 | 0.67 | 14.95 | 5.64 | 0.61 | 0.48 | 0.44 | 4.57 | 0.63 |
| 421 | relatively bright, near rim | 11 | 68.76 | 0.60 | 10.31 | 5.09 | 1.25 | 0.58 | 4.45 | 4.46 | 2.23 |
| 15240 | inner surface | 1 | 81.51 | 0 | 4.21 | 1.14 | 2.56 | 0 | 2.05 | 3.46 | 4.23 |
| 15240 | outer surface | 1 | 80.11 | 0 | 5.67 | 1.12 | 1.01 | 0 | 2.51 | 3.78 | 4.91 |
| 16133 | Kfs-pseudomorphs | 11 | 65.34 | 18.18 | < 0.20 | 0.61 | 14.84 | ||||
| 16133 | injections | 6 | 61.34 | ≤ 0.20 | 14.86 | 3.87 | 1.05 | 4.63 | 0.70 | 12.31 |
Disclaimer/Publisher’s Note: The statements, opinions and data contained in all publications are solely those of the individual author(s) and contributor(s) and not of MDPI and/or the editor(s). MDPI and/or the editor(s) disclaim responsibility for any injury to people or property resulting from any ideas, methods, instructions or products referred to in the content. |
© 2024 by the authors. Licensee MDPI, Basel, Switzerland. This article is an open access article distributed under the terms and conditions of the Creative Commons Attribution (CC BY) license (http://creativecommons.org/licenses/by/4.0/).


