1. Introduction
By optimizing the nozzle contour of the rocket engine, maximum thrust is achieved within the limits of the entire engine system. Therefore, different types of nozzles are developed to increase consistent performance, such as: B. thrust optimized (TO), parabolic perfectly truncated (TP) and compressed perfectly truncated (CTP). The first stage rocket engine nozzle was intended to operate in atmospheric conditions ranging from sea level to vacuum environments. To maintain optimal performance throughout the flight, the nozzle is designed for an intermediate NPR (chamber-to-ambient pressure ratio, Pc/Pa), which is between sea level pressure and altitude pressure. Under working conditions, the nozzle flow is overexpanded (Pe < Pa) at low altitude and underexpanded (Pe > Pa) at high altitude, where Pe is the outlet pressure [
1]. During atmospheric flight, the high temperature, high pressure, and high velocity gas flow adapts to the ambient pressure through oblique shock and expansion waves. The flow separation within the nozzle occurs when the boundary layer separates from the wall due to the unfavorable pressure increase of the shock. On the other hand, the wall pressure required for adjusted flow at the start of the fight may be much lower than the surrounding air pressure. This causes flow separation in the nozzle extension. The nozzle structure can be damaged by strong lateral forces resulting from this separation, which is undesirable due to its fluctuating and three-dimensional properties. The so-called side loads are the most well-known type of these dynamic loads. One of the biggest challenges in optimizing main engine nozzles is the phenomenon of flow separation, particularly at sea level. For decades, researchers and engineers have focused on nozzle flow separation to reduce the mechanical and thermal stresses associated with this phenomenon and to gain a better understanding of its physics.
Despite significant efforts by the space industry and research institutions in off-load investigations; To the author's knowledge, analytical prediction is generally still not sufficiently accurate. Research appears to have begun at JPL and Caltech in the late 1940s and focused on impact-induced boundary layer separation within overexpanded rocket nozzles and the function of separation under rocket nozzle side loads[
1,
2]. To determine the circumstances that led to boundary layer separation, this and subsequent studies were conducted in the 1950s, 1960s, and 1970s.
However, during transient operations like start-up and shutdown as well as steady-state operation with separated flow within the nozzle, side loads have been observed in both sub-scale and full-scale rocket nozzles. During the J-2S testing, the first significant report on lateral forces was published [
3].
Since then, many scientists have worked at research institutes such as Volvo Aero Corporation (VAC), DLR, NASA, ONERA, LEA, JAXA, ESA and the FFA. The SNSB and CNES are conducting experiments to study the phenomenon and mechanism. Frey[
4], Ralf[
5] and Östlund[
6] provide a very detailed study of the creation of side loads and their physical causes. This work provides a thorough introduction to the flow physics of shock wave interactions, supersonic flows and nozzles. Both authors paid great attention to exploring the mechanism behind the transition from free shock separation (FSS) to restricted shock separation (RSS), which is the main source of side loads in thrust optimized parabolic nozzles (TOP), which are widely used as: e.g. Raptor or SSME.
Figure 1.
The sketch of the FSS/RSS flow separation pattern.
Figure 1.
The sketch of the FSS/RSS flow separation pattern.
In France, Moreaux[
7], Alziary[
8] and S. B. Verma[
9] conducted a series of subscale cold nozzle tests which showed that the largest side loads occur at low nozzle pressure ratios (NPR). Another interesting experiment was conducted by Land and Tuovila at NASA Langley[
10]. The focus was on the aeroelastic instability of overexpanded nozzles in the upper parts of the atmosphere near vacuum. One of the most realistic studies was by Brown et al.[
11] conducted at NASA's Marshall Space Flight Center as part of the FASTRAC program. This was a series of hot subscale tests using two specially designed nozzles, a rigid thick-walled nozzle for static pressure measurements and a flexible thin-walled nozzle for detecting fluid structure interaction phenomena.
Finally, there is a large amount of data collected from numerous tests carried out by ESA and its partners under the FSCD program [
6]. The most important include the DLR cold and hot tests in Lampoldshausen. JAXA [
12,
13] also conducts numerous subscale tests in the development of the LE-7A nozzle. Hagemann et al.[
14] and Stark et al.[
15] provide a very thorough analysis of the separation patterns in TOP nozzles and provide important insights into the transition between FSS and RSS. Hagemann also highlights the limitations of subscale testing, which is important when extrapolating test results to flight conditions. Torngren [
16] carried out a cold nozzle test with an oscillating external flow at the FOI in Sweden. Reijasse [
17] summarized the work carried out by CNES under the ATAC program. The main problems in these studies were heat transfer management caused by the stagnant or even reversed flow near the skirts that shielded the nozzle, as well as economic problems, since any modification to the operational Ariane 5 launch vehicle significantly increases insurance premiums the entire company would become unprofitable.
Experimental side load measurements are difficult to perform and the cost of the experiment is very high. With the improvement of numerical techniques as well as the rapid increase in computing power, CFD has become a primary tool for the study of jet flows. Therefore, numerical approaches to deal with mismatched flow fields in rocket nozzles are very promising. Indeed, numerical methods for thrust-optimized nozzle start-up and shutdown processes have attracted considerable attention in recent years [
18,
19,
20,
21,
22,
23,
24,
25,
26]. Hadjadj [
27] gave a brief overview of the numerical relationships of nozzle flow separation. The resolution of the Reynolds Averaged Navier-Stokes (RANS) equations has served as the basis for most studies of shock patterns in rocket nozzles.
Using the axisymmetric unsteady method (URANS) we can model the transient flow properties of the nozzle flow. As computing power increased rapidly, the DES/LES and DNS models were used to simulate the flow more clearly. In the literature, the transition of flow separation patterns from free shock separation to limited shock separation [
24] and vice versa has been identified as a key factor in load sources. The presence of internal shocks appears to play a key role in determining the separation pattern.
The first attempt to study the separated flows within an axisymmetric SSME nozzle using planned start-up and shutdown sequences was described by Wang [
28] using a CFD method. Chen et al.[
29] Apparently, the flow of the turn-on and turn-off processes were studied in detail using a Navier-Stokes solver with a turbulence model on an axisymmetric cold flow nozzle (J2S). Koichi YONEZAWA [
30] performed a 3D numerical simulation for the turn-off transient condition and discussed the transition of the separation patterns. Samy [
31] has conducted some research on the turbulent models of flow separation simulations in a two-dimensional laval nozzle.
To investigate the various mechanisms causing thermal stresses in nozzles, Gross[
32,
33] carried out subscale cold gas nozzle experiments and 2D numerical nozzle flow simulations. Sébastien Deck [
34,
35] discussed the hybrid RANS-LES methods in the context of overexpanded jet flows. The numerical results were broadly in good agreement with the empirical data of Nguyen et al.[
36]. Pekkari [
37,
38] has carried out some theoretical work on aeroelastic coupling. Lefrancois [
39,
40,
41] performed similar simulations but coupled them with a structural solver to validate Pekkari's model. His results were fairly accurate, but the fluid-structure interaction methodology showed potential for predicting instability. Kurt [
42] has carried out some studies on directly coupled analysis with the flow separation around the overexpanded nozzle.
Inspired by the original Pekkari concept for inviscid flow utilizing a simplified wall pressure distribution, N. Bekka[
43] developed a new model capable of implementing more complex pressure distributions related to viscous effects. YANG Jianwen[
44,
45] developed a new method of 3rd WENO scheme to analyze the flow influence on the performance of double bell nozzles .Justin Kin Jun Hew[
46]conducted numerical simulations utilizing high-resolution 3D delayed free-standing vortex simulation (DDES) to investigation the spatiotemporal dynamics of wall pressure signals and unsteady shock interactions.Luciano Garelli [
48] used the coupling fluid/structure code to analyze the aeroelastic processes occurring during the startup phase of a rocket engine. The influence law of fluid-structure coupling in the nozzle is revealed.
The purpose of this work is precisely to study the flow separation model of FSS and RSS and analyze the aeroelastic properties of the nozzle under flow separation. The essay is structured as follows. First, we briefly introduce the numerical method and discuss in detail the flow field in the context of an overexpanded nozzle. The loosely coupled CFD/CSD method is then presented and the results are briefly discussed.
2. Flow Separation Analysis
2.1. Numerical Methodology (CFD)
The governing equations of the nozzle flow field computation is performed by a two-dimensional, axisymmetric, time-precise solver for perfect gases [
49].
Since the direct numerical solution of the Navier-Stokes equations is too expensive, the equations are time averaged, meaning that any small, turbulent fluctuations in the flow that contribute to their complexity are not resolved but modeled; This simplification strips the flow of its subtle characteristics, but significantly reduces the complexity of the solution. Reynolds averaging divides all time-dependent variables into average and fluctuating Ù components. The Navier-Stokes equations are then averaged over time, restoring the original inviscid flows, although now defined by averaged variables, but introducing new nonlinear fluctuating terms due to their similarity to the stress tensor Called Reynolds stresses and added to the viscous flows. These concepts are not solvable and must be modeled.
The two-dimensional, unsteady, compressible, time-averaged Navier-Stokes equations and conservation equations for mass, energy and turbulent kinetic energy are written in general form as follows:
The governing equations can be expressed as follows:
Where Φ is any dependent field variable, stands for the gas velocity vector, ρ is the gas density and Γ represents the exchange coefficient such as the diffusion coefficient. Sф is the source term stemming from the turbulent flow field.
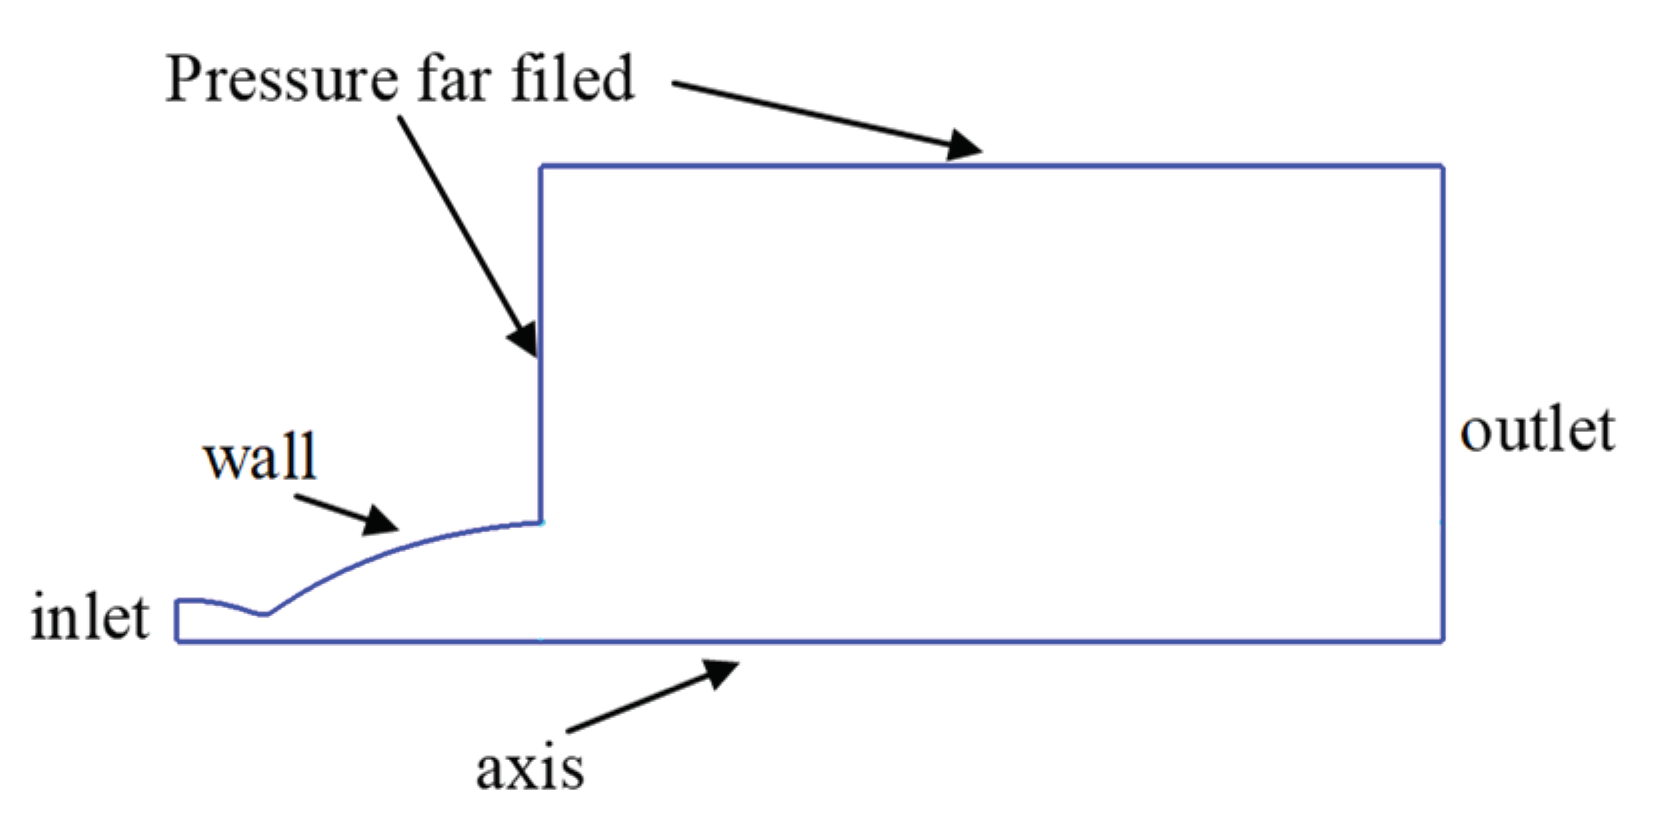
Figure 2.
Fluid computational domain with boundary conditions.
Figure 2.
Fluid computational domain with boundary conditions.
2.2. Turbulence Model
The most common Reynolds stress modeling approach is the eddy viscosity model. The idea is based on the Boussinesq hypothesis that turbulent quantities can be modeled by an additional viscosity coefficient, called turbulent viscosity as an analogy to molecular viscosity. There are a variety of models that calculate turbulent viscosity either directly from the averaged flow variables or from additional variables for which additional equations must be solved. All models contain a variety of empirical coefficients that are precisely tuned to the required flow type by comparing the CFD results with the experimental data. The advantage of RANS turbulence modeling is its low computational cost and the fact that the results are presented as time-averaged quantities, which is typically what engineers are interested in. The main disadvantage comes from the eddy viscosity assumption that turbulence can be modeled by an extra viscosity term. Although turbulent phenomena involve rapid mixing and thus rapid dispersion, the mechanisms of turbulence are far more complex than an additional viscosity term can predict. While turbulence is a 3D phenomenon, eddy viscosity models incorrectly assume isotropy of turbulent quantities. The transition from laminar flow to turbulent flow cannot be solved by turbulence models because they have no information about the flow frequency and wave number. Nevertheless, several attempts have been made to create transition models, but these rely heavily on empirical coefficients, making the entire prediction doubtful.
The selection of a turbulence model is contingent upon various factors, including the flow's physics, established practices for a given class of problems, the required level of accuracy, available computational resources, and simulation time. This article selects a number of models, and the experiment verifies the outcome.
The subscale parabolic nozzle (VAC-S1) [
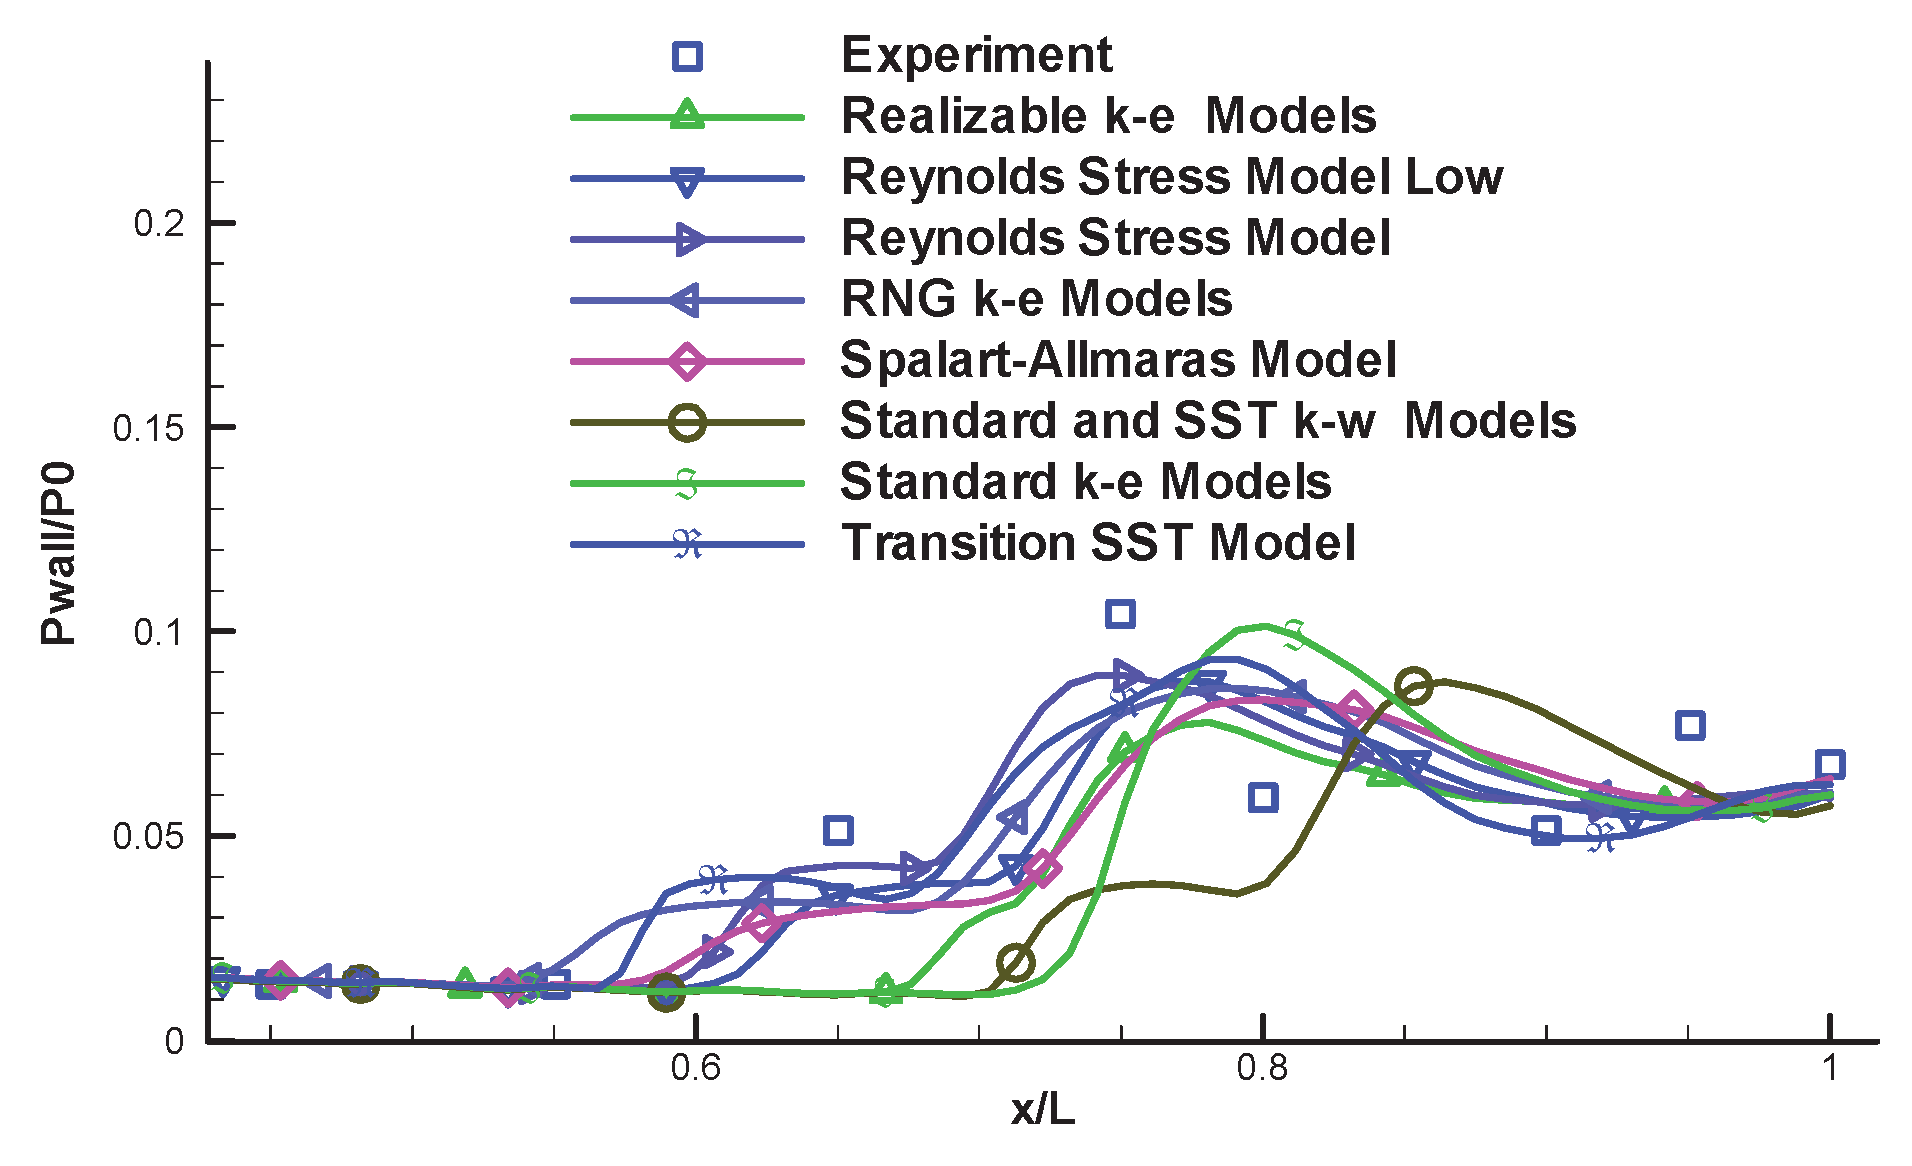
6]is the analysis object by this paper. For turbulence model, eight models were selected, including the one equation, two equations, and Reynolds stress model (RSM). The Spalart-Allmaras single equation, standard k-e model, feasible k-e models, RNG k-e model, standard and shear stress transport (SST) k-w models, transient SST model, Reynolds stress model, Reynolds stress model low.
Figure 3 displays the pressure distribution along the nozzle wall. In comparison to the experimental result, a turbulence model with an equation for numerical calculation of the flow separation is selected.
2.3. Case Test
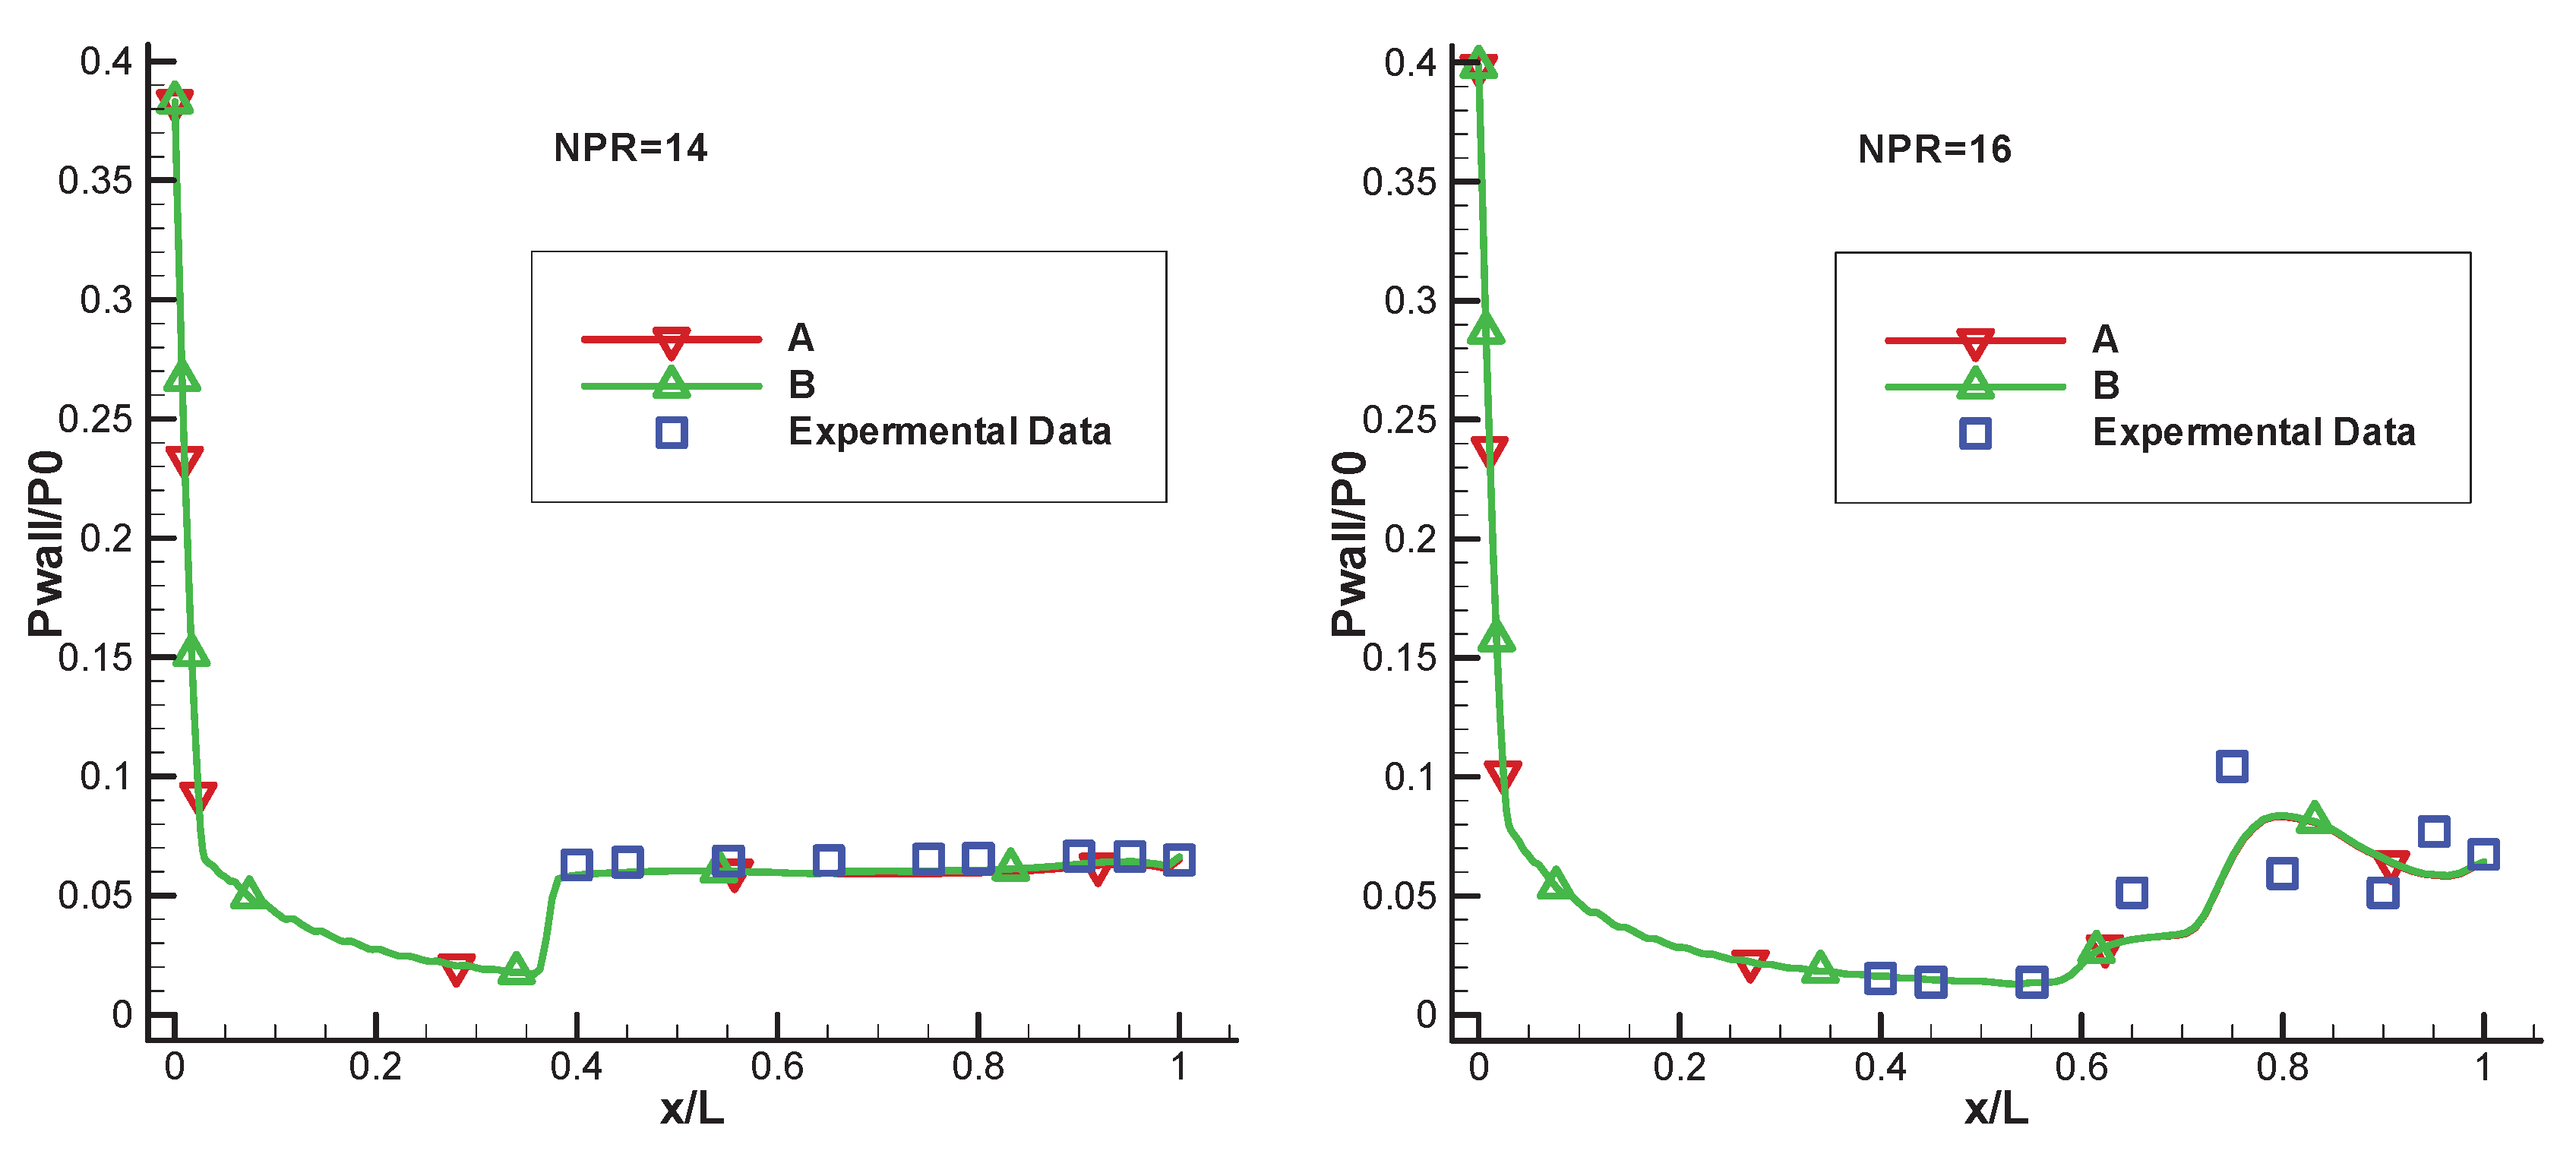
Numerical simulation has its own scientific philosophy; The result of the separation flow simulation depends heavily on the quality of the network. In this article, the steady-state convergence solutions are first determined, then the network is refined and the simulation is carried out with the same boundary conditions and initial conditions. The refined result and the rough result are essentially the same. Then grid independence can be proven. In this article, the wall y+ is less than 1 to ensure that the premise calculates the convergence solution, and then adjusts the grid spacing according to the grid refinement. This article lists the two combustor pressure versus ambient pressure (NPR) conditions analyzed, 14 and 16. Table 2 shows the specific distribution of the grid.
Figure 4 shows the results of the nozzle wall pressure, by comparing with the experimental data at PR = 14 and 16. From the figure, we can see that the coarse and fine mesh achieve a similar result, which is consistent with the experiment. Grid independence is also demonstrated in
Figure 4. As the present comparison shows, the calculated cut-off points at both PR = 14 and PR = 16 are downstream in relation to the measured position. Therefore, the simulation tools can be used to display the nozzle separation flow.
Table 1.
The grid distributions of VAC-S1 nozzle.
Table 1.
The grid distributions of VAC-S1 nozzle.
| NPR |
Case |
x |
y |
Total Nodes |
| 14 |
A |
200 |
90 |
50538 |
| B |
300 |
150 |
54818 |
| 16 |
A |
270 |
120 |
52680 |
| B |
370 |
180 |
67658 |
2.4. Ressult
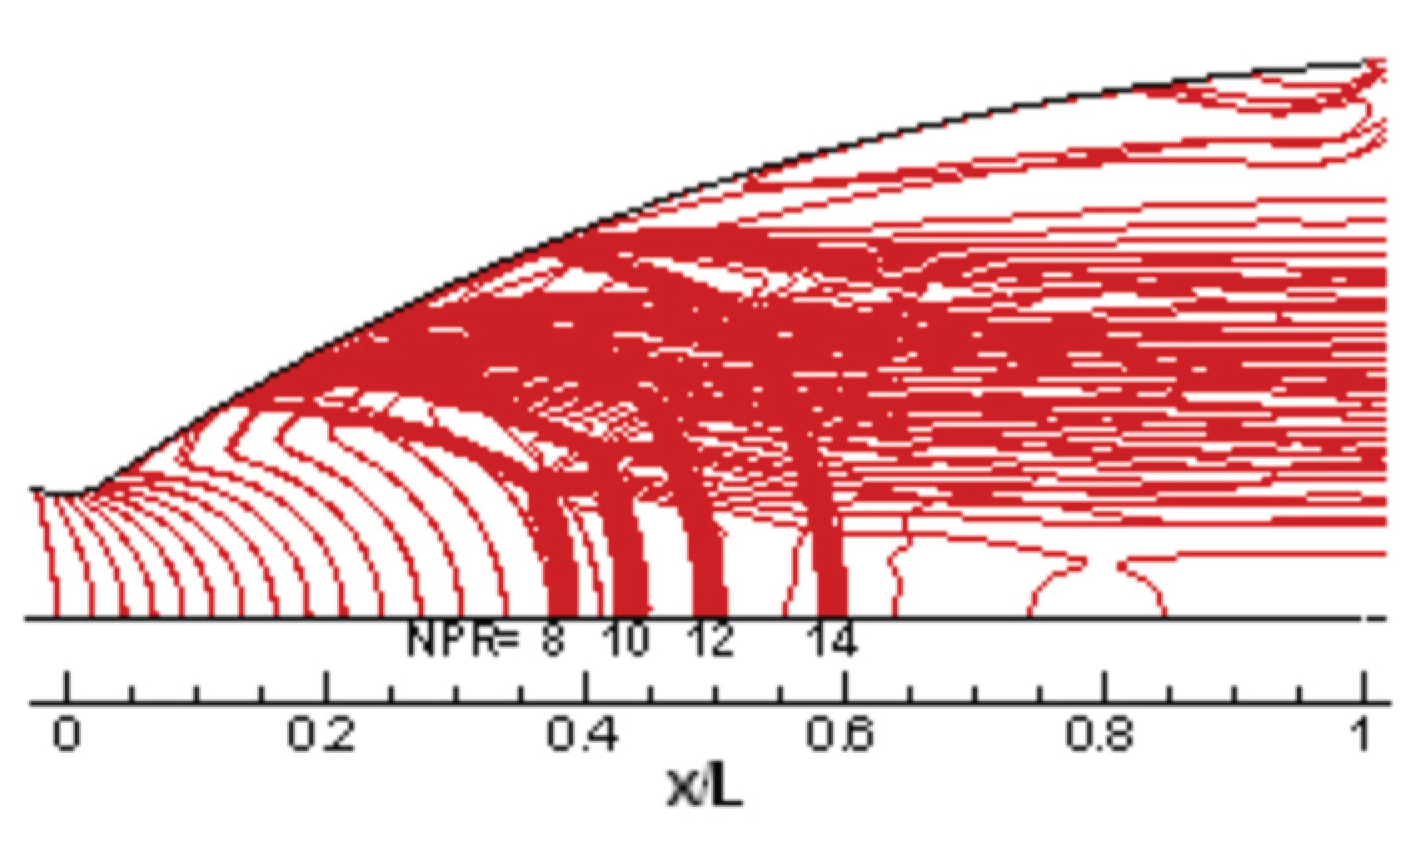
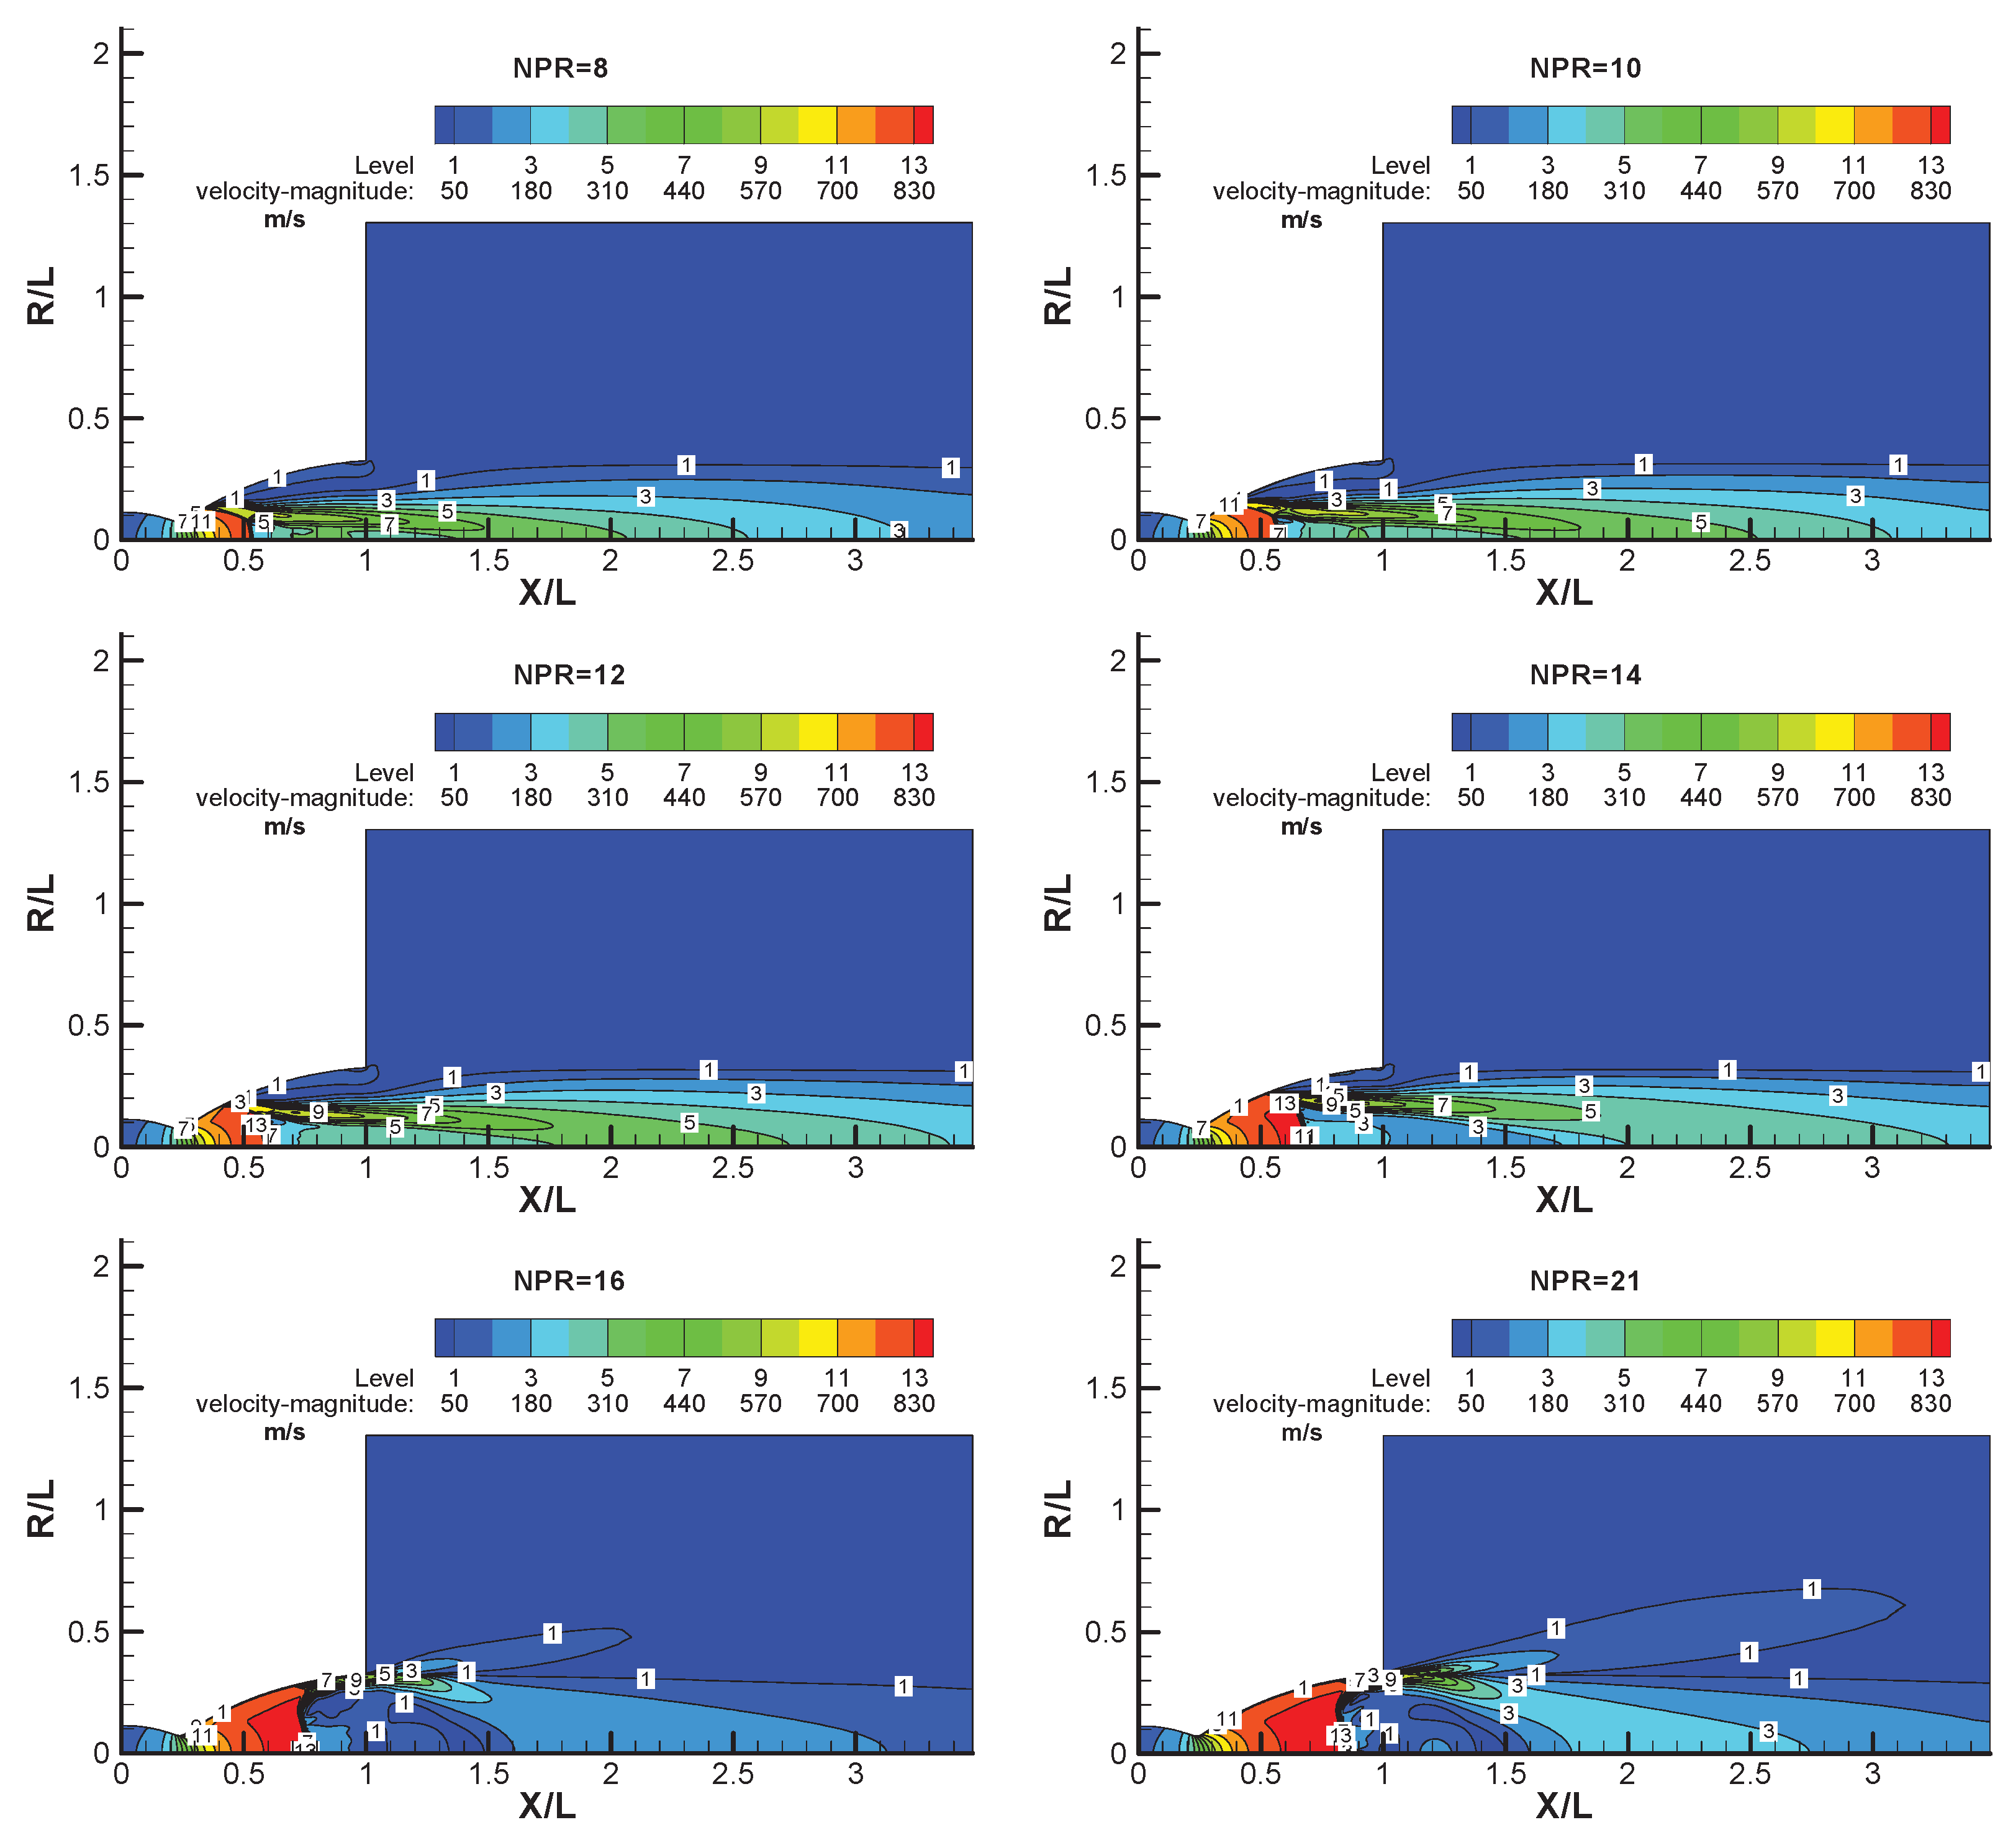
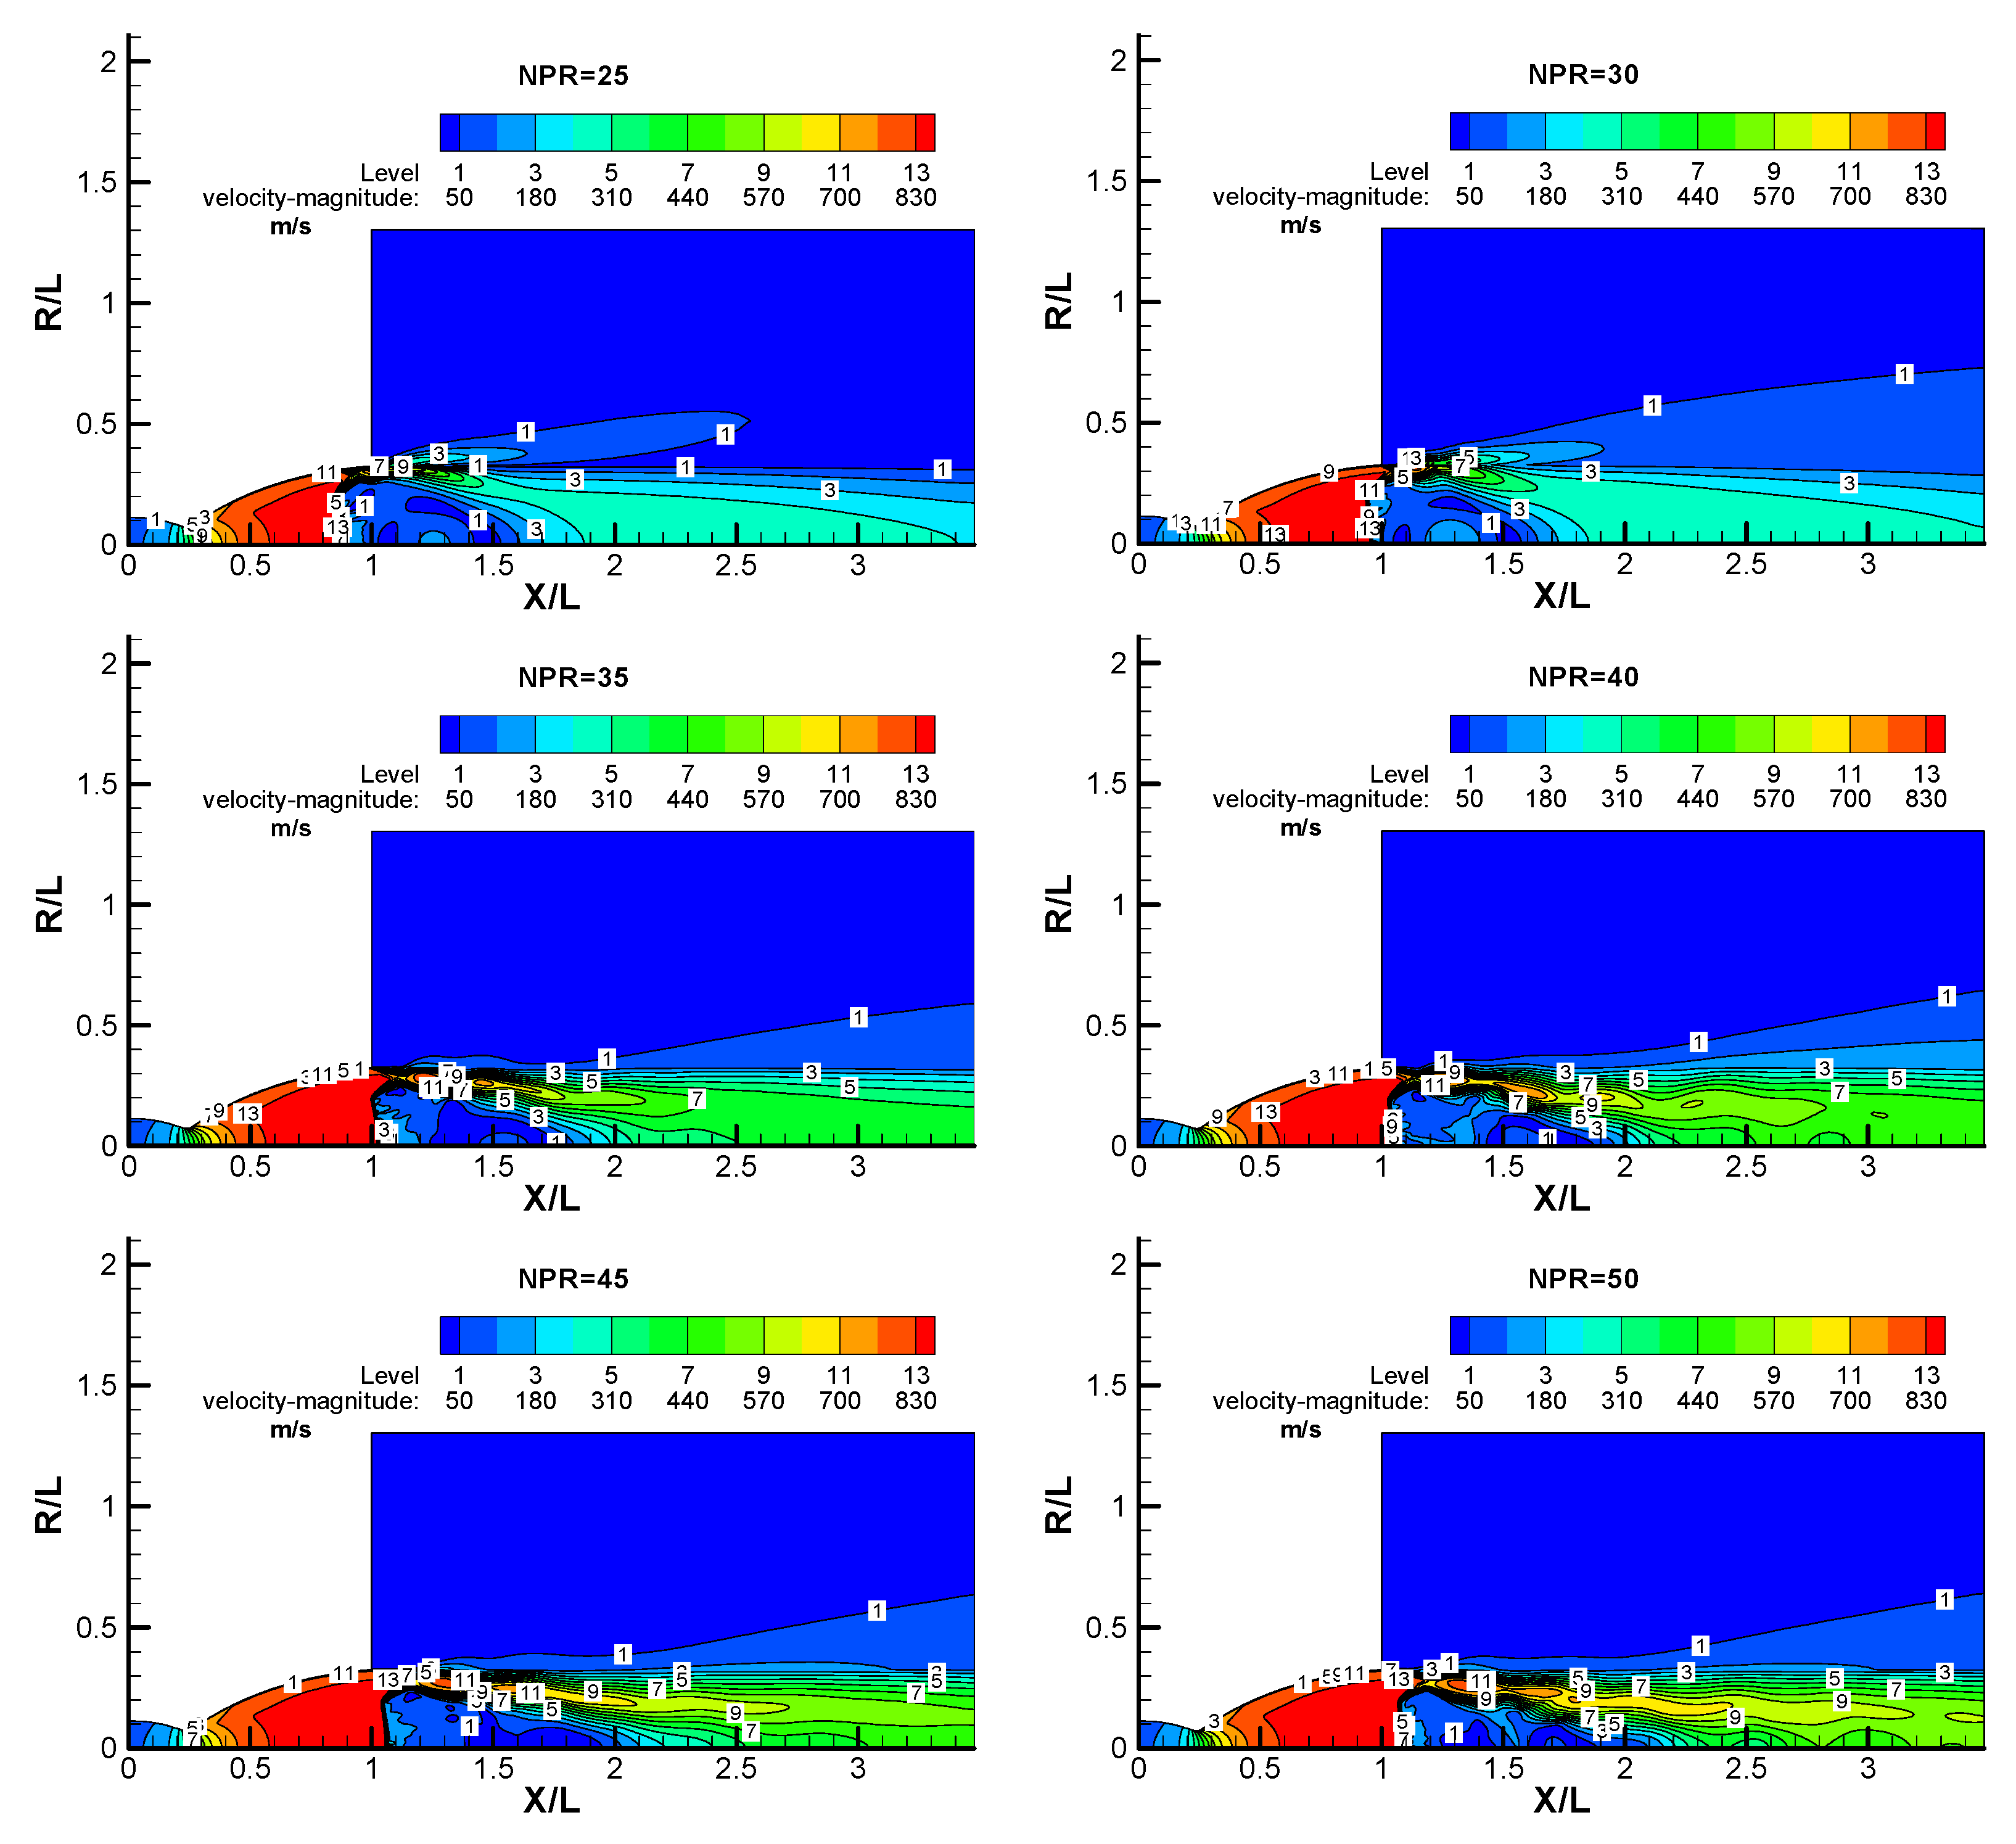
The shock wave contours are shown for the VAC-S1 nozzle at different combustion chamber pressures. The calculated contours of the velocity quantities are shown in the Figure. 5.
Figure 5 shows the calculated flow field in the VAC S1 nozzle at different NPRs. Instantaneous streamlines are also shown in each figure.
In the numerical simulation part, NPR of 8, 10, 12, 14, 16.4, 21, 25, 30, 35, 40, 45, 50 and another 12 conditions were simulated and analyzed according to the above numerical methodology. The above calculation results were the initial value for each condition. The results showed that under different conditions from high to low inlet pressure, two different shock separation modes occurred sequentially in the nozzle flow field: free shock and restricted shock separation, as shown in
Figure 6. Under the two different shock separation modes, the flow field and pressure distribution in the nozzle showed different characteristics.
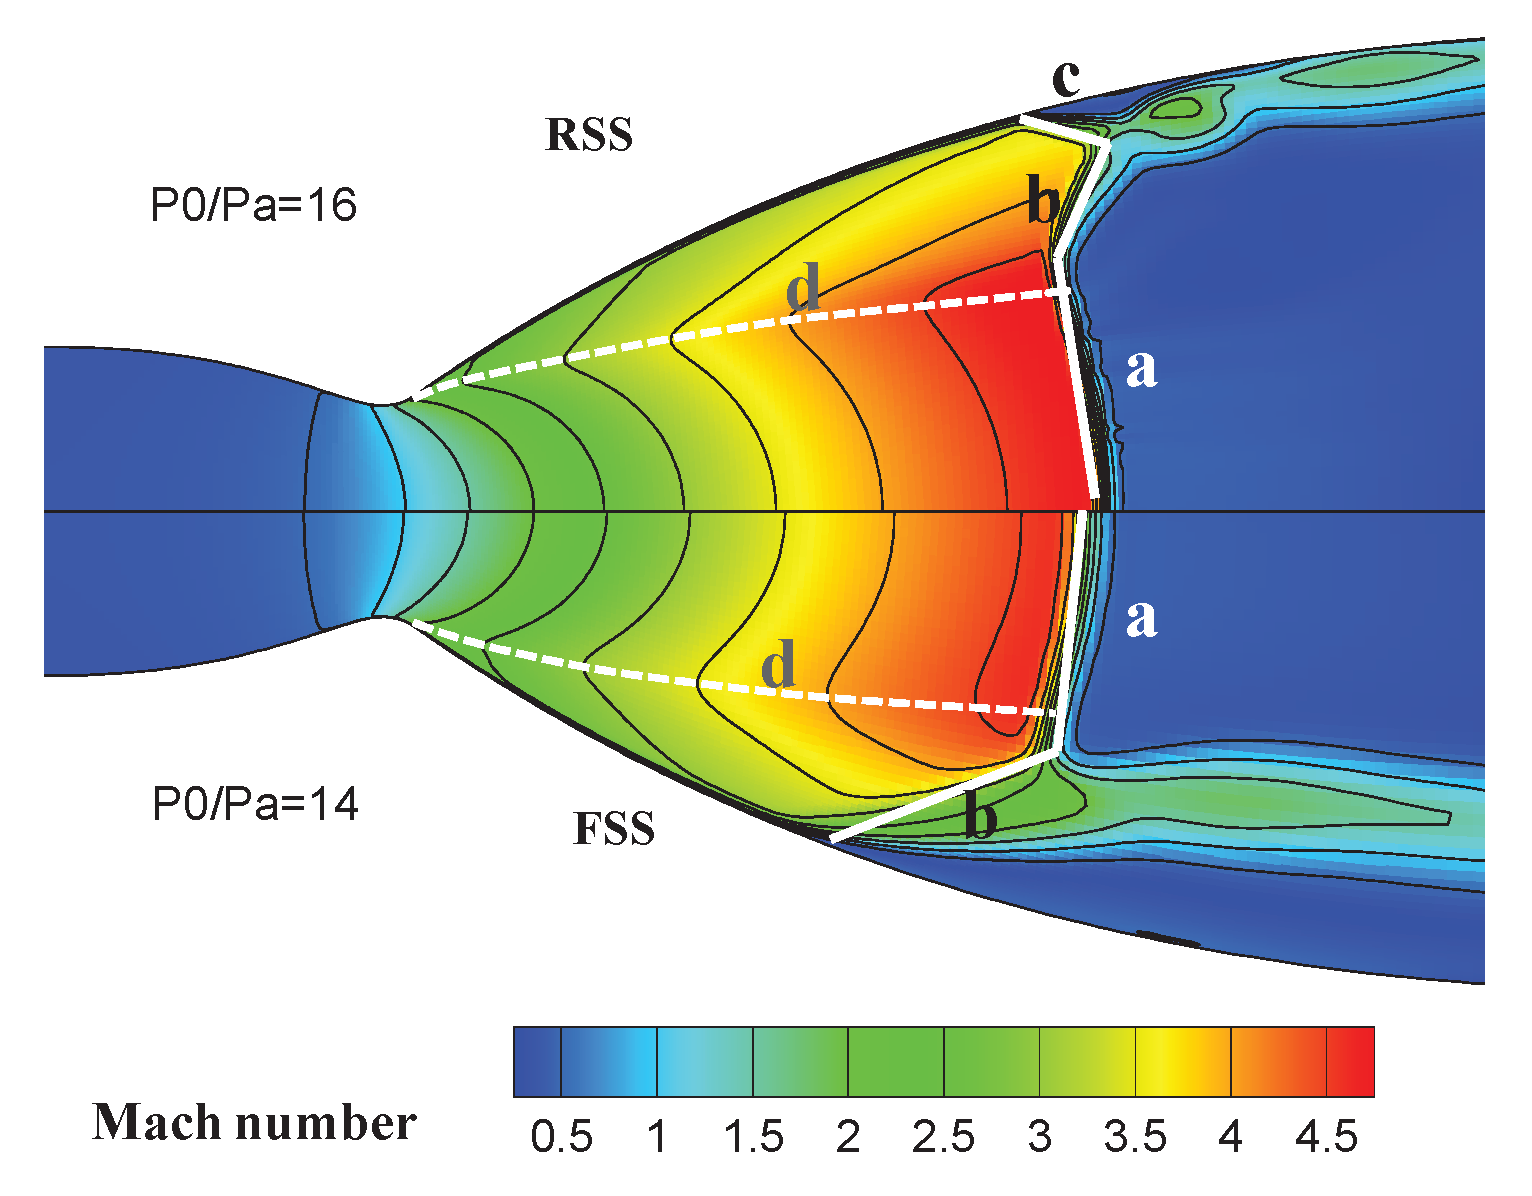
At NPR = 14 the FSS pattern is calculated, the gas stream separates and never reconnects to the wall. At NPR = 16, the RSS pattern is obtained, the flow field is characterized by the reattachment to the wall to form a closed recirculation bubble.
Figure 6 illustrates the shock nomenclature: a was the Mach disk, b was the oblique shock wave, c was the restricted shock wave, and d was the internal shock wave.
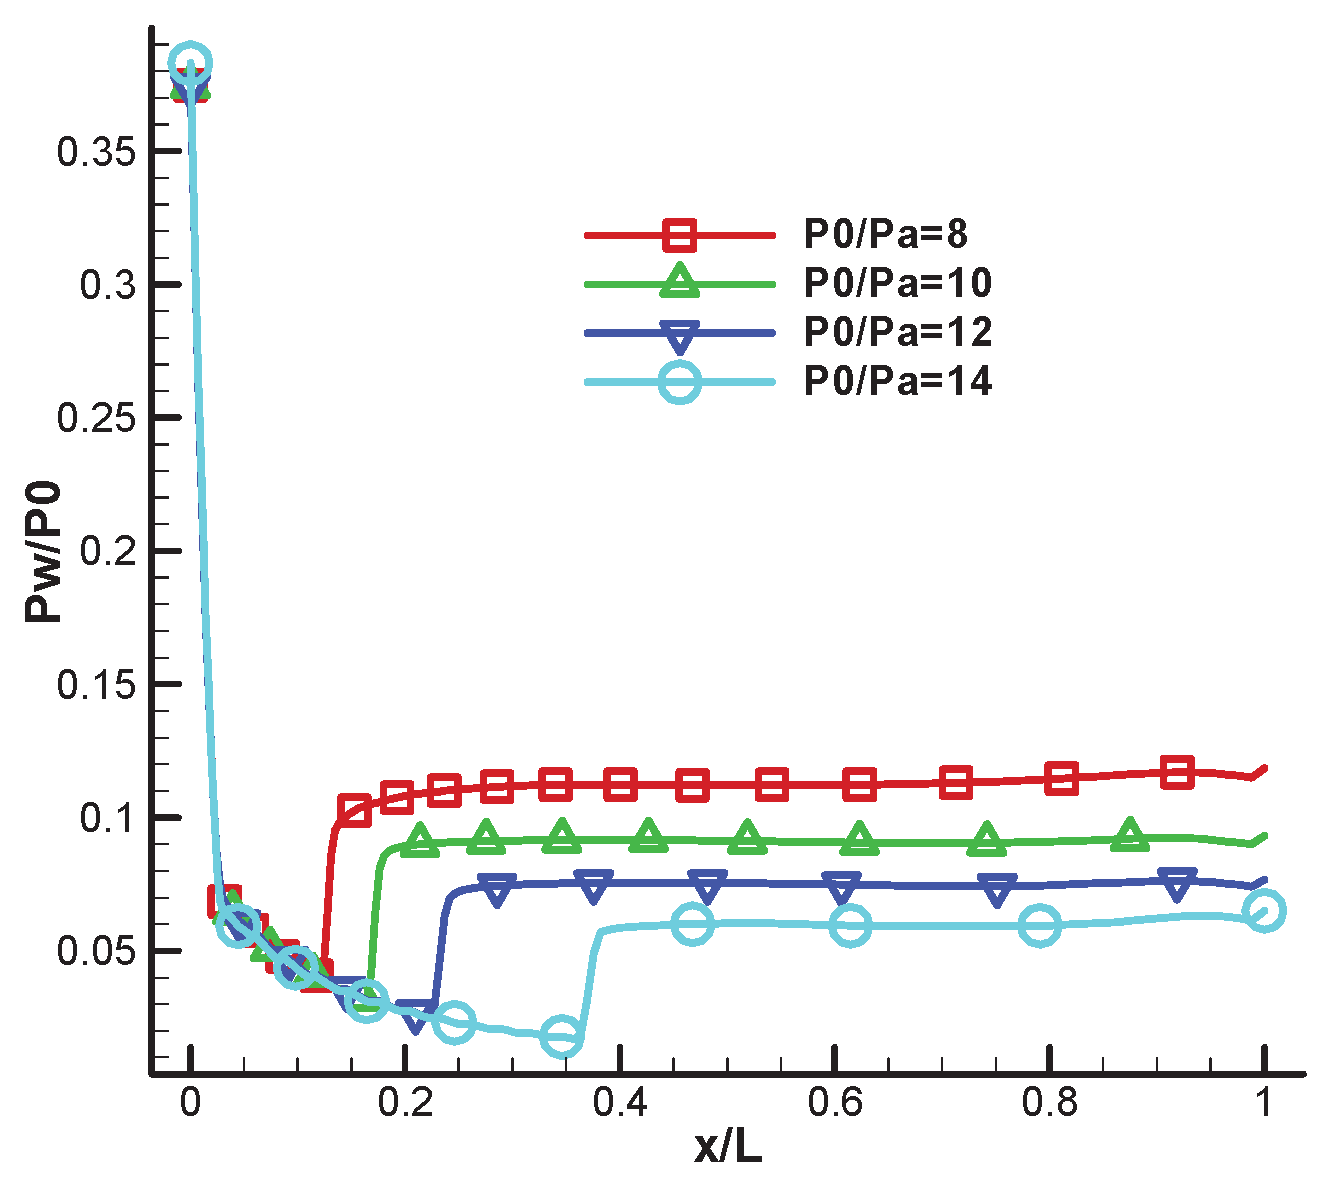
At an NPR of 8,10,12,14, the separation pattern was FSS and Mach reflection of the separation shock wave occurred. As the NPR increased, the triple point of Mach reflection moved toward the nozzle wall to reach the location of the internal shock wave. In the FSS case, the wall pressure development is mainly determined by the classical supersonic flow separation.
During the FSS pattern, the airflow in the nozzle separates from the wall and flows out of the nozzle. Because the nozzle expands relatively much, the air flow in the nozzle is in a state of over-expansion, and the total pressure of the combustion chamber is relatively smaller than the ambient back pressure, resulting in the appearance of shock waves in the nozzle. However, as can be seen from the figure below, after the air flow passes through the expansion waves a and the oblique shock wave b, a Mach disk is formed inside, and the gas separated from the wall does not stick to the wall. At the same time, as the total pressure of the combustion chamber increases, the shock waves in the nozzle move towards the nozzle exit, but the parameters of the flow field in front of the shock waves remain fundamentally unchanged.
Figure 7.
the sketch of the FSS model inside the nozzle.
Figure 7.
the sketch of the FSS model inside the nozzle.
Figure 8 shows the wall pressure distribution curve of the nozzle expansion section in the combustor under the free shock mode. It can be seen from the figure that in the free shock mode, after the wall separation, the pressure rises rapidly to the environmental pressure through the shock wave.
During the RSS condition, the reattached stream traveled along the nozzle wall and was expelled from the nozzle exit. The exhausted cloud eventually converged toward the nozzle centerline downstream of the nozzle. In the subsonic flow region behind the Mach disk at the nozzle center, the flow continued along the nozzle axis and a recirculation region was formed due to a high pressure region generated by the convergence of the plume.
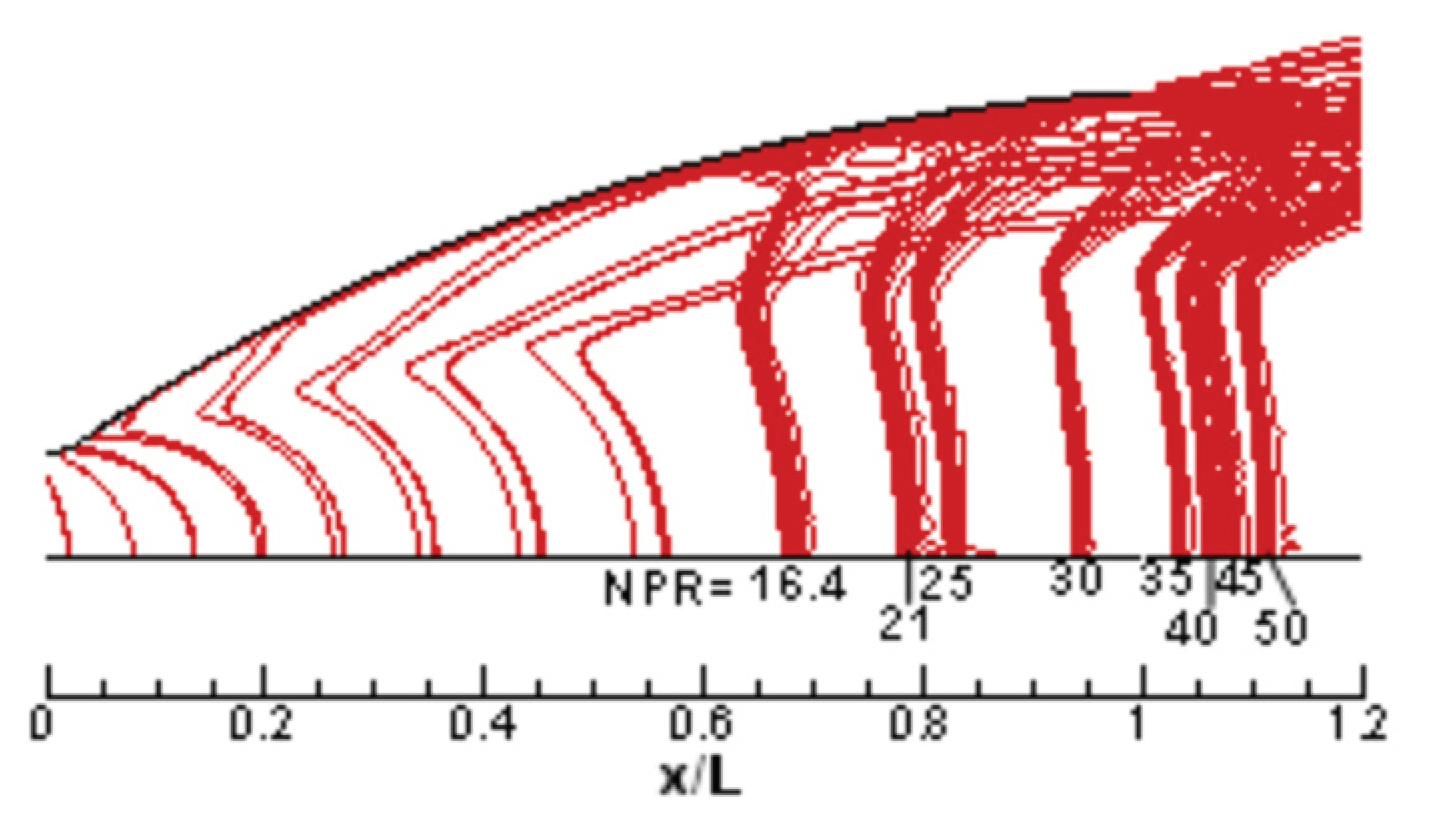
Figure 9 shows the flow field structure in the nozzle when the NPR is 16.4, 21, 25, 30, 35, 40, 45, 50. It can be seen from the figure that as the pressure ratio of the combustion chamber increases, the mode of the shock wave does not change, and after the separation of the wall air, the flow adheres to the wall surface and forms a flow attachment zone. When the pressure ratio NPR is 40, the shock wave is pushed out of the nozzle and the nozzle plume forms a clear Mach disk.
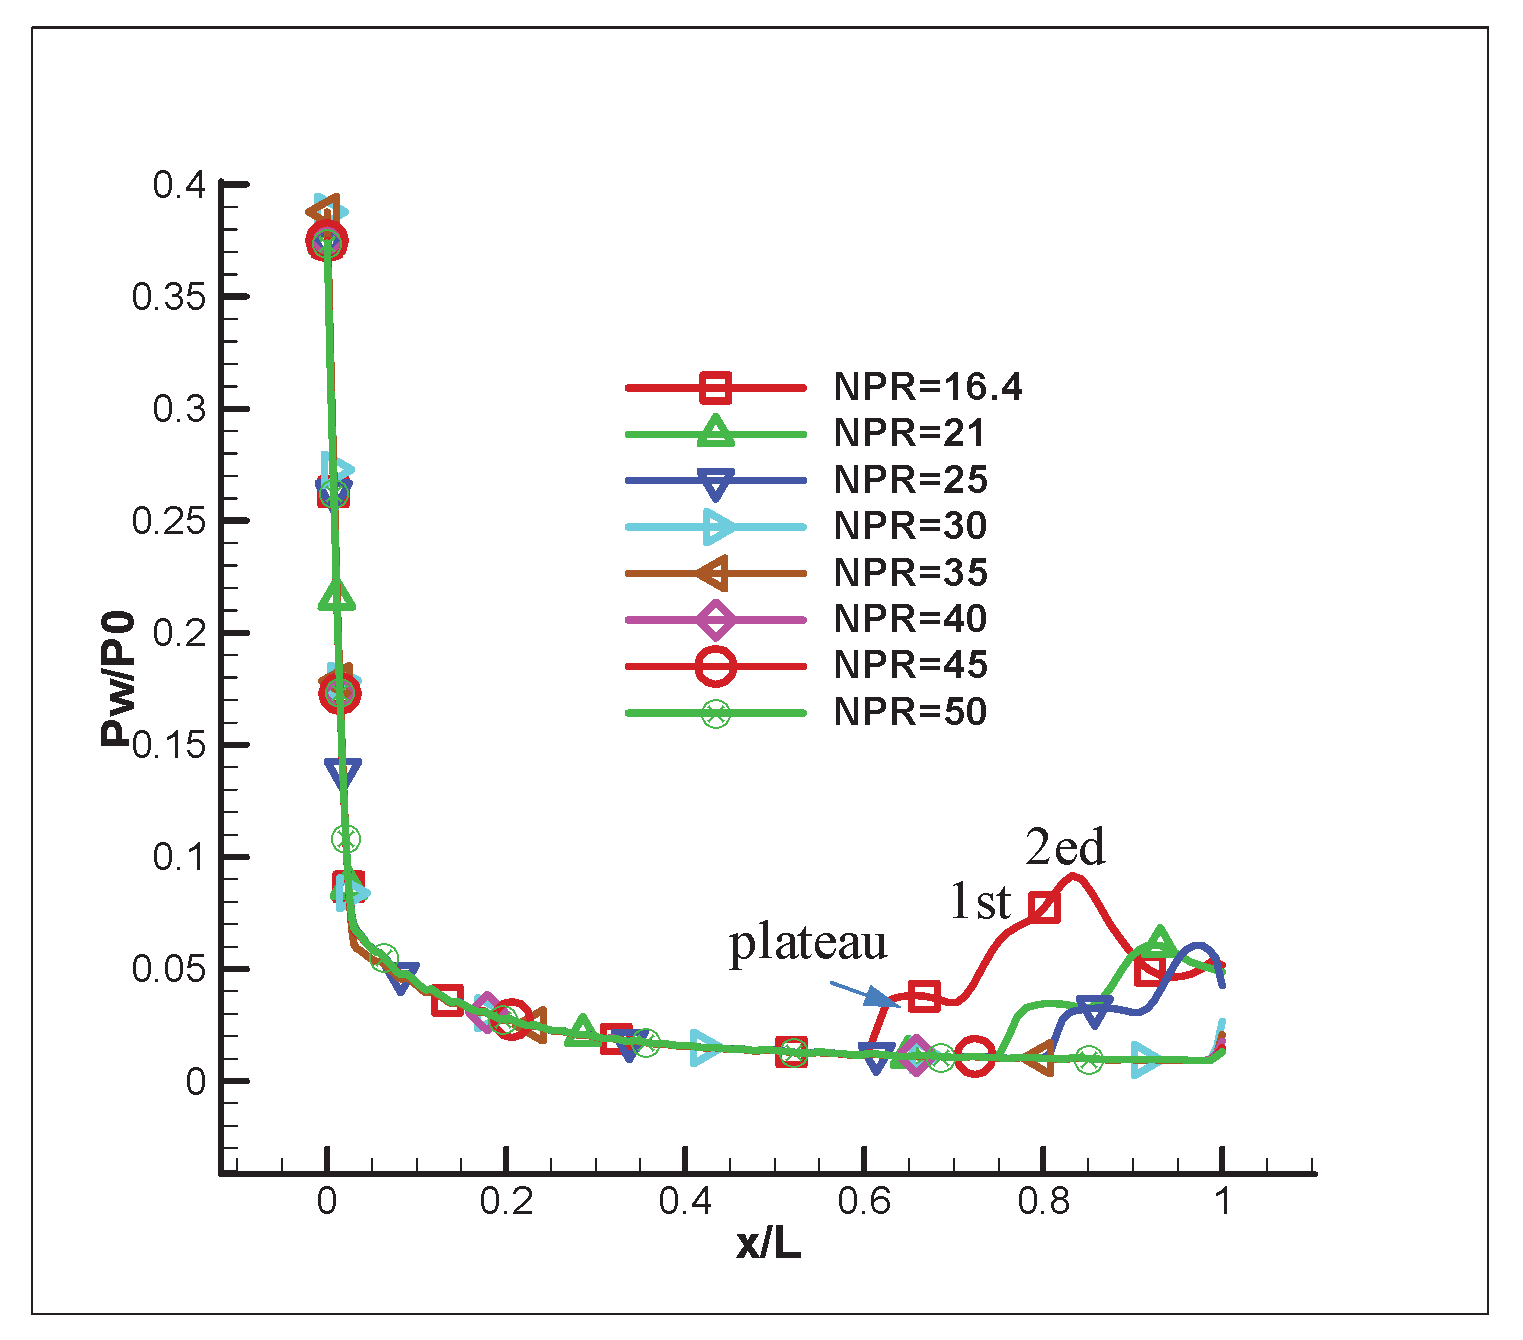
Figure 10 shows the wall pressure distribution in the nozzle expansion section of the combustion chamber in the restricted shock mode. As can be seen from the figure, as the air flow increases, the wall pressure also gradually decreases. At the separation point, the wall pressure increases rapidly to a relatively stable pressure (the platform area shown in
Figure 10) due to the effect of the oblique separation shock wave. In contrast to free butt separation, the airflow is reattached to the wall after a short separation. Due to the strong effect of the reattachment shock wave, the wall pressure at the reattachment site increases sharply and exceeds the ambient pressure. Then, through a series of gradually decreasing fluctuations, the wall pressure eventually drops slightly below the ambient pressure until the nozzle exits. This decreasing pressure fluctuation is due to the reflective properties of shock waves. The reattached shock wave has a tendency to reflect away from the wall, and the strength of this tendency is determined by the strength of the shock wave. This causes the air flow to repeat itself between the air flow far from the wall and the air flow close to the wall, creating a series of shock waves in the barrier area, which then lead to wall pressure fluctuations.
The reattachment of the separated boundary layer generated a reattachment shock wave and the wall pressure increased. However, the arrival of expansion waves from the inner free boundary of the reattached flow reduced the wall pressure. This results in the first pressure peak, marked as “1.” in the
Figure 10, was founded. Another high pressure region was generated downstream of the reattachment point due to the interaction between the reattachment shock wave and the compression waves from the inner boundary of the reattachment flow to form a second pressure peak, labeled as “2.” in the
Figure 9. Due to the unfavorable pressure gradient due to the second peak, another separation bubble formed immediately upstream of the second peak. Further downstream, the shock waves, compression waves and expansion waves continued to be reflected between the nozzle wall and the free boundary of the reattached flow. As a result, pressure areas that were higher and lower than the ambient pressure formed in the reattached flow. As the NPR increased, the reattached flow structure moved downstream and was gradually discharged from the nozzle exit. The main structures of the reattached stream remained similar during the RSS condition. At NPRs above 30, the plume diverged from the nozzle exit.
For the two different separation modes mentioned above, an internal shock wave is generated in the nozzle of each separation shock mode (d-curve in
Figure 6). This internal shock wave arises at the starting point of the nozzle parabola. The design method of the maximum thrust nozzle determines that the nozzle profile at this point is a second-order discontinuous point, which is a flow unstable point and easily generates shock waves. The schematic representation of the flow field structure shows that this internal shock wave largely determines the shape of the shock wave in the central area. The vortex behind the positive shock wave in the central flow field tends to push the flow towards the wall. When the momentum of the liquid flowing to the wall reaches a certain degree, the phenomenon of separation and reattachment occurs.
3. Static Structure Analysis
3.1. Analysis Lateral Side Load Force
Using the previously mentioned flow field calculation method, this article conducts a three-dimensional analysis of a high expansion ratio nozzle. By integrating the pressure on the nozzle wall, the different directional forces of the nozzle arise based on the convergent solution. In this article, the combined non-axial shear force is referred to as the shear force. Integrate the nozzle pressure at different pressure ratios according to the definition of the lateral load force. Ultimately, the non-axial transverse load force can be determined by calculating the component forces in each direction.
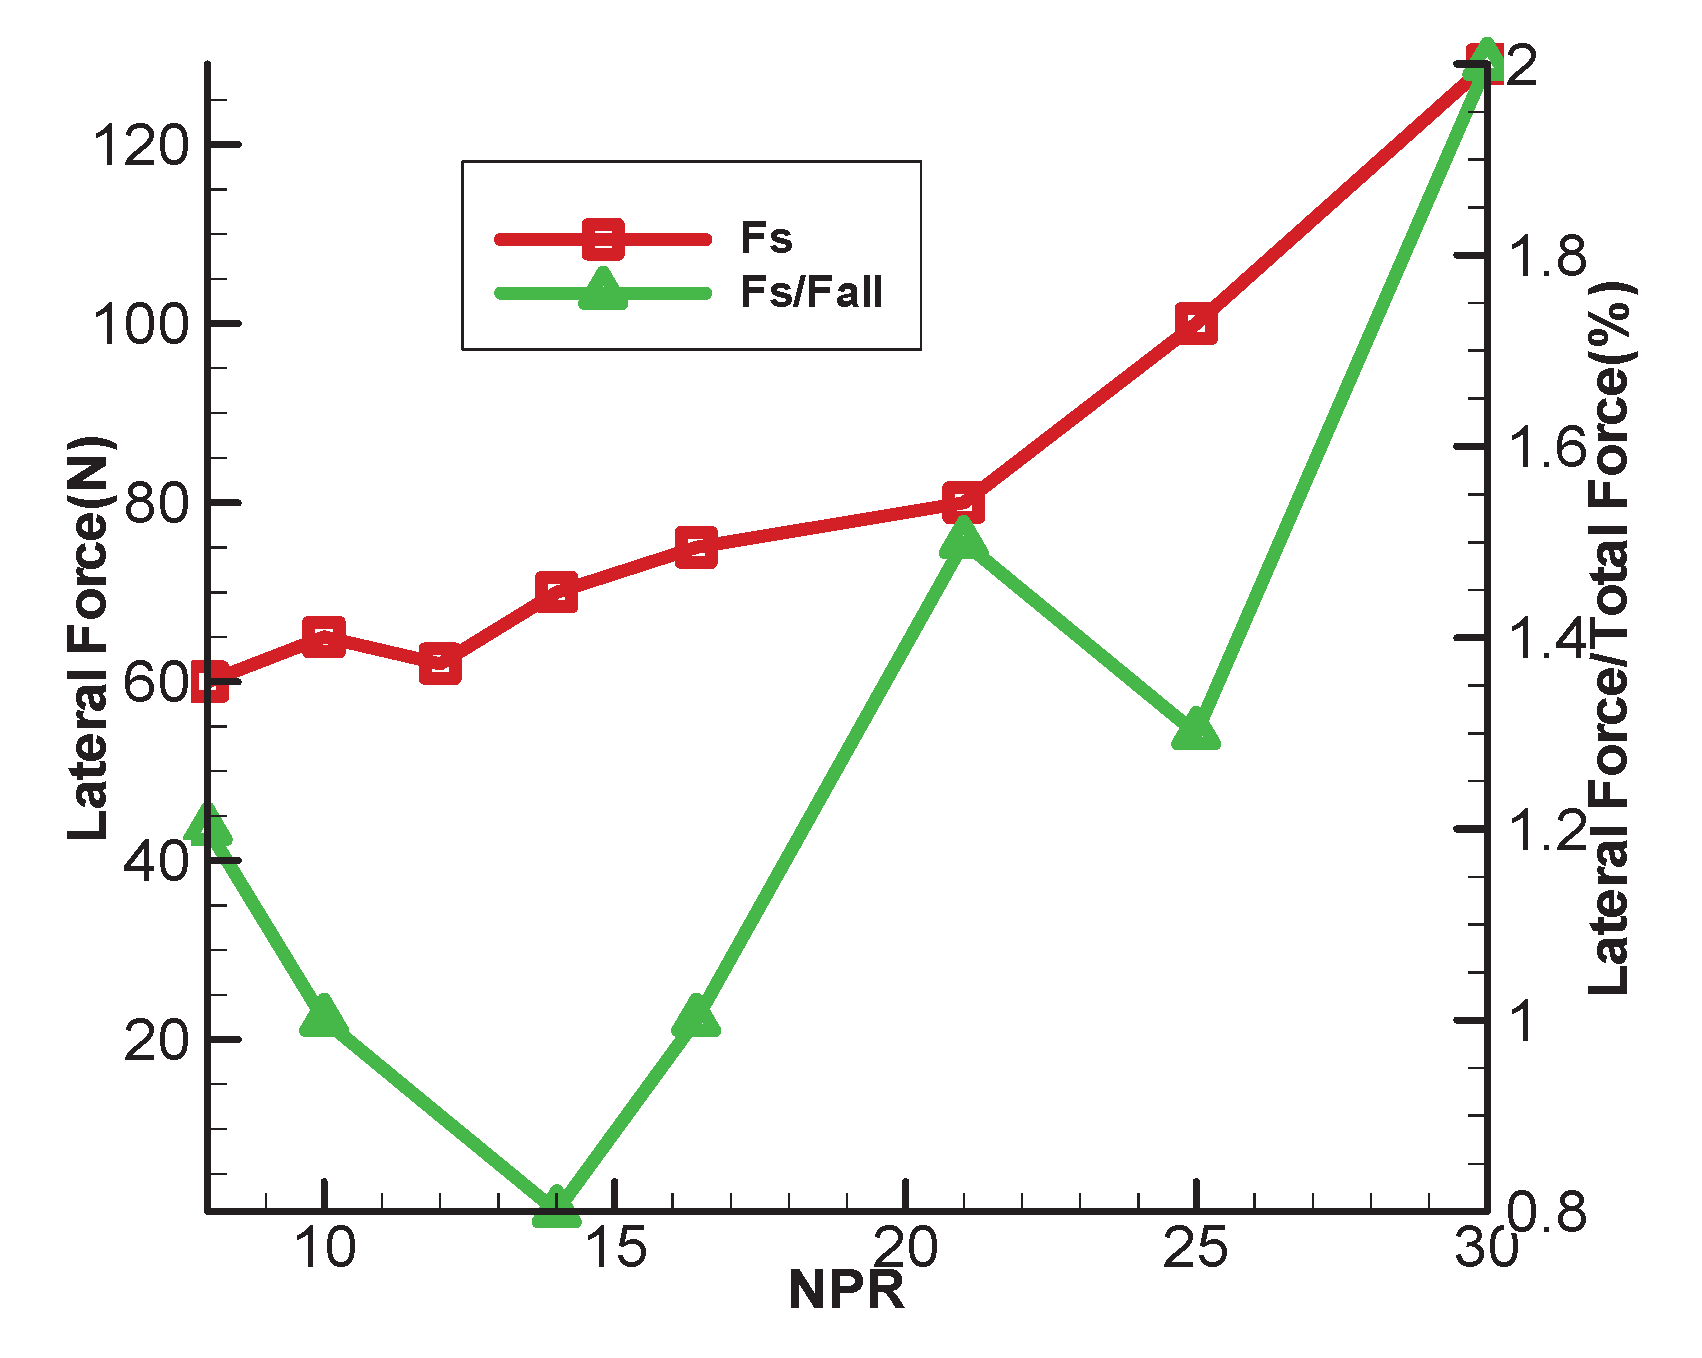
Figure 11show the relationship curve between the lateral loading force and the compression ratio NPR. It can be seen from the figure that the lateral loading force increases with the compression ratio.
The relationship between the lateral load force and the total thrust (thrust on the engine axis) at different pressure conditions is also shown in
Figure 11. The figure shows that there is no monotonic relationship between the pressure ratio and the change in the transverse load in the total thrust. The contribution of the lateral load force to the total thrust is negligible (generally less than 2 percent) under the various operating conditions examined in this paper. A steady state is used as the basis for a transient simulation calculation that analyzes the effects of the lateral load force in detail. The SA turbulence model is used for the operating condition with NPR 16. In the meantime, the pressure distribution across several nozzle points is observed.
Table 2 shows the exact location of the dot array.
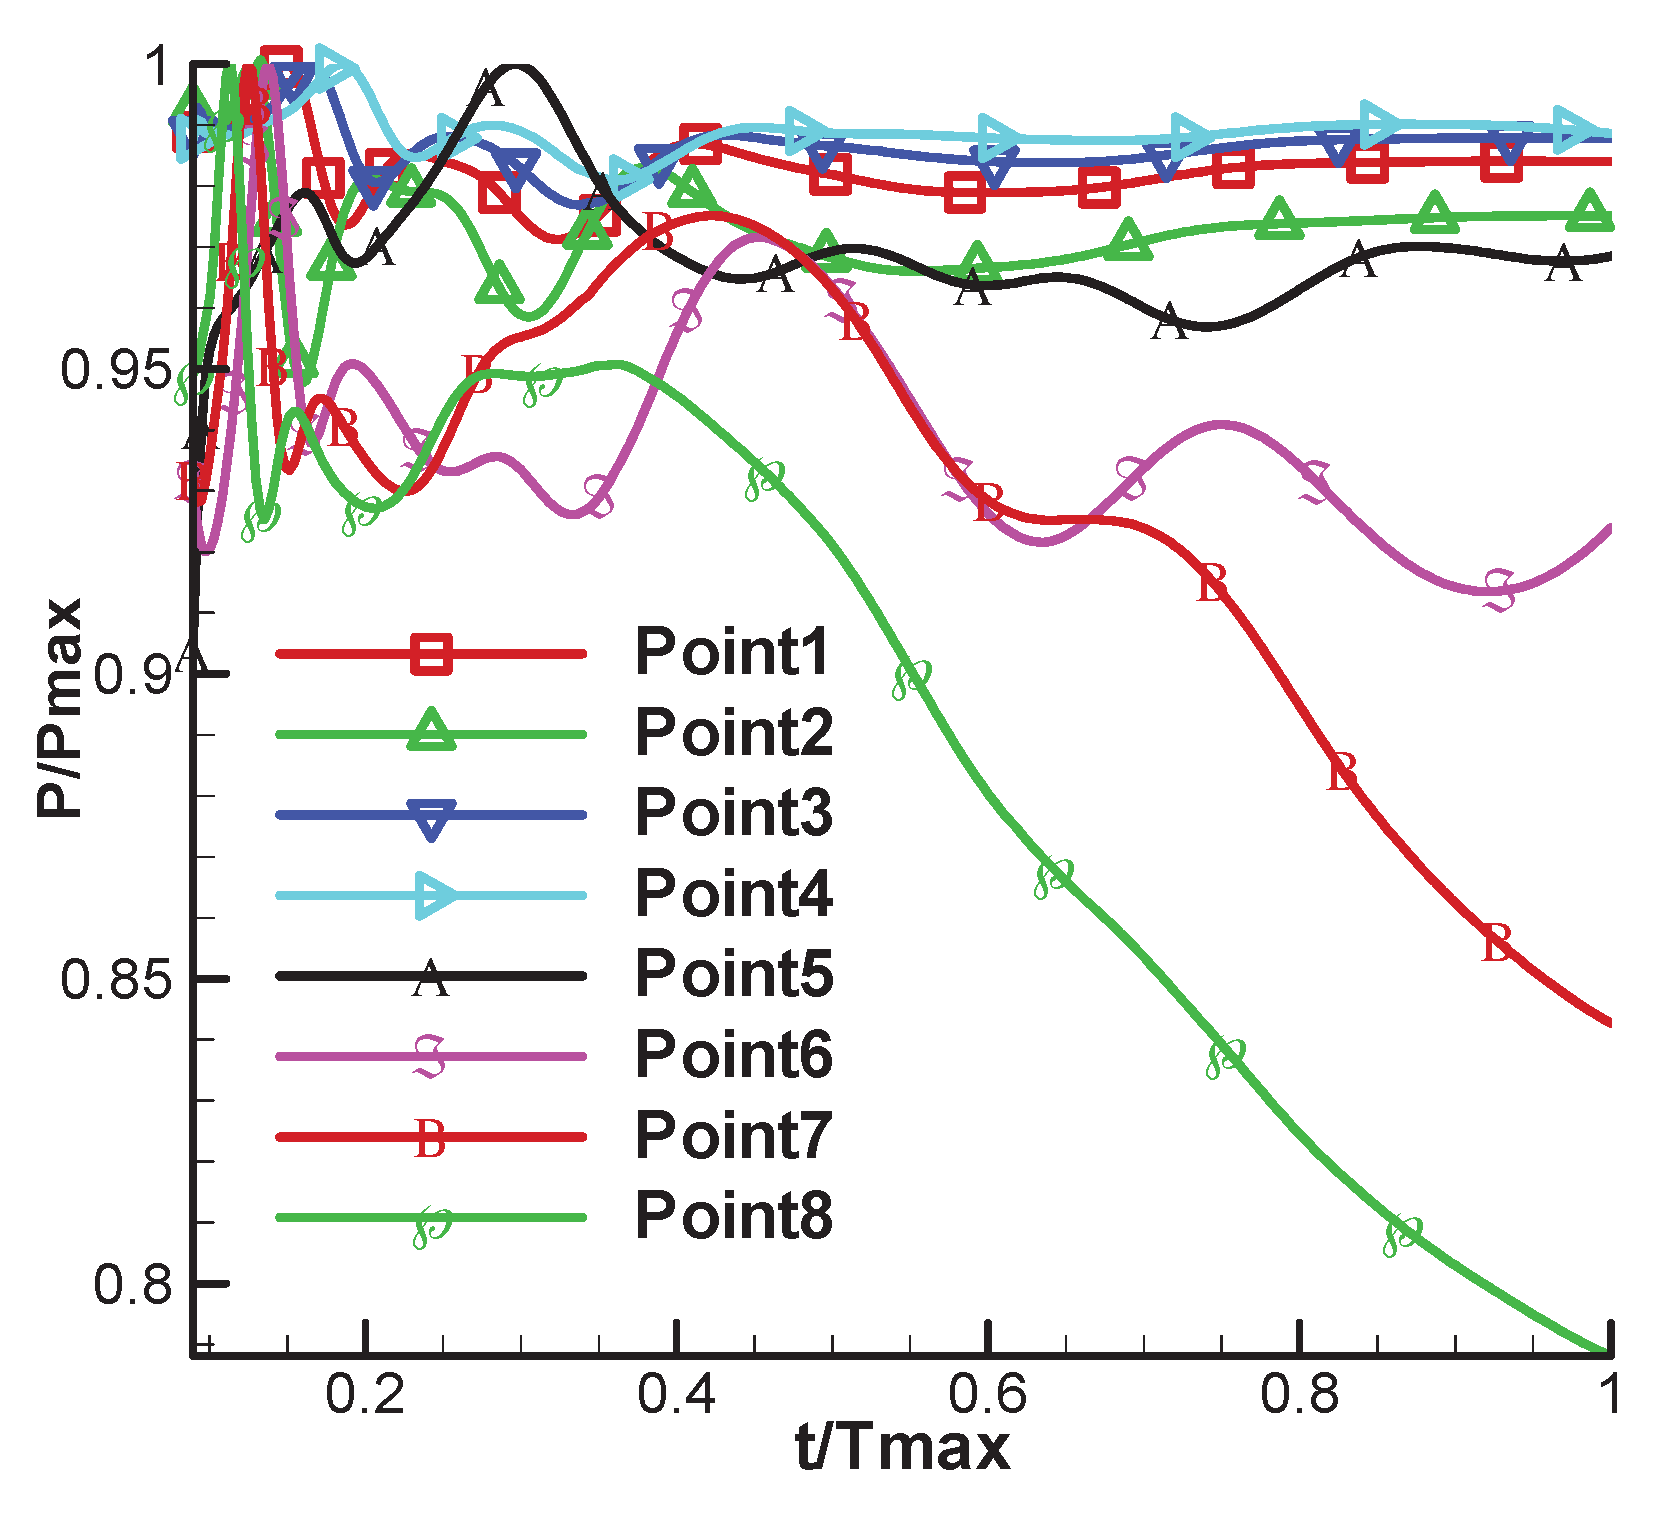
Figure 12 illustrates the pressure fluctuations at each point using a transient simulation of this operating condition. Each monitoring value was reorganized to have a variation range of 0–1 by dividing it by the maximum value in the data set. This allows the figure to accurately represent the variation pattern of monitoring measurements.
As shown in the figure, the pressure values of each monitoring point at the beginning of the flow have similar fluctuation patterns and are relatively high. However, over time, the flow field evolves and different monitoring locations exhibit unique characteristics related to pressure fluctuations. Before the separation point (points 1–5), an equilibrium state is reached in a certain period of time, indicating flow stability before shock wave separation, in which the parameters remain essentially the same. Different monitoring points (points 6–8) initially show similar trends observed during the first flow period after shock waves. However, pressure fluctuations arise because separate shock waves disrupt the established transition flow during the temporal evolution of the flow field. As a result, important parameter changes occur after shock wave separation. High-velocity flows also cause complex turbulent pulsations that follow shock waves caused by interactions between near-wall shock waves and boundary layers, as well as the entrainment of low-temperature air. Changes in the vortex that follow contained shock waves also affect the varying pressure state.
3.2. Wavelet Transfer
Mathematical functions called wavelets are used to separate data into distinct frequency components and analyze each one at a scale-appropriate resolution. They are superior to conventional Fourier techniques when examining physical scenarios where the signal has sharp peaks and discontinuities.
Discrete wavelet transforms (DWT) and continuous wavelet transforms (CWT) are the two types of wavelet transforms. When used in conjunction with the Fourier transform, they may offer additional insights into dynamical systems. Similar to how the FFT relates the input signal to a superposition of cosine terms when transforming a signal from the time domain to the frequency domain, wavelet transforms relate an input signal to a basis function expressed as the mother wavelet.
Nonetheless, wavelet analysis is able to detect nearly instantaneous frequency changes in the signal due to its finite length, while FFT is unable to do so since it deals with an infinitely long signal. In this paper, Haar wavelet transmission of pressure during the given time was used. The Haar wavelet is a mathematical sequence of rescaled "quadratic" functions that collectively make up a wavelet basis or family. Similar to Fourier analysis, wavelet analysis enables the representation of an objective function as an orthonormal function basis over an interval. The non-continuous and hence non-differentiable nature of the Haar wavelet is its technical drawback. Nevertheless, this characteristic can be useful in flow separation and signal analysis involving abrupt transitions.
Result discuss:
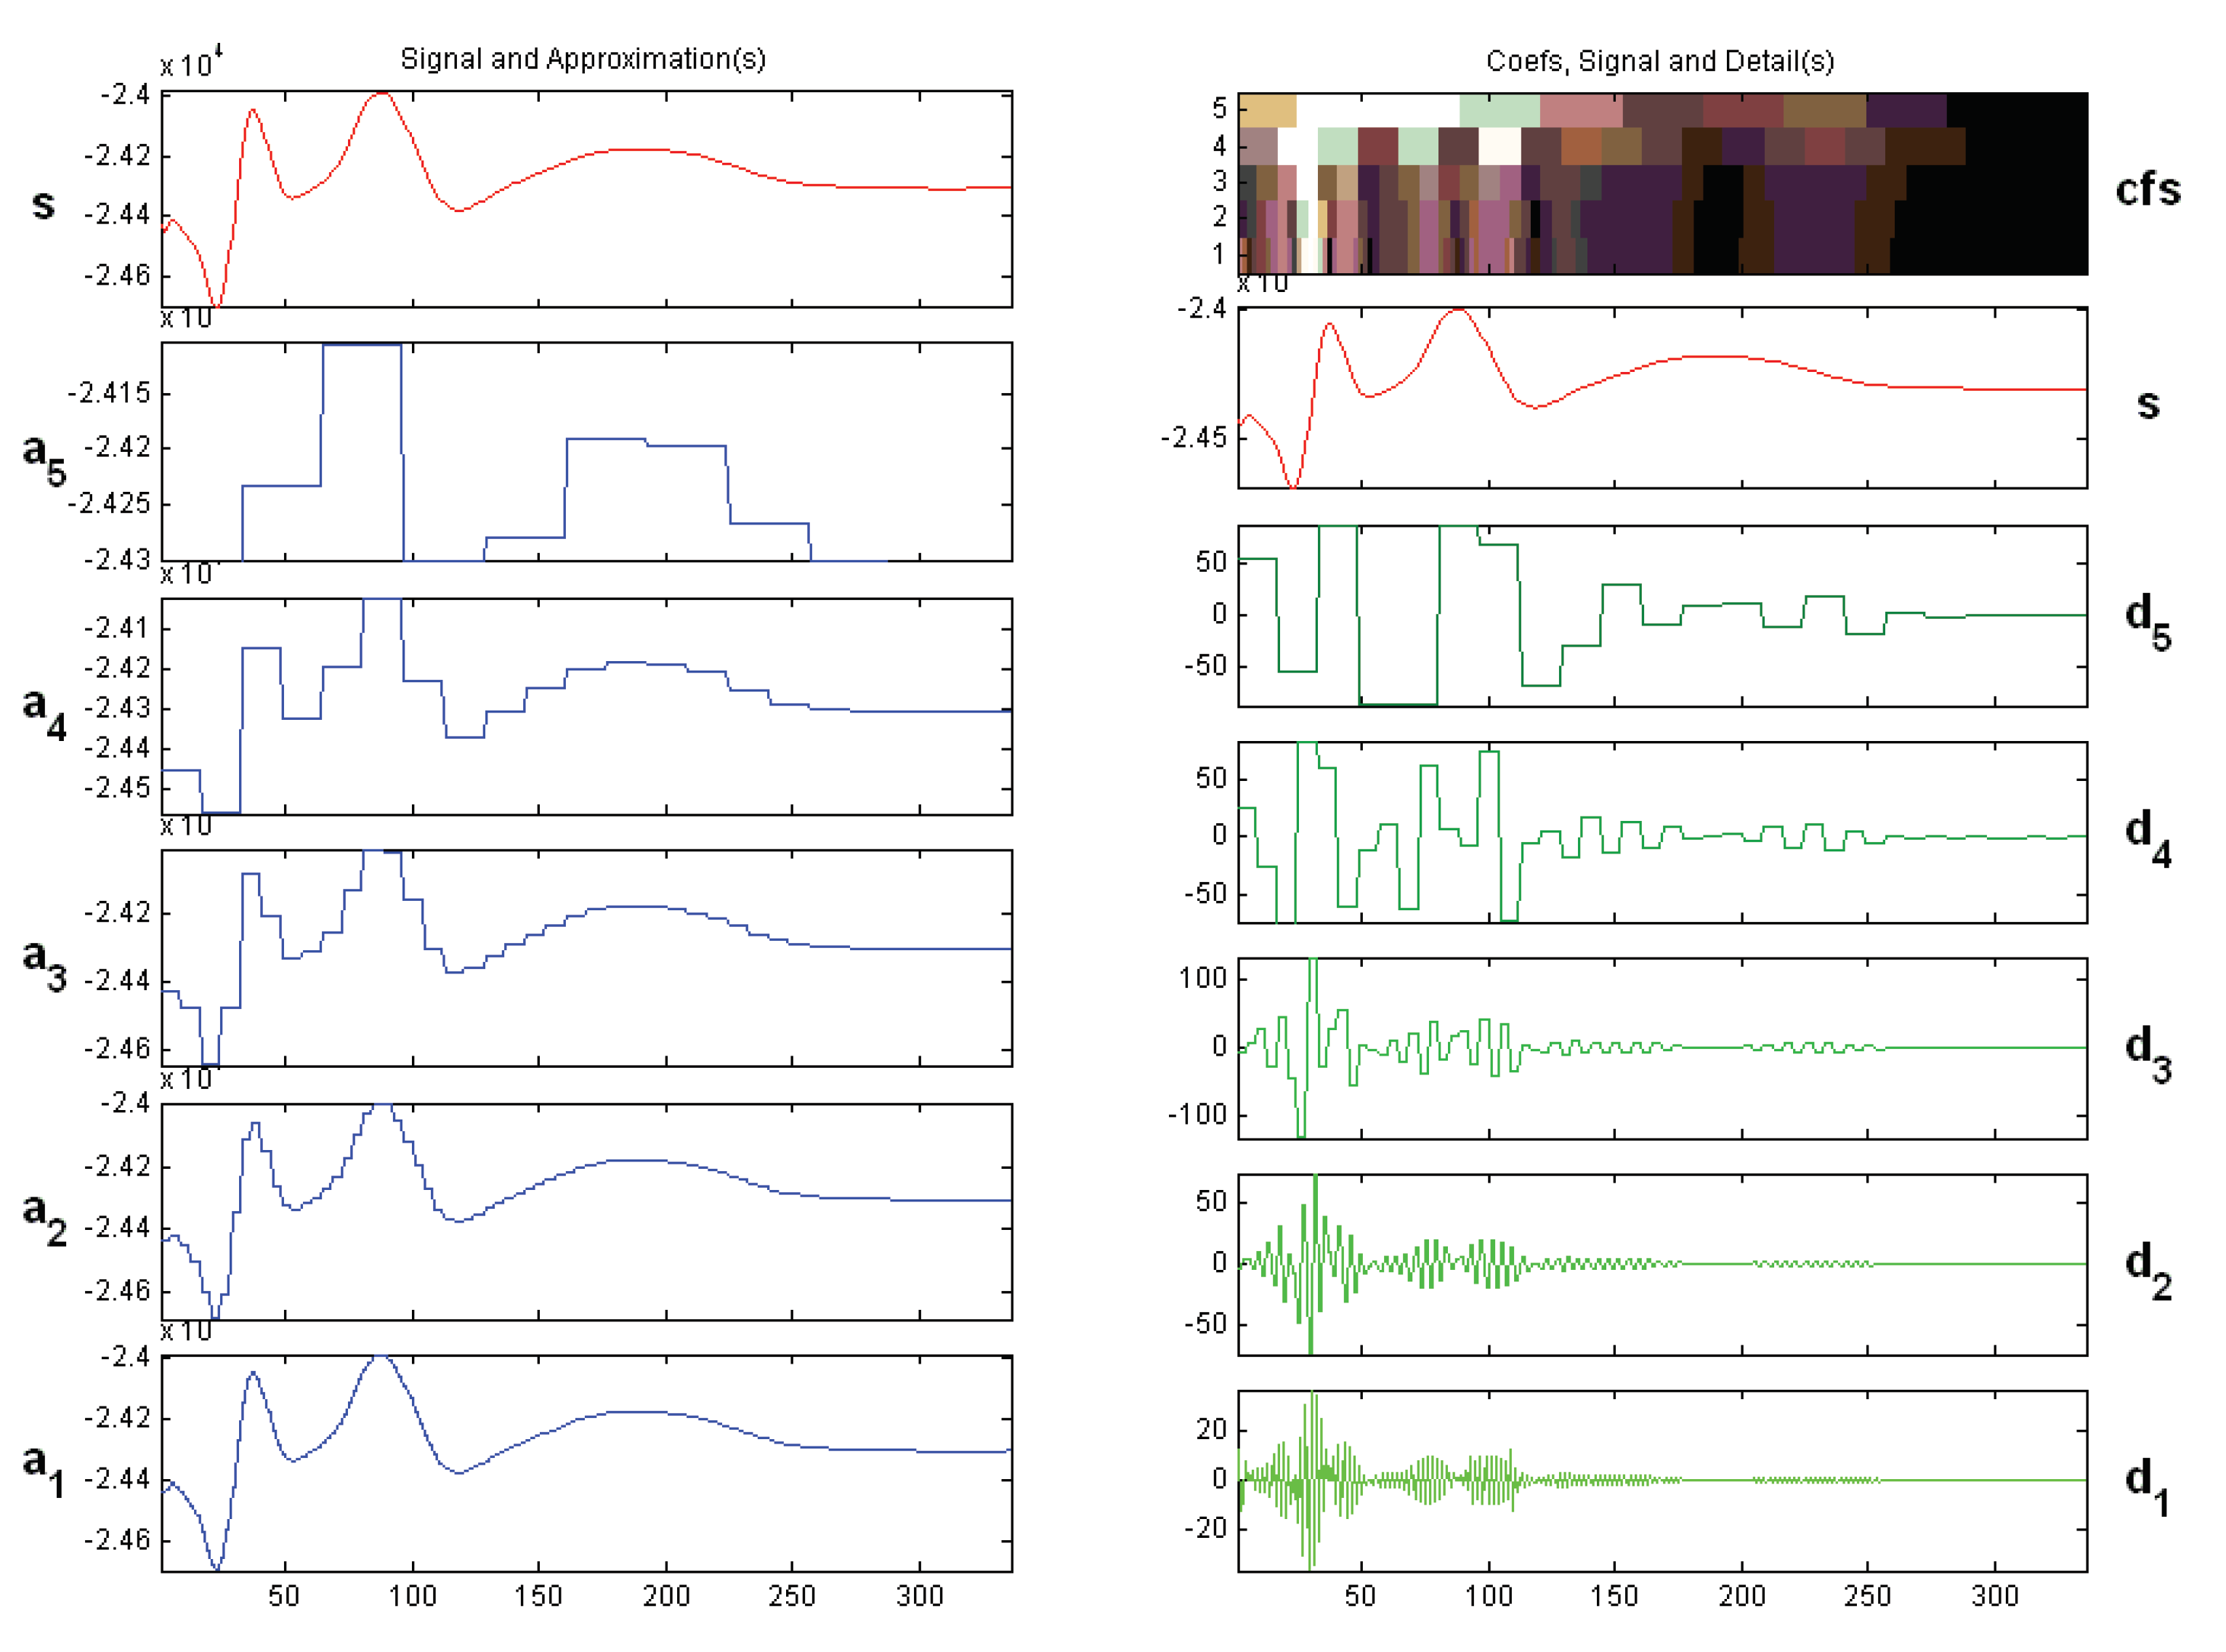
The information obtained from the monitoring point 5 cluster of hair bases is applied to break down the listed monitoring point in the frequency incidence range, and five monitoring points are used to analyze the object.
Figure 13 shows the respective calculation results. The figure shows that the pressure pulsation frequency range is mainly between 0 and 100 Hz, and the five base clusters (d1, d2, d3, d4 and d5) are all low-frequency pulsation curves. The main cause of these pulsations is the separation of the flow caused by shock waves during the flow process. After the separation, rhomboid-shaped shock waves form in the area near the wall of the shock waves, which, however, pulsate strongly. By disrupting the boundary layer and a complicated excitation system, large-scale near-wall turbulent vortices are simultaneously generated, and the motion dissipation of these vortices leads to an overall variation in the flow field, which generates the overall flow pulsation. A resonance phenomenon occurs when the pulsation frequency of the print matches the natural frequency of the nozzle. This could lead to more complicated circumstances or possible structural failure.
3.3. Modal Analysis
Modal analysis in the ANSYS family of products is a linear analysis. This article introduces the Block Lanczos method. The Block-Lanczos method is used for large symmetric eigenvalue problems. The Block Lanczos method uses the sparse matrix solver and overrides any solvers specified via the EQSLV command.
When designing a nozzle, a structural analysis is required to ensure that the strength of the product meets the design requirements in response to different loads, such as the chamber pressure. The structure should not break when in operational condition. The nozzle structure may be damaged by strong lateral forces resulting from this separation.
This analysis can be done in a number of ways; the simplest involves just mass, inertia, and a torsion spring on the neck as the only characteristics of the nozzle; more complex models, like the one this work examines, require more steps. The natural frequencies and mode shapes of the nozzle are first ascertained through modal analysis. Important considerations when designing the nozzle for dynamic loading conditions are the natural frequencies and mode shapes. .
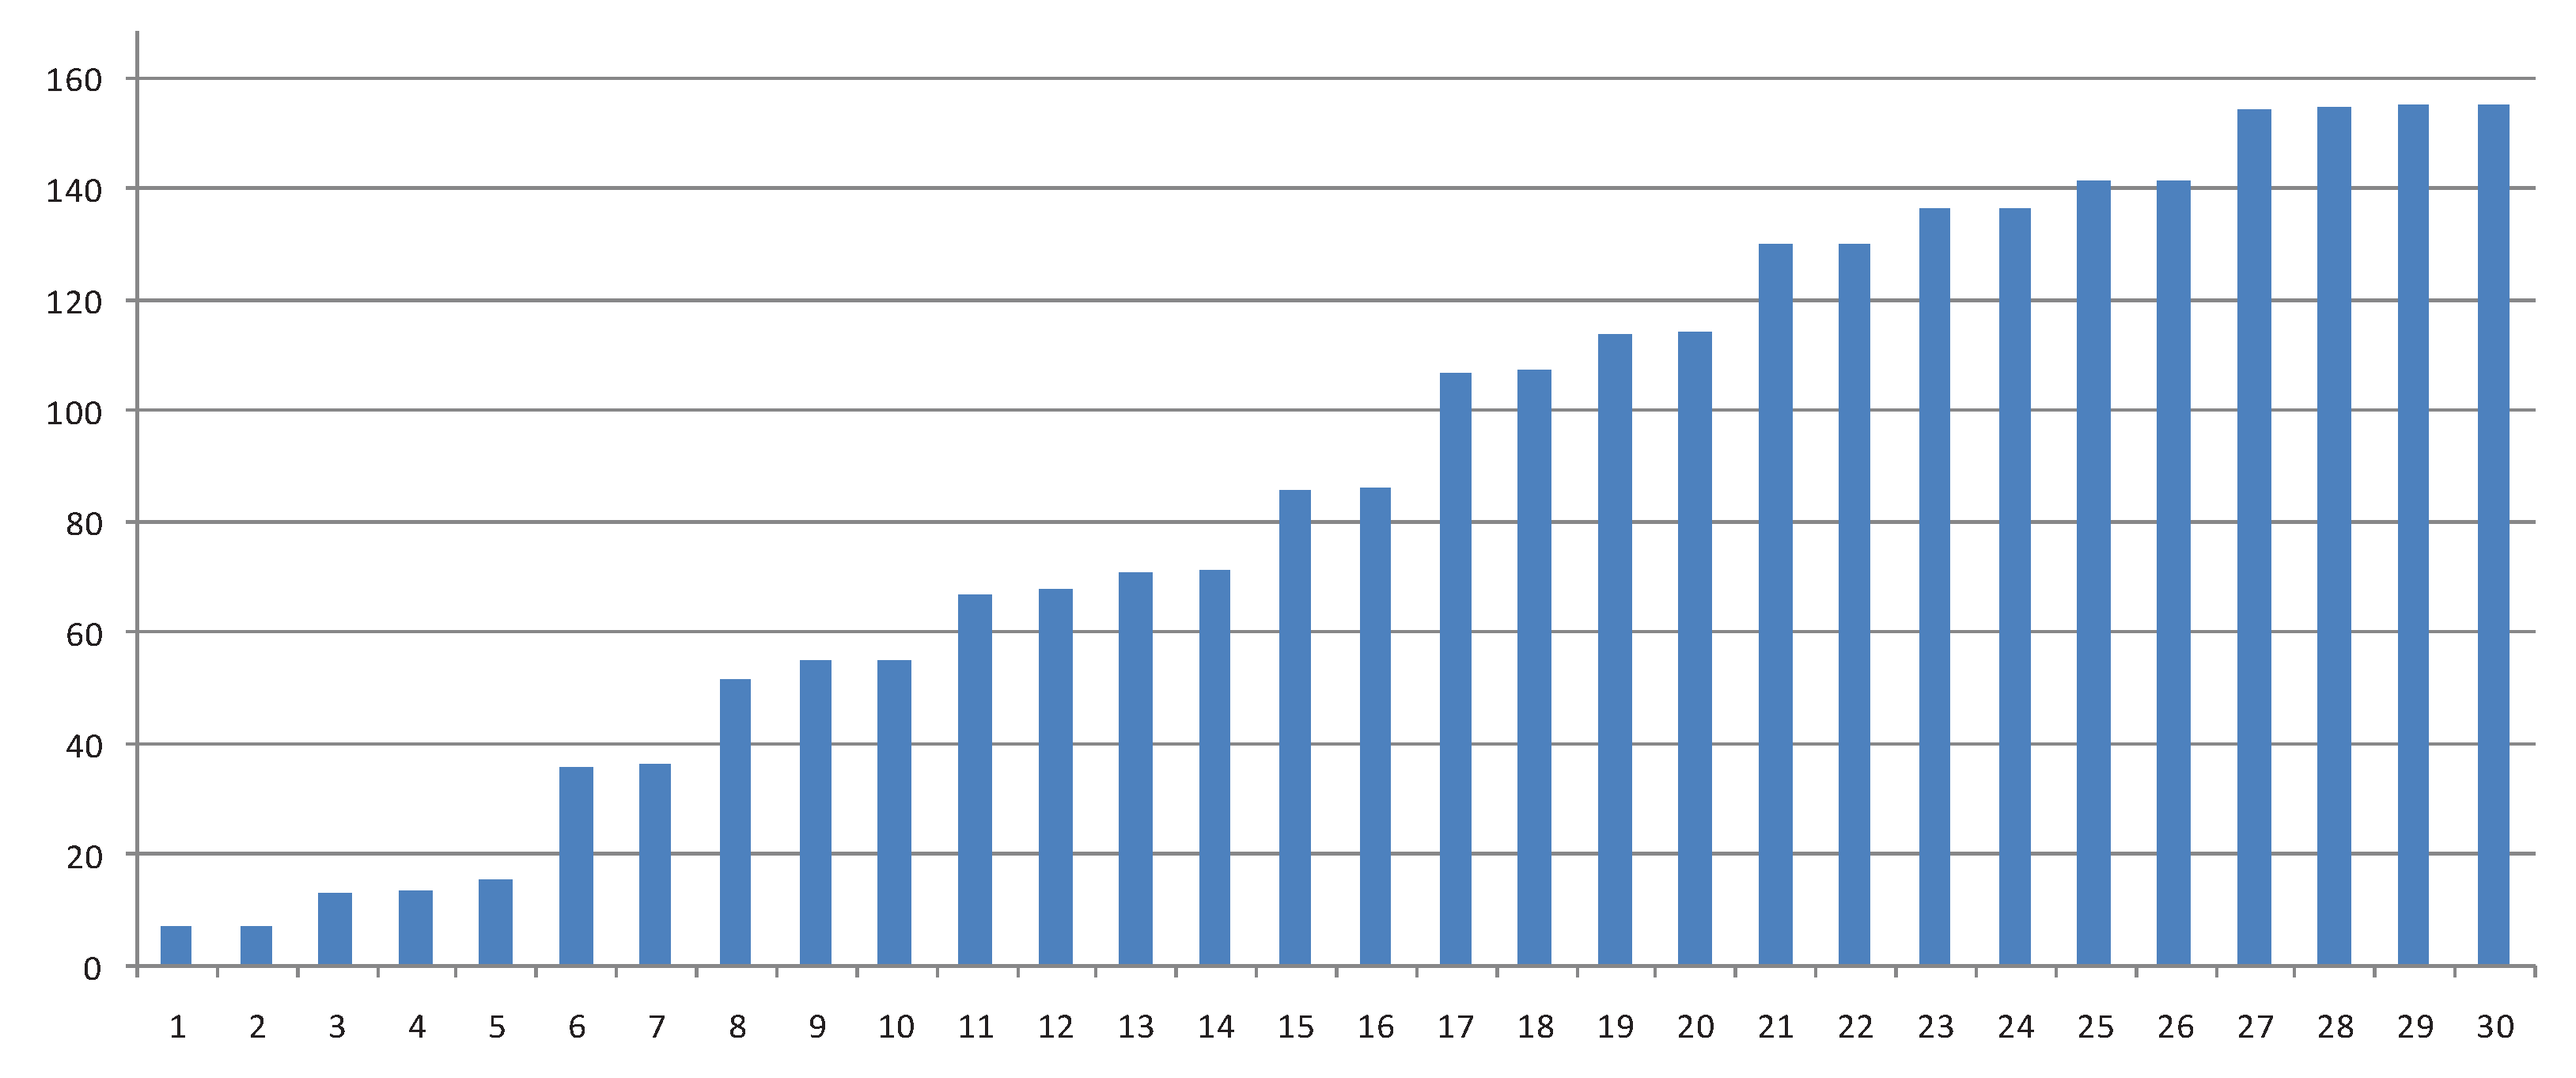
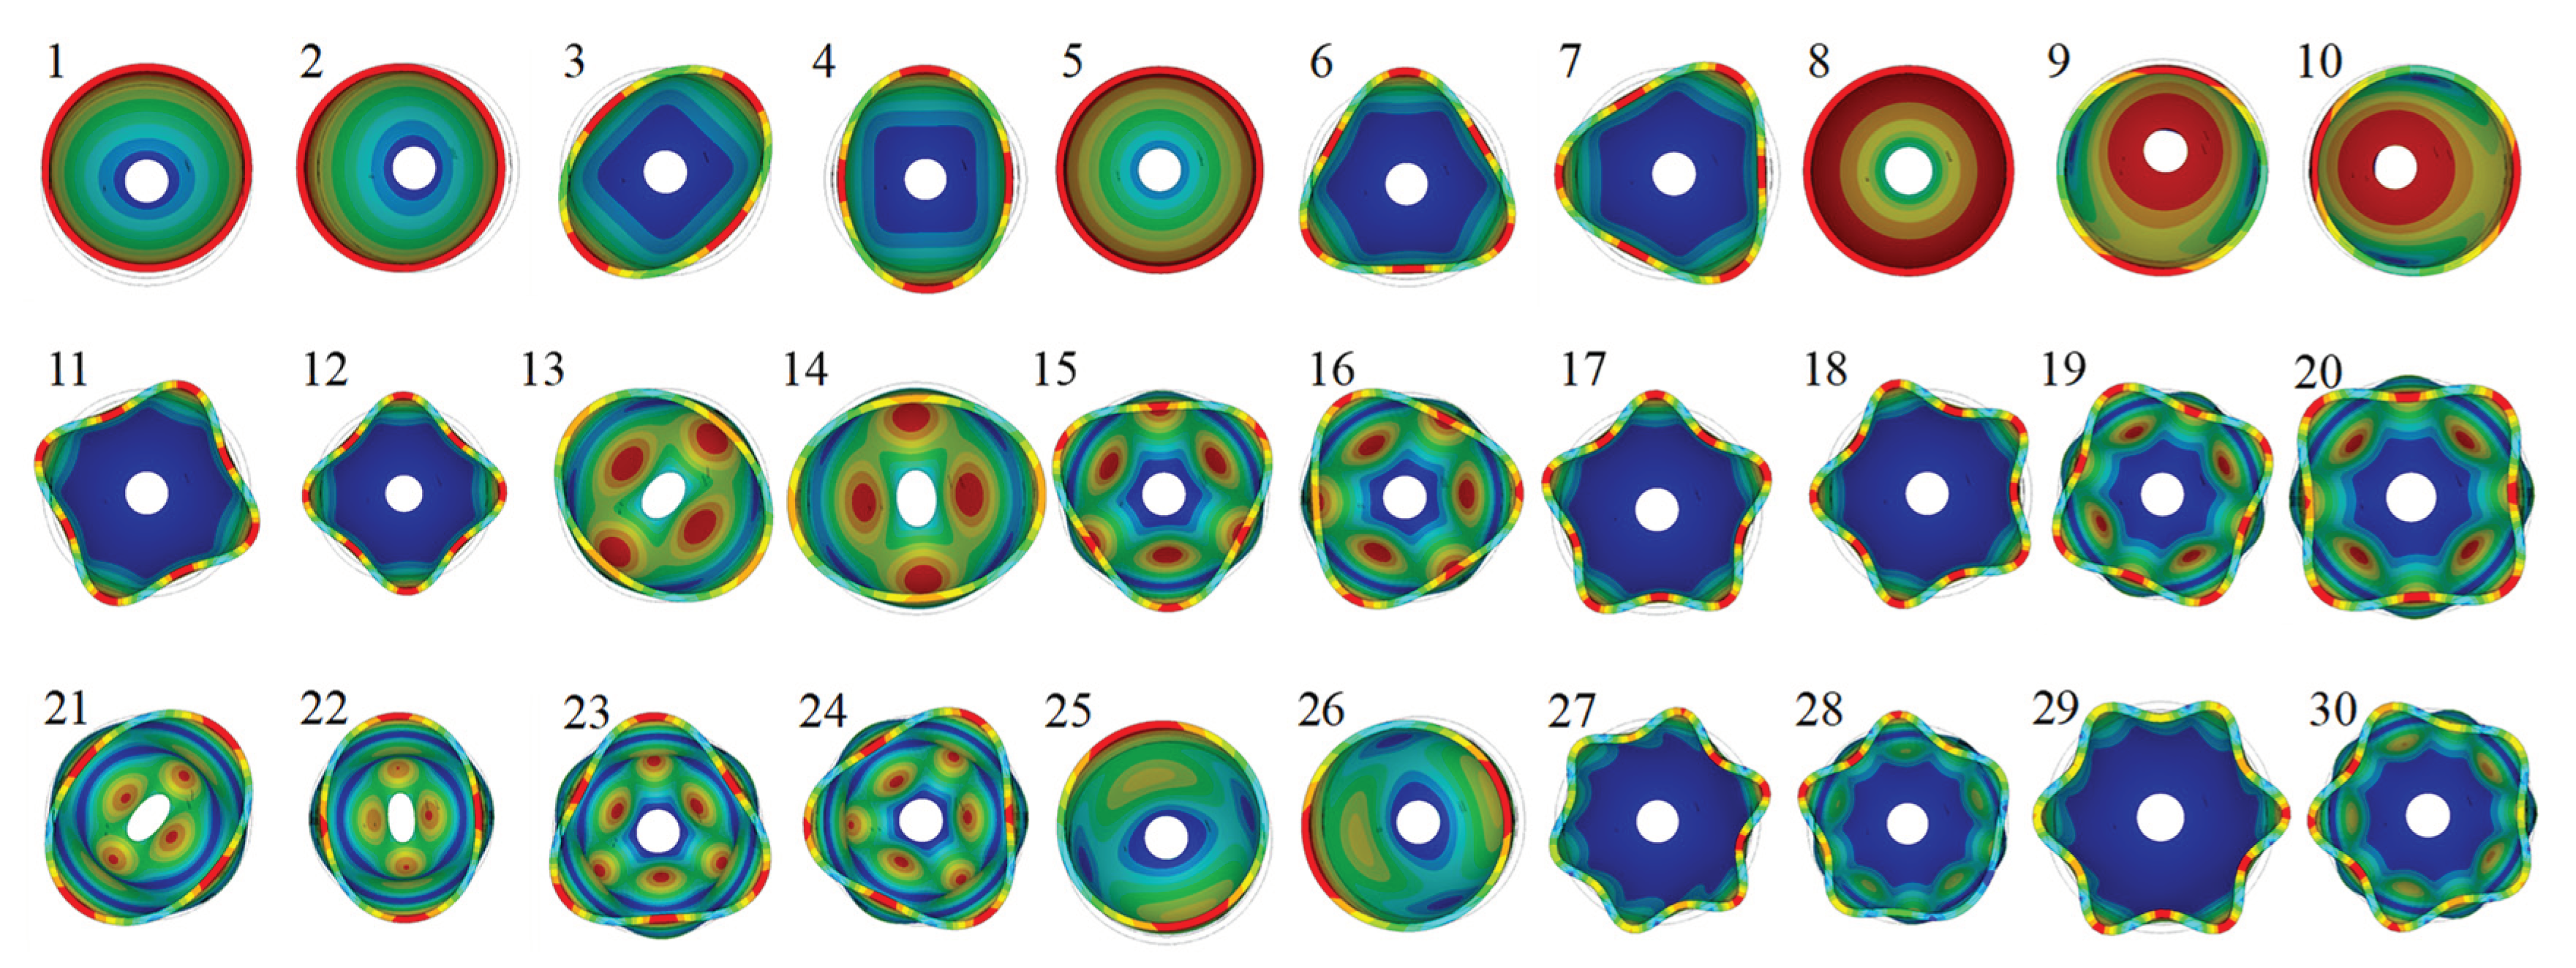
As part of this work, the first 30 natural frequencies of the characteristic modes of the nozzle are determined.
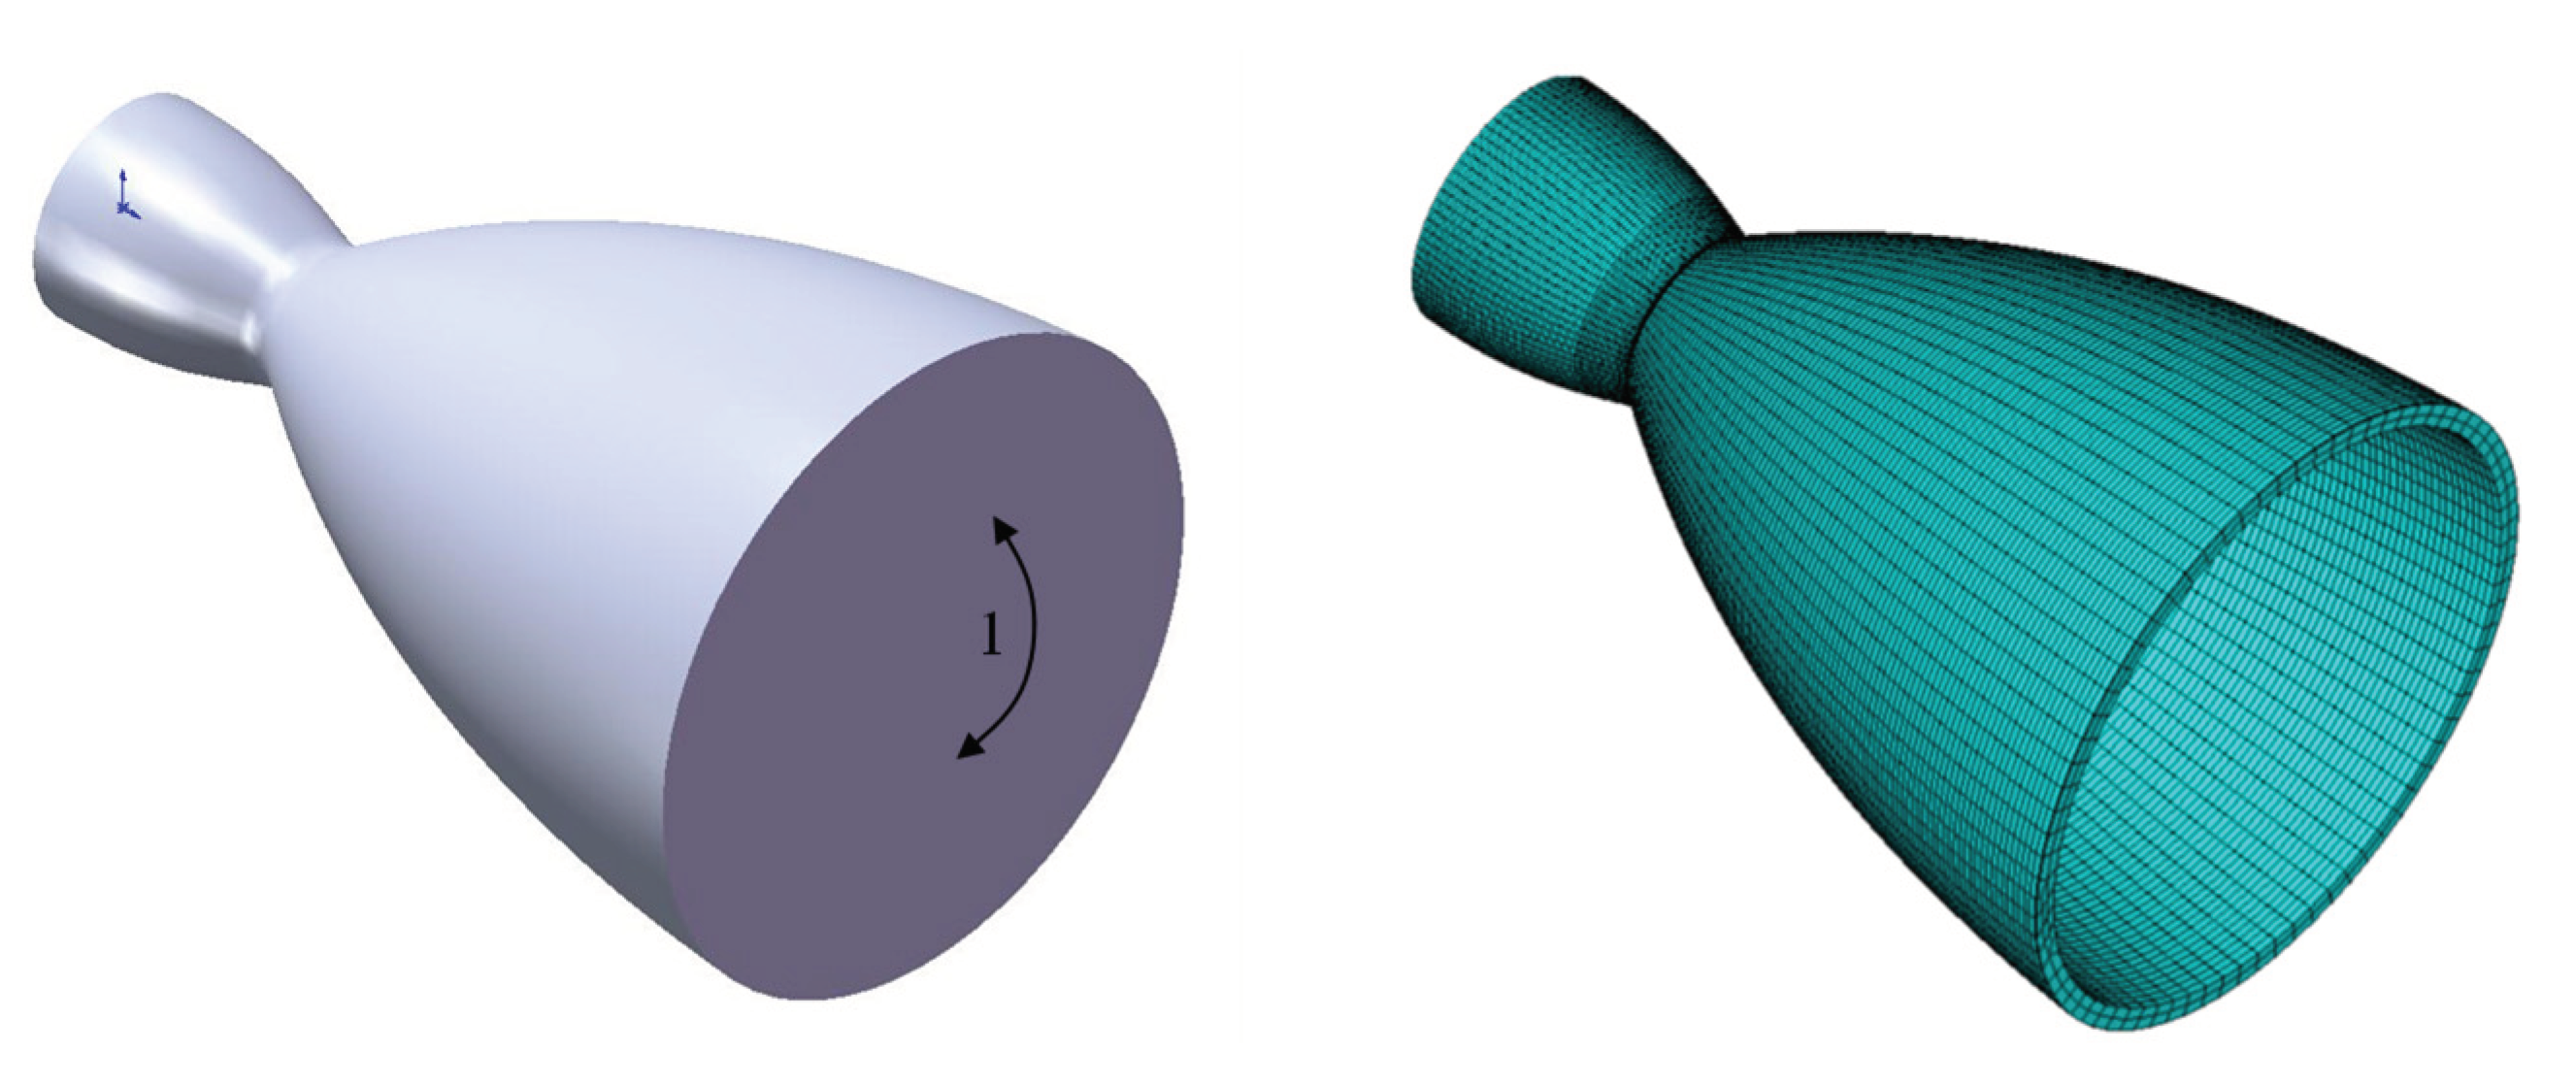
Figure 14.
The grid of the nozzle.
Figure 14.
The grid of the nozzle.
The simulation study is carried out using the eigenvalue analysis method, and as
Figure 15 shows, the first thirty modes have been selected. As the figure shows, the nozzle has sixteen modes below 100 Hz in its natural frequency. In other words, the nozzle can experience flow-related resonance in the pulsating frequency range of the pressure. Therefore, more comprehensive considerations for structural performance analysis under flow separation are required for engine design.
Figure 16 shows the modes of each order in nozzle-free mode. In the free mode of the nozzle, the modes of each order are displayed. The analysis of the maximum significance of the static deformation of the nozzle shape can be derived from the figure. This deformation occurs at the trailing edge of the nozzle.
4. Aeroelastic Coupling
4.1. Numerical Methodology (CSD)
When calculating the stress distribution of the nozzle housing, first solve the stress distribution under the action of external forces, and then solve the stress distribution by the relationship between stress and strain. The connection between external force and strain is established through the virtual working principle. The FEM method is used to analysis the structure dynamic response with the load of the flow pressure inside the nozzle. The relevant equations of motion for solid domain are listed by[
49]:
Where {Y} is the displacement vector, [M] is the mass matrix, [C] is the damping matrix, [K] is the stiffness matrix, and {F} is the force vector due to side loads.
4.2. FSI
Fluid-structure coupling (FSI) occurs when a fluid flow deforms a structure, which in turn changes the boundary conditions of the fluid flow. The deformation must be transferred to the CFD code, which corresponds to the “node displacement” quantities, while forces are transferred from the CFD to the CSD code. The systems under consideration are referred to as coupled systems, which include fluid analysis and structural analysis.
Aeroelastic Coupling(FSI):
First system: CFD, Fluid flow (Navier-Stokes equations)
Second system: CSD, Solid mechanics (equilibrium)
Quantities: Pressure (1 ! 2), deformation(2 ! 1)
Figure 17.
the parameters were exchanged between two codes(CFD and CSD).
Figure 17.
the parameters were exchanged between two codes(CFD and CSD).
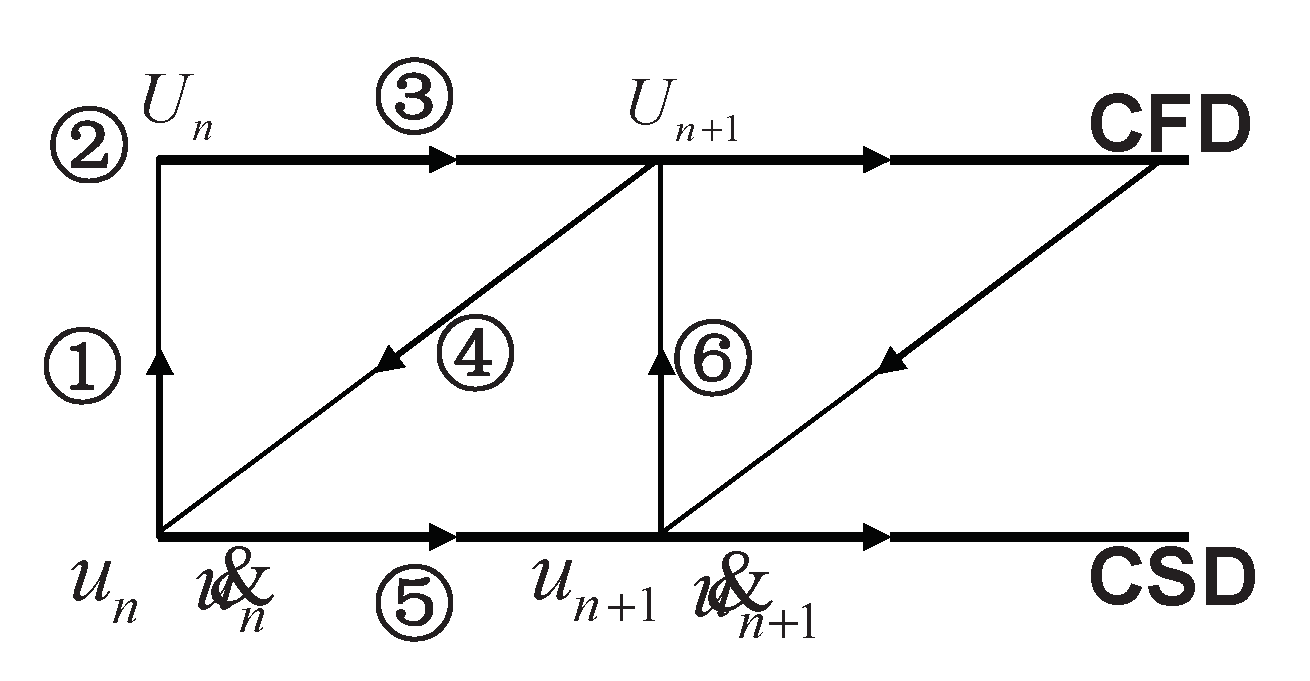
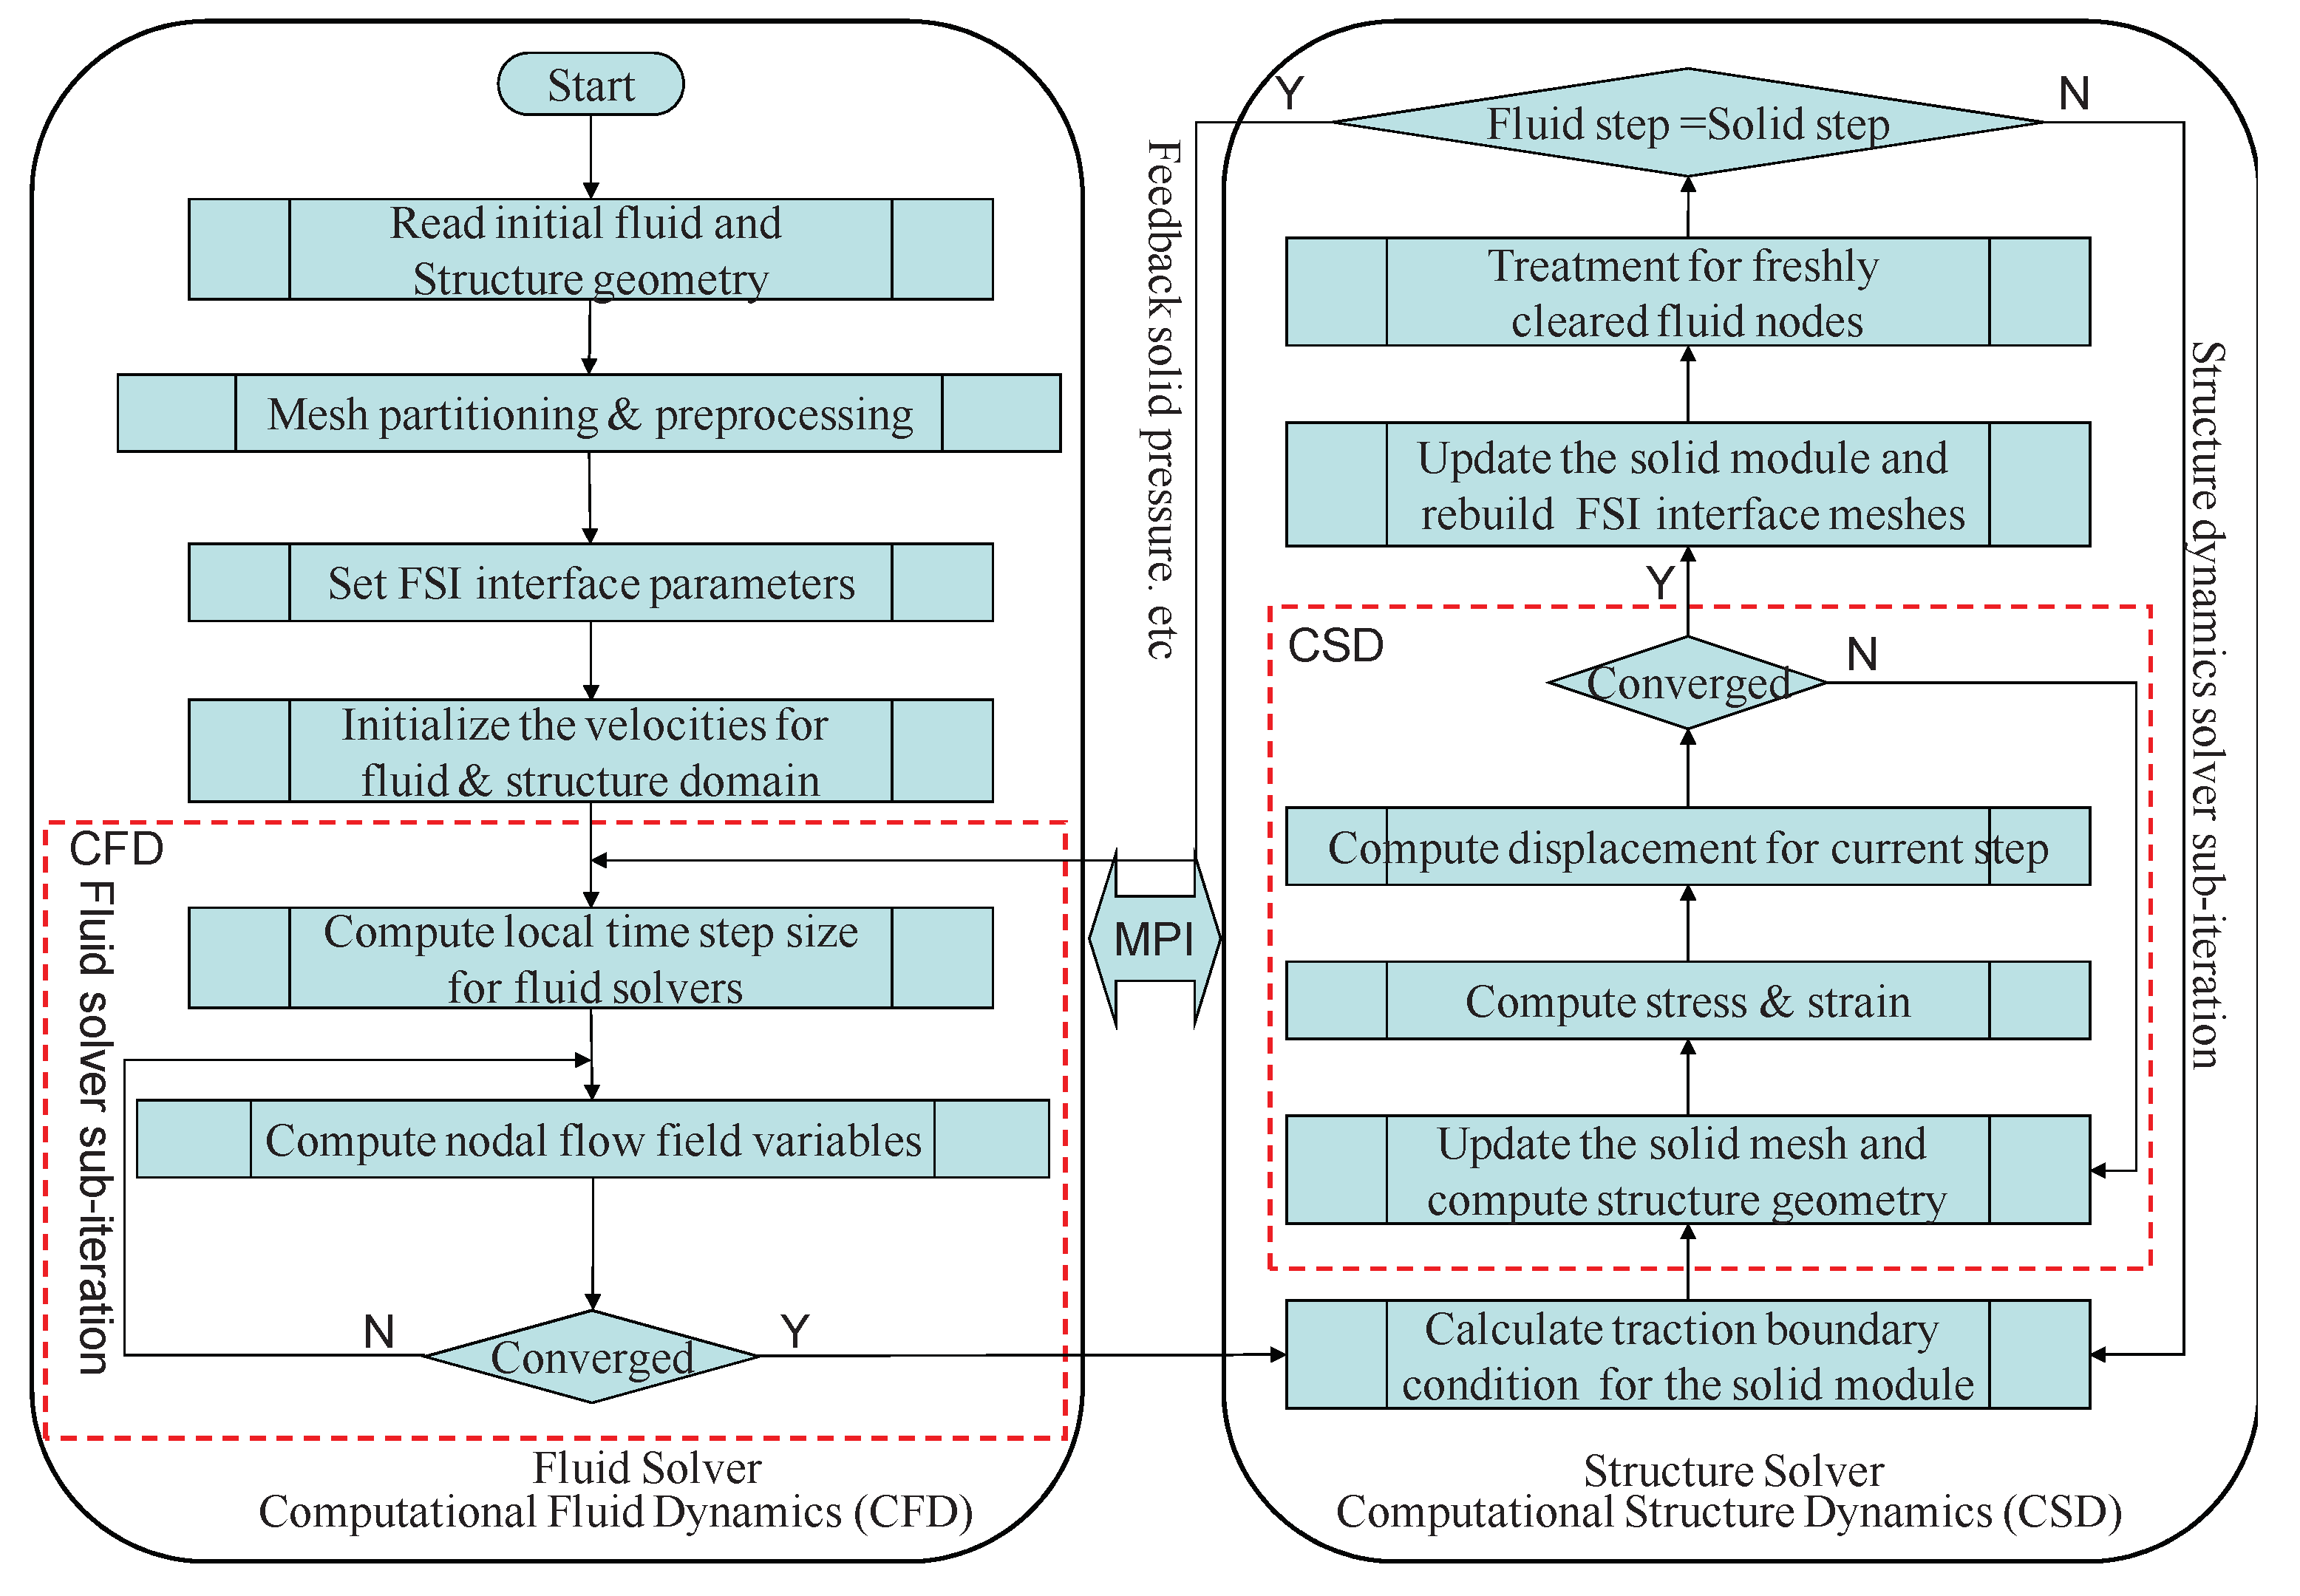
In this work, an alternative approach of weak coupling method is used to obtain the numerical result of nozzle aeroelasticity. Each calculation area is solved individually, the variables of the boundaries of the different areas are swapped and inserted into the equations of the other problem.
Figure 18.
Initial exchange and resulting coupling algorithms for two codes with “exchange before solution”.
Figure 18.
Initial exchange and resulting coupling algorithms for two codes with “exchange before solution”.
(i) Compute the structural deformation of the solid to the fluid domain.
(ii) The fluid domain mesh grid reconfiguration and updating the variables of the FSI boundary
(iii) Updating the fluid system and simulation the flow field.
(iv) Updating the new fluid pressure of the FSI boundary (and stress field) into a structural load.
(v) Advancing the structural system under the given pressure loads.
In this algorithm, Computational Fluid Dynamics (CFD) and Computational Structure Dynamics (CSD) run simultaneously. For simplicity, one can imagine the basic algorithm as if there were no “competition” between the codes, i.e. H. at any given time only one of them is running. This can be controlled via MPI. A schematic diagram is shown in
Figure 19.
Constructing the geometry for aeroelastic computations and also set appropriate boundary conditions and initial conditions. First get the result of the flow field, then get the pressure distribution of the wall. The structure simulation analysis of nozzle is carried out with pressure as the load. After the simulation the structural deformation is obtained. The mesh grid reconfiguration and repeat the CFD. Iterate until the calculation is complete.
4.3. Result Disscuss
The VAC S1 nozzle is again used for fluid structure interaction analysis. The Structure physical parameter for nozzle walls are listed in
Table 3.
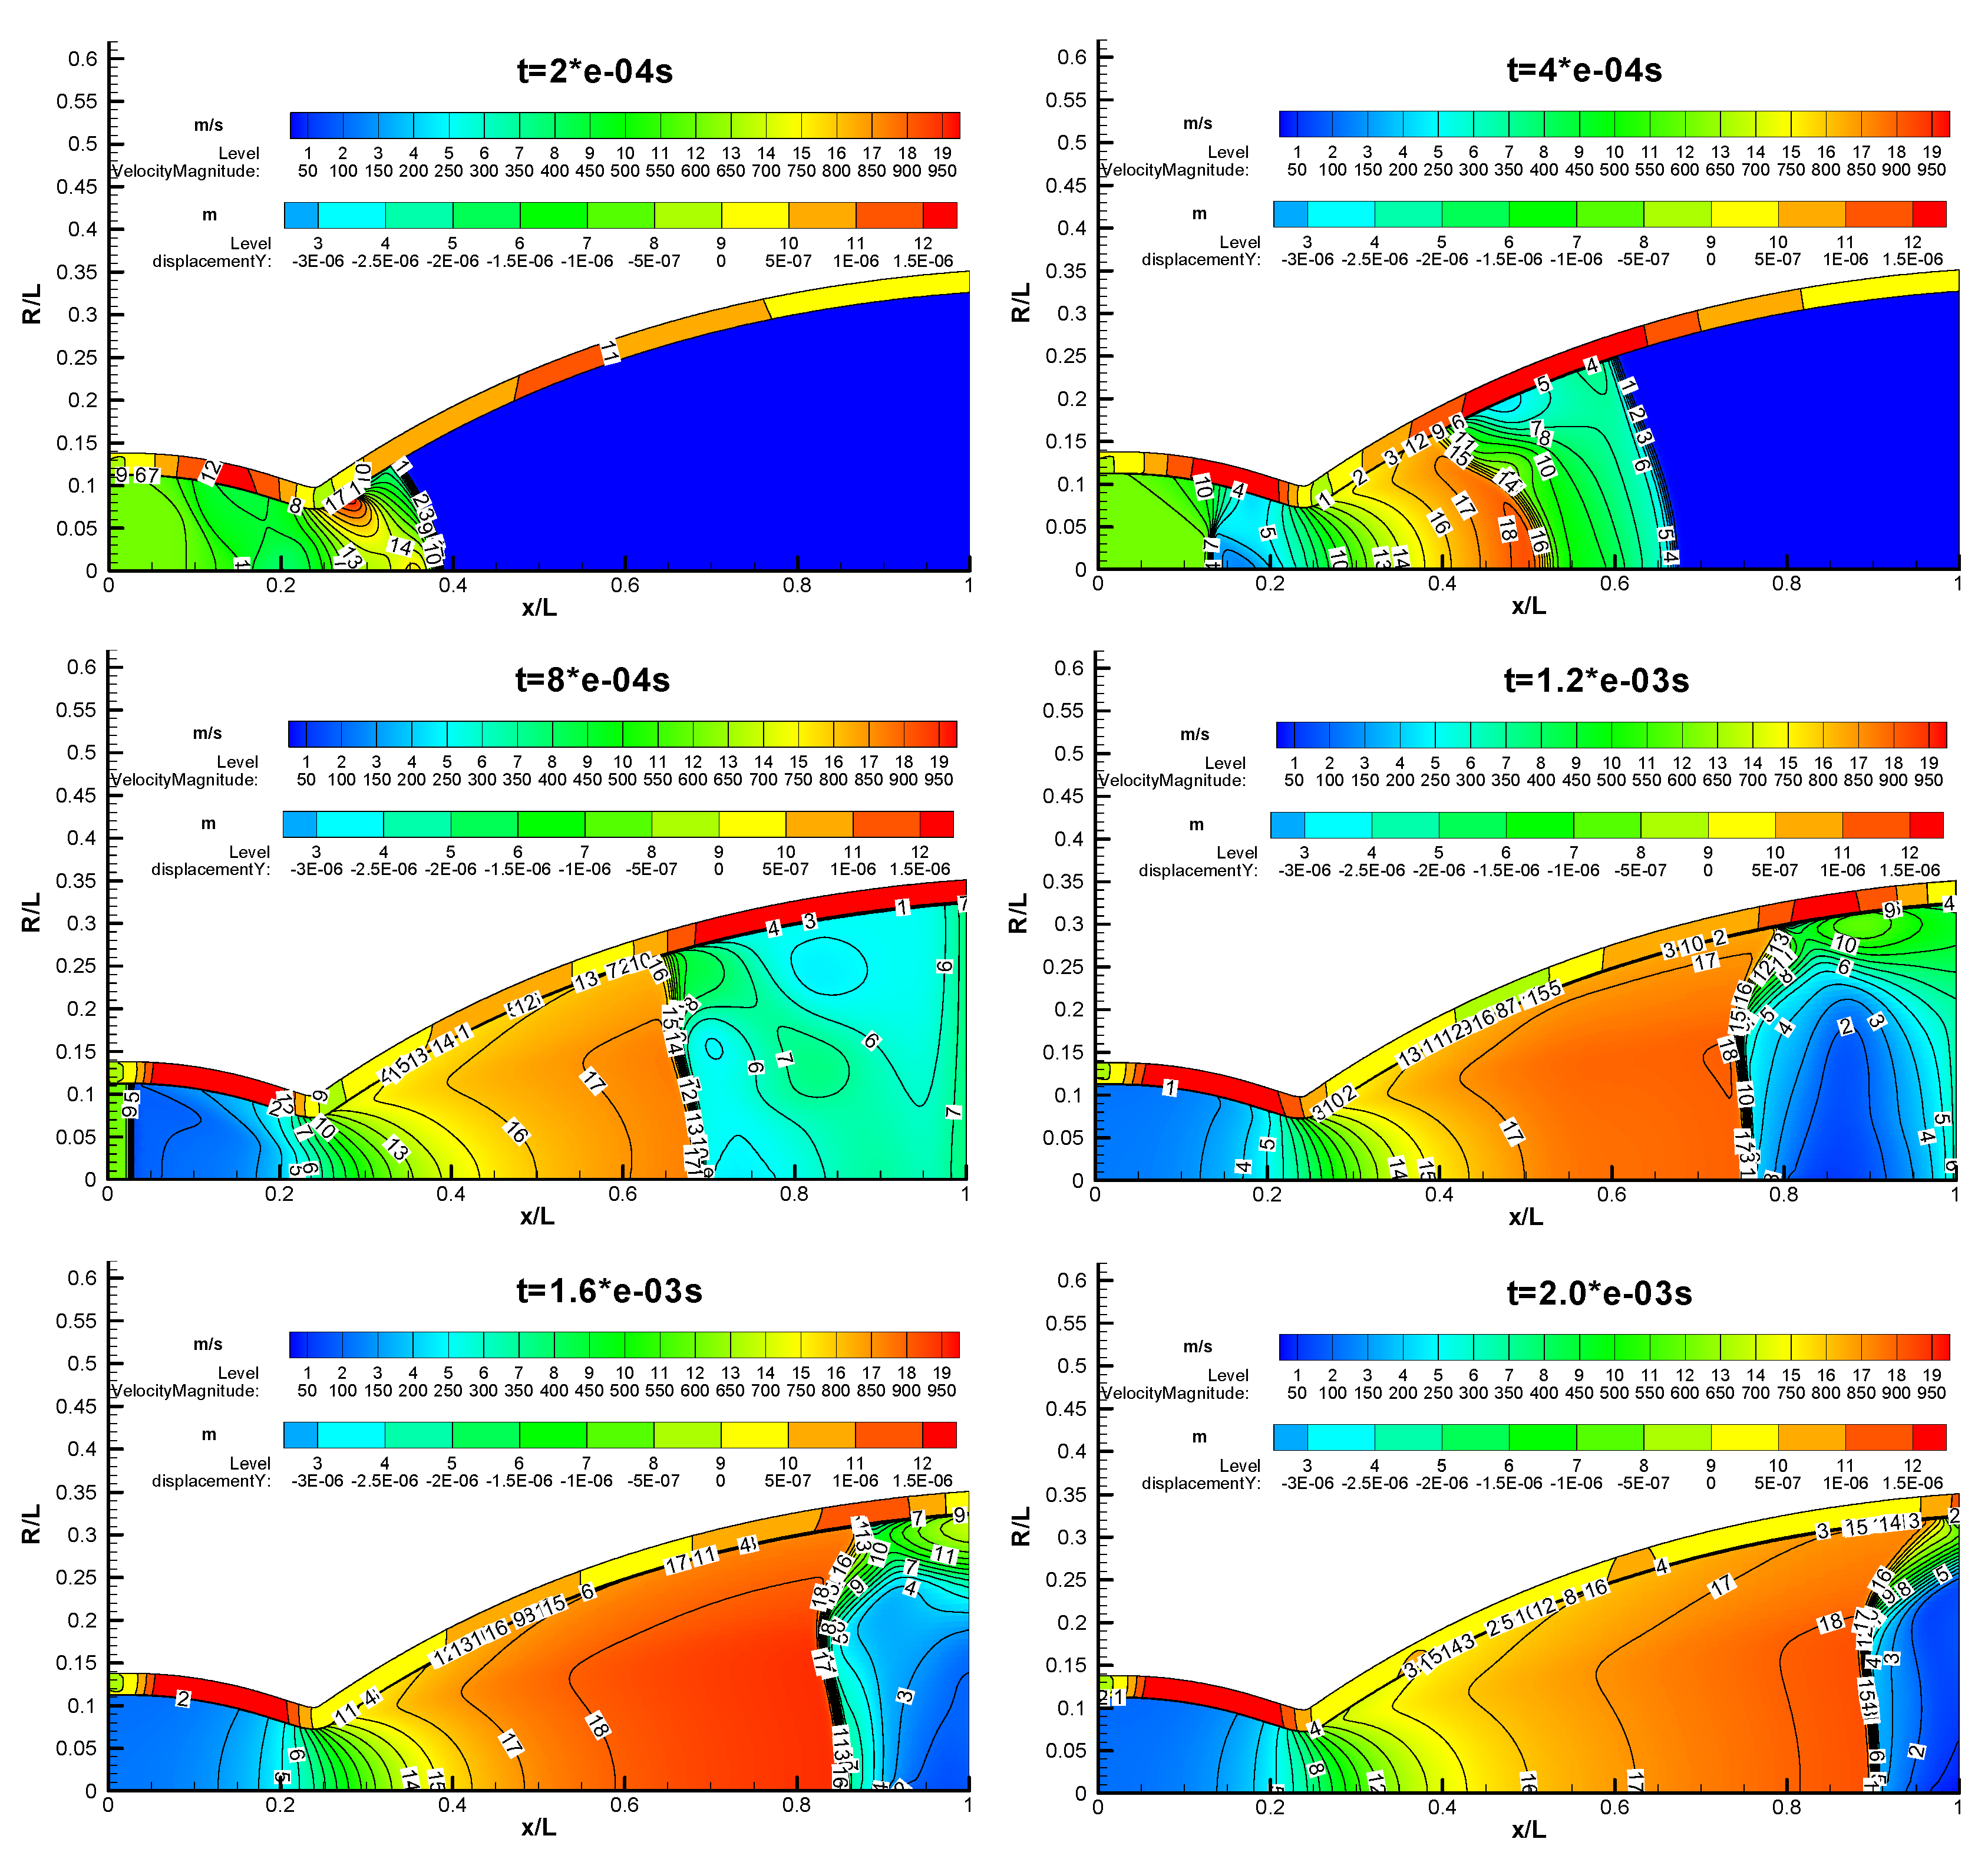
Figure 20 shows the calculated results for VAC-S1 with PR = 30 for uniform materials during different time periods. The simulation shows that the movement of the nozzle during the simulation time is about 1e-06m, which is very small. The reason is that the combustion pressure is low (3MPa), the thickness of the nozzle is large, and the simulation time is short, only 2e-04 seconds.
From the velocity contour we can see, the shock formed is moving quickly through the stagnant low-pressure medium. In addition, a secondary shock wave traveling to the left is created, which is carried to the right due to the supersonic carrier flow. This shock wave combines the high Mach number, low pressure flow, lower velocity, and high pressure gas behind the primary shock.

