1. Introduction
Dynamic virtual testing by Hardware in the Loop (HIL) real time (RT) simulation systems is common to limit physical tests to the minimum necessary to validate and verify control algorithms, logics and software, both under normal and emergency conditions. HIL software (SW) & computing hardware (HW) are commissioned during new projects development and used during and for control systems verification and tuning, until the system is commissioned and delivered.
This activity demands for high accuracy whole system models which are becoming ever and ever more similar to their physical original, so that the former are often referred to as “digital twins” of the latter.
The investments in the development of HIL SW & HW, tuning of the virtual system, as well as that in their users training are important and could have higher return if, besides the originating purpose, the HIL facility or even just the already validated offline source model were exploited to simulate faulty conditions. Many of these may indeed be seldom observable in the real system, yet they must be detected in advance and recognized, by the same degree of confidence as the most common ones.
HIL models are not convenient to implement a model-based diagnostic system because of their complexity and would imply excessive computing requirements for online diagnostic processes.
Powerful diagnostic methods proved effective in detecting, isolating and prognosing faults by (small scale/subsystem) models-based and/or data-driven approaches.
Data driven diagnostic methods have reached a mature development, in various sectors from space to automotive and energy systems. They proved capable of early detecting slowly varying deviations from nominal patterns of signals, even without exploiting a priori knowledge of their nature and behavior.
These methods rely on the vast amount of data logged from the real systems that are ever and ever richer of monitoring telemetries that are worth being exploited.
Their information quality and confidence rely on the availability of historical records of normal and anomalous conditions; the latter, in particular, to validate fault isolation and remaining useful life (RUL) estimate methods.
Similarly to other large critical systems, faults are relatively rare in gas turbines (GT) operation and would require years of operation to collect significant statistics within a homogeneous set of GT units; therefore, it is often difficult to collect enough data on anomalous situations to widely validate fault detection and isolation while limiting false positives.
For each diagnostic application it is necessary to trade-off between timely warning and rate of false positive to optimize the economics of these automated diagnostics, which is a difficult to achieve in lack of large enough data records.
On the other hand, HIL models need to be realistic to be effective, thus have the possibility to simulate also anomalous conditions of the physical system by no or minimum upgrade.
Data generated by single or multiple highly accurate HIL models and simulated failure modes could be used to configure (i.e., train and validate) a diagnostic and prognostic platform for the same physical system under as many operational conditions and maneuverings scenarios as needed.
Generating virtual data sets for diagnostics does not necessarily require real time running of the HIL model, since offline simulations by the same models, running on stand-alone workstation faster than real time and including also a simulated control system, could be used for the same scope. Real time simulations by the HIL facility would instead be needed when there is the suspect that the real GT control system (GTCS) delays, logics and control reaction features can influence the specific fault effects dynamics.
Iterative simulations by the high accuracy models developed for HIL tests would allow exploring operational system state domains or transients that are rarely observed in reality. This kind of virtual tests would allow identifying the signals that are most correlated and that could be selected to setup data-based models of parts or subsystems that are more suitable than the whole HIL model for online diagnostics, as well as identifying the features and trends that are most symptomatic of anomalous conditions.
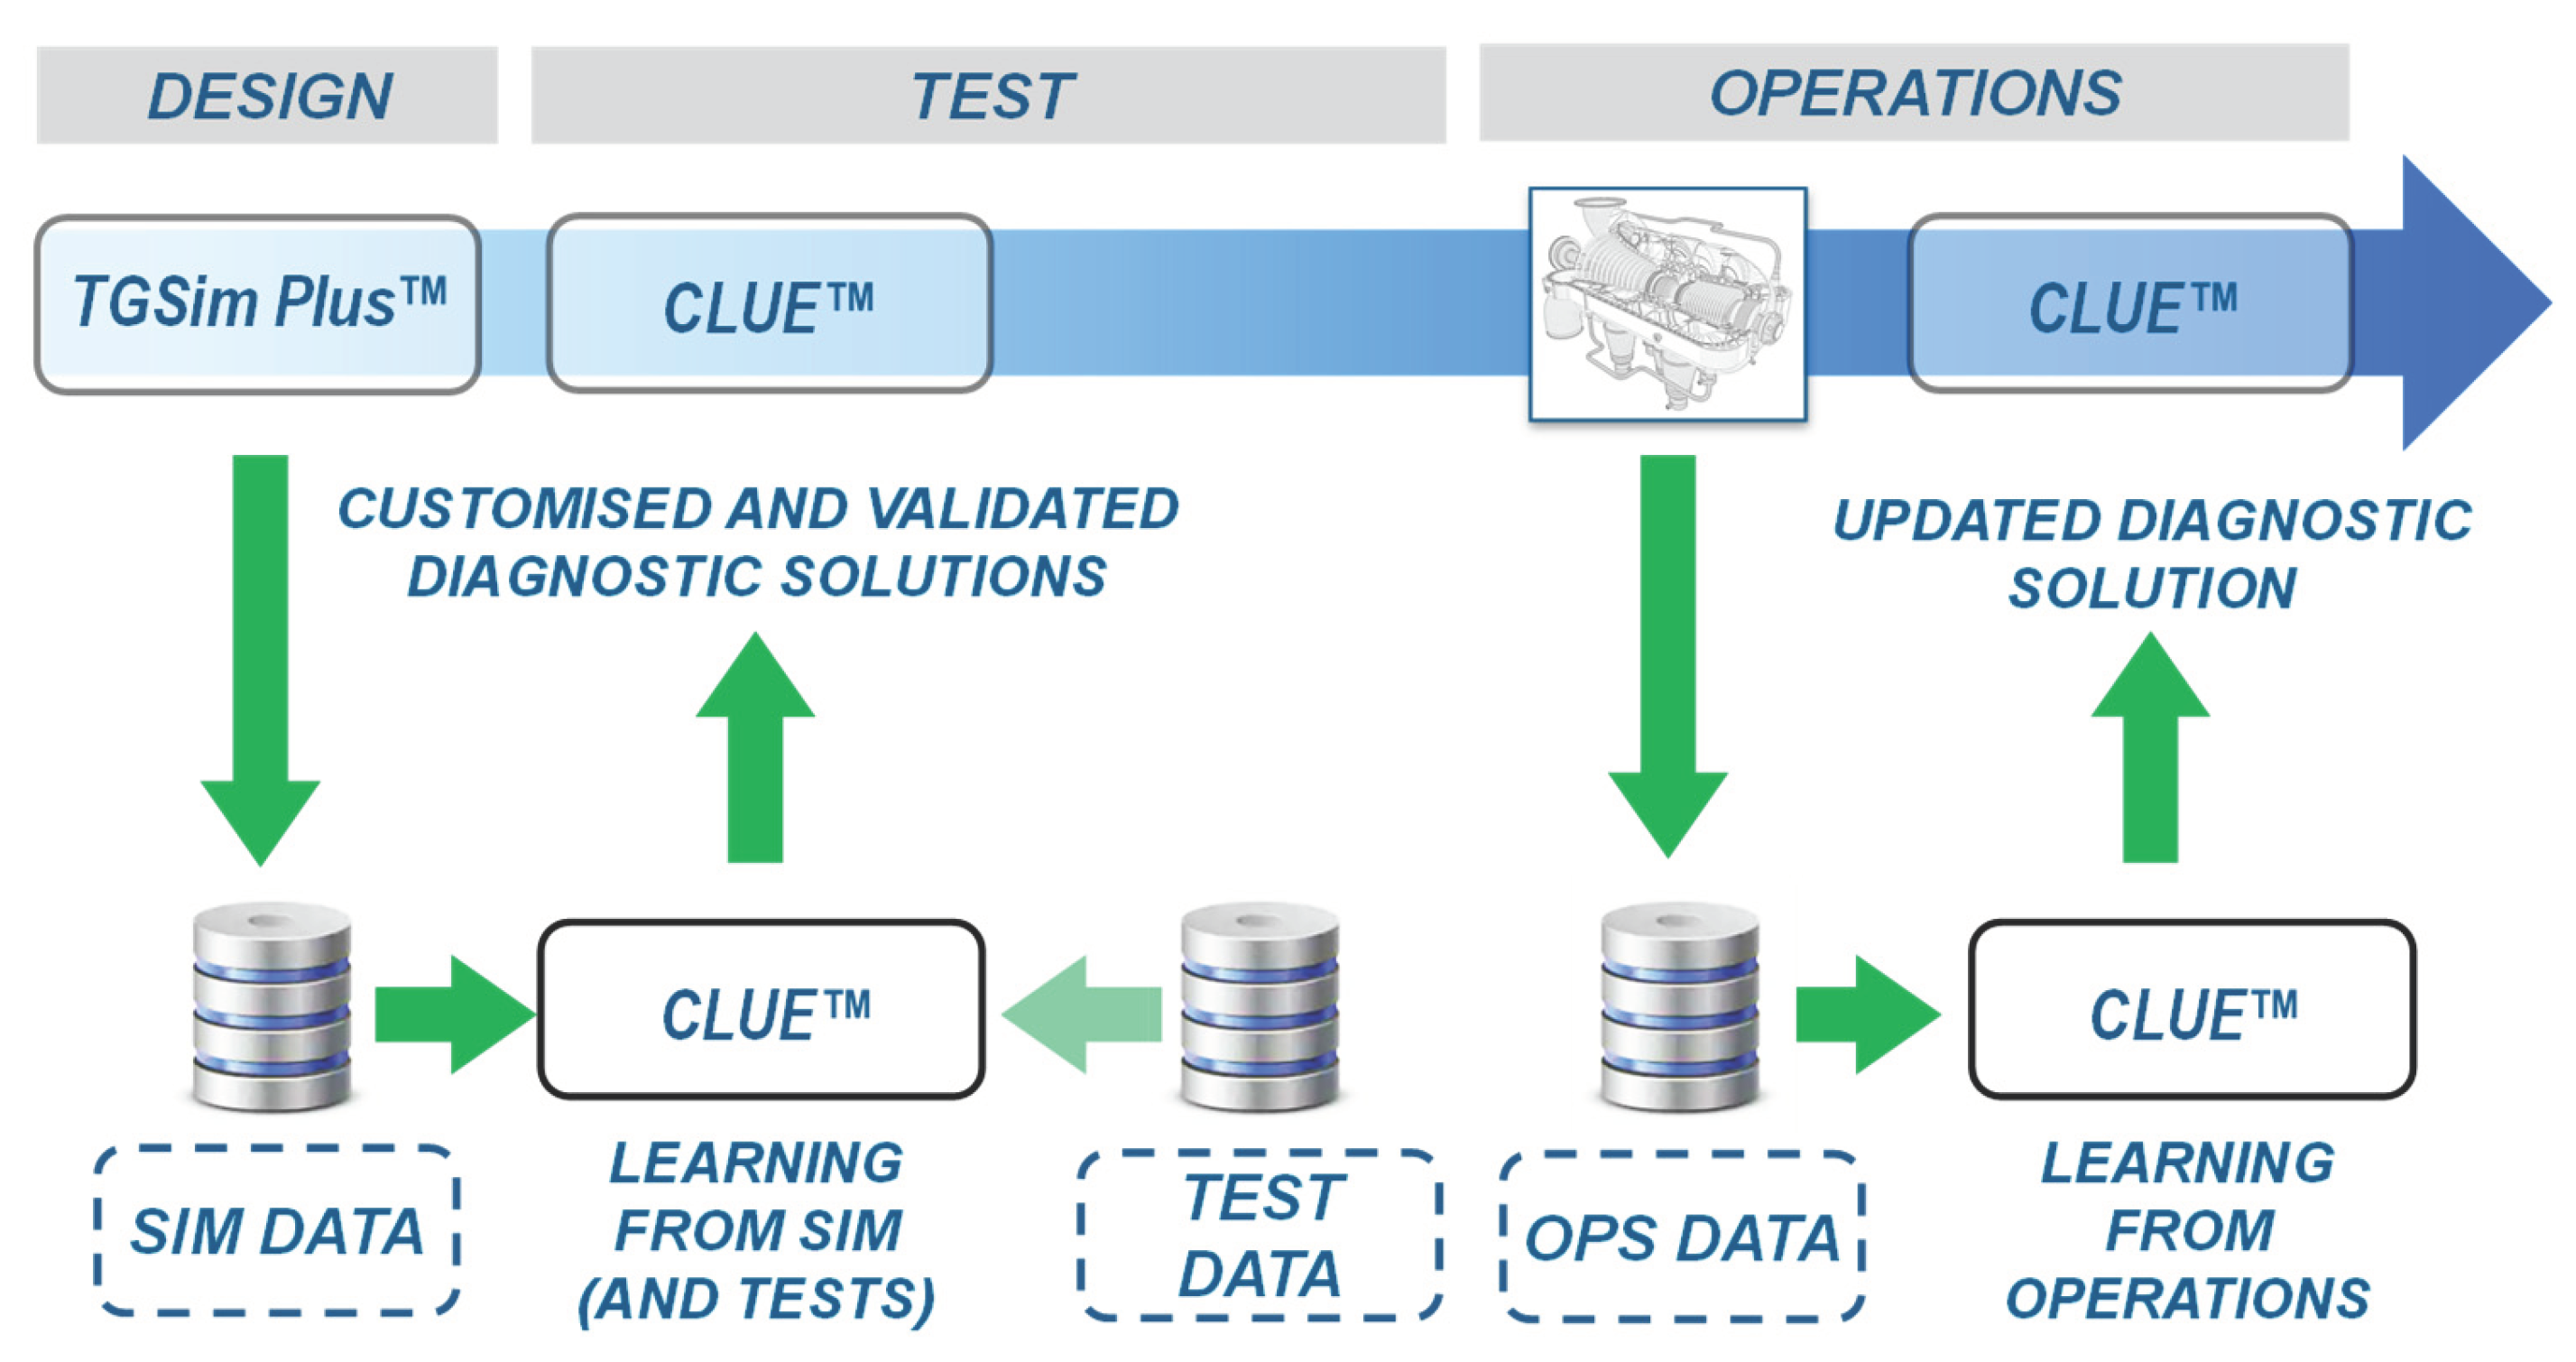
The intended HIL facility and/or models exploitation for diagnostics could well be seen also as an evolving aid to operators, considering the gradual use and addition to the data set of that deriving from the early system tests up to the operational phase, as depicted in
Figure 1.
The authors and their company have been deeply involved in both dynamic simulation, HIL models and predictive diagnostics applied to several systems including also large compression facilities and gas turbines.
In particular they developed a full model of a power generation GT plant, including all fluids management auxiliaries and the electrical generator and starter motor, integrated in a MATLAB
®/Simulink
® simulation suite, referred to as TGSim Plus™ [
1,
2,
3,
4], and full process and turbomachines simulators of Organic Rankine Cycle (ORC) to recover heat from GTs exhaust [
5] and conventional steam Rankine cycle processes and turbines.
In parallel, they developed and applied large scale predictive diagnostic suites, among which that referred to as CLUE™ [
18], implementing fault detection, isolation and remaining useful life (RUL) prediction, exploiting also machine learning methods, which are currently applied to operational industrial vehicle fleets and space satellites constellations
The paper discusses the main characteristics of the modelling software and typical results of steady state and start-up transient simulations of a heavy-duty gas turbine and how these could be used for predictive diagnostics setup.
3. HIL models use extension
3.1. HIL Models for Gas Turbines
3.1.1. General
The TGSim Plus™ suite allows building custom made whole GT system models and simulate their steady state and transient conditions, such as complete start-up & shutdown operations as well as emergency, contingent operations and artificially injected fault scenarios.
Auxiliaries are an important part of the real gas turbine, both from the control test and anomaly detection points of view, that are simulated by TGSim Plus™. They include fuel gas, purge air, cooling and sealing air, compressed air, GT casing cooling air, lube oil, hydraulic oil, fuel oil, water injection.
When referring to full dynamic modelling the authors mean the implementation of lumped process systems components described by ordinary differential equation sets (ODE) describing mass and energy balances at each lumped volume (or node) and momentum and energy balances at lumped flow restrictions, either of constant parameters (e.g., concentrated head loss elements or equivalent to sections of piping between subsequent lumped volumes). This modelling approach is state of the art in thermodynamic processes simulation [
6]. It is also referred to as zero-dimensional (D-0) simulation approach as the properties of the fluid in each lumped element are assumed homogeneous, i.e., with no special dependence within each element. The spatial dimension effects are dealt with by the equivalent parameters’ definition and extraction (e.g., restriction admittance representing long piping sections) and by suited splitting into a sufficient number of lumped volumes of large elements or long piping, where needed.
The behavior of components with complex fluid dynamics, such as turbines or compressor vanes is considered and modelled by maps usually originated by CFD calculations and scaling, provided or within the proprietary knowledge of the user organization.
The MATLAB®/Simulink® environment is a state-of-the-art software suite where the ODEs inherent to the model blocks are solved by several and robust numerical approaches.
The implemented models are then solved and run either faster or in real-time simulation mode by millisecond or lower time-step scale, following the responsiveness nature (i.e., numerical stiffness) of the system modelled.
The TGSim Plus™ suited consists of data management tools and customized libraries of replicable modular components that users can exploit to build up their specific integrated system.
Steady state simulations are actually dynamic themselves as the model runs in the time domain, in this case under constant boundary conditions (e.g., environmental conditions and controllers set points)
Transient conditions, typical of real operations are deviations from a given starting steady state (e.g., rest or a previous operational mode) and are solved in sequence with the former, in seamless mode, whether they are made offline or online, through the HIL platform.
TGSim Plus™ accurately simulates GT and Auxiliary systems dynamics and all interactions among the subsystems. As an example, an anomalous position or jamming of a fuel gas valve, wherever in its supply system, causes flow and feed pressure changes that determine heat rates at the combustor different from the expected values, which would ultimately impact the behavior of the main process and the generated power.
This capability not only allows using the RT simulator to check the correct reaction logics to this event by the GTCS, but it is evidently a key factor to simulate cascade events in faulty conditions.
More in general RT-HIL simulation workflows include pre-tuning and/or verification of the control system functions and parameters (e.g., gains, thresholds, ramp rates), optimization of operation strategies and check of control elements design and size (e.g., valves and associated pipilng) under realistic conditions ranges, much wider than the normal and off-design scenarios used in the design phase.
Performing all these activities in a lab environment and prior to the GTCS coupling with the real turbomachine and plant is less costly both directly and in terms of avoided losses of costly equipment if poorly controlled under an unexpected scenario.
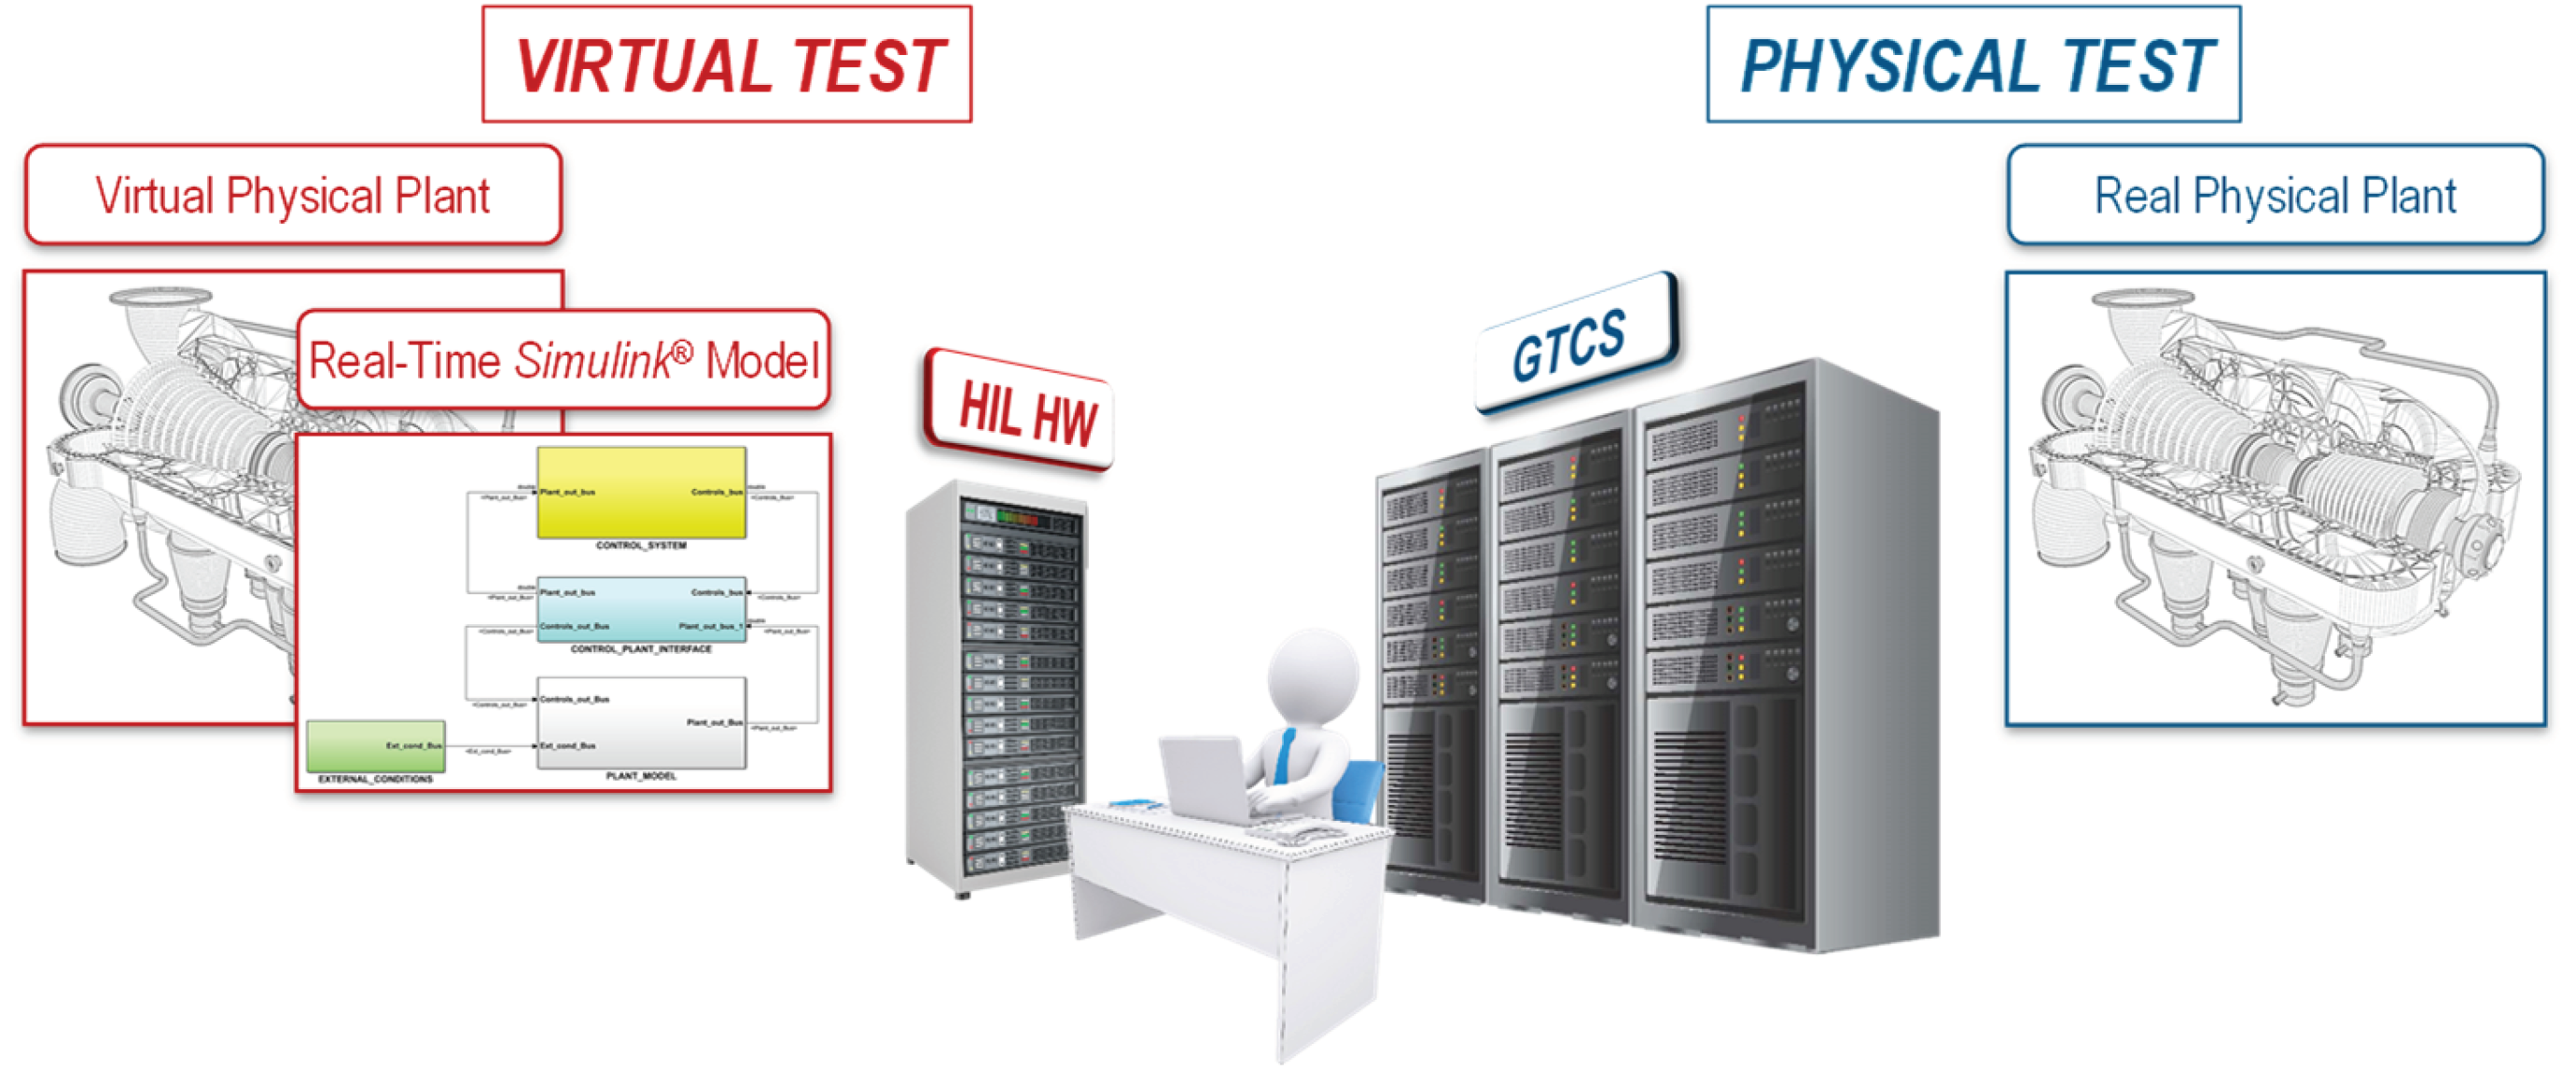
Figure 2.
Typical HIL model setup for a gas turbine control system test [from
Figure 1 in 2, 4].
Figure 2.
Typical HIL model setup for a gas turbine control system test [from
Figure 1 in 2, 4].
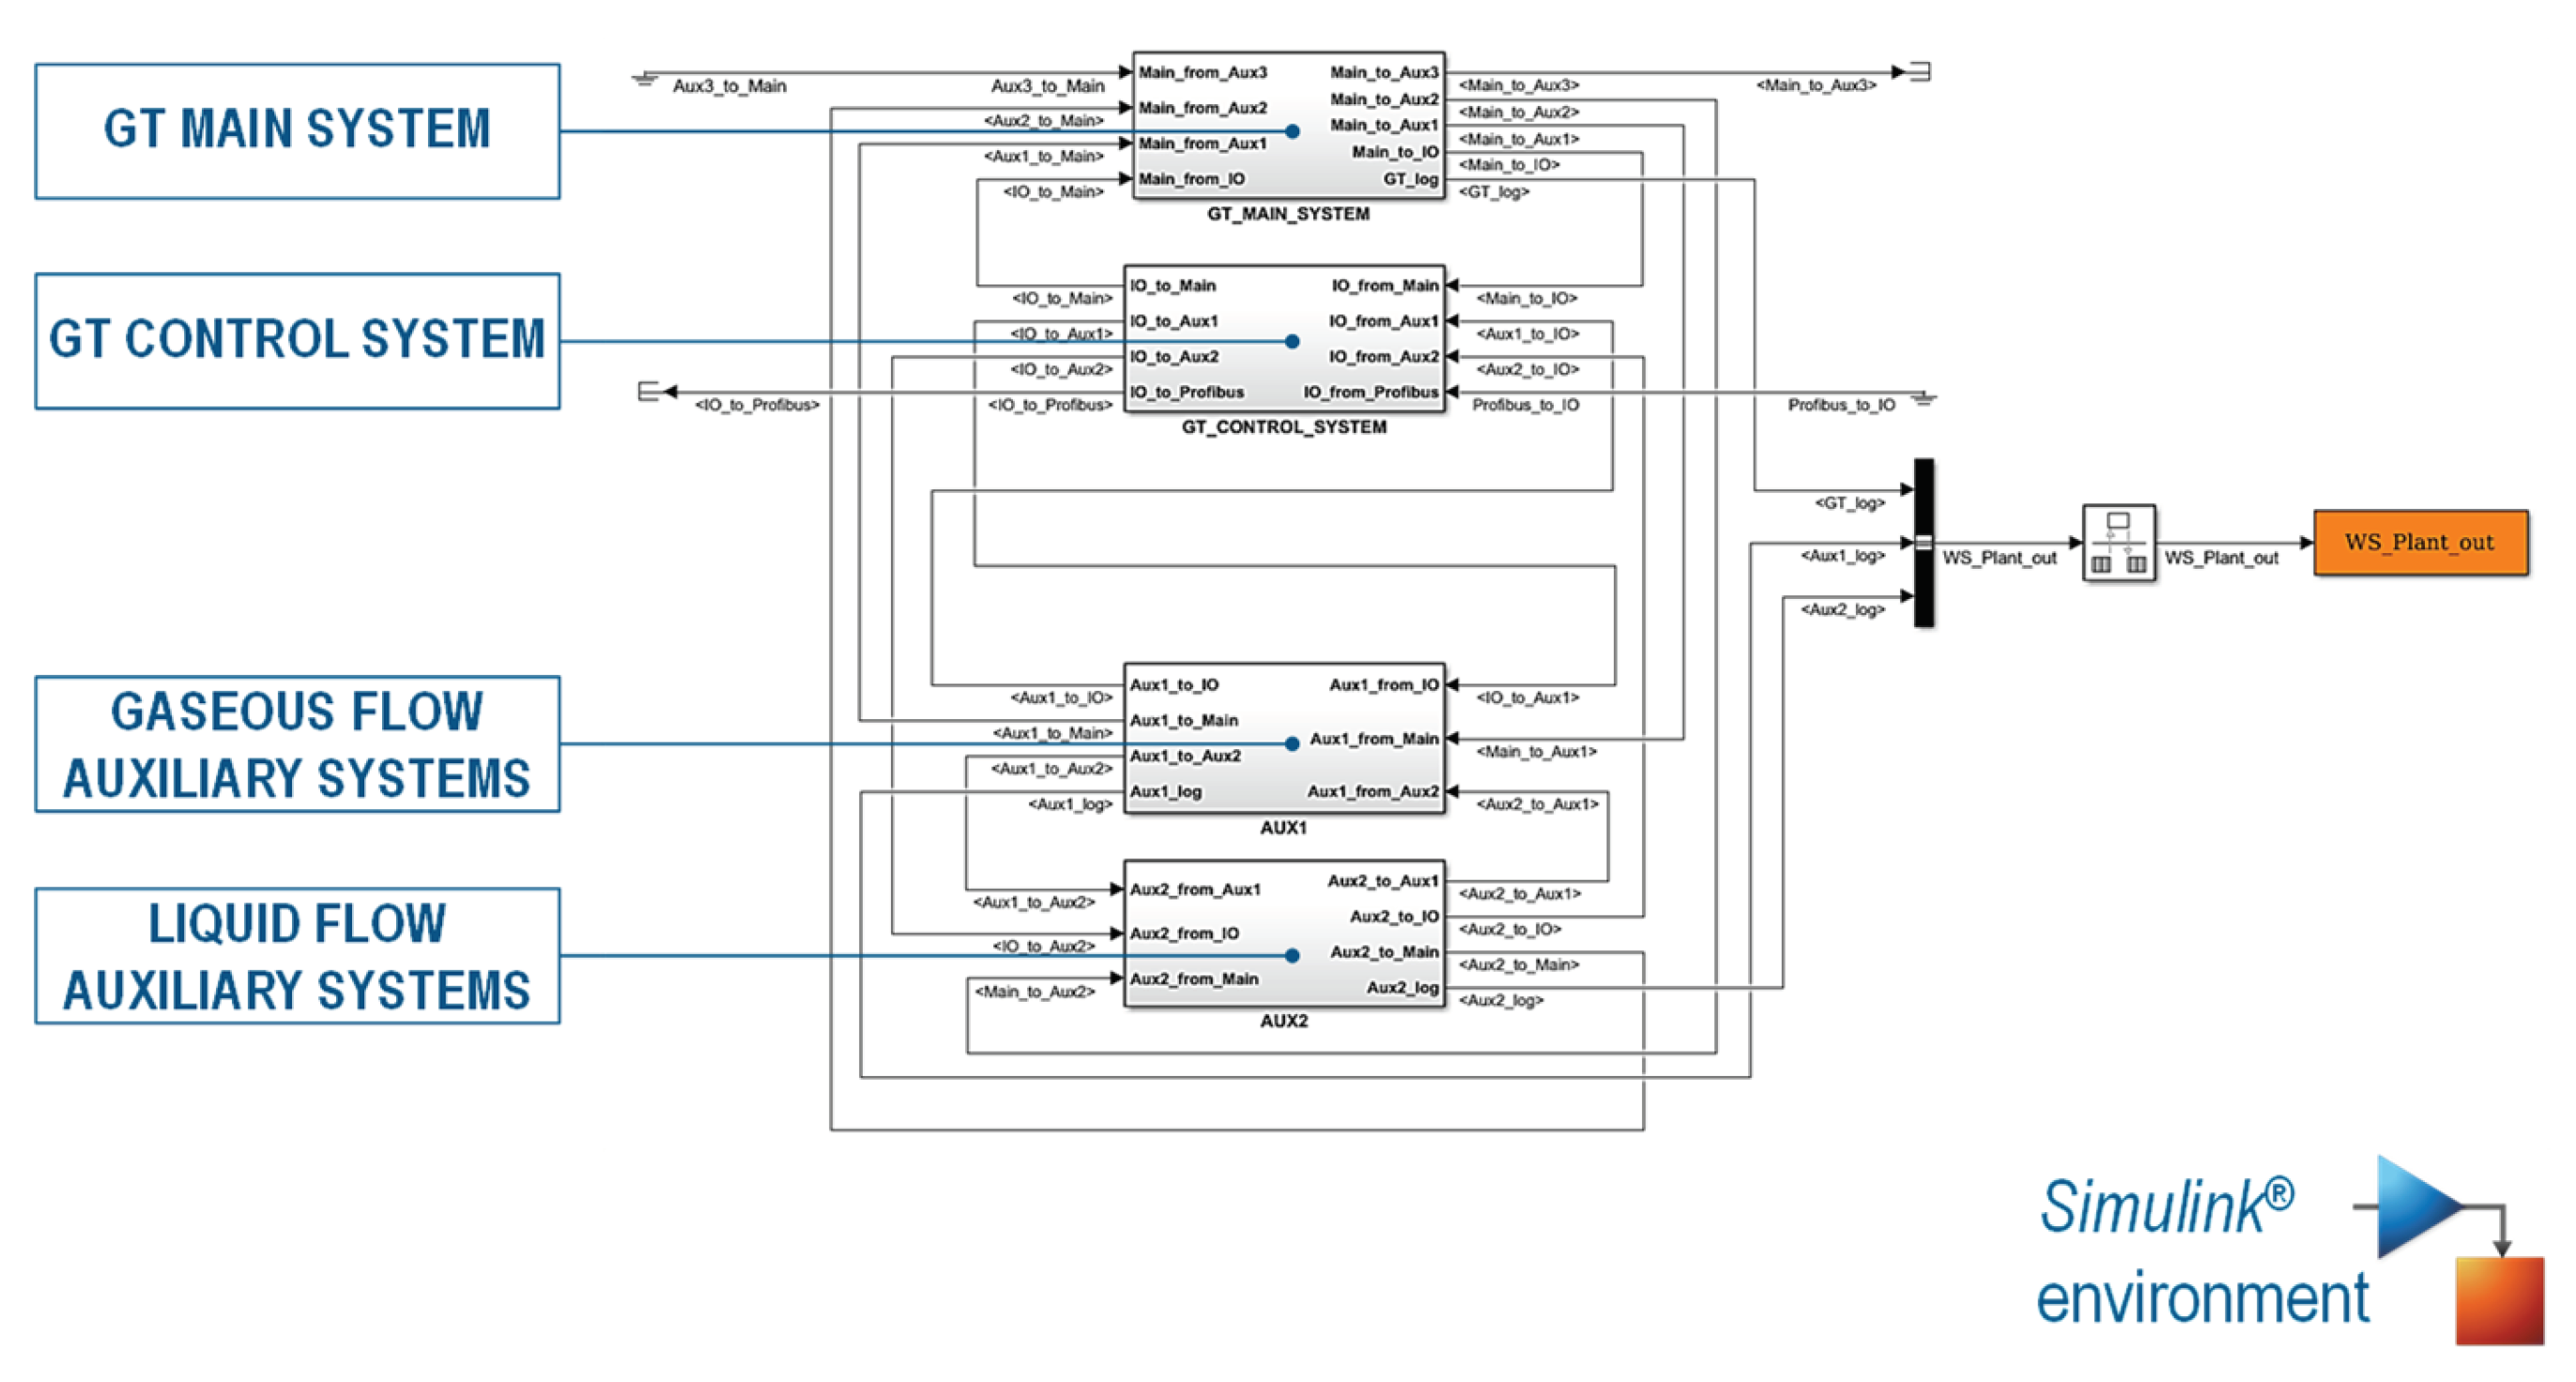
Figure 3.
GT HIL testing—model structure in the Simulink environment [
Figure 1 in 1, 4].
Figure 3.
GT HIL testing—model structure in the Simulink environment [
Figure 1 in 1, 4].
3.1.2. GT Model Features and Accuracy in Steady State Conditions
More detailed description of TGSim Plus™ components and typical results of a transient simulation from start-up to full power and to shutdown using TGSim Plus™ were discussed in detail in previous publications by the authors [
1,
2,
3,
4].
It is here worth mentioning some typical figures representing the model complexity:
Number of states:
~ 750 continuous states
~ 500 discrete states
Number of valves:
~ 40 gaseous flow valves
~ 30 liquid flow valves
Number of bleed lines:
3 lines (blow-off & cooling)
Number of I/O signals:
~ 300 signals (100 input, 200 output)
~ 150 duplicated signals (added to fully interface with the GTCS)
The accuracy obtained under steady states of reference are summarized in
Table 1 and in
Table 2.
3.1.3. Fidelity under Start-Up & Shutdown Scenarios
The exogenous input to the model, for the startup simulations here recalled are the speed controller set point, the load power, and the compressor IGV angle. This latter, in the HIL simulations, is determined by the GT OEM control system (GTCS).
The GT is simulated from the ignition speed up to full speed-no load (FSNL), then from FSNL to full speed-full load (FSFL), reaching steady state conditions. The FSFL is followed by the unloading to FSNL and then by the shutdown phase.
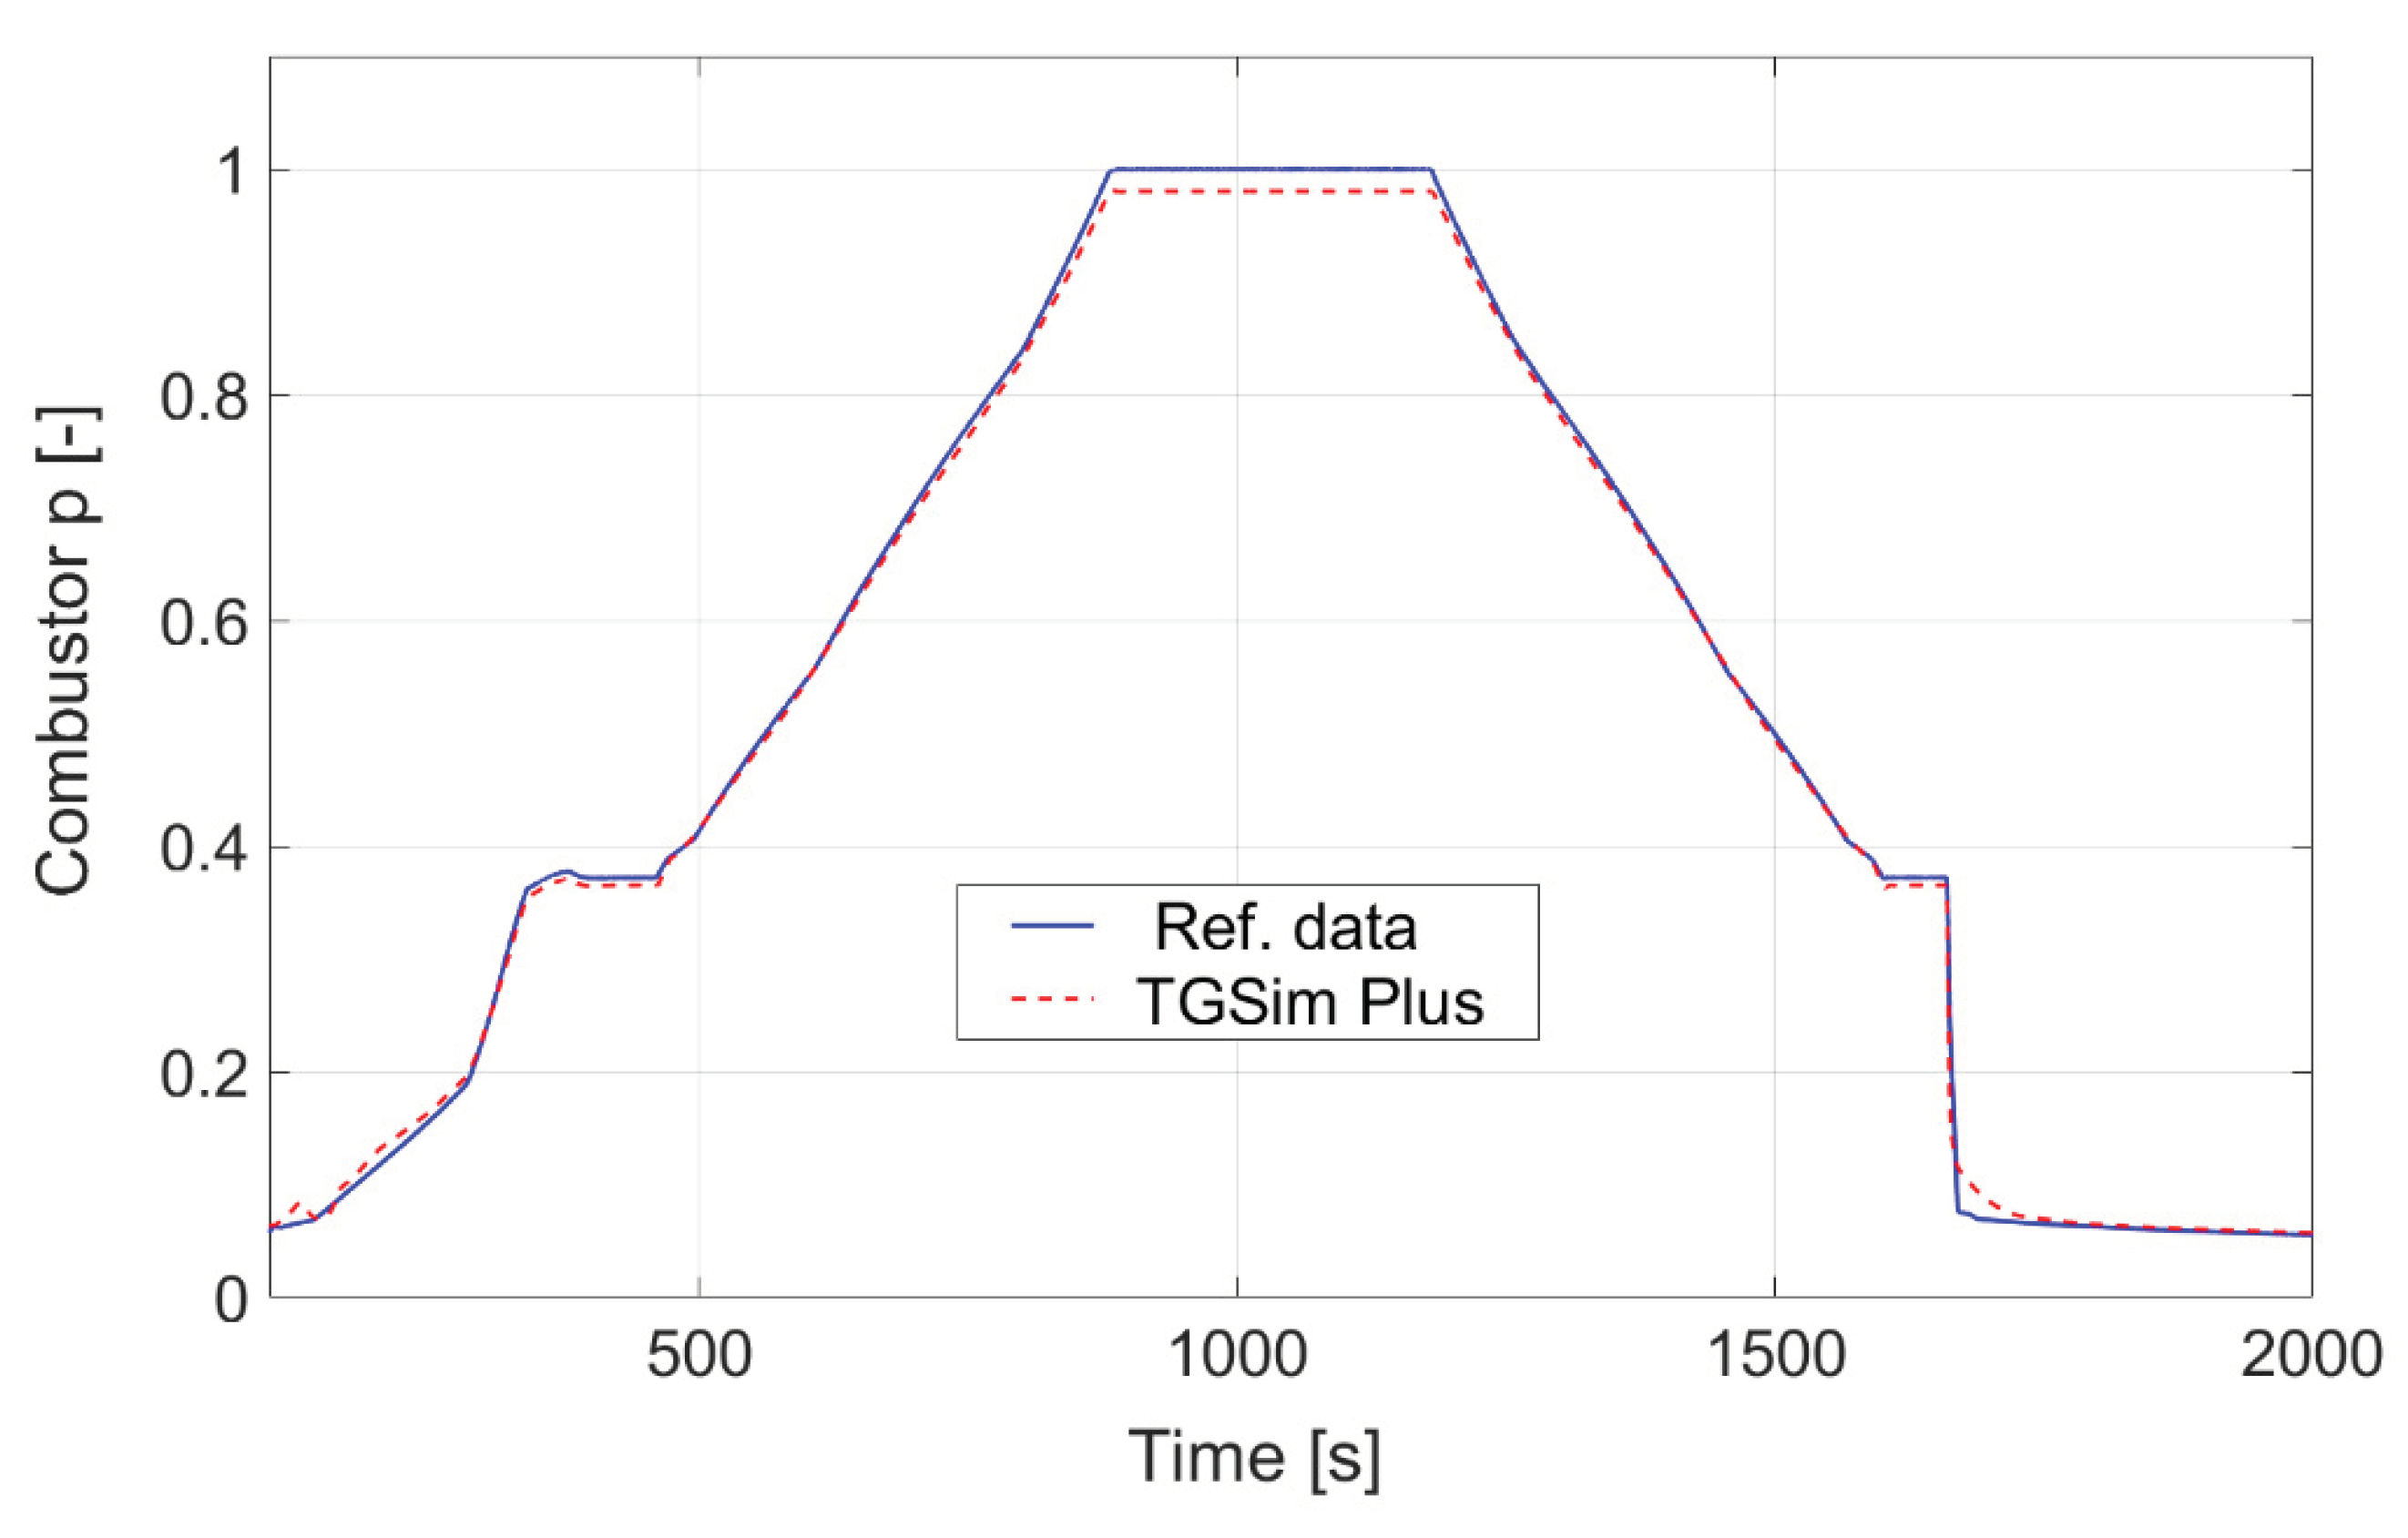
Figure 4 and
Table 1, extracted from the previous publications [
2,
4], provide a glimpse to the high accuracy obtained in the validation tests, performed offline for convenience of comparison using, as much as possible, the same boundary conditions and exogenous input as the reference calculations.
The reference data were obtained by simulations made with the NPSS – Numerical Propulsion System Simulation – [
7,
8], which is a state of the art gas turbine design and performance analysis tool, yet unsuited for real time truly dynamic simulation because the calculation approach is apparently based on iterative solution of quasi-steady form equations rather than robust ODE solving methods such as those available in the SIMULINK environment, fully exploited in the TGSim Plus™ components libraries.
Indeed, NPSS has available a linear model generator (LMG) tool to obtain parameters of linear equivalent models, in order to simulate and analyze stability and performance of closed loop control of the simulated engine under transient conditions [
9]. TGSim Plus™, instead, is a fully non-linear modelling environment, based on gas dynamics laws and mapped equipment performances.
3.2. Possible Use Cases in Diagnostics
RT HIL simulators could be used to simulate anomalies either as per their normal configuration scope or after update, to incorporate functions or output that are not normally requested for GTCS tests.
Within the former class (model ready events) the following could be considered:
Fuel injectors obstruction, leak or sticking (OLS)
Bleed valves OLS
Cooling system valves OLS
Coolers / heaters fouling
Expander blades cooling ports obstruction
Compressor & expander vanes fouling and erosion
Casing Cooling air / water system loss of capacity
Aux. compressed air system anomalies (e.g., filters clogging)
Aux. pumps, filters and valves anomalies of:
Liquid fuel (if any)
Hydraulic system
Lube oil system
Sensors faults (offsets, drifts)
Relevant phenomena, normally outside the scope for HIL tests but that could be added to the model, based on real system logs in no-fault conditions and to be correlated and varied with operating conditions are:
Vibration patterns
Flow noise patterns
Both classes of the above fault cases could be injected as artificial events/trends during simulations, deterministically or randomly according to the best knowledge available on their onset and evolution, and traced by mismatch between control action and GT temperature/pressure/flow rates/speed, etc. mismatch.
3.3. The CLUE Integrated Workflow
CLUE is a proprietary platform for fault detection, isolation and prognostic that encapsulates customizable software library developed by the authors and their company providing:
Early fault detection and health status assessment of the monitored assets
Fault isolation and support to troubleshooting
Prognostics of the monitored assets (prediction of the future health status and Remaining Useful Life).
The CLUE service can run on public cloud (e.g., AWS) or private cloud managed by S.A.T.E. or the customer. In addition, the CLUE software library can be deployed to onboard/infield hardware (e.g., for automotive fleets). A hybrid cloud/infield deployment model can also be applied.
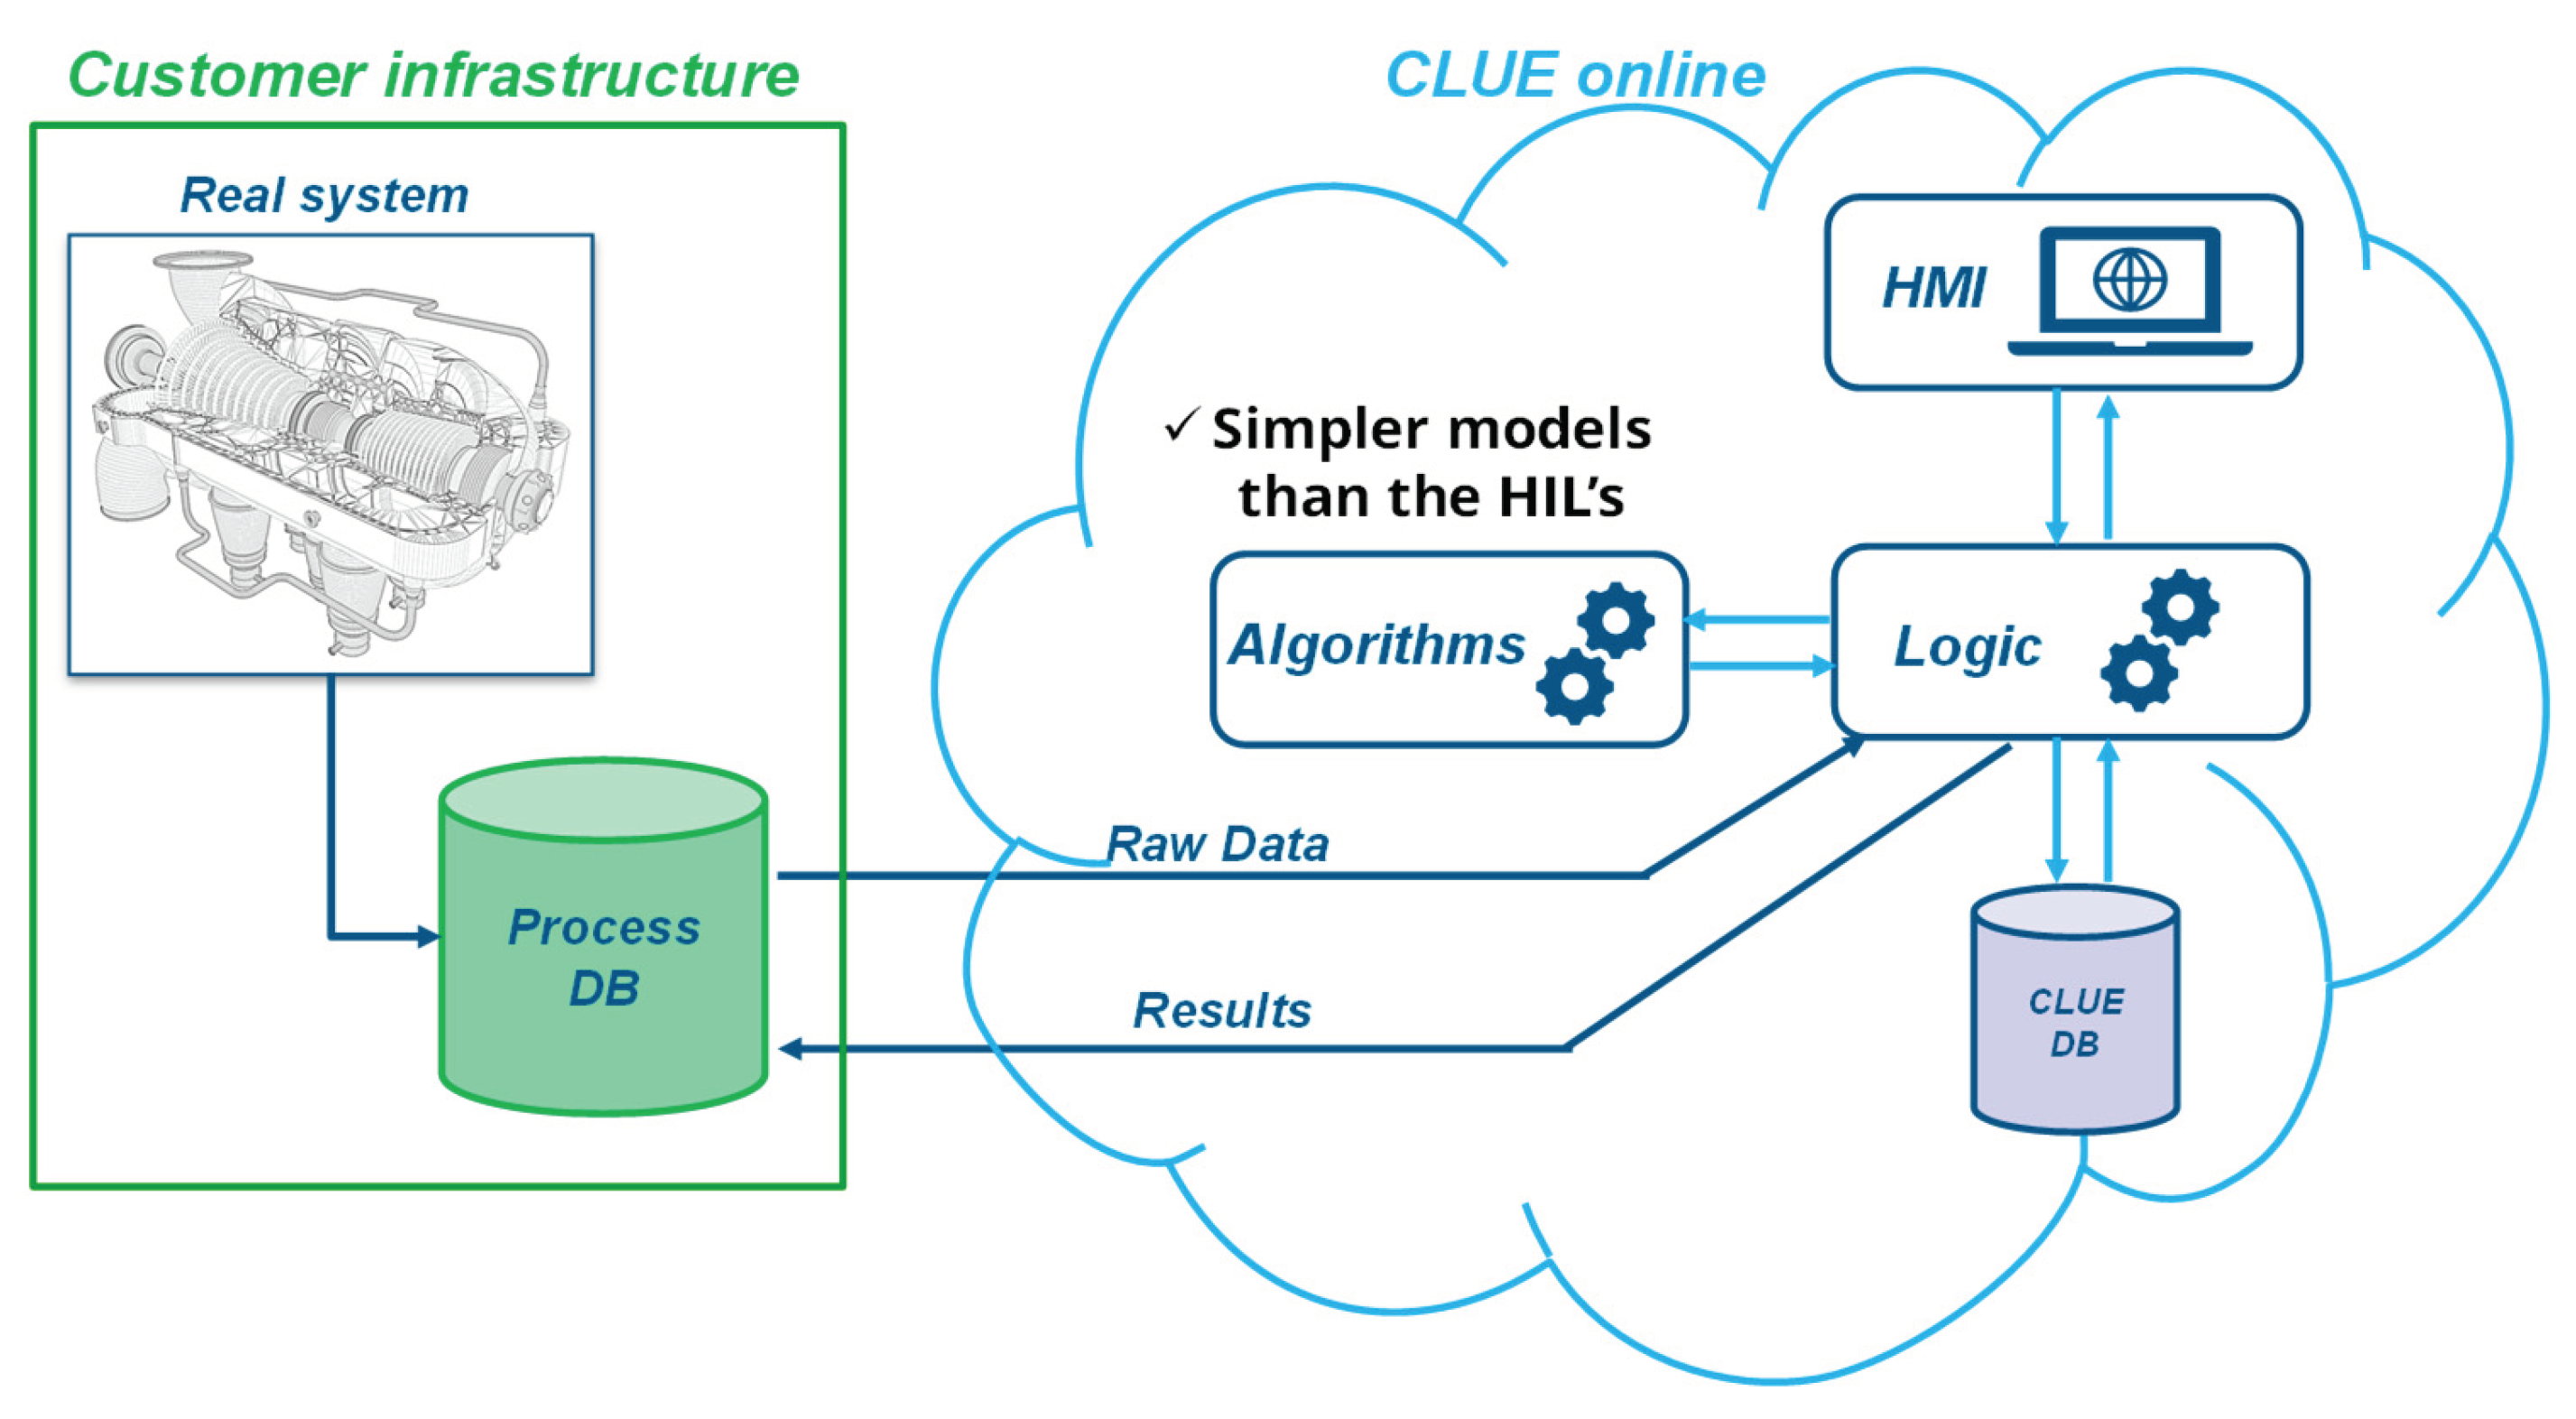
Figure 5 shows the CLUE service deployed on cloud servers and its interfaces to the customer plant and data base.
The process data base (DB) includes all customer data and output produced by CLUE:
The CLUE DB instead includes intermediate results and configuration data (results of training made a priori or during CLUE use).
A User Interface is available to show the results of the continuous data processing to the plant operator or the reliability and maintenance team. Through this UI, the users can also input their feedback on the CLUE output, e.g., to mark false alerts and missed alerts for continuous algorithms configurations improvement.
3.4. Fault Detection, Isolation & RUL
The CLUE library includes a set of software modules for fault detection, isolation and prognostics. Different methodologies are available in the CLUE library that may be fully data-driven or may require increasing levels of domain knowledge for their configuration and use. Domain knowledge can be useful, for example, to pre-select a subset of the large set of physical quantities (or measurements) acquired, which are to be monitored to detect symptoms of faults of specific components/systems.
Depending on the application, the customization of the CLUE service includes the selection of the most suitable approach to the use case and the training/configuration of the algorithms, exploiting real historical data and/or simulated ones, as proposed in this paper, in order to extend, as much as possible, the envelope of the training/configuration data set, thus the reliability of CLUE output.
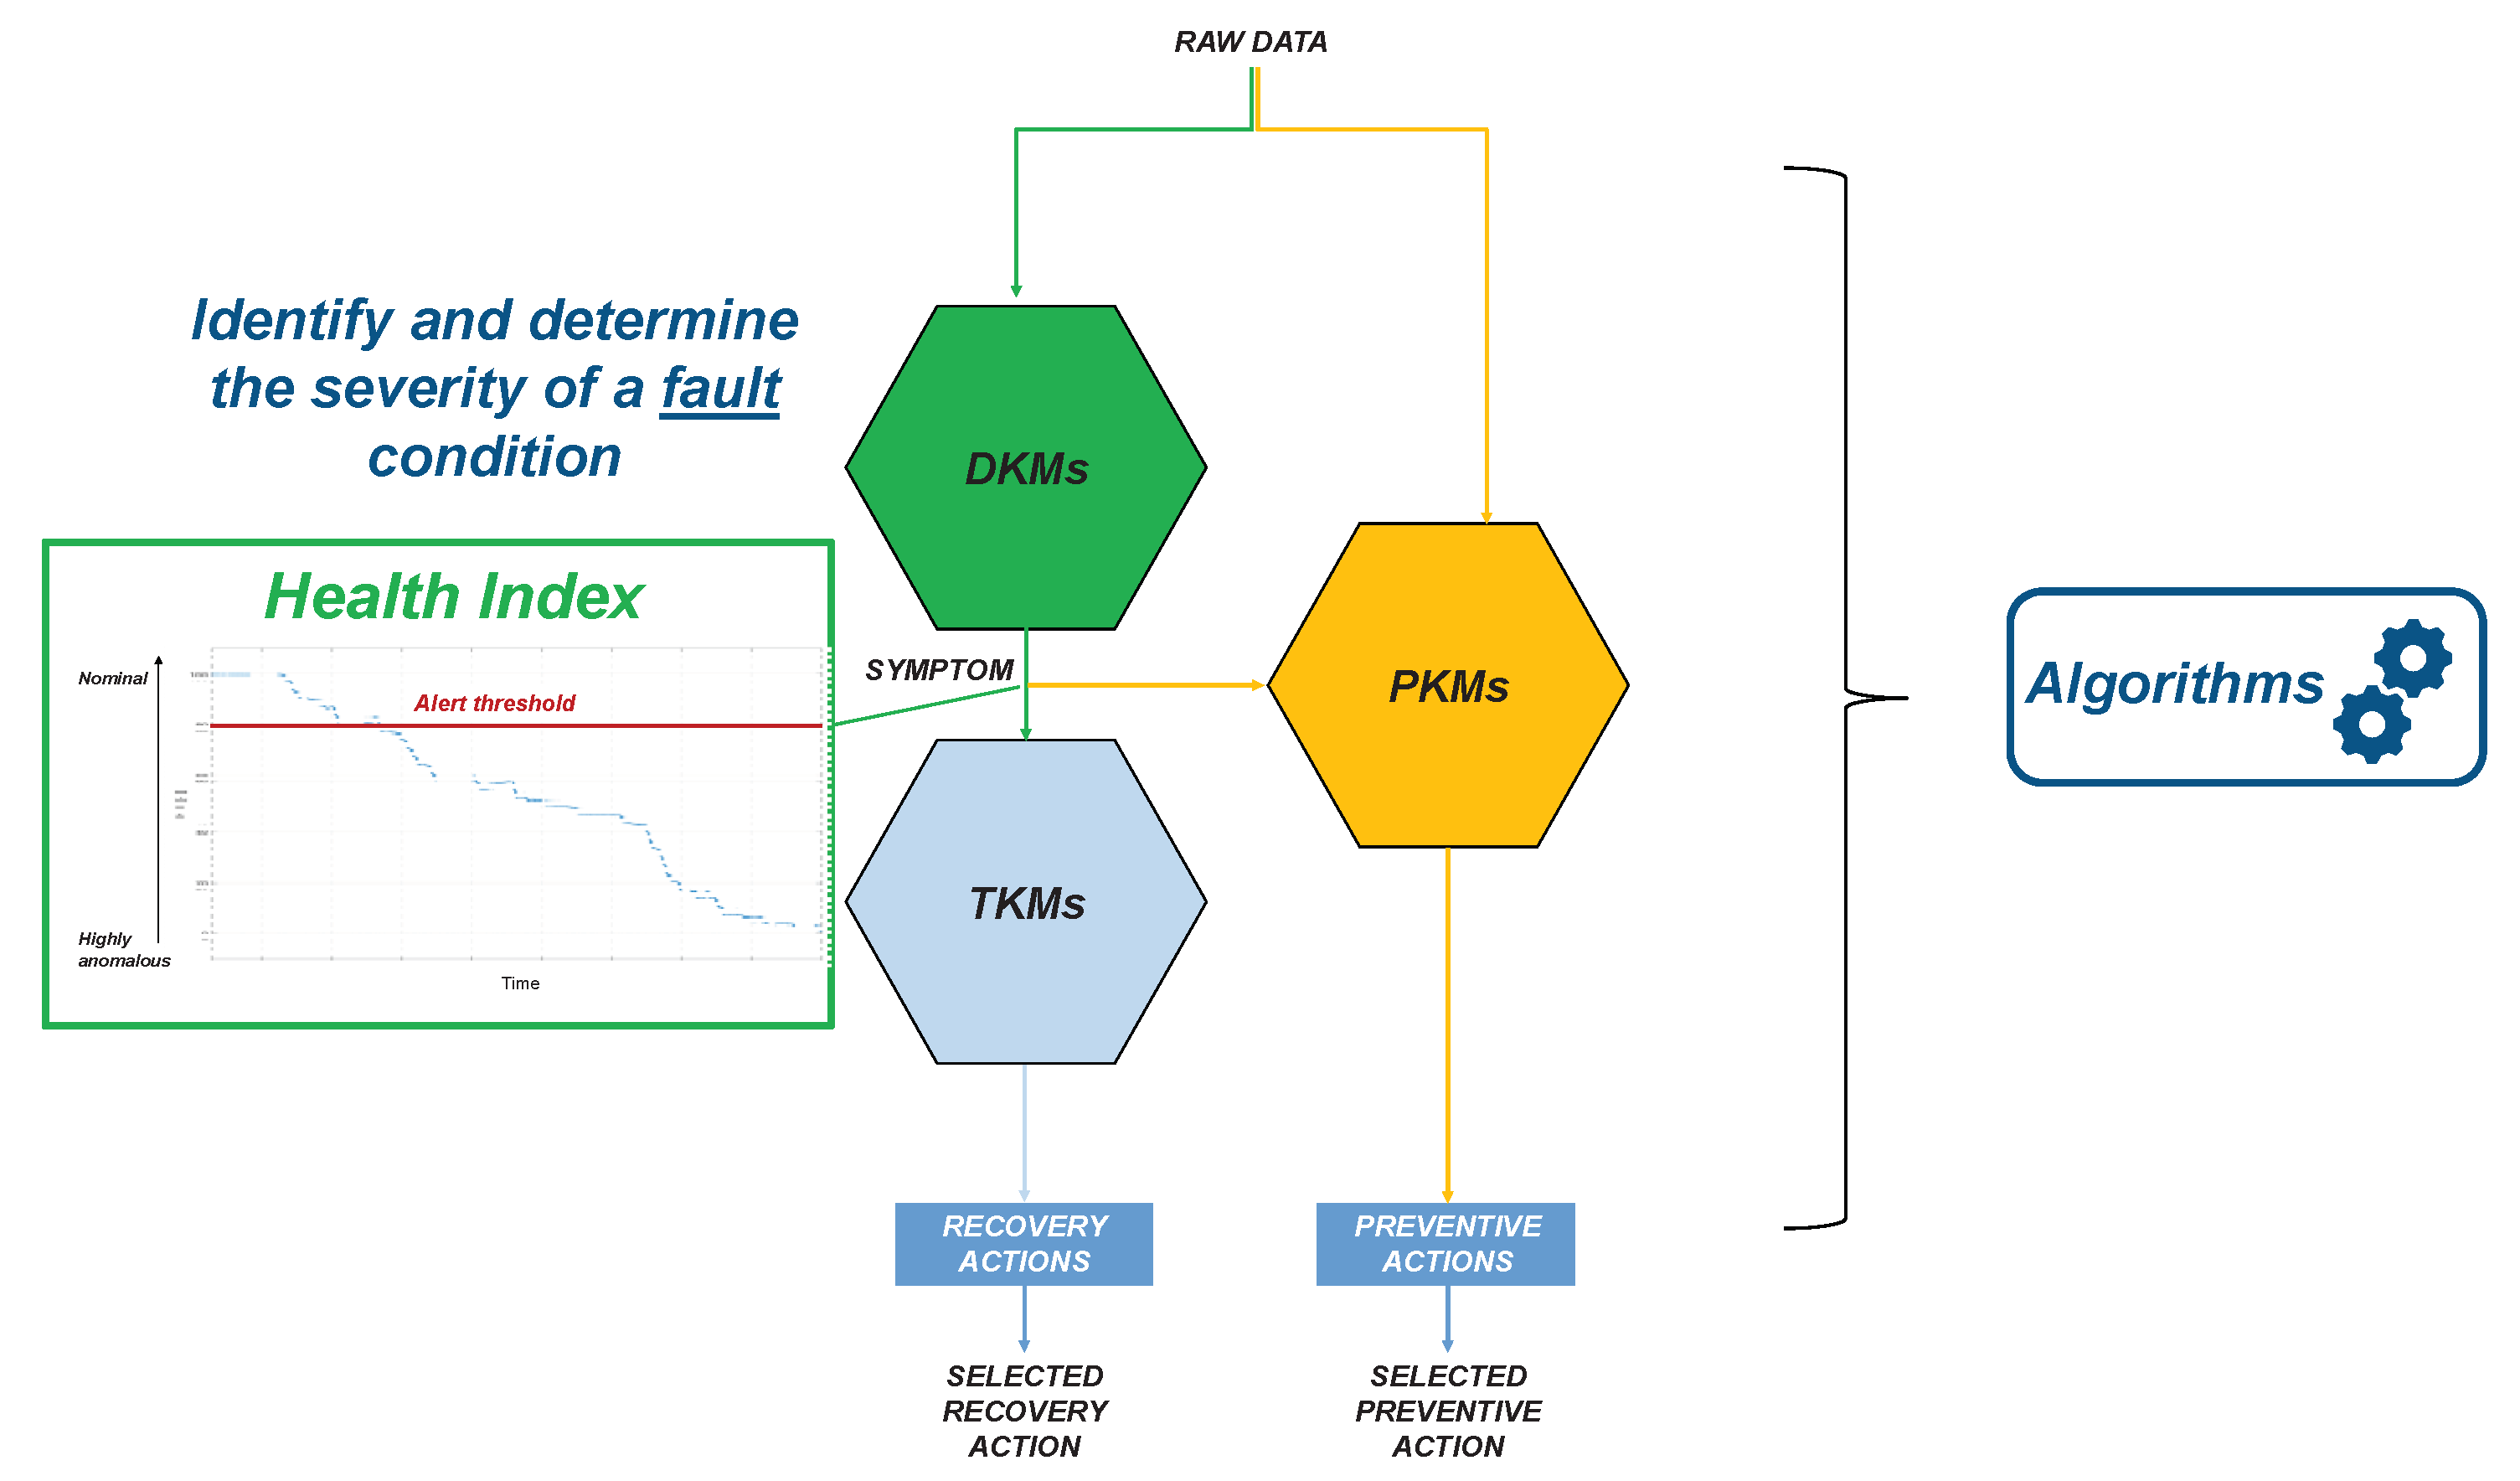
The CLUE workflow is implemented through a set of three building blocks:
Diagnostic Kernel Modules (DKM),
Troubleshooting Kernel Modules (TKM),
Prognostics Kernel Modules (PKM).
Figure 6 shows the output of the DKM building block, which is a Health Index (HI) time series, representing the status of the monitored asset(s) from continuous monitoring of the acquired signals. The Health Index ranges from 0 (faulty behavior) to 100 (nominal behavior). Upon HI decrease below an alert threshold a trigger is set to control room operators, to investigate the anomalous behaviour. The alert trigger logics are implemented so as to allow discarding isolated anomalies, in case they are not relevant.
The Health Index is computed by comparison between the expected behaviour (normal or faulty) and the observed one, from measurements acquisitions. The DKM models also provide as output the so-called Modelled Symptoms, that consist of auxiliary quantities that allow a better understanding of the models reasoning, useful in particular for Fault Isolation purposes.
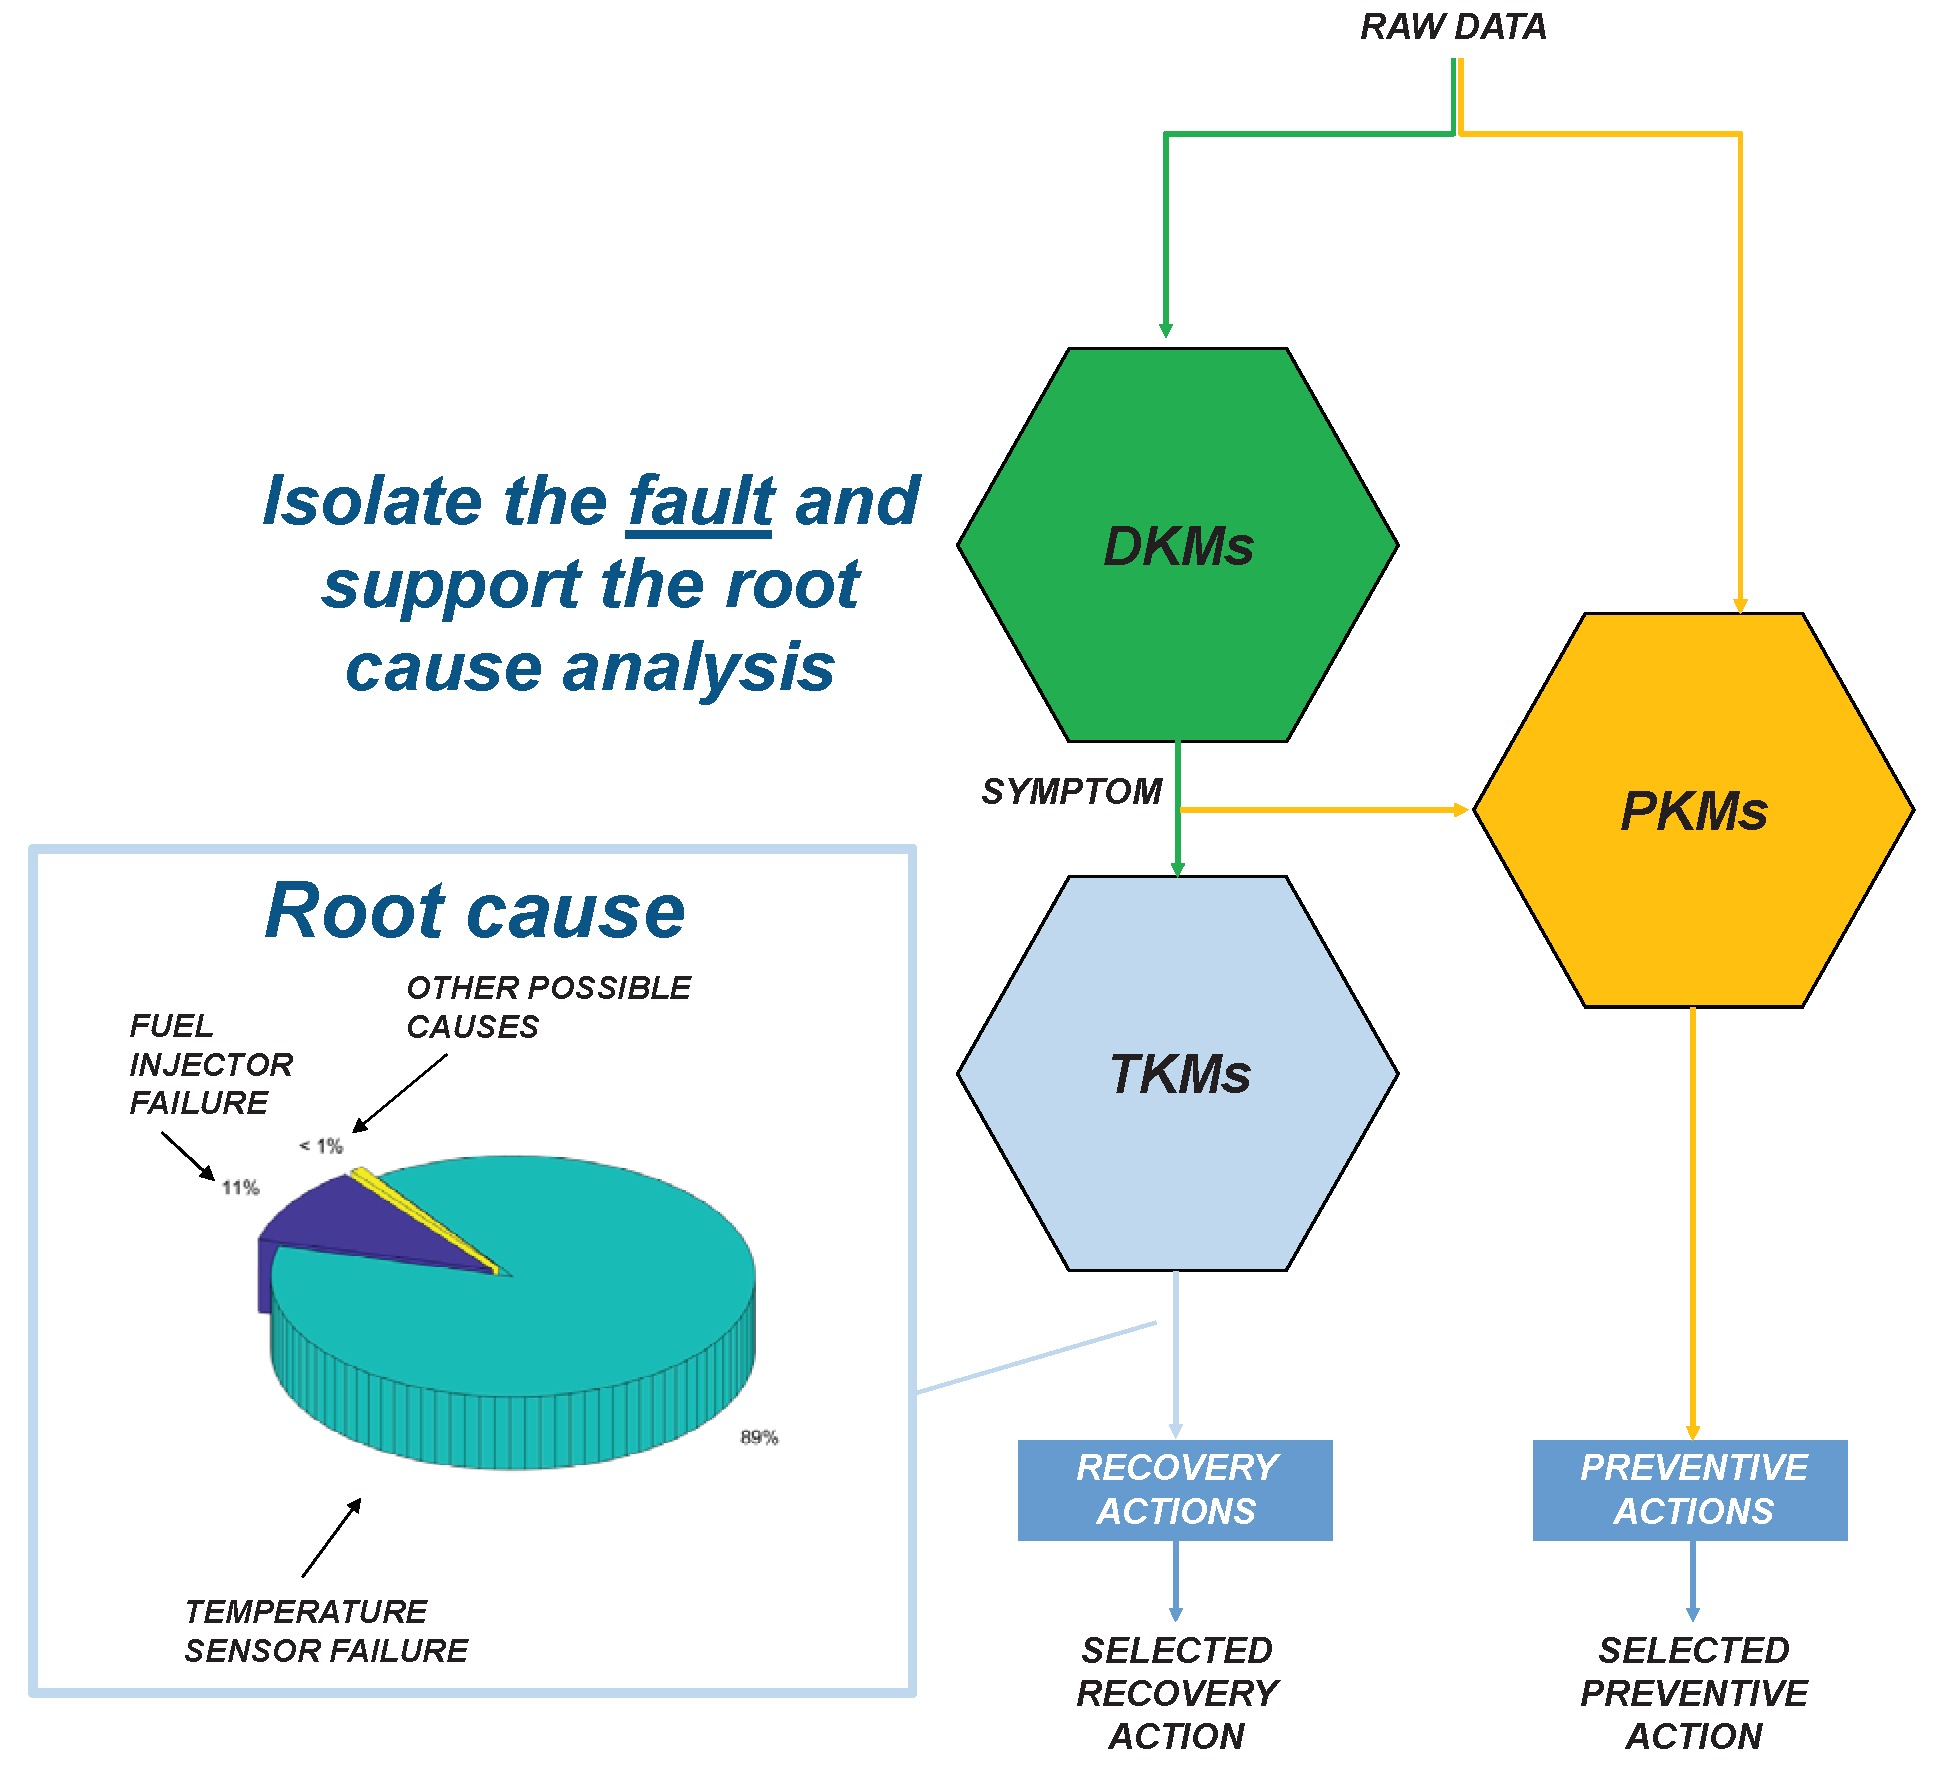
Often the effects of an anomalous event can be observed in multiple parameters, also belonging to different subsystems, which makes the identification of the location and cause of a fault more difficult [
19]. For this reason, in addition to the assessment of subsystems/components health status, the CLUE solution includes advanced tools for the identification of the most likely root causes, from the elaboration of the health index of the various systems.
Figure 7 shows the consequent TKM output, which can be directly an indication of the most likely root causes of the anomalies or a set of correlated parameters/signals to the anomalous ones detected, depending on the approach used with more or less engineering knowledge applied to the diagnostic process.
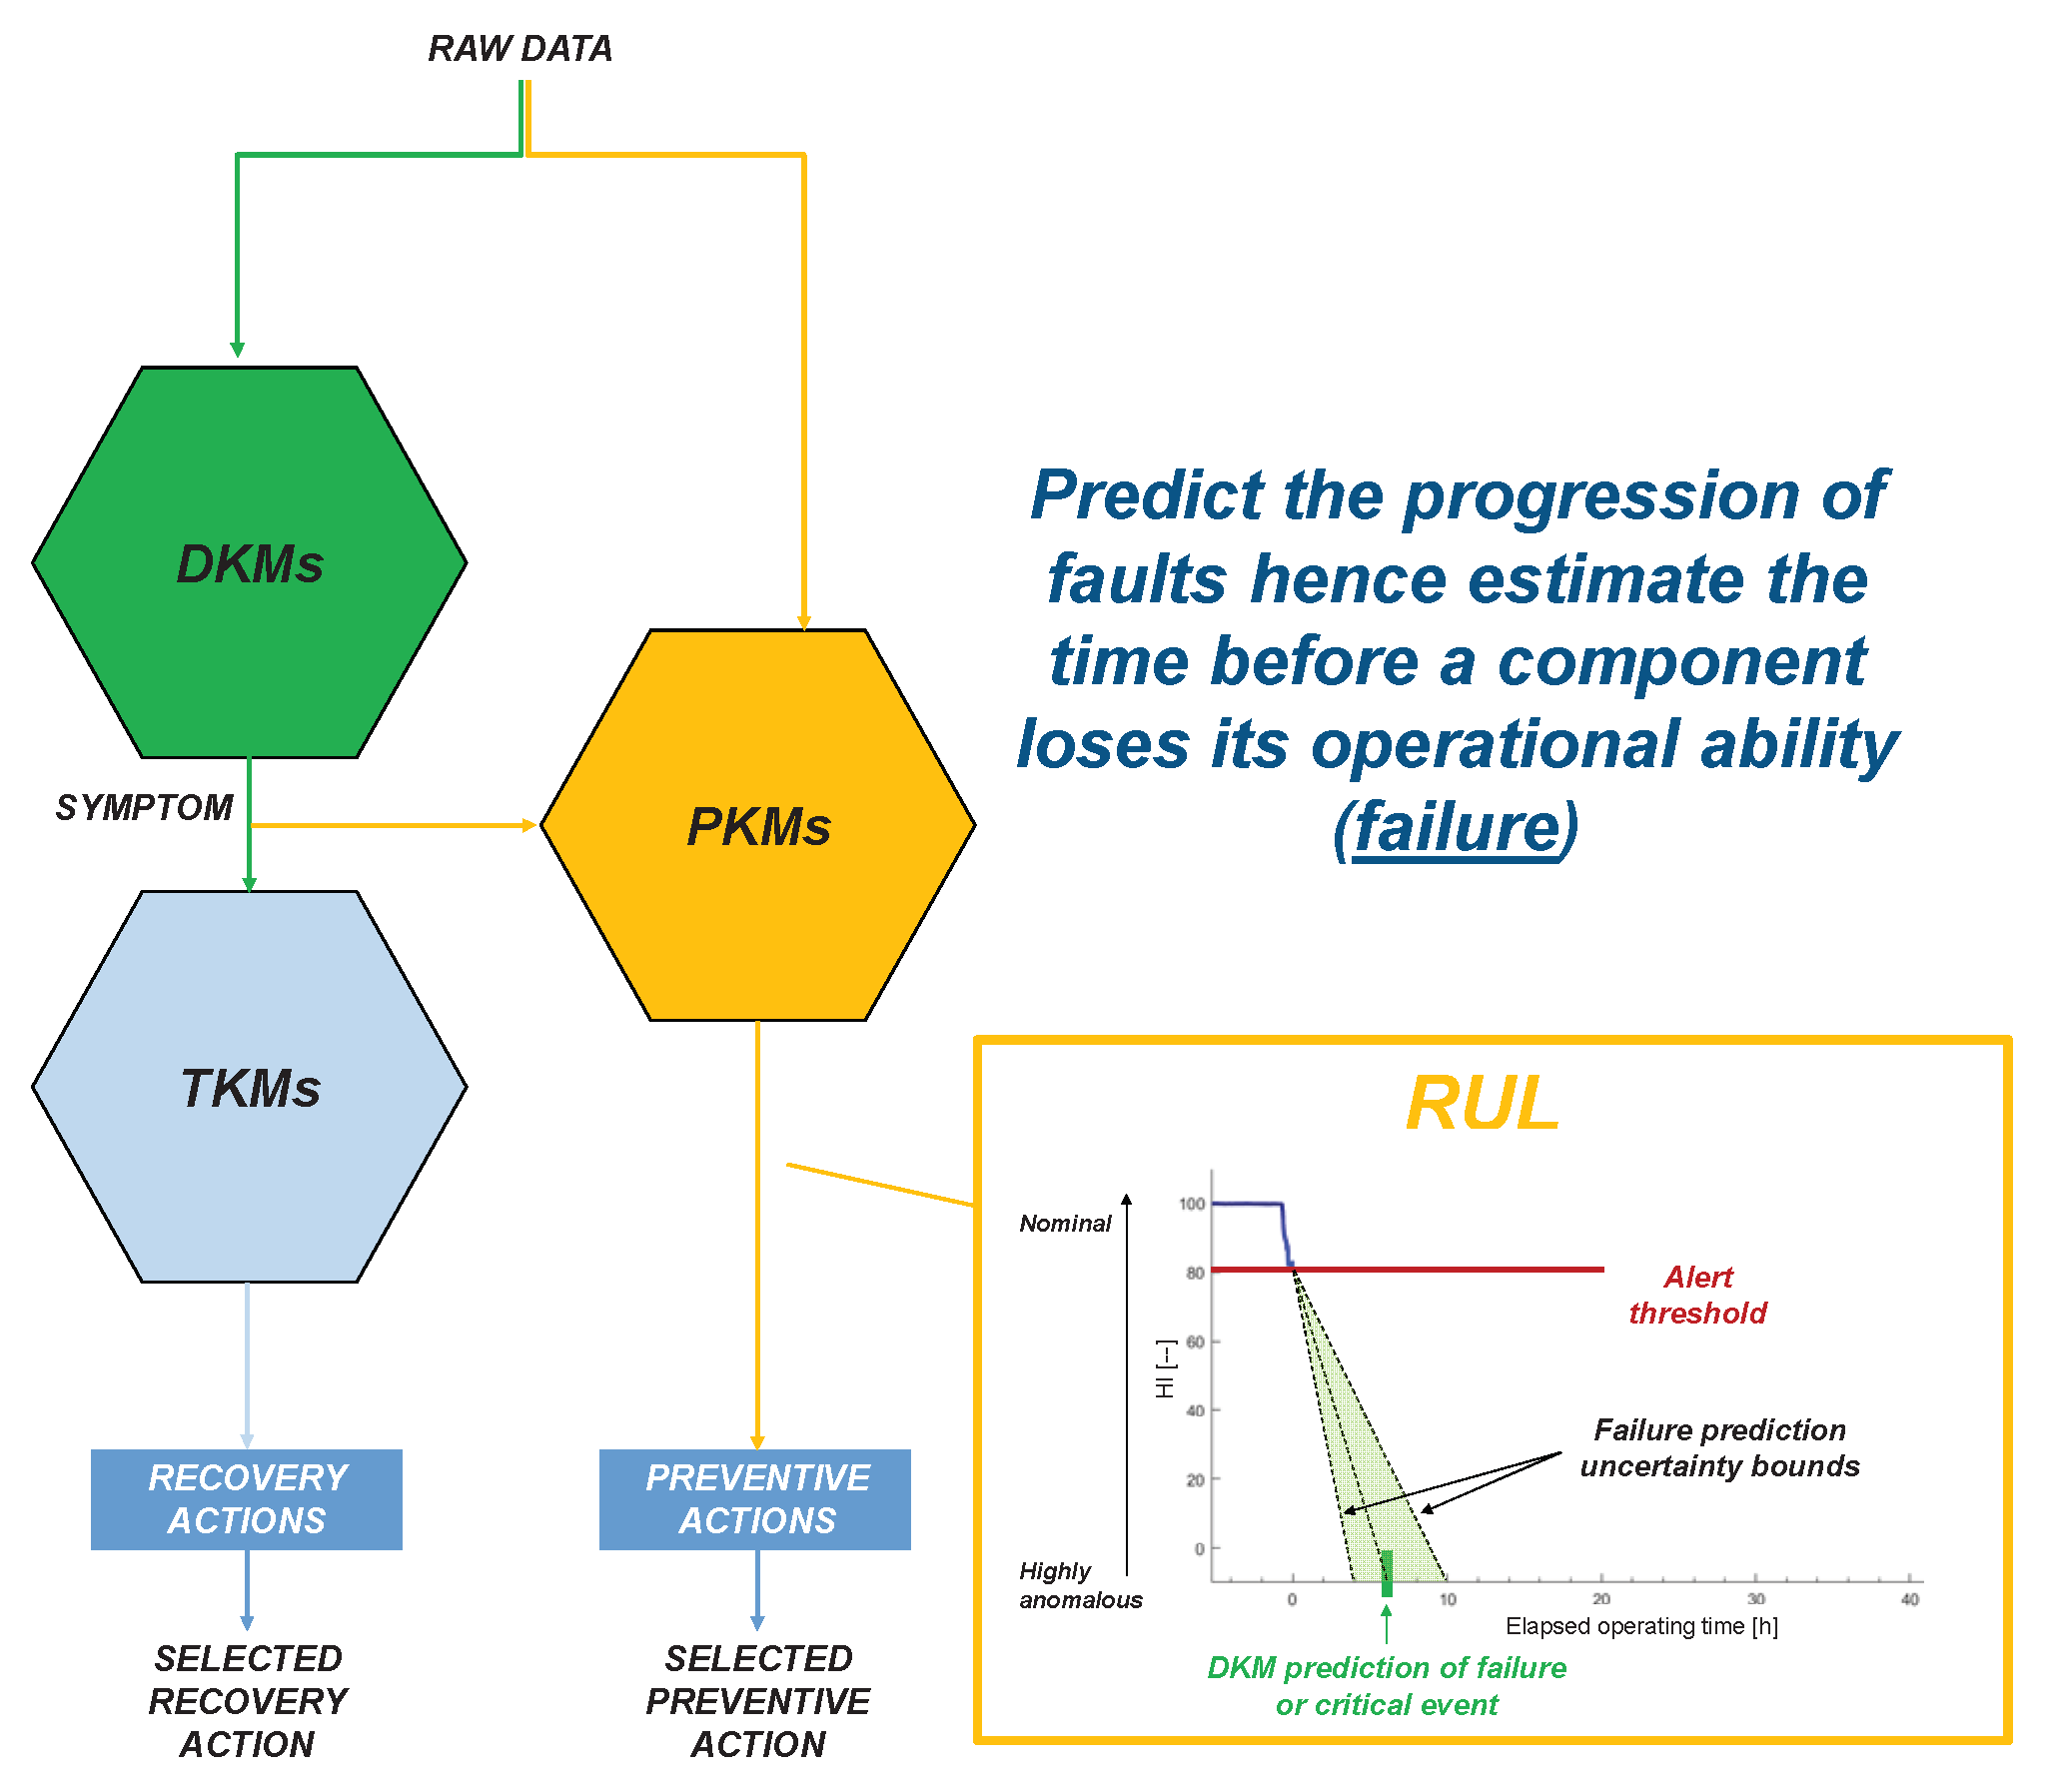
Once a possible fault is detected in advance, it is important to plan mitigation actions, especially for critical components before this fault evolves into a more severe condition; therefore, the estimate of the time available for intervention is another useful output produced by CLUE [
19].
Figure 8 shows the prognostic output, which is the estimate of the remaining useful life of the component, with uncertainty boundaries, which depend on the evolution of the fault along time. The RUL estimate is updated continuously, during fault evolution, to refine the predicted time and the confidence interval [
19].
The benefits from the use of such applications can be measured, alongwith their use, by a set of Key Performance Indicators (KPIs) that allow measuring the costs reduction and enhanced service or system operations. Example KPIs used to assess the benefits from CLUE applications in implemented automotive use cases are the following:
Reduction of wrong component substitutions
Reduction in the number of times a vehicle returns to the workshop due to previous ineffective intervention
Reduction of the time spent at workshop for troubleshooting operations
Reduction of the number of unplanned vehicles stop on road.
Similar parameters, more meaningful for stationary power systems or other industrial plants, could also be defined, with the same purpose of measuring the return on the investment in the prognostic technology application and identify strategies to improve the overall lifetime costs of the system of concern, both on the design and in the operational service phases of the asset.
Normally, the validation of the performances of these techniques with large sets of anomalies is difficult, due to the fact that anomalies are rare and not always identified with clear causes and duration. The use of simulation models can largely speed up the validation process, by providing reference and a priori known fault signatures for evaluation of models response and application-specific KPIs.
4. Discussion
The application and workflow scenarios presented in the previous sections for HIL facilities and models, on one side, and for diagnostic methods and solutions implementation, on the other, are practiced and evolving so far as separate activities in the industry since several years, by various levels of technology complexity, depending on the field.
To the author’s knowledge, however, no previous integrated application for the purpose illustrated appear as state of the art.
This theme, therefore, is a possible key of innovation for the best exploitation of the knowledge, both the general one regarding the simulation and diagnostic methodologies and the specific knowledge being gradually gained on the existing and newly installed equipment and plants, to which robust and powerful diagnostic solutions, fully tested and validated by expanded data sets obtained by simulations could be applied.
Author Contributions
“Conceptualization, Attilio Brighenti and Chiara Brighenti; methodology, Attilio Brighenti and Chiara Brighenti; software, Attilio Brighenti and Chiara Brighenti; validation, Attilio Brighenti and Chiara Brighenti; formal analysis, Chiara Brighenti; investigation, Attilio Brighenti and Chiara Brighenti; resources, not applicable; data curation, not applicable; writing—original draft preparation, Attilio Brighenti; writing—review and editing, Attilio Brighenti and Chiara Brighenti; visualization, Attilio Brighenti and Chiara Brighenti; supervision, Attilio Brighenti; project administration, Attilio Brighenti; funding acquisition, Attilio Brighenti and Chiara Brighenti All authors have read and agreed to the published version of the manuscript.”
Funding
“This research received no external funding”
Acknowledgments
The authors wish to thank the EVI-GTI organization, particularly Mr. Ralf Obertacke and Mr. Bjoern Karlsson, for having invited them to speak and present the topic discussed in this paper at the 2023 EVI-GTI Conference held in Budapest (Hungary) on the 25th – 27th April 2023.
Conflicts of Interest
“The authors declare that the topic discussed in this paper are the result of their research and development and industrial consultancy work performed within the company of their affiliation, which they own and control, which has received appreciation and long-term trust by their customers and partners”.
References
- Brighenti A., Duranti D., Quintabà D., “Real-Time simulation of Gas Turbine systems”, In Proceedings of the 35th CAE Conference, Vicenza (Italy) 28-29 Oct. 2019.
- Brighenti A., Duranti D., Quintabà D., “TGSim Plus™ – Real-time Dynamic Simulation Suite of Gas Turbine Systems for the MATLAB®/Simulink® Environment”. In Proceedings of the 9th EVI-GTI international gas turbine instrumentation conference, Graz (Austria) 20-21 Nov. 2019.
- Brighenti A., Duranti D., Quintabà D., “Dynamic simulation”, Hydrocarbon Engineering, 2019, Vol. 24, Nr. 12, Dec., pp 65-68.
- Brighenti A., Duranti D., Quintabà D., “TGSim Plus™ - Real-Time Dynamic Simulation Suite of Gas Turbine Systems for the MATLAB®/Simulink® Environment”, Int. J. Turbomach. Propuls. Power 2020, 5(3), 24. [CrossRef]
- Brighenti, A.; Panikulam, J.V.; Bondi, S.; Fioravanti, L.; Amidei, S.; Gennari, G. “Simulator of the Oregen system for Waste Heat Recovery from Gas Turbines”. In Proceedings of the 32nd CAE Conference, Parma, Italy, 17–18 October 2016. [Google Scholar]
- Atherton D.P., Borne P.: “Concise encyclopedia of Modelling & Simulation”, Pergamon Press, 1992 (ISBN 978-0-08-036201-4). Available online: https://www.sciencedirect.com/book/9780080362014/concise-encyclopedia-of-modelling-and-simulation#book-info.
- “Numerical Propulsion System Simulation (NPSS)” Available online: https://www.swri.org/consortia/numerical-propulsion-system-simulation-npss, accessed 22 Jan. 2024.
- Southwest Research Institute® (SwRI®), “About Numerical Propulsion System Simulation (NPSS®)”, San Antonio TX, August 2020. Available online: https://www.swri.org/sites/default/files/what-is-npss.pdf, accessed 22 Jan.2024.
- K. I. Parker, J. L. Felder, T. M. Lavelle, C. A. Withrow, A. Y. Yu and W. V. Lehmann, “Integrated Control Modeling for Propulsion Systems Using NPSS” JANNAF, Colorado Springs, CO, NASA/TM—2004-212945, 2004, Feb. Available online: http://ntrs.nasa.gov/archive/nasa/casi.ntrs.nasa.gov/20040040174.pdf, accessed 22 Jan.2024.
- Evans D., Martinez J., Korte-Stapff M., Brighenti A., Brighenti C., Biancat J., “Data Mining to Drastically Improve Spacecraft Telemetry Checking: An Engineer’s Approach”, Space Operations (Space Ops) Conference 2016, Daejeon (S Korea) 16-20 May 2016.
- Brighenti C., Amoruso L., Evans D., Brighenti A., Moretto D., Ricatto M., Ferrari F., Carbone M., “CASTEC – A tool for automatic spacecraft telemetry analysis and novelty detection”, In Proceedings of the ESAW 2019, Darmstadt (Germany), 21-22 May 2019.
- Calvo Bascones p., Sanz-Bobi M.A., Brighenti C., Ricatto M., “A Machine Learning Method Applied to the Evaluation of the Condition in a Fleet of Similar Vehicles”, In Proceedings of the 30th European Safety and Reliability Conference and the 15th Probabilistic Safety Assessment and Management Conference, Nov. 2020.
- Brighenti C., Ricatto M., Zorzi A., Amoruso L., Carbone M., “Grasping S/C Behaviour With CASTeC, From AIT To Operations”, In Proceedings of the Workshop On Simulation And EGSE For Space Programmes (SESP), 30 March – 1 April 2021, ESA-ESTEC, Noordwijk, The Netherlands.
- Brighenti C., Ricatto M., Zorzi A., Brighenti F., Barison M., Amoruso L., Carbone M., “Constellation Monitoring With CASTeC”, International Astronautical Congress – IAC 2021, Dubai, United Arab Emirates, 25-29 October 2021.
- A.F. Mulone, G. Chiesura, R. De March, R. Messineo, A.G. Villa, C. Brighenti, D. Gumusbas, M. Deffacis, C. Maddaleno “spacecraft system and subsystems models optimization by ait/aiv and operations big data analysis”, In Proceedings of the Big Data from Space (BiDS’21), 18–20 May 2021. [CrossRef]
- Brighenti, A. , Brighenti C., Ricatto M., Quintabà D., “Context based predictive diagnosis”, Hydrocarbon Engineering, 2022, Vol. 27, Nr. 02, Feb., pp 65-72.
- C. Brighenti, M. Ricatto, D. Quintabà, A. Zorzi, A. Brighenti, “Improving constellations health status monitoring and fault prevention”, In Proceedings of the 73rd International Astronautical Congress (IAC), Paris, France, 18-22 September 2022.
- Brighenti A., Brighenti C., Ricatto M., Zorzi A., Evans D. (ESA), “Diagnostic and prognostic solutions”, Hydrocarbon Engineering, 2023, Vol. 28, Nr. 06, June, pp. 67-71.
- Brighenti C., Caudepon J. I., “AI-based on-board reconfigurable FDIR and lifetime prediction for constellations”, In Proceedings of the EDHPC, 2-6 October 2023, Juan Les Pins, France.
|
Disclaimer/Publisher’s Note: The statements, opinions and data contained in all publications are solely those of the individual author(s) and contributor(s) and not of MDPI and/or the editor(s). MDPI and/or the editor(s) disclaim responsibility for any injury to people or property resulting from any ideas, methods, instructions or products referred to in the content. |
© 2024 by the authors. Licensee MDPI, Basel, Switzerland. This article is an open access article distributed under the terms and conditions of the Creative Commons Attribution (CC BY) license (http://creativecommons.org/licenses/by/4.0/).
