Submitted:
24 March 2024
Posted:
25 March 2024
You are already at the latest version
Abstract
Keywords:
1. Introduction
2. Method and Computational Procedure
3. Results and Discussion
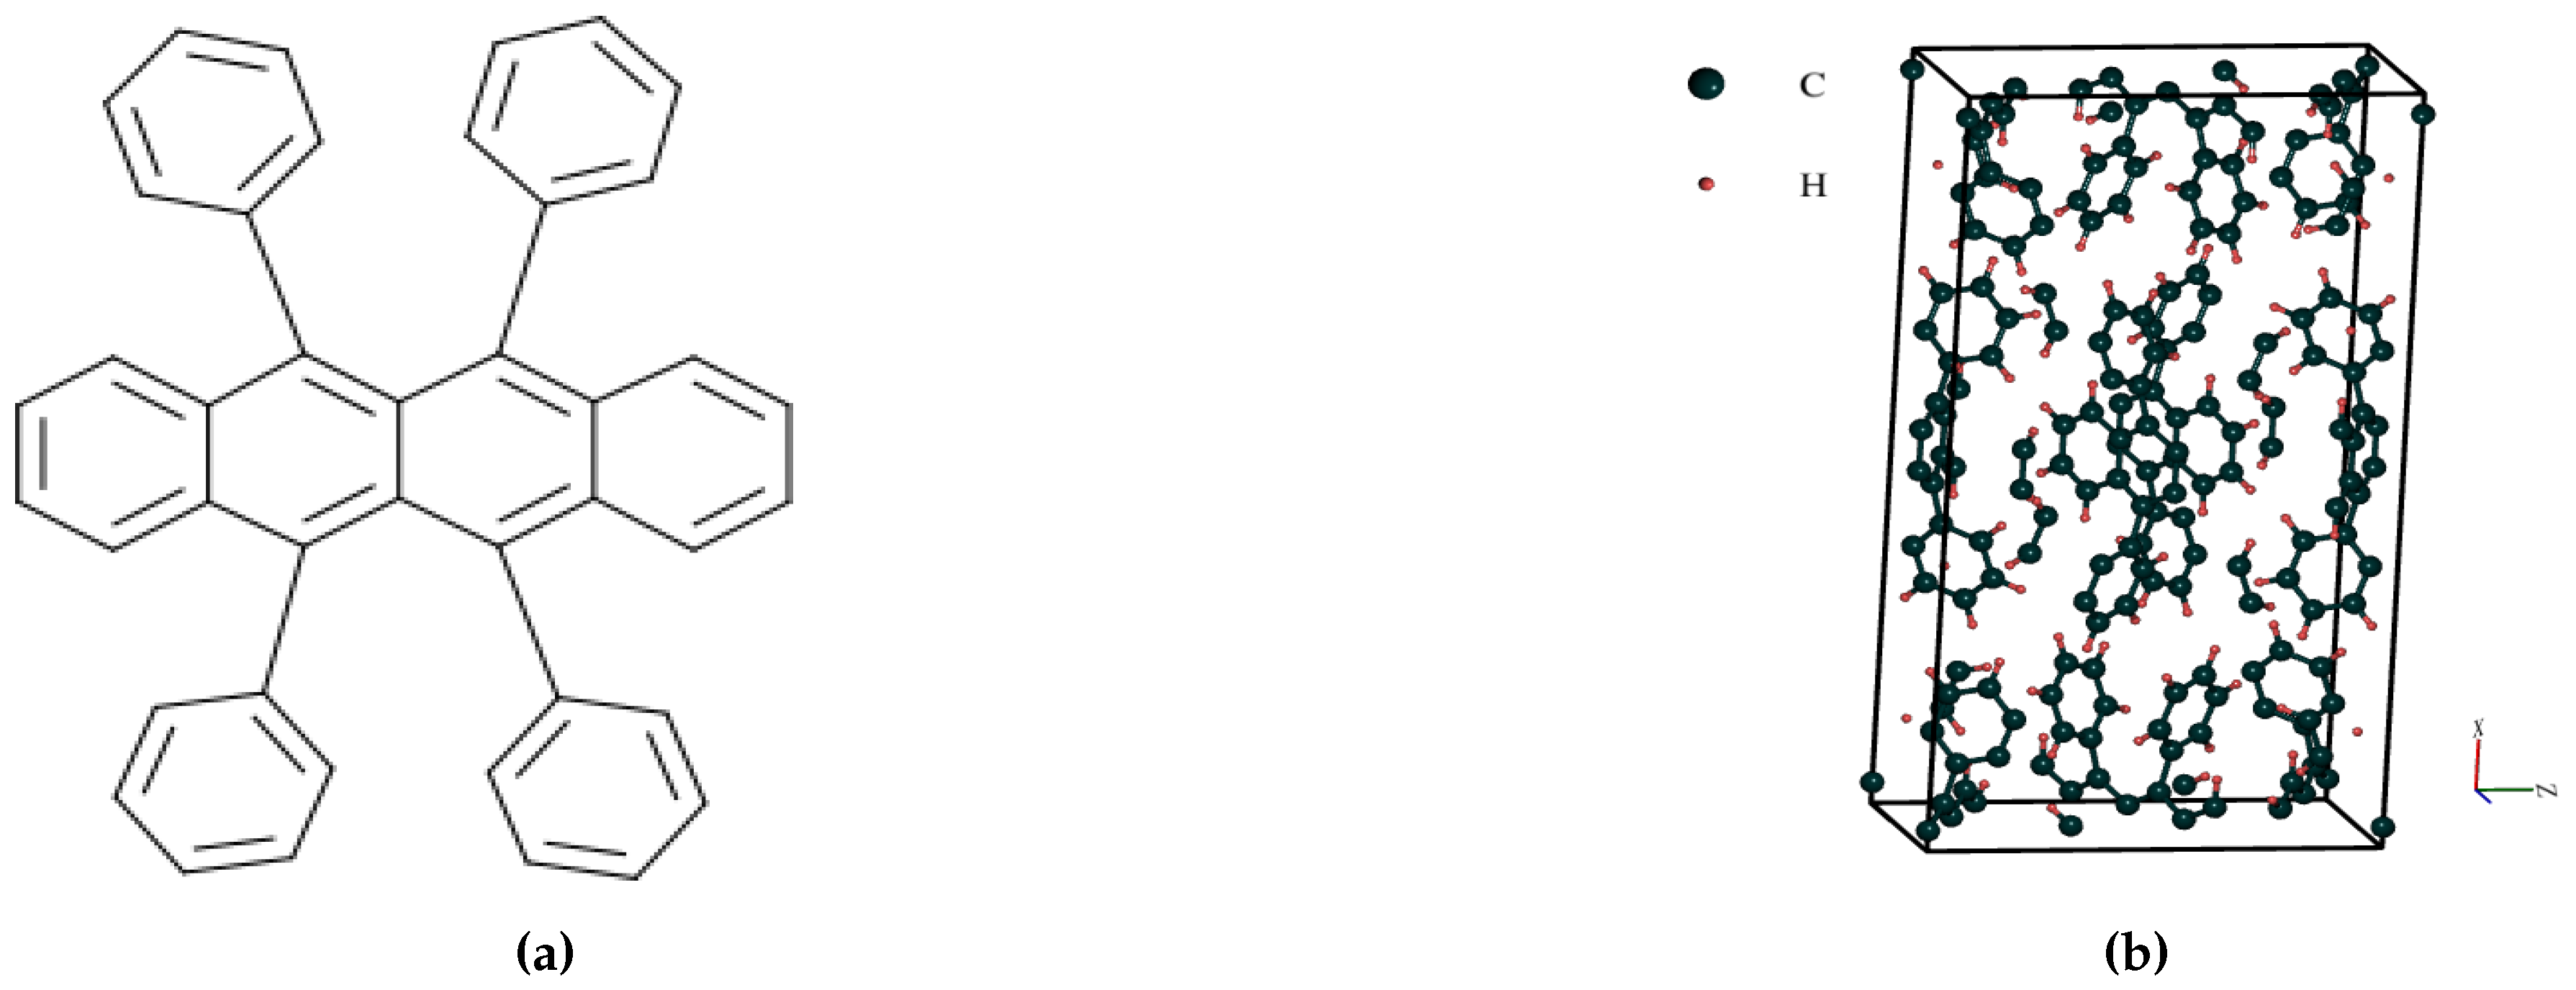
3.1. Structural Properties of Orthorhombic Rubrene
| Reference | Lattice Constants | Method/Theory | ||
|---|---|---|---|---|
| a () | b () | c () | ||
| Present work | 26.79 | 7.17 | 14.21 | GGA |
| Ref. [33] | 26.86 | 7.19 | 14.43 | GGA |
| Ref. [34] | 26.660 | 7.142 | 14.025 | vdW-DFT |
| Ref. [34] | 26.965 | 7.206 | 14.442 | Experiment at 294K |
| Ref. [35] | 26.789 | 7.170 | 14.211 | Experiment at 100K |
| Ref. [36] | 14.1289 | 7.1455 | 26.7450 | GGA |
3.2. Electronic Properties
| Reference | Band Gap | Theory | |
|---|---|---|---|
| Nature | Energy (ev) | ||
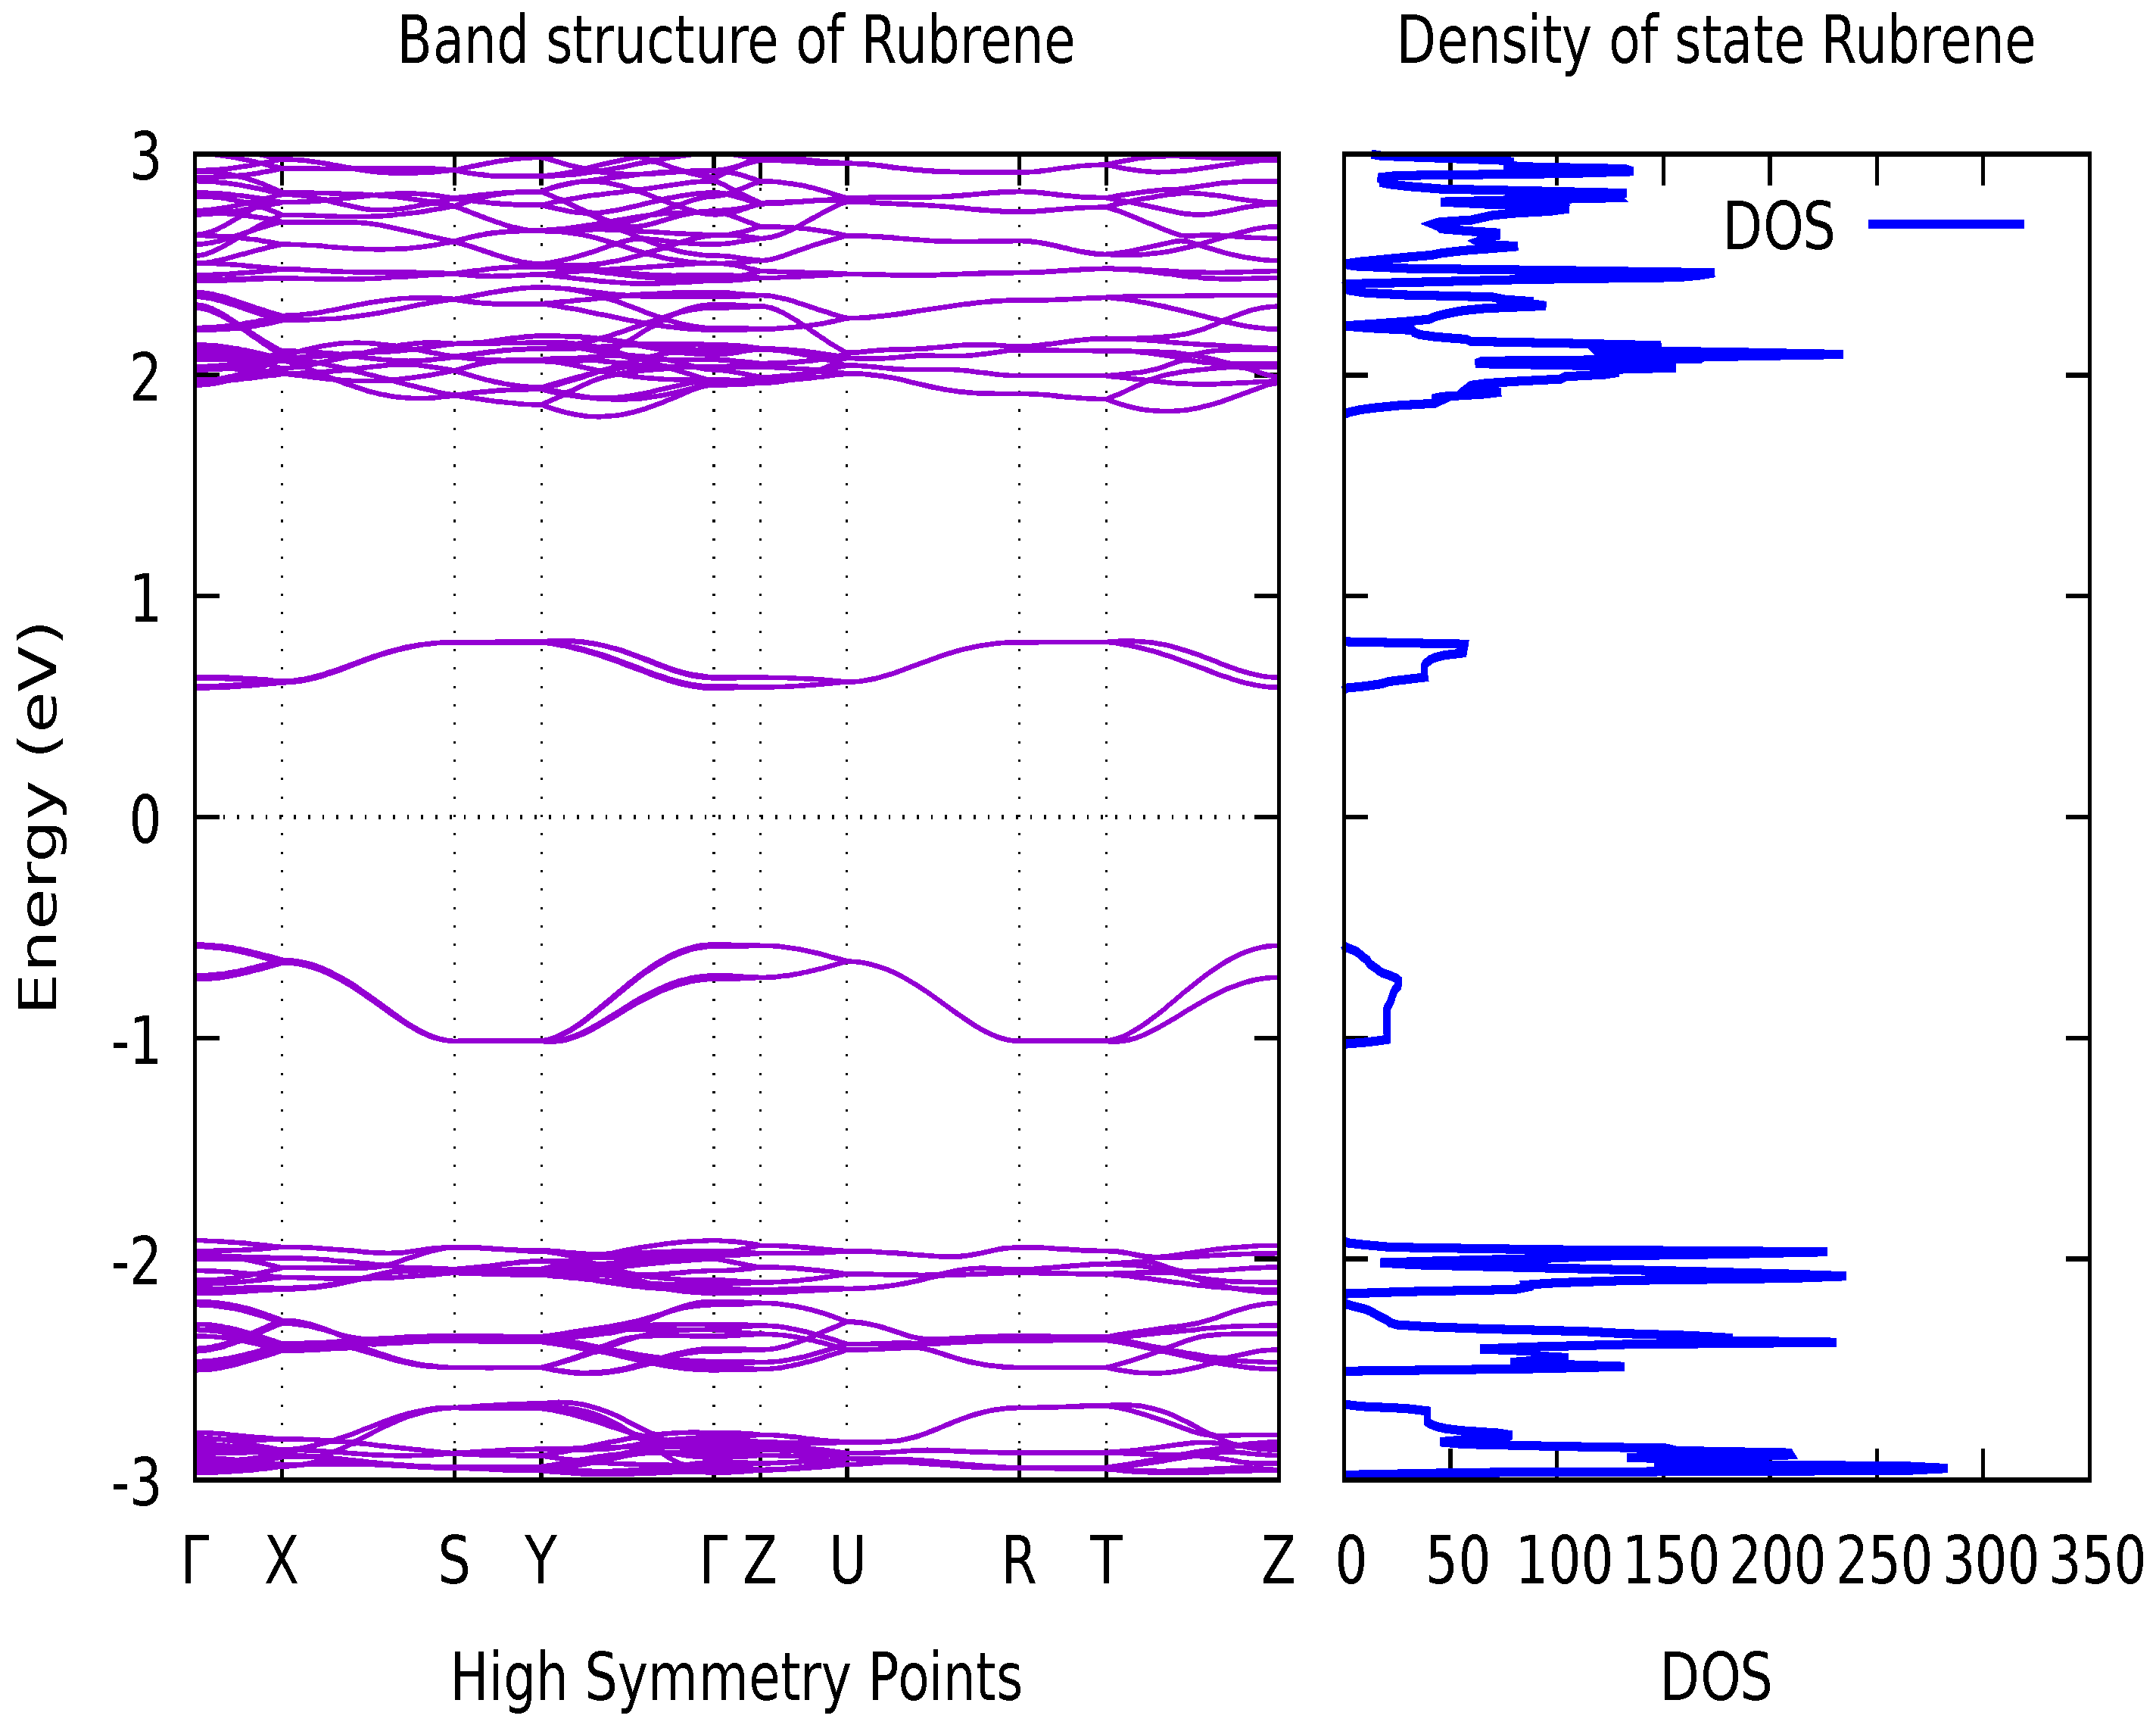
| Present work | Direct | 1.26 | PBE |
| Ref. [36] | Direct | 1.13 | PBE |
| Ref. [40] | Direct | 1.357 | B3LYP 6-311G |
| Ref. [41] | Direct | 2.50 | B3LYP/6-311G(d,p) |
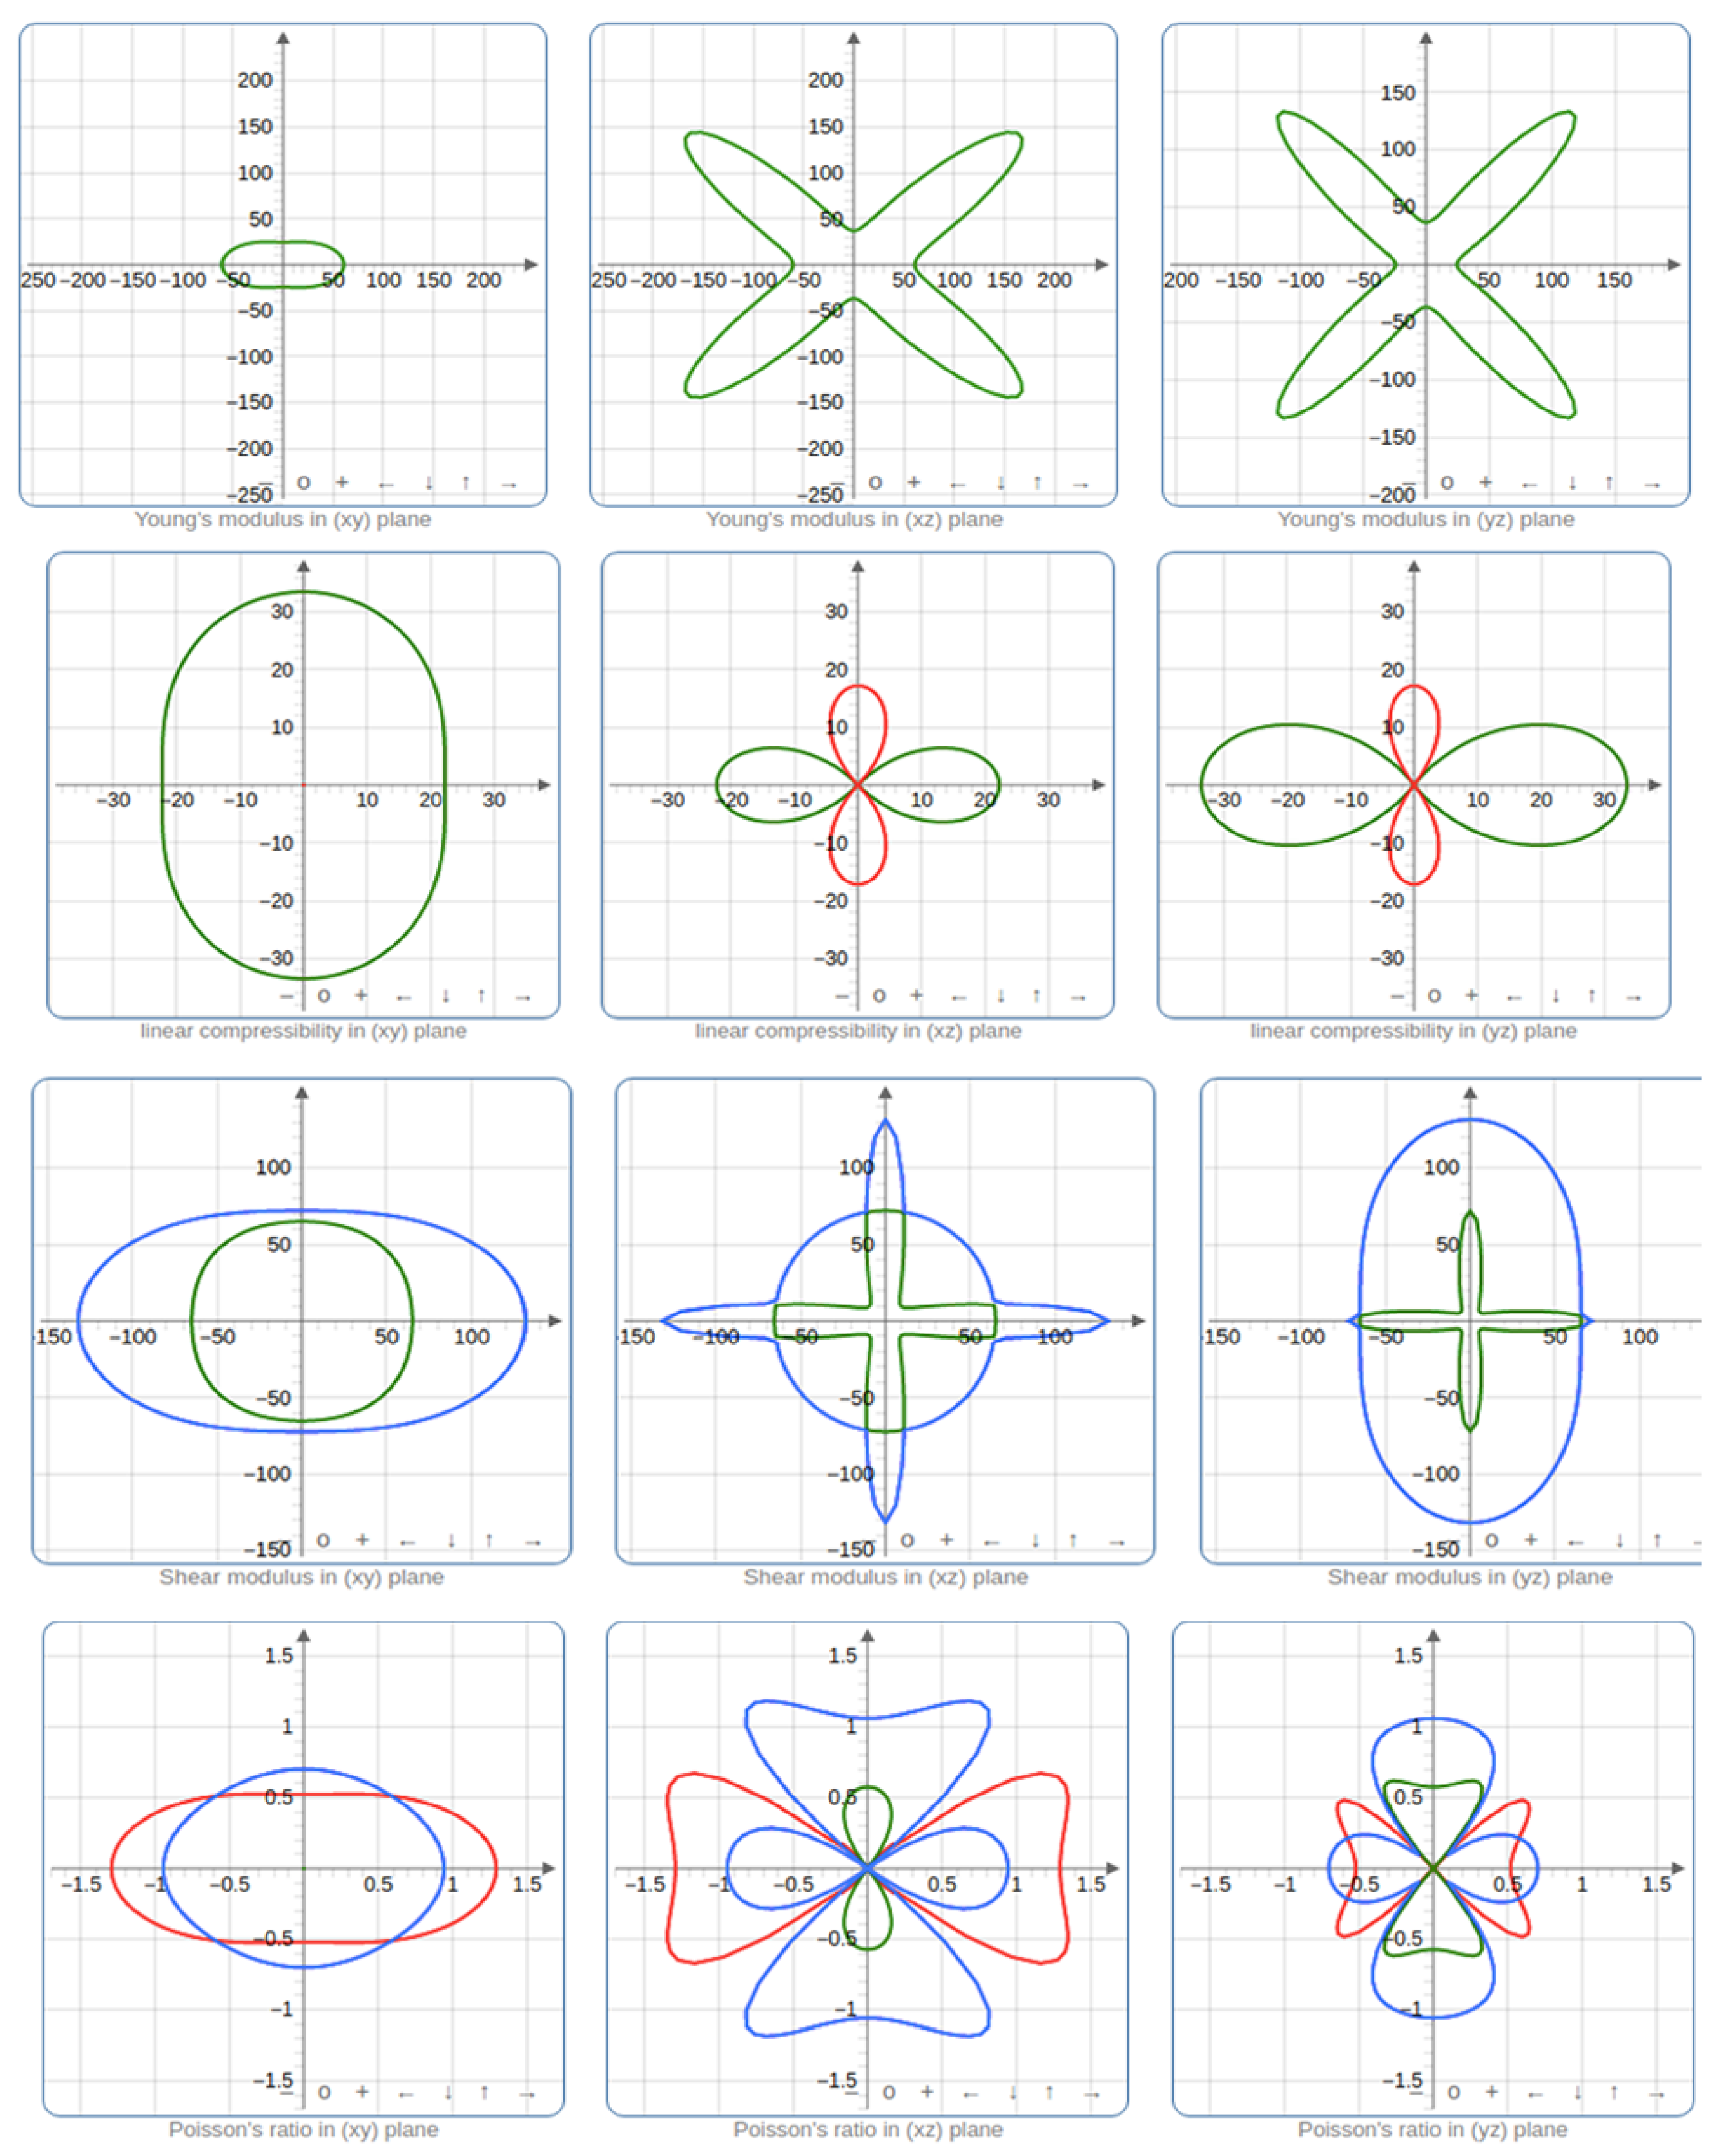
3.3. Elastic Properties
| Reference | This work | Ref. [20] | Ref. [34] | Ref. [34] |
|---|---|---|---|---|
| Method | PBE | AIREBO | vdw-DFT | Experiment |
| C11 (GPa) | 18.8 | 15.54 | 25.31 | 18.48 |
| C12 (GPa) | -8.7 | 1.08 | 6.94 | 2.63 |
| C13 (GPa) | 1.6 | 2.08 | 6.78 | 7.68 |
| C22 (GPa) | 13.6 | 17.85 | 16.99 | 13.39 |
| C23 (GPa) | 9.4 | 10.82 | 10.53 | 7.77 |
| C33 (GPa) | 14.6 | 13.29 | 13.94 | 14.32 |
| C44 (GPa) | 7.2 | 2.03 | 6.66 | 6.46 |
| C55 (GPa) | 13.2 | 1.97 | 4.41 | 2.8 |
| C66 (GPa) | 6.5 | 3.36 | 3.67 | 6.8 |
| Method | PBE |
|---|---|
| Bulk Modulus (GPa) | 4.163 |
| Shear Modulus (GPa) | 11.519 |
| Young Modulus (GPa) | 5.576 |
| Poisson Ratio | 0.03292 |
| Pugh Ratio (B/G) | 0.74667 |
| Vickers Hardness (GPa) | 1.08 |
| Average Debye sound velocity ( m/s ) | 2384.484 |
| Debye temperature (K) | 331.008 |
| Reference | Method | C22(GPa) | C33 (GPa) | Anisotropy ratio (C22/C33) |
|---|---|---|---|---|
| This work | PBE | 13.6 | 14.6 | 0.93 |
| [34] | vdw-DFT | 15.08 | 12.12 | 1.24 |
| [34] | Experiment | 13.02 | 11.13 | 1.17 |

3.4. Temperature and Doping Dependent Properties
4. Conclusion
Acknowledgments
References
- Jung, J.; Ulański, J. , Charge Carrier Transport in Organic Semiconductor Composites – Models and Experimental Techniques. In Solution-Processable Components for Organic Electronic Devices; John Wiley and Sons, Ltd, 2019; chapter 6, pp. 309–363, [https://onlinelibrary.wiley.com/doi/pdf/10.1002/9783527813872.ch6]. [CrossRef]
- Ahmad, S. Organic semiconductors for device applications: current trends and future prospects. Journal of Polymer Engineering 2014, 34, 279–338. [Google Scholar] [CrossRef]
- Dey, A.; Singh, A.; Das, D.; Iyer, P. Organic Semiconductors: A New Future of Nanodevices and Applications 2015. pp. 97–128. [CrossRef]
- Diemer, P.J.; Harper, A.F.; Niazi, M.R.; Petty II, A.J.; Anthony, J.E.; Amassian, A.; Jurchescu, O.D. Laser-Printed Organic Thin-Film Transistors. Advanced Materials Technologies 2017, 2, 1700167. [Google Scholar] [CrossRef]
- Kim, J.T.; Lee, J.; Jang, S.; Yu, Z.; Park, J.; Jung, E.; Lee, S.; Song, M.H.; Whang, D.R.; Wu, S.; Park, S.H.; Chang, D.; Lee, B.R. Solution Processable Small Molecules as Efficient Electron Transport Layers in Organic Optoelectronic Devices. Journal of Materials Chemistry A 2020, 8. [Google Scholar] [CrossRef]
- Riede, M.; Lüssem, B.; Leo, K. Organic Semiconductors. Comprehensive Semiconductor Science and Technology, p. 448–507. [CrossRef]
- Walker, A.B. Multiscale Modeling of Charge and Energy Transport in Organic Light-Emitting Diodes and Photovoltaics. Proceedings of the IEEE 2009, 97, 1587–1596. [Google Scholar] [CrossRef]
- Chen, F.C. Organic Semiconductors. Encyclopedia of Modern Optics, p. 220–231. [CrossRef]
- El-Saba, M. , Carrier Transport in Organic Semiconductors and Insulators; 2017. [CrossRef]
- Kim, J.; Yasuda, T.; Yang, Y.; Adachi, C. Advanced Materials 2013, 25, 2666–2671. [CrossRef]
- Choi, M.; Lee, H.N. Light-Emission and Electricity-Generation Properties of Photovoltaic Organic Light-Emitting Diodes with Rubrene/DBP Light-Emission and Electron-Donating Layers. International Journal of Photoenergy 2014, 2014, 361861. [Google Scholar] [CrossRef]
- Saxena, K.; Mehta, D.; Rai, V.K.; Srivastava, R.; Chauhan, G.; Kamalasanan, M.; Jain, V. Studies on organic light-emitting diodes based on rubrene-doped zinc quinolate. Physica Status Solidi (a) 2009, 206, 1660–1663. [Google Scholar] [CrossRef]
- Weinberg-Wolf, J.R.; McNeil, L.E.; Liu, S.; Kloc, C. Evidence of low intermolecular coupling in rubrene single crystals by Raman scattering. Journal of Physics: Condensed Matter 2007, 19, 276204. [Google Scholar] [CrossRef]
- Sai, N.; Tiago, M.; Chelikowsky, J.; Reboredo, F. Optical spectra and exchange-correlation effects in molecular crystals. Physical Review B, 77. [CrossRef]
- Wikipedia contributors. Rubrene — Wikipedia, The Free Encyclopedia, 2021. [Online; accessed 11-February-2022].
- Reyes-Martinez, M.; Crosby, A.; Briseno, A. Nat. Commun, 6, 6948.
- Lin, K.; Wang, Y.; Chen, K.; Ho, C.; Yang, C.; Shen, J.; Chiu, K. Scientific Reports 2017, 7. Funding Information: We gratefully acknowledge financial supports from Chung Yuan Christian University (Grant number CYCU-107011022) and from the Ministry of Science and Technology of ROC (Grant numbers MOST 104-2112-M-033-005 and MOST 105-2112-M-033-008). Publisher Copyright: © The Author(s) 2017. [CrossRef]
- Majewska, N.; Gazda, M.; Jendrzejewski, R.; Majumdar, S.; Sawczak, M.; Śliwiński, G. Organic semiconductor rubrene thin films deposited by pulsed laser evaporation of solidified solutions. Proc. SPIE 10453, Third International Conference on Applications of Optics and Photonics, Vol. 104532H. [CrossRef]
- Zeng, X.; Zhang, D.; Duan, L.; Wang, L.; Dong, G.; Qiu, Y. Morphology and fluorescence spectra of rubrene single crystals grown by physical vapor transport. Applied Surface Science, 253, 6047–6051. [CrossRef]
- Reyes-Martinez, M.; Ramasubramaniam, A.; Briseno, A.; Crosby, A. The Intrinsic Mechanical Properties of Rubrene Single Crystals. Advanced Materials, 24, 5548–5552. [CrossRef]
- Monkhorst, H.J.; Pack, J.D. Special points for Brillouin-zone integrations. Phys. Rev. B 1976, 13, 5188–5192. [Google Scholar] [CrossRef]
- Perdew, J.P.; Burke, K.; Ernzerhof, M. Generalized Gradient Approximation Made Simple. Phys. Rev. Lett. 1996, 77, 3865–3868. [Google Scholar] [CrossRef] [PubMed]
- Perdew, J.P.; Chevary, J.A.; Vosko, S.H.; Jackson, K.A.; Pederson, M.R.; Singh, D.J.; Fiolhais, C. Atoms, molecules, solids, and surfaces: Applications of the generalized gradient approximation for exchange and correlation. Phys. Rev. B 1992, 46, 6671–6687. [Google Scholar] [CrossRef] [PubMed]
- Perdew, J.P.; Ruzsinszky, A.; Csonka, G.I.; Vydrov, O.A.; Scuseria, G.E.; Constantin, L.A.; Zhou, X.; Burke, K. Restoring the Density-Gradient Expansion for Exchange in Solids and Surfaces. Phys. Rev. Lett. 2008, 100, 136406. [Google Scholar] [CrossRef] [PubMed]
- Hohenberg, P.; Kohn, W. Inhomogeneous Electron Gas. Phys. Rev. 1964, 136, B864–B871. [Google Scholar] [CrossRef]
- Kohn, W.; Sham, L.J. Self-Consistent Equations Including Exchange and Correlation Effects. Phys. Rev. 1965, 140, A1133–A1138. [Google Scholar] [CrossRef]
- Giannozzi, P.; Baroni, S.; Bonini, N.; Calandra, M.; Car, R.; Cavazzoni, C.; Ceresoli, D.; Chiarotti, G.; Cococcioni, M.; Dabo, I. Quantum Espresso: a modular and open-source software project for quantum simulations of materials. Journal of physics: Condensed matter, 21, 395502.
- Giannozzi, P.; Andreussi, O.; Brumme, T.; Bunau, O.; Nardelli, M.; Calandra, M.; Car, R.; Cavazzoni, C.; Ceresoli, D.; Cococcioni, M. Advanced capabilities for materials modelling with Quantum ESPRESSO. Journal of Physics: Condensed Matter, 29, 465901.
- Vanderbilt, D. Soft self-consistent pseudopotentials in a generalized eigenvalue formalism. Phys. Rev. B 1990, 41, 7892–7895. [Google Scholar] [CrossRef] [PubMed]
- Baroni, S.; De Gironcoli, S.; Dal Corso, A.; Giannozzi, P. Phonons and related crystal properties from density-functional perturbation theory. Reviews of Modern Physics, 73, 515.
- Louail, L.; Maouche, D.; Roumili, A.; Sahraoui, F. Calculation of elastic constants of 4d transition metals. Mater. Lett, 58, 2975–2978.
- Xing, G.; Sun, J.; Li, Y.; Fan, X.; Zheng, W.; Singh, D. The thermoelectric fitness function. Phys. Rev. Mater, 1, 065405, 079901.
- Wang, D.; Tang, L.; Long, M.; Shuai, Z. First-principles investigation of organic semiconductors for thermoelectric applications. The Journal of Chemical Physics, 131, 224704. [CrossRef]
- Zhang, Y.; Manke, D.; Sharifzadeh, S.; Briseno, A.; Ramasubramaniam, A.; Koski, K. The elastic constants of rubrene determined by Brillouin scattering and density functional theory. Applied Physics Letters, 110, 071903. [CrossRef]
- Jurchescu, O.; Meetsma, A.; Palstra, T.; Crystallogr, A. Sect. B: Struct. Sci, 62, 330.
- Yanagisawa, S.; Morikawa, Y.; Schindlmayr, A. HOMO band dispersion of crystalline rubrene: Effects of self-energy corrections within the GW approximation. Physical Review B, 88. [CrossRef]
- Podzorov, V.; Menard, E.; Borissov, A.; Kiryukhin, V.; Rogers, J.; Gershenson, M. Intrinsic charge transport on the surface of organic semiconductors. Phys. Rev. Lett, 93.
- Yamagishi, M.; Takeya, J.; Tominari, Y.; Nakazawa, Y.; Kuroda, T.; Ikehata, S.; Uno, M.; Nishikawa, T.; Kawase, T. High-mobility double-gate organic single-crystal transistors with organic crystal gate insulators. Appl. Phys. Lett, 90, 182117.
- Fumagalli, E.M. Growth and physical properties of crystalline rubrene. Università degli Studi di Milano-Bicocca. Doctorate in Materials Science.
- Musa, A.; Gidado, A.; Mohammed, L.; Yunusa, K.; Suleiman, A. Molecular and Electronic Properties of Rubrene and Its Cyanide Derivative Using Density Functional Theory (DFT.
- Zhang, M.; Hua, Z.; Liu, W.; Liu, H.; He, S.; Zhu, C.; Zhu, Y. A DFT study on the photoelectric properties of rubrene and its derivatives. Journal of Molecular Modeling, 21. [CrossRef]
- Missaoui, A.; Khabthani, J.; Laissardière, G.; Mayou, D. Two-Dimensional Electronic Transport in Rubrene: The Impact of Inter-Chain Coupling. Entropy, 26. [CrossRef]
- Mukherjee, T.; Sinha, S.; Mukherjee, M. Electronic structure of twisted and planar rubrene molecules: a density functional study. Physical Chemistry Chemical Physics, 20, 18623–18629. [CrossRef]
- Rang, Z.; Nathan, M.; Ruden, P.; Podzorov, V. ; Gershenson.
- Bisri, S.; Takenobu, T.; Takahashi, T.; Iwasa, Y. Electron transport in rubrene single-crystal transistors. Appl. Phys. Lett, 96, 183304.
- Fan, Q.; Wei, Q.; Yan, H.; Zhang, M.; Zhang, D.; Zhang, J. A New Potential Superhard Phase of OsN 2. Acta Physica Polonica, A, 126.
- Hill, R. Proceedings of the Physical Society. Section A, A65, 349. [CrossRef]
- Pugh, S. XCII. Relations between the Elastic Moduli and the Plastic Properties of Polycrystalline Pure Metals. The London, Edinburgh and Dublin Philosophical Magazine and Journal of Science, 45, 823–843.
- Modeling hardness of polycrystalline materials and bulk metallic glasses. Intermetallics 2011, 19, 1275–1281. [CrossRef]
- Machida, S.; Nakayama, Y.; Duhm, S.; Xin, Q.; Funakoshi, A.; Ogawa, N.; Ishii, H. Highest-Occupied-Molecular-Orbital Band Dispersion of Rubrene Single Crystals as Observed by Angle-Resolved Ultraviolet Photoelectron Spectroscopy. Physical Review Letters, 104. [CrossRef]
Disclaimer/Publisher’s Note: The statements, opinions and data contained in all publications are solely those of the individual author(s) and contributor(s) and not of MDPI and/or the editor(s). MDPI and/or the editor(s) disclaim responsibility for any injury to people or property resulting from any ideas, methods, instructions or products referred to in the content. |
© 2024 by the authors. Licensee MDPI, Basel, Switzerland. This article is an open access article distributed under the terms and conditions of the Creative Commons Attribution (CC BY) license (http://creativecommons.org/licenses/by/4.0/).


