Submitted:
26 March 2024
Posted:
26 March 2024
You are already at the latest version
Abstract
Keywords:
1. Introduction
2. Materials and Methods
2.1. Reagents
2.2. Hydrothermal Synthesis of Ni-Doped CeO2 Nanorods
2.3. Characterization
3. Results and Discussion
4. Conclusions
Author Contributions
Funding
Data Availability Statement
Acknowledgments
Conflicts of Interest
References
- Yang, J.; Xie, N.; Zhang, J.; Fan, W.; Huang, Y.; Tong, Y. Defect Engineering Enhances the Charge Separation of CeO2 Nanorods toward Photocatalytic Methyl Blue Oxidation. Nanomaterials 2020, 10, 2307. [Google Scholar] [CrossRef] [PubMed]
- Murray, S.; Wei, W.; Hart, R.; Fan, J.; Chen, W.; Lu, P. Solar Degradation of Toxic Colorants in Polluted Water by Thermally Tuned Ceria Nanocrystal-Based Nanofibers. ACS Appl. Nano Mater. 2020, 3, 11194–11202. [Google Scholar] [CrossRef]
- Yu, D.; Jia, Y.; Yang, Z.; Zhang, H.; Zhao, J.; Zhao, Y.; Weng, B.; Dai, W.; Li, Z.; Wang, P.; et al. Solar Photocatalytic Oxidation of Methane to Methanol with Water over RuOx /ZnO/CeO2 Nanorods. ACS Sustain. Chem. Eng. 2022, 10, 16–22. [Google Scholar] [CrossRef]
- Chen, T.; Zheng, G.; Liu, K.; Zhang, G.; Huang, Z.; Liu, M.; Zhou, J.; Wang, S. Application of CuNi–CeO2 Fuel Electrode in Oxygen Electrode Supported Reversible Solid Oxide Cell. Int. J. Hydrog. Energy 2023, 48, 9565–9573. [Google Scholar] [CrossRef]
- Zhao, M.; Geng, S.; Chen, G.; Wang, F. Efficient FeCoNi/CeO2 Coatings for Solid Oxide Fuel Cell Steel Interconnect Applications. Int. J. Hydrog. Energy 2024, 50, 1087–1094. [Google Scholar] [CrossRef]
- Li, J.; Xie, J.; Li, D.; Yu, L.; Xu, C.; Yan, S.; Lu, Y. An Interface Heterostructure of NiO and CeO2 for Using Electrolytes of Low-Temperature Solid Oxide Fuel Cells. Nanomaterials 2021, 11, 2004. [Google Scholar] [CrossRef]
- Zhang, Y.; Zhu, D.; Jia, X.; Liu, J.; Li, X.; Ouyang, Y.; Li, Z.; Gao, X.; Zhu, C. Novel n–i CeO2 /a-Al2O3 Heterostructure Electrolyte Derived from the Insulator a-Al2O3 for Fuel Cells. ACS Appl. Mater. Interfaces 2023, 15, 2419–2428. [Google Scholar] [CrossRef] [PubMed]
- Ema, T.; Choi, P.G.; Takami, S.; Masuda, Y. Facet-Controlled Synthesis of CeO2 Nanoparticles for High-Performance CeO2 Nanoparticle/SnO2 Nanosheet Hybrid Gas Sensors. ACS Appl. Mater. Interfaces 2022, 14, 56998–57007. [Google Scholar] [CrossRef] [PubMed]
- Hu, Q.; Huang, B.; Li, Y.; Zhang, S.; Zhang, Y.; Hua, X.; Liu, G.; Li, B.; Zhou, J.; Xie, E.; et al. Methanol Gas Detection of Electrospun CeO2 Nanofibers by Regulating Ce3+/ Ce4+ Mole Ratio via Pd Doping. Sens. Actuators B Chem. 2020, 307, 127638. [Google Scholar] [CrossRef]
- Hu, Q.; Jiang, H.; Zhang, W.; Wang, X.; Wang, X.; Zhang, Z. Unveiling the Synergistic Effects of Hydrogen Annealing on CeO2 Nanofibers for Highly Sensitive Acetone Gas Detection: Role of Ce3+ Ions and Oxygen Vacancies. Appl. Surf. Sci. 2023, 640, 158411. [Google Scholar] [CrossRef]
- Yuan, K.; Wang, C.-Y.; Zhu, L.-Y.; Cao, Q.; Yang, J.-H.; Li, X.-X.; Huang, W.; Wang, Y.-Y.; Lu, H.-L.; Zhang, D.W. Fabrication of a Micro-Electromechanical System-Based Acetone Gas Sensor Using CeO2 Nanodot-Decorated WO 3 Nanowires. ACS Appl. Mater. Interfaces 2020, 12, 14095–14104. [Google Scholar] [CrossRef] [PubMed]
- Basina, G.; Polychronopoulou, K.; Zedan, A.F.; Dimos, K.; Katsiotis, M.S.; Fotopoulos, A.P.; Ismail, I.; Tzitzios, V. Ultrasmall Metal-Doped CeO2 Nanoparticles for Low-Temperature CO Oxidation. ACS Appl. Nano Mater. 2020, 3, 10805–10813. [Google Scholar] [CrossRef]
- Ahasan, M.R.; Wang, R. CeO2 Nanorods Supported CuOx-RuOx Bimetallic Catalysts for Low Temperature CO Oxidation. J. Colloid Interface Sci. 2024, 654, 1378–1392. [Google Scholar] [CrossRef] [PubMed]
- Fan, J.; Hu, S.; Li, C.; Wang, Y.; Chen, G. Effect of Loading Method on Catalytic Performance of Pt/CeO2 System for CO Oxidation. Mol. Catal. 2024, 558, 114013. [Google Scholar] [CrossRef]
- Kim, H.Y.; Lee, H.M.; Henkelman, G. CO Oxidation Mechanism on CeO 2 -Supported Au Nanoparticles. J. Am. Chem. Soc. 2012, 134, 1560–1570. [Google Scholar] [CrossRef] [PubMed]
- Zhou, Z.; Zhang, J.; Liu, Y. Promoted Low-Temperature CO Oxidation Activity of CeO2 by Cu Doping: The Important Role of Oxygen Vacancies. Fuel 2024, 359, 130434. [Google Scholar] [CrossRef]
- Reina, T.R.; Gonzalez-Castaño, M.; Lopez-Flores, V.; Martínez T, L.M.; Zitolo, A.; Ivanova, S.; Xu, W.; Centeno, M.A.; Rodriguez, J.A.; Odriozola, J.A. Au and Pt Remain Unoxidized on a CeO2 -Based Catalyst during the Water–Gas Shift Reaction. J. Am. Chem. Soc. 2022, 144, 446–453. [Google Scholar] [CrossRef] [PubMed]
- Yu, J.; Qin, X.; Yang, Y.; Lv, M.; Yin, P.; Wang, L.; Ren, Z.; Song, B.; Li, Q.; Zheng, L.; et al. Highly Stable Pt/CeO2 Catalyst with Embedding Structure toward Water–Gas Shift Reaction. J. Am. Chem. Soc. 2024, 146, 1071–1080. [Google Scholar] [CrossRef] [PubMed]
- Shen, X.; Li, Z.; Xu, J.; Li, W.; Tao, Y.; Ran, J.; Yang, Z.; Sun, K.; Yao, S.; Wu, Z.; et al. Upgrading the Low Temperature Water Gas Shift Reaction by Integrating Plasma with a CuOx/CeO2 Catalyst. J. Catal. 2023, 421, 324–331. [Google Scholar] [CrossRef]
- Zhang, K.; Guo, Q.; Wang, Y.; Cao, P.; Zhang, J.; Heggen, M.; Mayer, J.; Dunin-Borkowski, R.E.; Wang, F. Ethylene Carbonylation to 3-Pentanone with In Situ Hydrogen via a Water–Gas Shift Reaction on Rh/CeO2. ACS Catal. 2023, 13, 3164–3169. [Google Scholar] [CrossRef]
- Yu, Y.; He, J.; Wang, T.; Qiu, X.; Chen, K.; Wu, Q.; Shi, D.; Zhang, Y.; Li, H. One-Step Production of Pt–CeO2/N-CNTs Electrocatalysts with High Catalytic Performance toward Methanol Oxidation. Int. J. Hydrog. Energy 2023, 48, 29565–29582. [Google Scholar] [CrossRef]
- Jiang, F.; Wang, S.; Liu, B.; Liu, J.; Wang, L.; Xiao, Y.; Xu, Y.; Liu, X. Insights into the Influence of CeO2 Crystal Facet on CO2 Hydrogenation to Methanol over Pd/CeO2 Catalysts. ACS Catal. 2020, 10, 11493–11509. [Google Scholar] [CrossRef]
- Guo, Y.; Qin, Y.; Liu, H.; Wang, H.; Han, J.; Zhu, X.; Ge, Q. CeO2 Facet-Dependent Surface Reactive Intermediates and Activity during Ketonization of Propionic Acid. ACS Catal. 2022, 12, 2998–3012. [Google Scholar] [CrossRef]
- Reed, K.; Cormack, A.; Kulkarni, A.; Mayton, M.; Sayle, D.; Klaessig, F.; Stadler, B. Exploring the Properties and Applications of Nanoceria: Is There Still Plenty of Room at the Bottom? Env. Sci Nano 2014, 1, 390–405. [Google Scholar] [CrossRef]
- Chauhan, S.; Richards, G.J.; Mori, T.; Yan, P.; Hill, J.P.; Ariga, K.; Zou, J.; Drennan, J. Fabrication of a Nano-Structured Pt-Loaded Cerium Oxide Nanowire and Its Anode Performance in the Methanol Electro-Oxidation Reaction. J. Mater. Chem. A 2013, 1, 6262. [Google Scholar] [CrossRef]
- Li, G.; Lu, F.; Wei, X.; Song, X.; Sun, Z.; Yang, Z.; Yang, S. Nanoporous Ag–CeO2 Ribbons Prepared by Chemical Dealloying and Their Electrocatalytic Properties. J. Mater. Chem. A 2013, 1, 4974. [Google Scholar] [CrossRef]
- Wu, K.; Sun, L.; Yan, C. Recent Progress in Well-Controlled Synthesis of Ceria-Based Nanocatalysts towards Enhanced Catalytic Performance. Adv. Energy Mater. 2016, 6, 1600501. [Google Scholar] [CrossRef]
- Mai, H.-X.; Sun, L.-D.; Zhang, Y.-W.; Si, R.; Feng, W.; Zhang, H.-P.; Liu, H.-C.; Yan, C.-H. Shape-Selective Synthesis and Oxygen Storage Behavior of Ceria Nanopolyhedra, Nanorods, and Nanocubes. J. Phys. Chem. B 2005, 109, 24380–24385. [Google Scholar] [CrossRef] [PubMed]
- Nolan, M.; Fearon, J.; Watson, G. Oxygen Vacancy Formation and Migration in Ceria. Solid State Ion. 2006, 177, 3069–3074. [Google Scholar] [CrossRef]
- Yuan, Z.; Huang, L.; Liu, Y.; Sun, Y.; Wang, G.; Li, X.; Lercher, J.A.; Zhang, Z. Synergy of Oxygen Vacancies and Base Sites for Transfer Hydrogenation of Nitroarenes on Ceria Nanorods. Angew. Chem. 2024, 136, e202317339. [Google Scholar] [CrossRef]
- Abdulwahab, K.O.; Khan, M.M.; Jennings, J.R. Doped Ceria Nanomaterials: Preparation, Properties, and Uses. ACS Omega 2023, 8, 30802–30823. [Google Scholar] [CrossRef] [PubMed]
- Hajjiah, A.; Samir, E.; Shehata, N.; Salah, M. Lanthanide-Doped Ceria Nanoparticles as Backside Coaters to Improve Silicon Solar Cell Efficiency. Nanomaterials 2018, 8, 357. [Google Scholar] [CrossRef] [PubMed]
- Thormann, J.; Maier, L.; Pfeifer, P.; Kunz, U.; Deutschmann, O.; Schubert, K. Steam Reforming of Hexadecane over a Rh/CeO2 Catalyst in Microchannels: Experimental and Numerical Investigation. Int. J. Hydrog. Energy 2009, 34, 5108–5120. [Google Scholar] [CrossRef]
- Yildirim, H.; Pachter, R. Extrinsic Dopant Effects on Oxygen Vacancy Formation Energies in ZrO2 with Implication for Memristive Device Performance. ACS Appl. Electron. Mater. 2019, 1, 467–477. [Google Scholar] [CrossRef]
- Sen, S.; Edwards, T.; Kim, S.K.; Kim, S. Investigation of the Potential Energy Landscape for Vacancy Dynamics in Sc-Doped CeO2. Chem. Mater. 2014, 26, 1918–1924. [Google Scholar] [CrossRef]
- Nabi, G.; Ali, W.; Majid, A.; Alharbi, T.; Saeed, S.; Albedah, M.A. Controlled Growth of Bi-Functional La Doped CeO2 Nanorods for Photocatalytic H2 Production and Supercapacitor Applications. Int. J. Hydrog. Energy 2022, 47, 15480–15490. [Google Scholar] [CrossRef]
- Xiao, M.; Han, D.; Yang, X.; Tsona Tchinda, N.; Du, L.; Guo, Y.; Wei, Y.; Yu, X.; Ge, M. Ni-Doping-Induced Oxygen Vacancy in Pt-CeO2 Catalyst for Toluene Oxidation: Enhanced Catalytic Activity, Water-Resistance, and SO2-Tolerance. Appl. Catal. B Environ. 2023, 323, 122173. [Google Scholar] [CrossRef]
- Yang, Z.; Zheng, D.; Yue, X.; Wang, K.; Hou, Y.; Dai, W.; Fu, X. The Synergy of Ni Doping and Oxygen Vacancies over CeO2 in Visible Light-Assisted Thermal Catalytic Methanation Reaction. Appl. Surf. Sci. 2023, 615, 156311. [Google Scholar] [CrossRef]
- Liu, Z.; Ma, H.; Sorrell, C.C.; Koshy, P.; Wang, B.; Hart, J.N. Enhancement of Light Absorption and Oxygen Vacancy Formation in CeO2 by Transition Metal Doping: A DFT Study. Appl. Catal. Gen. 2024, 670, 119544. [Google Scholar] [CrossRef]
- Lee, J.; Ryou, Y.; Chan, X.; Kim, T.J.; Kim, D.H. How Pt Interacts with CeO2 under the Reducing and Oxidizing Environments at Elevated Temperature: The Origin of Improved Thermal Stability of Pt/CeO2 Compared to CeO 2. J. Phys. Chem. C 2016, 120, 25870–25879. [Google Scholar] [CrossRef]
- D’Angelo, A.M.; Wu, Z.; Overbury, S.H.; Chaffee, A.L. Cu-Enhanced Surface Defects and Lattice Mobility of Pr-CeO2 Mixed Oxides. J. Phys. Chem. C 2016, 120, 27996–28008. [Google Scholar] [CrossRef]
- Zhu, Y.; Seong, G.; Noguchi, T.; Yoko, A.; Tomai, T.; Takami, S.; Adschiri, T. Highly Cr-Substituted CeO2 Nanoparticles Synthesized Using a Non-Equilibrium Supercritical Hydrothermal Process: High Oxygen Storage Capacity Materials Designed for a Low-Temperature Bitumen Upgrading Process. ACS Appl. Energy Mater. 2020, 3, 4305–4319. [Google Scholar] [CrossRef]
- Shyu, J.Z.; Weber, W.H.; Gandhi, H.S. Surface Characterization of Alumina-Supported Ceria. J. Phys. Chem. 1988, 92, 4964–4970. [Google Scholar] [CrossRef]
- Popović, Z.V.; Dohčević-Mitrović, Z.; Konstantinović, M.J.; Šćepanović, M. Raman Scattering Characterization of Nanopowders and Nanowires (Rods). J. Raman Spectrosc. 2007, 38, 750–755. [Google Scholar] [CrossRef]
- Du, X.; Dai, Q.; Wei, Q.; Huang, Y. Nanosheets-Assembled Ni (Co) Doped CeO2 Microspheres toward NO + CO Reaction. Appl. Catal. Gen. 2020, 602, 117728. [Google Scholar] [CrossRef]
- Tiwari, S.; Khatun, N.; Patra, N.; Yadav, A.K.; Bhattacharya, D.; Jha, S.N.; Tseng, C.M.; Liu, S.W.; Biring, S.; Sen, S. Role of Oxygen Vacancies in Co/Ni Substituted CeO2: A Comparative Study. Ceram. Int. 2019, 45, 3823–3832. [Google Scholar] [CrossRef]
- Li, L.; Chen, F.; Lu, J.-Q.; Luo, M.-F. Study of Defect Sites in Ce 1– x Mx O2−δ ( x = 0.2) Solid Solutions Using Raman Spectroscopy. J. Phys. Chem. A 2011, 115, 7972–7977. [Google Scholar] [CrossRef] [PubMed]
- Zhao, P.; Feng, N.; Tan, B.; Huo, Z.; Liu, G.; Wan, H.; Guan, G. Exposed Crystal Facet Tuning of CeO2 for Boosting Catalytic Soot Combustion: The Effect of La Dopant. J. Environ. Chem. Eng. 2022, 10, 108503. [Google Scholar] [CrossRef]
- Cao, Y.; Zhao, L.; Gutmann, T.; Xu, Y.; Dong, L.; Buntkowsky, G.; Gao, F. Getting Insights into the Influence of Crystal Plane Effect of Shaped Ceria on Its Catalytic Performances. J. Phys. Chem. C 2018, 122, 20402–20409. [Google Scholar] [CrossRef]


| CeO2 | 1%Ni-CeO2 | 5% Ni-CeO2 | 15% Ni-CeO2 | |
|---|---|---|---|---|
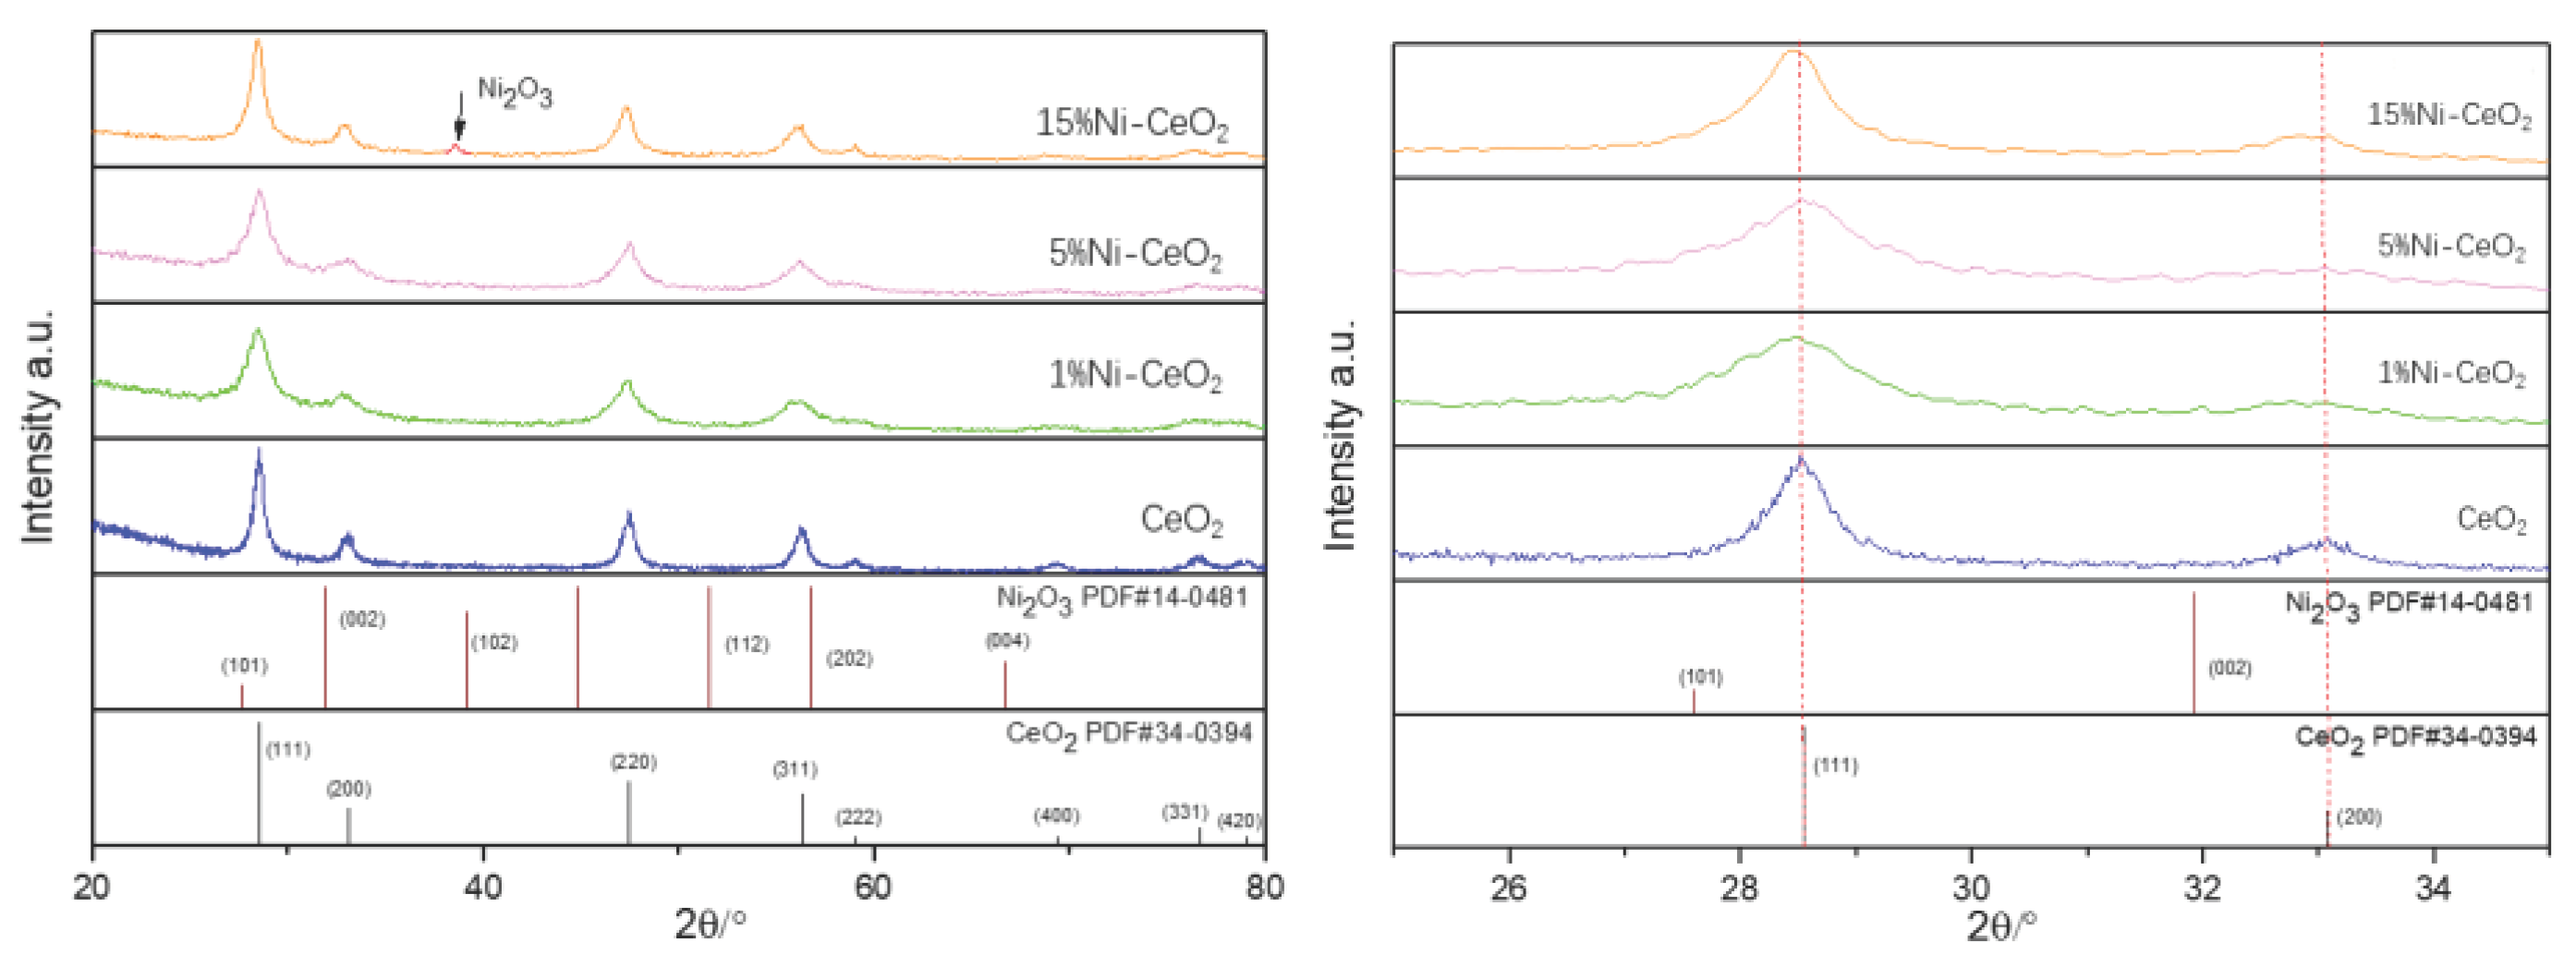
| Lattice constant (Å) | 5.4110 | 5.4064 | 5.3982 | 5.4230 |
| Crystallite size (nm) | 128 | 65 | 60 | 92 |
| CeO2 | 1%Ni-CeO2 | 5% Ni-CeO2 | 15% Ni-CeO2 | |
|---|---|---|---|---|
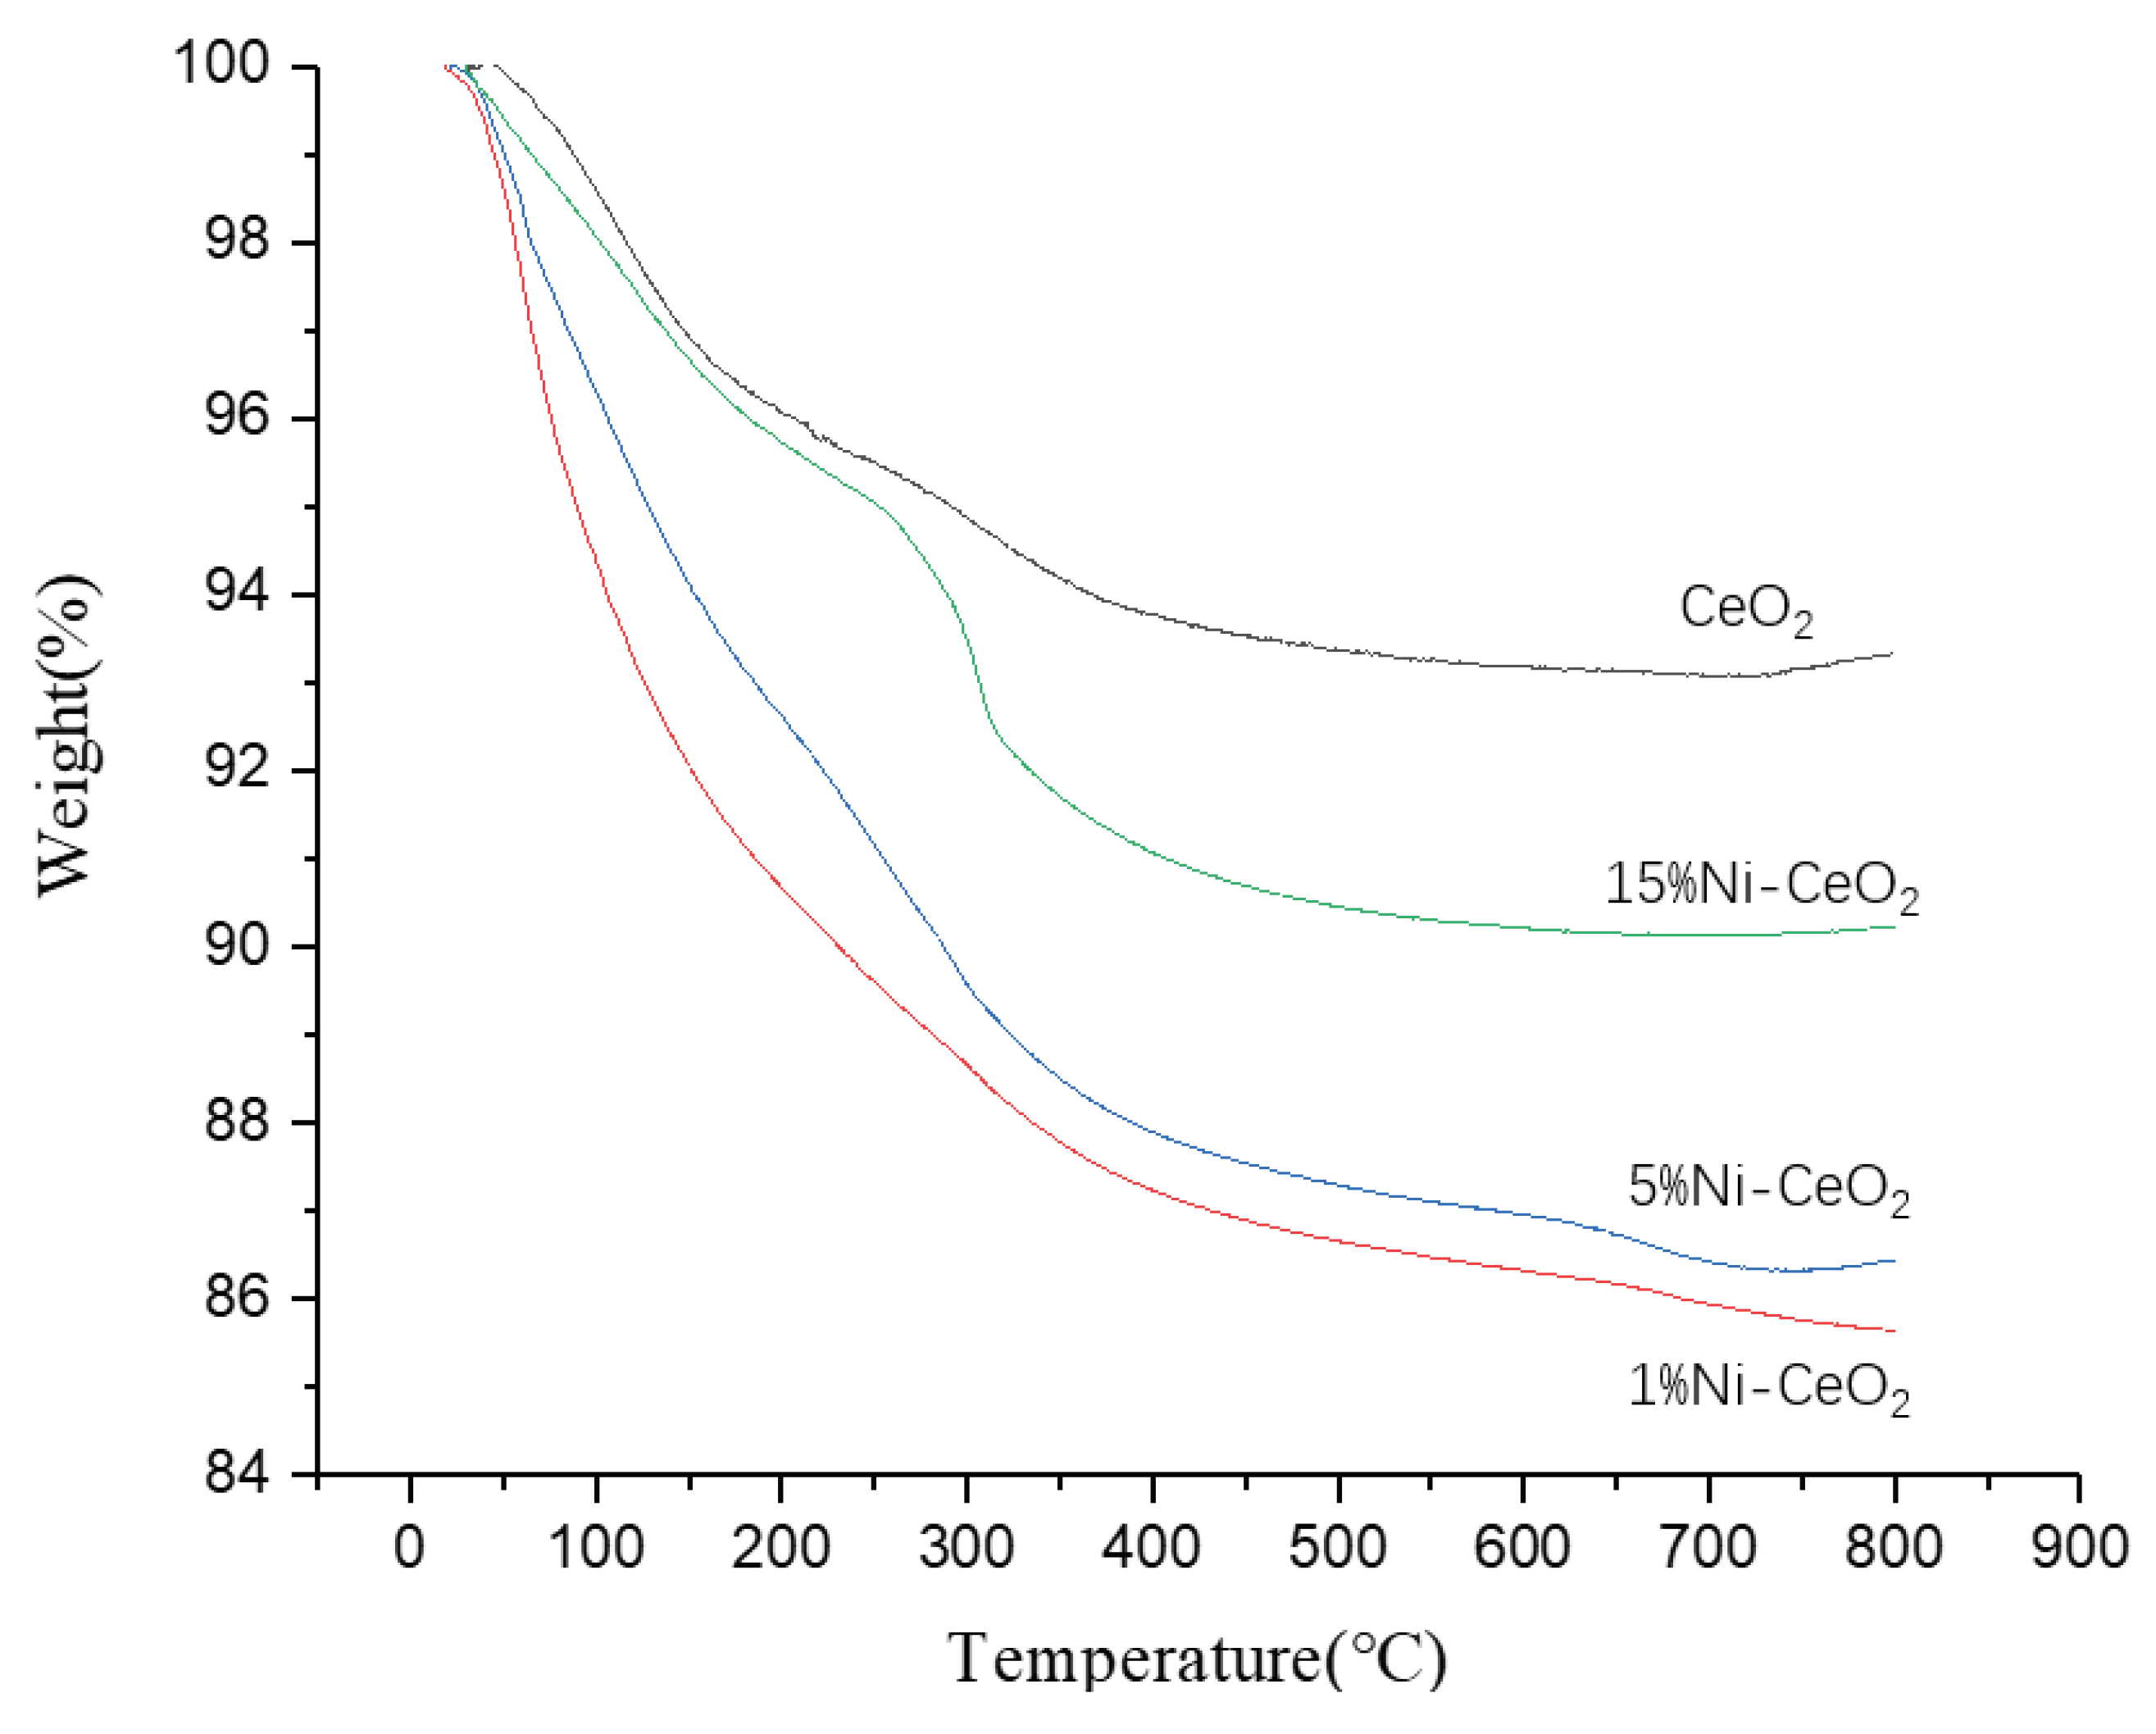
| Surface oxygen | 2wt% | 5wt% | 4wt% | 3wt% |
| Lattice oxygen | 1wt% | 5wt% | 2wt% | 1wt% |
| Total oxygen | 3wt% | 10wt% | 6wt% | 4wt% |
| CeO2 | 1%Ni-CeO2 | 5%Ni-CeO2 | 15%Ni-CeO2 | |
|---|---|---|---|---|
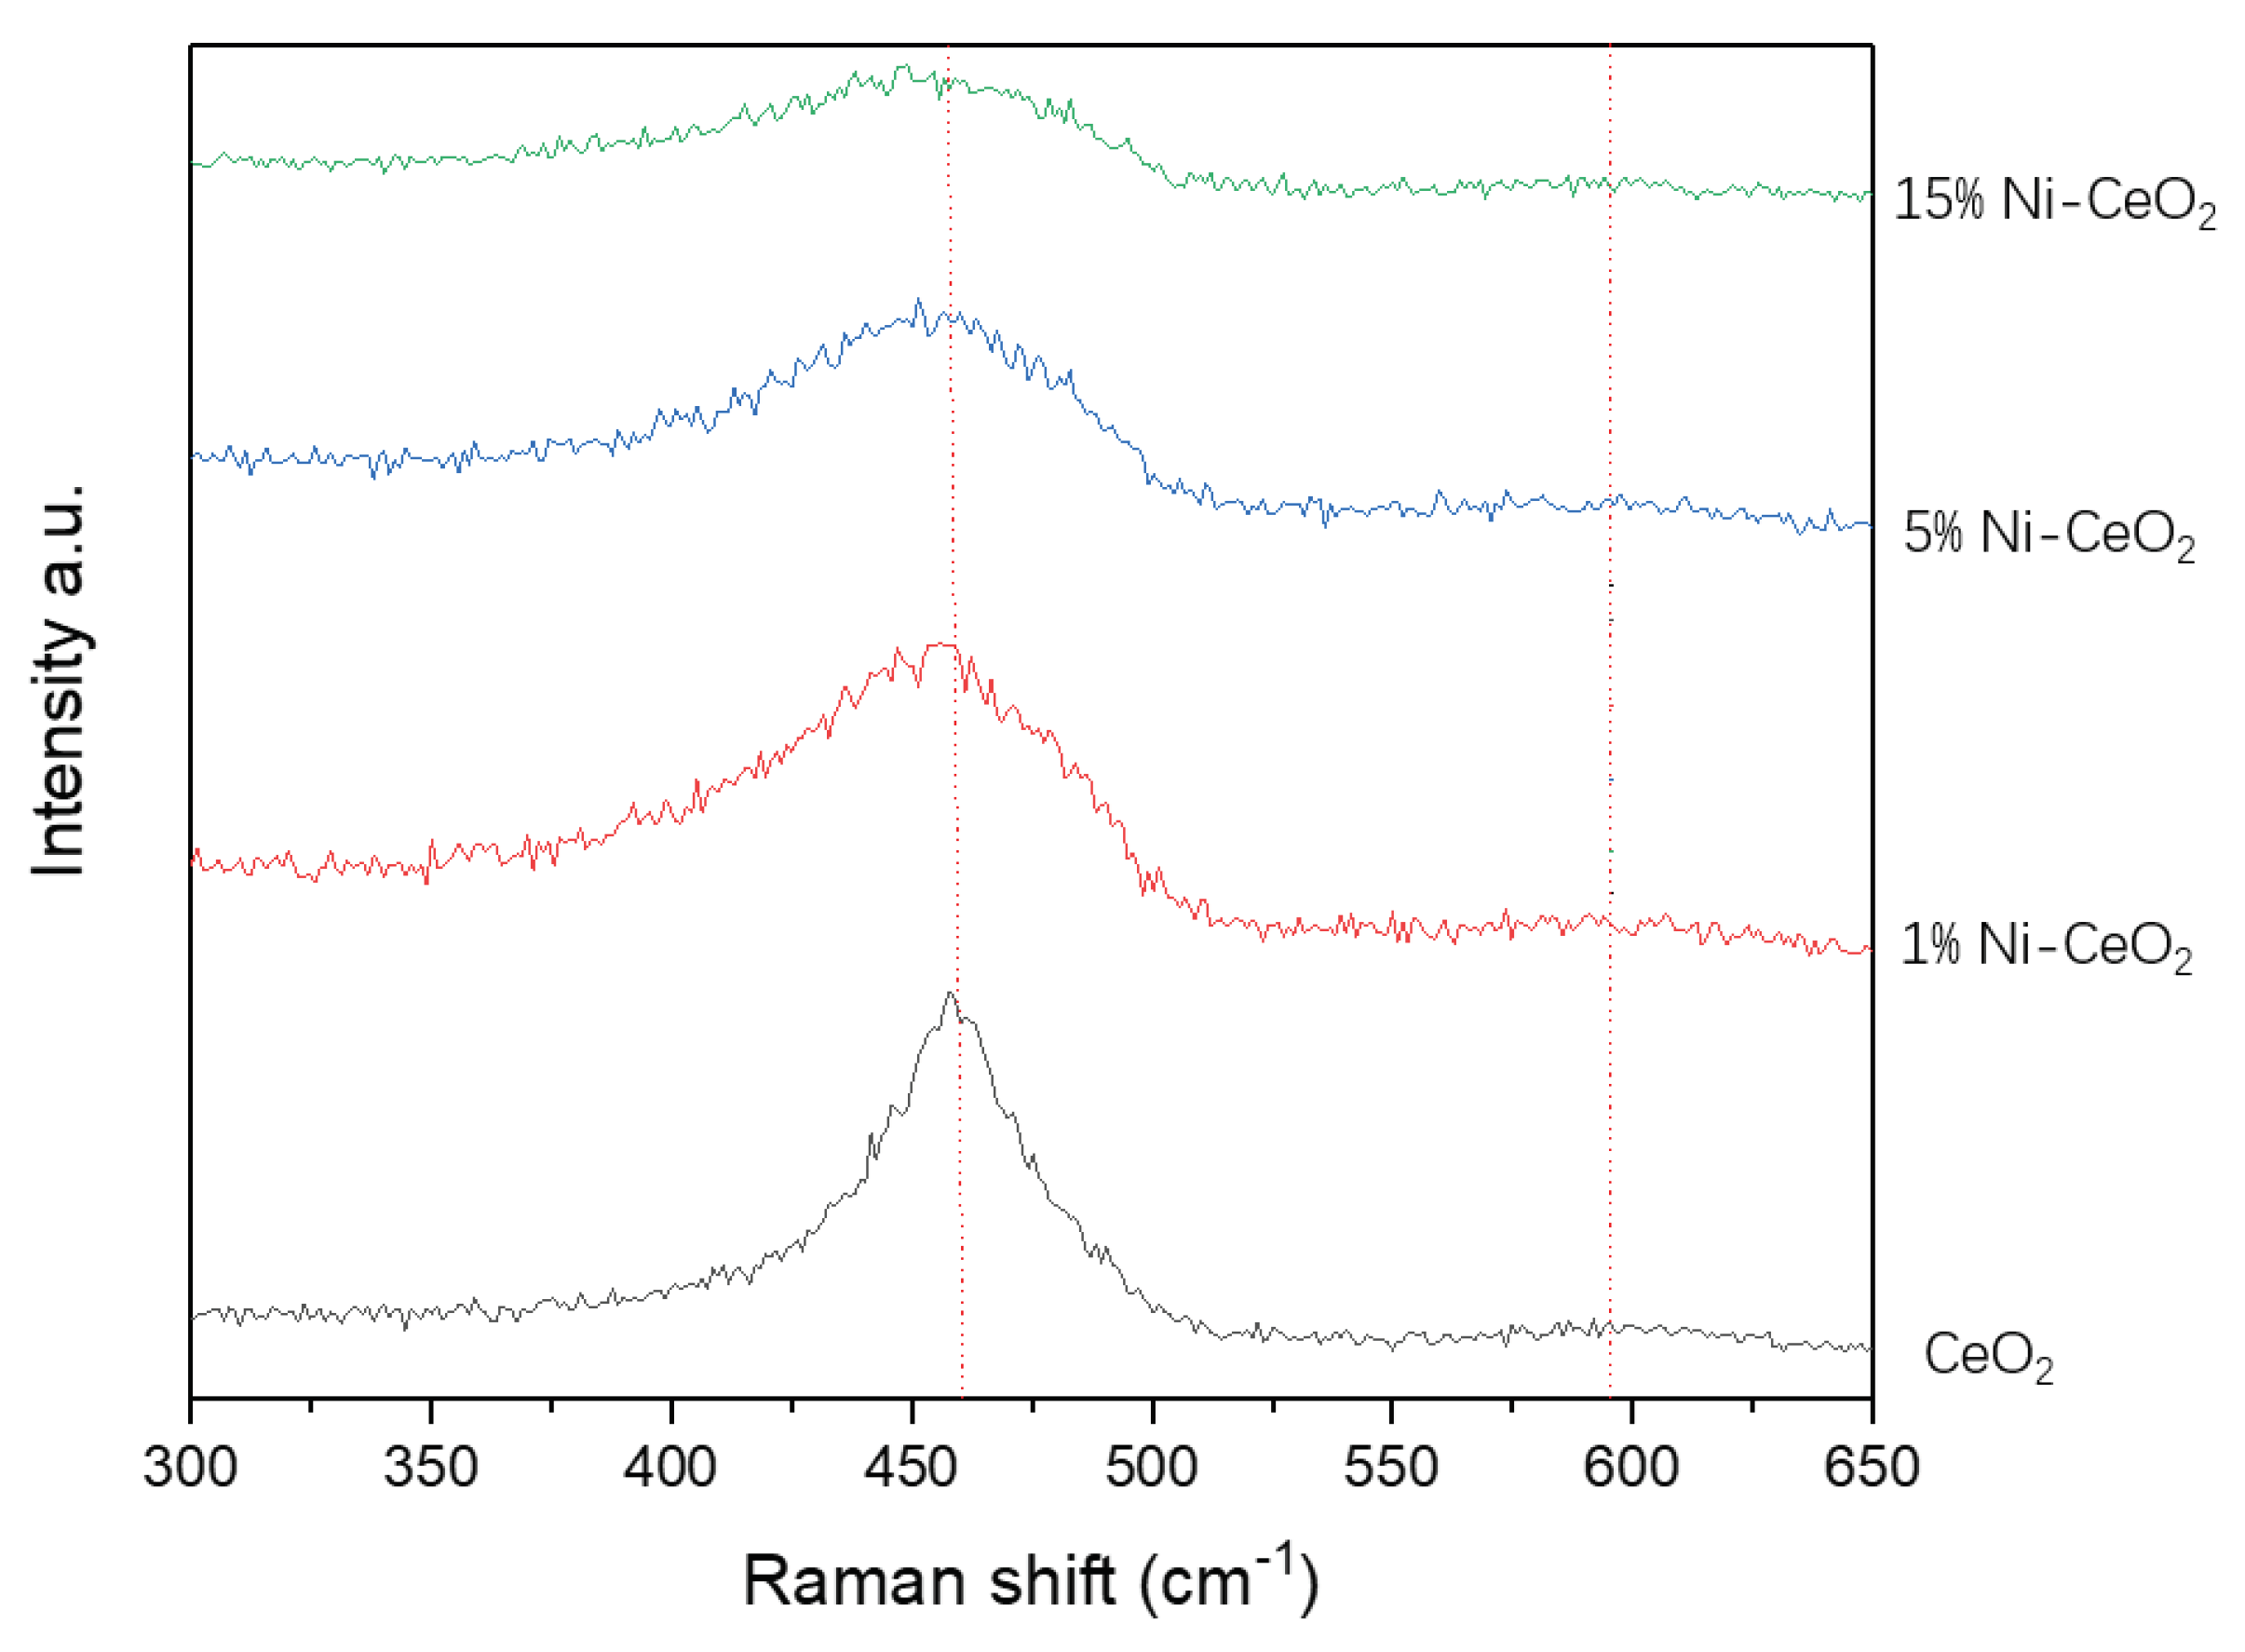
| A595/A462 | 9.79% | 23.9% | 30.5% | 26.7% |
Disclaimer/Publisher’s Note: The statements, opinions and data contained in all publications are solely those of the individual author(s) and contributor(s) and not of MDPI and/or the editor(s). MDPI and/or the editor(s) disclaim responsibility for any injury to people or property resulting from any ideas, methods, instructions or products referred to in the content. |
© 2024 by the authors. Licensee MDPI, Basel, Switzerland. This article is an open access article distributed under the terms and conditions of the Creative Commons Attribution (CC BY) license (http://creativecommons.org/licenses/by/4.0/).


