1. Introduction
The development of intelligent features for road vehicles has been on the rise in recent years with a strive towards fully autonomous driving. There are five levels of autonomy defined by the Society of Automotive Engineers (SAE). Level-0 is considered to have no assistance, Level-1 offers adaptive features, Level-2 provides partial automation, Level-3 has conditional automation, Level-4 does not require driving intervention in preset environments, and Level-5 is full automation in all conditions [
1]. Common Advanced Driver Assistance System (ADAS) sensors include cameras, Light Detection and Ranging (LiDARs), Radio Detection and Ranging (RADARs), and Sound Navigation and Ranging (SONARs) [
2]. The sensors are responsible for perceiving environmental data and communicating with ADAS when deploying automated functions, such as emergency braking, adaptive cruise control, hands-free steering, etc.
A concern of autonomous features is the uncertainty of sensor performance degradation when driving in adverse weather conditions, particularly rain, as it is the most common precipitation form globally. Optical sensors like cameras and LiDARs are more susceptible to impairments in the rain due to the use of shorter wavelengths (nm-scale) which increase sensitivity to interferences. Longer wavelengths (mid and high mm-scale) sensors such as RADAR and SONAR are less prone to performance degradation as they have lower resolutions, their wavelengths are often larger than the raindrop scale (low mm-scale) [
3]. On the other hand, LiDAR is a less established technology than cameras, with multiple aspects still in development, especially for automotive applications, such as electronic and photonic components, signal processing, and packaging. Therefore, this paper focuses on investigating LiDAR performance in rain.
Automotive LiDARs typically utilize the time-of-flight principle to determine the range of objects based on simple elastic scattering phenomena without wavelength changes [
4]. LiDAR emits laser pulses toward a target object; the detector then calculates the time it takes to receive a backscattered signal to identify the distance of the target from the incident source. A LiDAR sends out short duration wave pulses with a known power, and the return flux is converted to an electric voltage using photodiodes or photomultipliers. The signal energy can be calculated with consideration of efficiency loss during the laser travel as stated in Equation 1 below.
E,
σ,
A,
R, and
η represent energy, cross-section on the target that is illuminated, area, range, and efficiency, respectively.
Automotive applications employ near-infrared lasers with a wavelength of 905 nm or 1550 nm, which are suitable for short-ranging. The energy of a 905 nm LiDAR is lower than that of 1550 nm for eye safety [
5]. 1550 nm may be sent out for a shorter duration and is less affected by background noise, however, 1550 nm is more prone to atmospheric absorptions by gas molecules [
6]. The current state-of-the-art types and sensing schemes of LiDARs are reviewed and discussed in [
7] on the construction and operating mechanisms.
From a practical point-of-view, it is desired to protect the ADAS sensors from harsh driving environments that may damage the sensor lenses due to soiling (surface contamination [
8]). Thus, it has been proposed that protective covers may be used in front of the sensors with various coatings to achieve properties such as water repelling, anti-abrasion, and anti-reflection [
9].
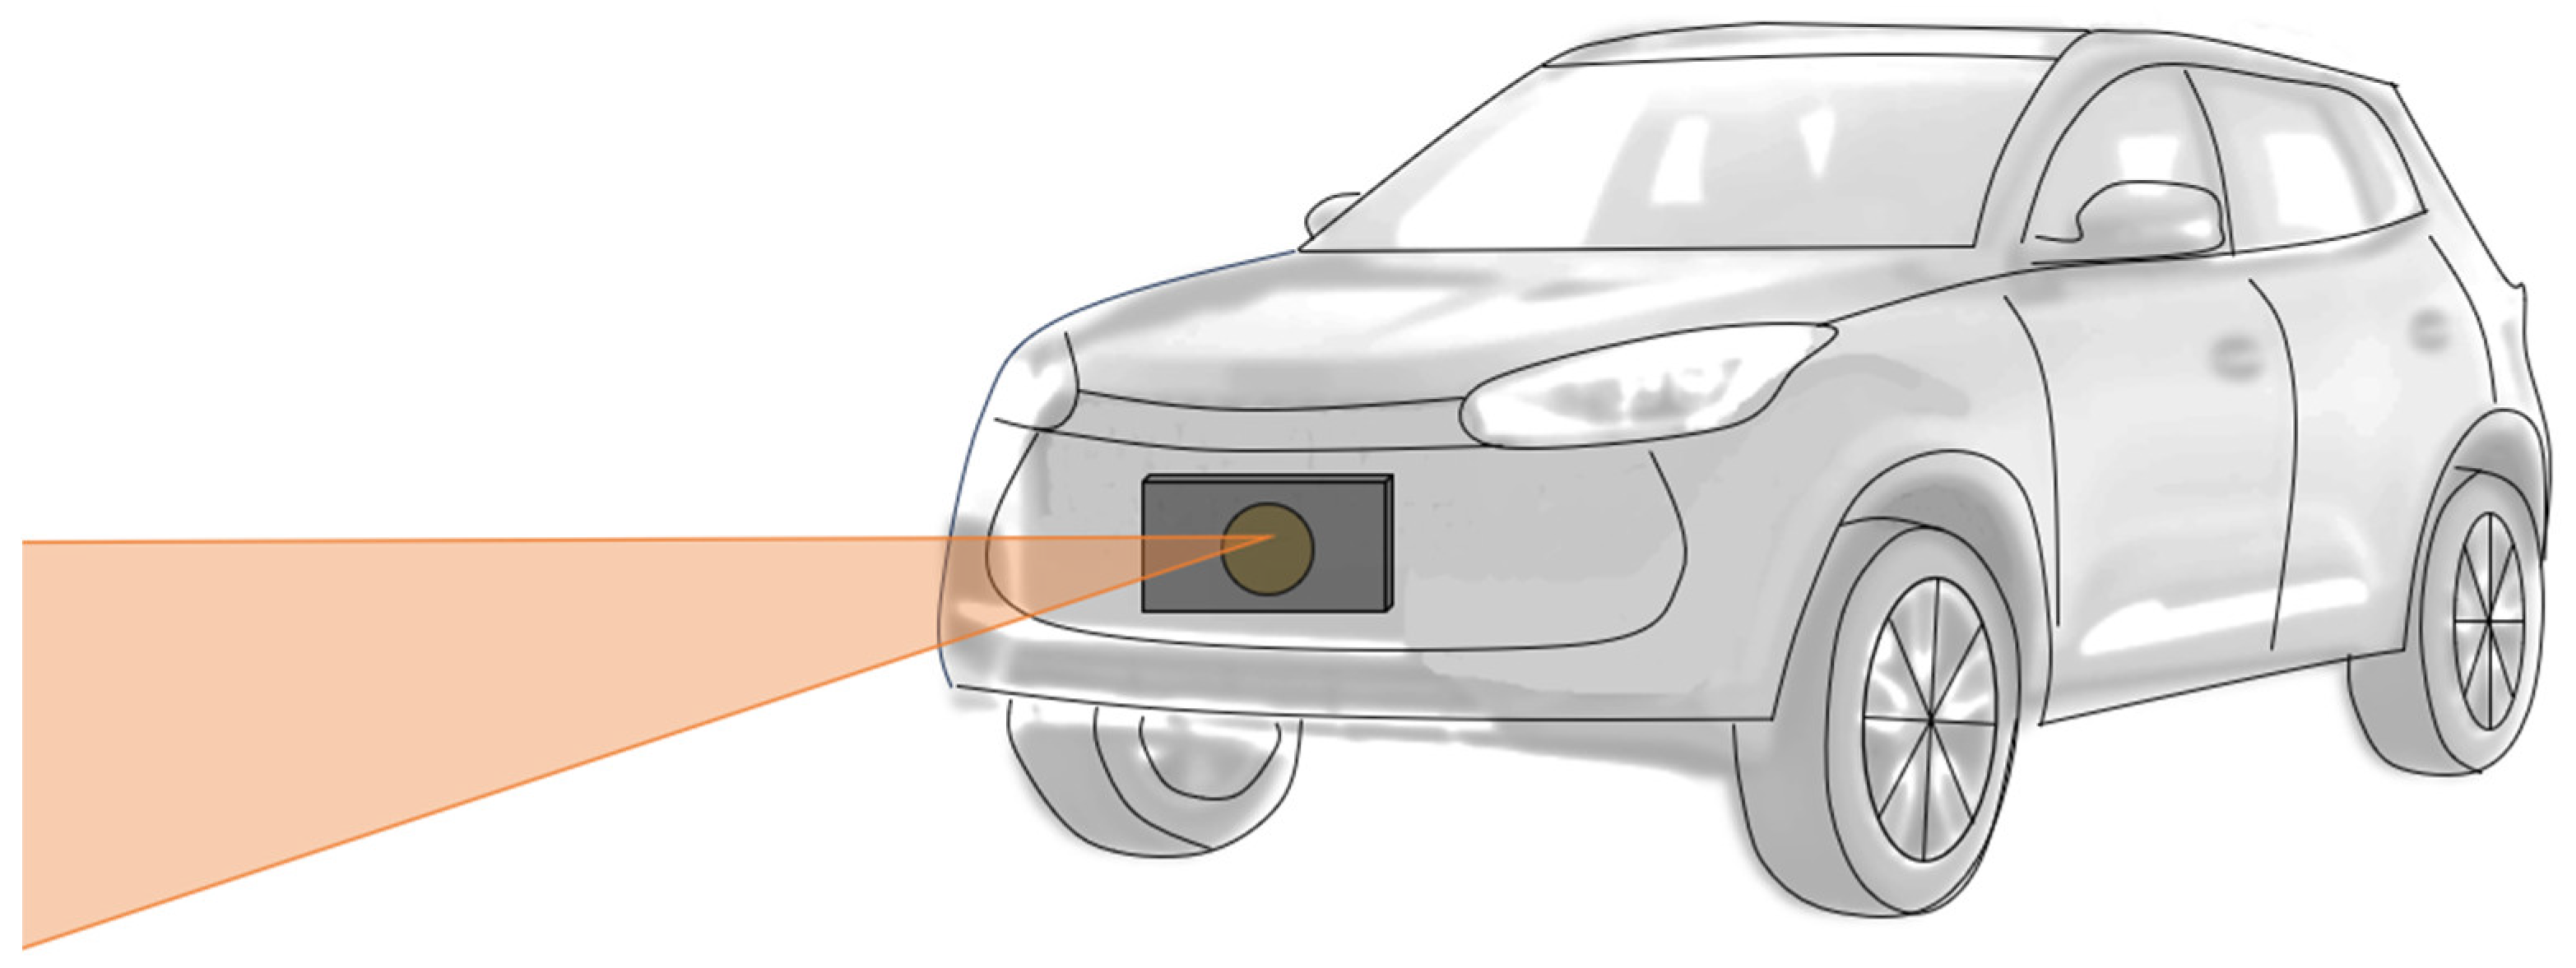
Figure 1 shows the front cover with integrated sensor modules behind.
Multiple studies suggested that LiDAR performance degrades in rain because raindrops can absorb laser energy or alter the paths of laser beams. The attenuation of light due to precipitation has been extensively studied concerning the extinction coefficients [
5,
10,
11,
12,
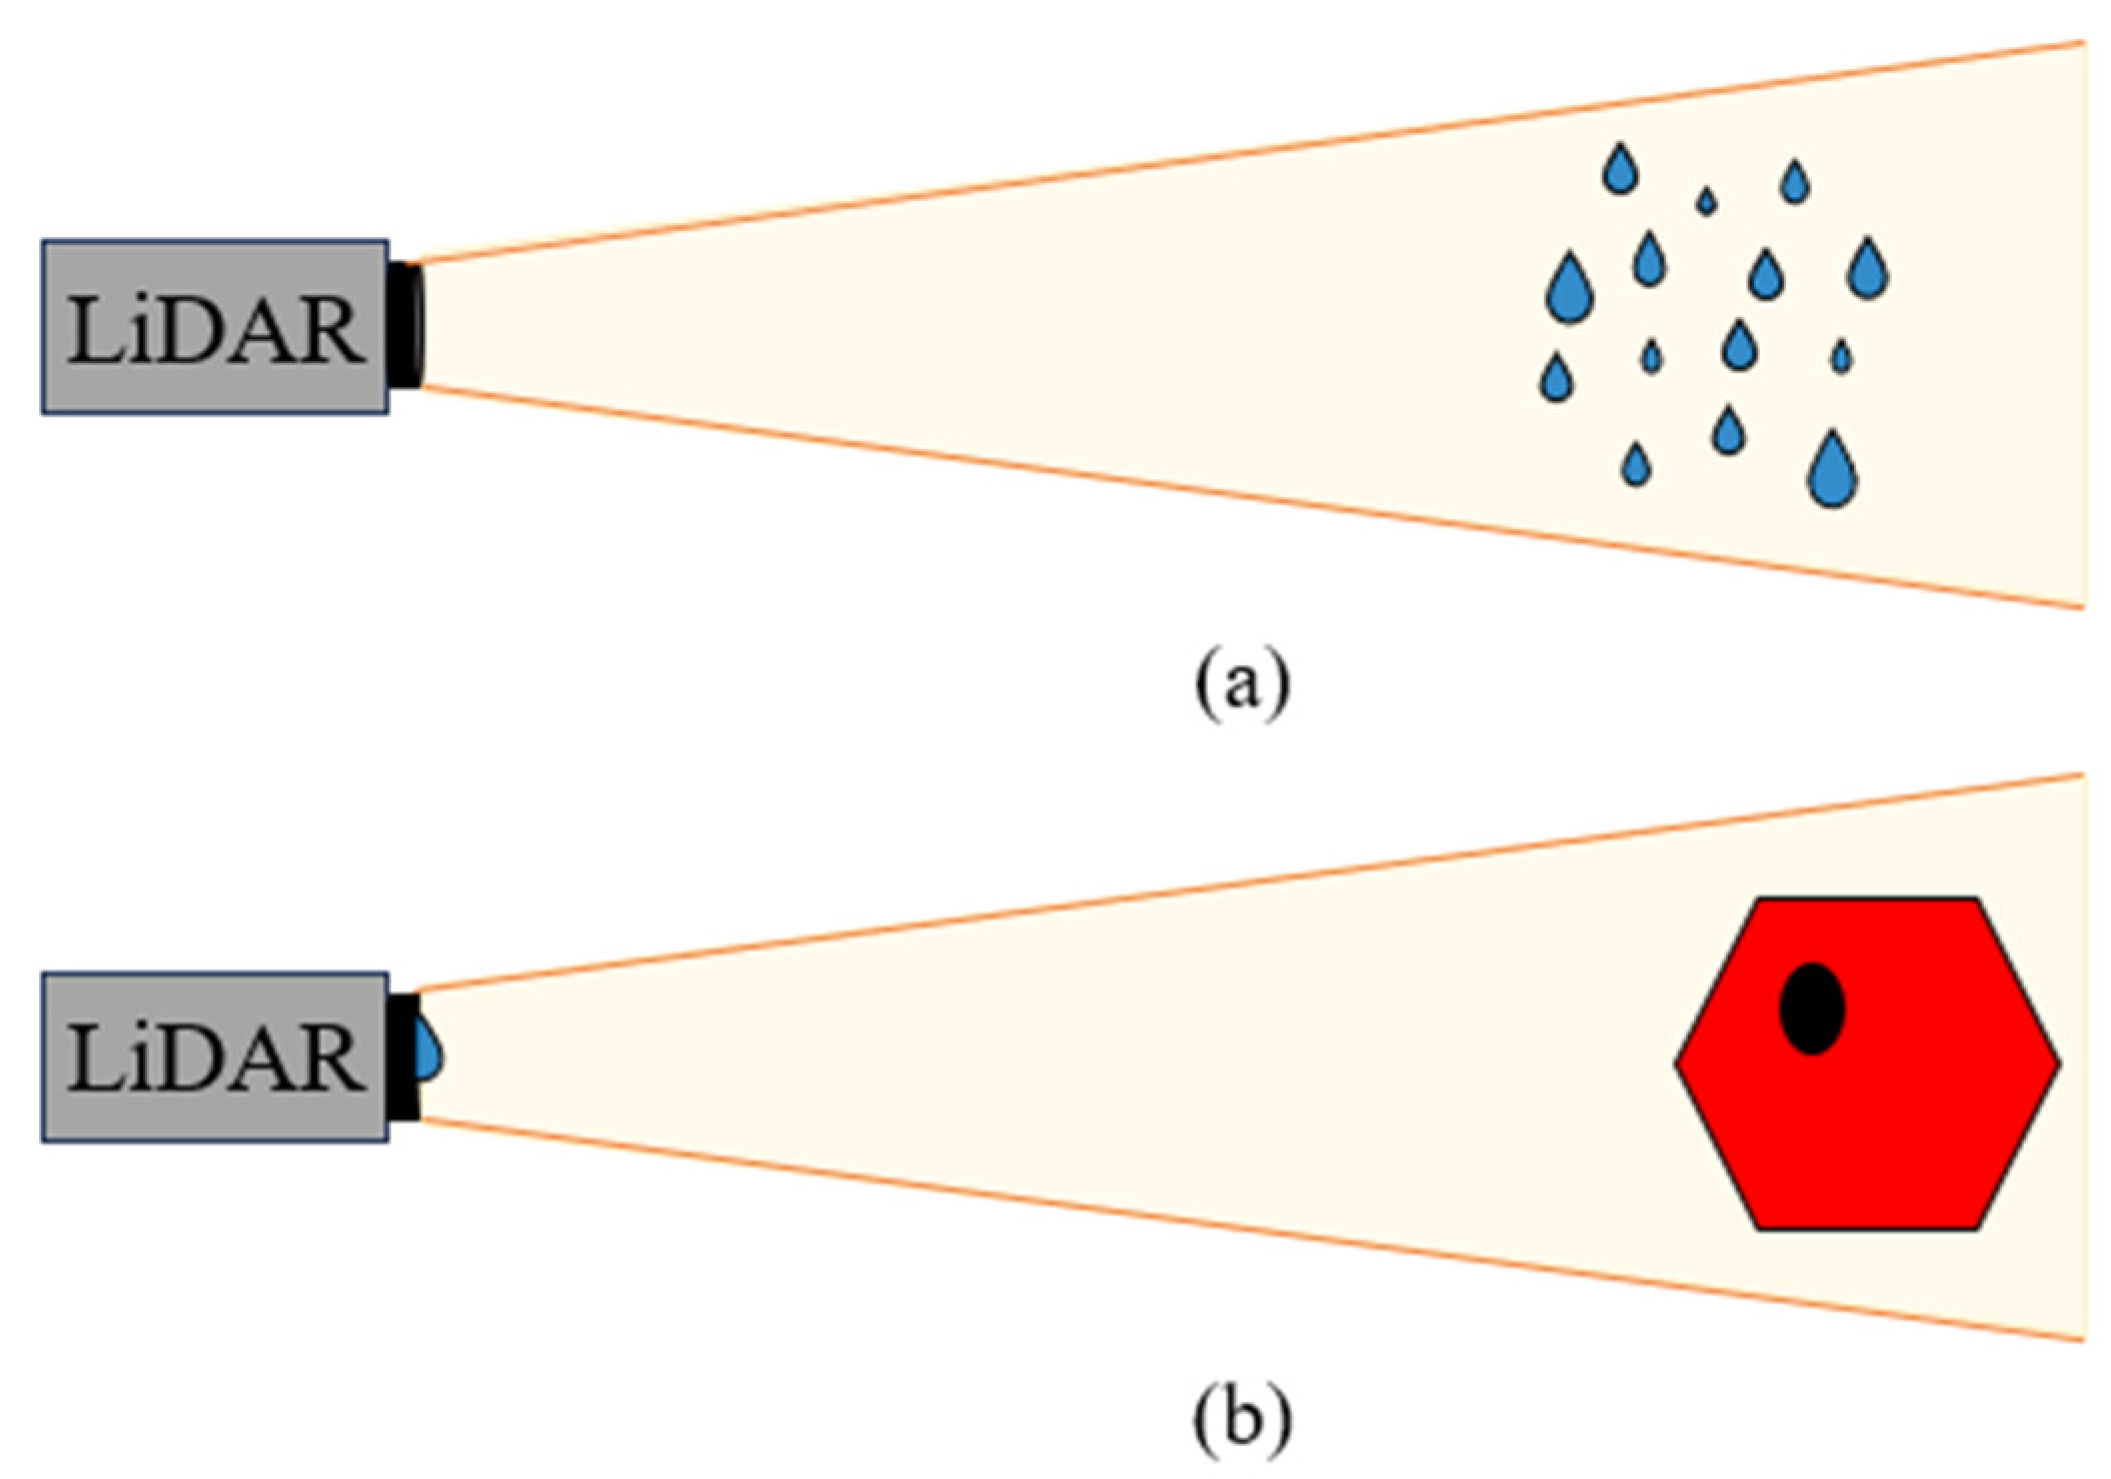
13]; the experimental condition is demonstrated in
Figure 2a for which adherent droplets on the LiDAR surface is not considered. The attenuation effect on LiDAR return signal power
Preturned is shown in Equation 2, where
Z is the distance of the object from the LiDAR. The extinction coefficient
ζ, is a function of natural rain intensity (
I [mm·h
-1]) and follows a power law relationship. In Equation 3,
c1 and
c2 are constant values which can be determined through physical experiments. Assuming the only variable is rainfall rate, then the higher the rain intensity, the lower the return power.
Although the attenuation model provides an estimation of the LiDAR performance with respect to raindrop size distribution and intensity, there are other crucial factors to consider when driving in rain. Adherent raindrops are much closer to the LiDAR surface, causing obstruction and deflection of signals [
14], the scenario is demonstrated in
Figure 2b. Small apertures of the micro-electromechanical systems (MEMS) mirror with only a few millimeters restrict the size of the scanning laser beam, which is one of the major reasons obstructing LiDAR vision when raindrops of similar size as the aperture adheres on the outer surface of the LiDAR sensor [
15]. The influence of aperture size is also discussed in [
16,
17]; generally, a larger aperture that can scan rapidly at a higher frequency is desired.
LiDAR performance degradation has also been studied on outer covers with the addition of mechanical damages and surface contaminations that are located near the LiDAR aperture [
18,
19]. Their studies showed that scratches on the cover affected the detection accuracy on a known position of the target. In contrast, extremely tiny droplets from dew can cause complete blindness and reduced number of points on the target when there are larger droplets present. Another recent work also reported missing measurements of LiDAR signals when exposed to rain [
20]. These studies provided insights into the modes of detection faults from several possible realistic scenarios but did not investigate in depth the causes of LiDAR performance degradation. Understanding the problem fundamentally has a higher potential to allow developments for preventive measures, such as appropriate cover material and LiDAR optical component designs.
With the evolution of ADAS sensors implementations, surface coatings are no longer only considered for overall body panel protection, but also for the transmittance quality of sensor signals [
21]. The size ratio between the contacting adherent raindrop and the aperture is dependent on surface material properties, which subsequently affect the raindrop impacting characteristics and dynamics at the surface such as adhesion, motion, contacting area, and shape. Surface wettability is often classified as hydrophilic, hydrophobic, and superhydrophobic when the static water contact angles (WCAs) are < 90
o, between 90
o – 150
o, and > 150
o, respectively. The resultant WCA due to surface roughness is summarized in [
22] with a review of electrodeposition coatings. The method to evaluate surface wetting and droplet adhesion forces in summarized in [
23] using a microbalance. Droplet impacting dynamics are affected by surface wettability, resulting in different modes of motion, such as sliding, rolling, bouncing, splashing, and spreading [
24,
25,
26]. Recently, there have been several works reporting the tuning of wettability gradient [
27] and patterning hydrophobic/hydrophilic (biphilic) properties [
28] to induce droplet movements; these could be an interesting research direction in coatings for ADAS sensor applications and strategies to passively mitigate raindrops via facilitating water drainage. The droplet dynamics phenomena are expected to become more significant in driving scenarios with vehicle speed.
Our previous works show the surface material dependence during exposure to controlled and realistic simulated rain perceived by a moving vehicle [
29,
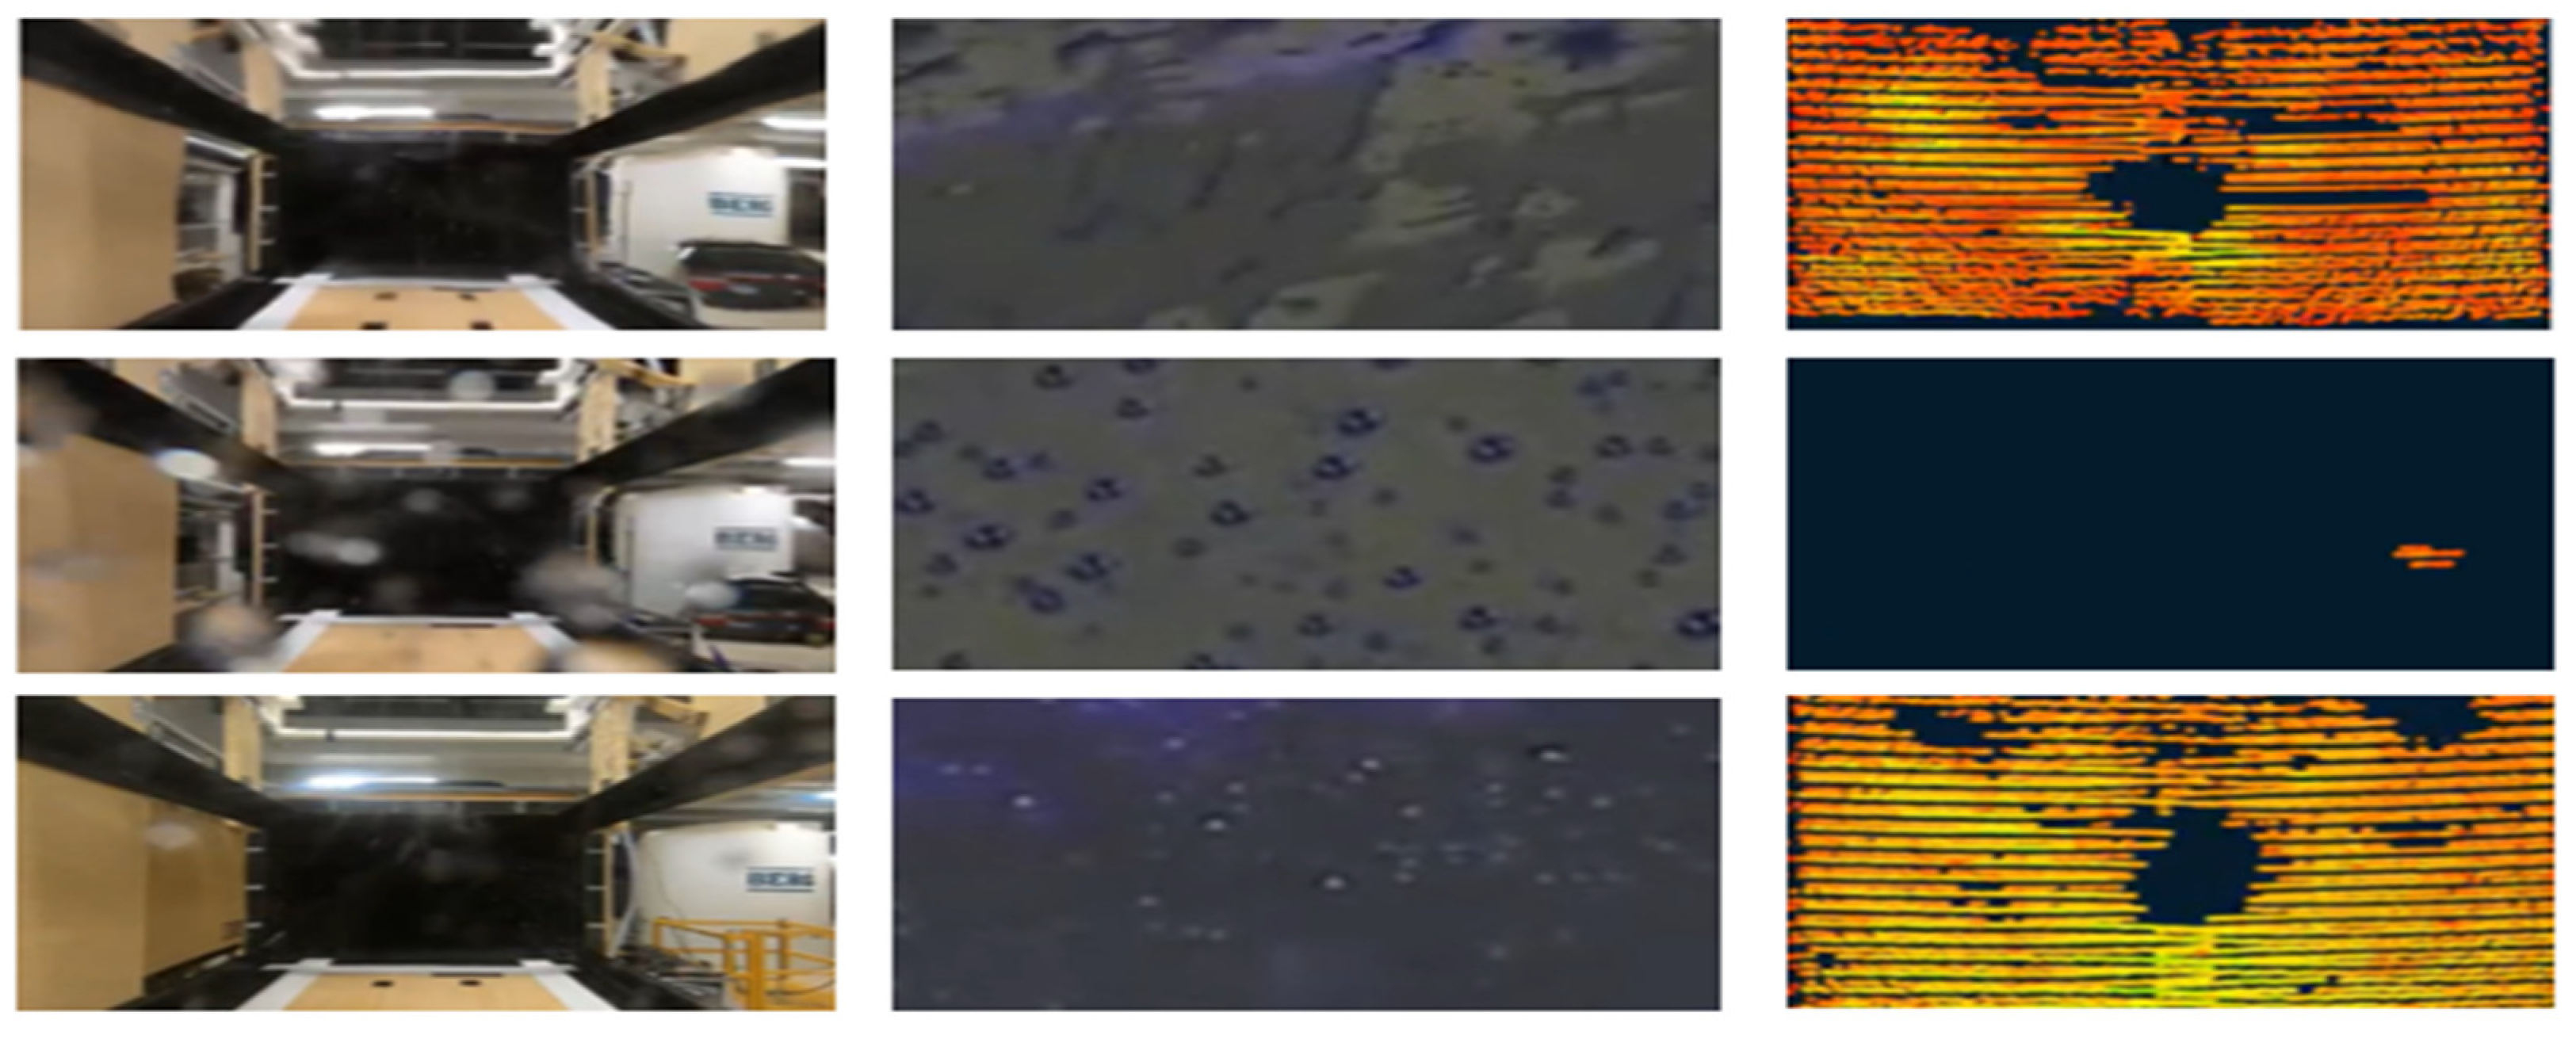
30], for which the use of different covers and coatings affects optical sensor visibility of the detection target at a given condition. Sample images collected in simulated realistic rain perceived by a driving vehicle are shown in
Figure 3 to demonstrate the significance of cover material in LiDAR performance; the controlled rain testing method using the wind tunnels at the Automotive Centre of Excellence (ACE) at Ontario Tech University, Canada is outlined in detail in [
29,
30].
Since LiDAR is an optical sensor, it is hypothesized that adherent raindrops of different sizes and shapes act as localized lenses for the LiDAR within its field of view (FOV), influencing the optical paths. Some studies focus on the ball lens for beam coupling effect on optical paths [
31,
32], equivalent to an almost spherical droplet on a superhydrophobic surface. Meanwhile [
16], discussed the ray tracing model for an adherent hemispherical droplet where the laser beam passes through a hydrophobic solid layer before reaching the droplet. They demonstrated that the ray deflection angle becomes more severe as the incident position is closer to the droplet curvature boundary. The droplet size factor is also investigated in their simulation and shows that there exists an optimal droplet size to laser beam diameter ratio to retain a higher percentage of return laser power. Limited conditions were investigated in their studies, therefore, the findings are not representative of a more comprehensive selection of cover materials, but provided insights for this study.
Currently, LiDAR performance degradation is not very well understood in the field of automotive applications, hindering development of autonomous vehicles and the deployment of LiDAR in exterior applications. One of the main reasons is due to the lack of adherent droplet studies, which are strongly related to the materials and optical properties of the surface. For instance, LiDAR performance for automotive applications may not always follow the behavior according to the return power estimation with respect to rain intensity, as Equations 2 & 3 do not incorporate the factors such as driving speed, droplet size, and droplet dynamics arising from cover materials.
The objective of the paper is to address the above-mentioned gaps by providing reasonings for LiDAR performance degradation through conducting a fundamental investigation with isolated droplet tests and discussing from materials and optical perspectives using four different classes of cover materials – hydrophilic, almost-hydrophobic, hydrophobic, and superhydrophobic. Focus is put on the effects of frontal covers on LiDAR performance when droplets are present. This work aims to contribute to modeling LiDAR performance when driving in rain and LiDAR signal enhancement with insights on material selections and strategies to mitigate sensor soiling.
3. Results
As stated earlier, the paper aims to provide some insights in LiDAR performance degradation from material and optical perspectives through correlating characterized properties, varying droplet morphology and traced laser beams. At the end of the paper, phenomenological models are proposed for the four classes of cover materials – hydrophilic, almost-hydrophobic, hydrophobic, and superhydrophobic. In this section, results are organized into four sub-sections: cover surface material properties, cover optical properties, LiDAR performance with the presence of droplets, and fundamental optical studies.
3.1. Cover Material Properties
The cover material properties are characterized comprehensively by measuring at 10 different spots on the cover, including cover thickness, surface roughness, static WCA, and the droplet thickness to contact diameter (t/D) ratio. The visuals of these properties are shown in
Figure 5. These properties are hypothesized to affect LiDAR performance; the average means and standard deviations from the 10 points of measurement are reported in
Table 1.
Table 1 and
Figure 5 suggest that the coatings are even with small standard deviations in the thickness and roughness measured over 10 different spots. The superhydrophobic cover has a low surface energy thin film on top of the hard coating; hence, it is thicker by about 0.3 mm compared to the other covers. The hydrophobic coating is the roughest, which likely has contributed to approximately 0.1 mm extra thickness compared to the hydrophilic and the almost-hydrophobic covers, considering they underwent the same coating process.
There are fewer peaks observed for the hydrophilic cover, which is also reflected in the arithmetic mean roughness that it is the smoothest among the set of covers. More rough textures with tighter gaps between the peaks are seen as the WCA increases across the set of four covers. However, with reference to the Wenzel model [
36], the measured WCAs suggest that these four as-received cover coatings all have different chemical properties as they do not result in the same Young’s angles after applying their respective roughness factors. This is a crucial piece of information for understanding the optical properties, as the transmittance may be affected by the material compositions in addition to thickness and surface roughness. Material compositions are not characterized in this study due to commercial restrictions.
While WCAs describe the surface wettability by classifying the overall droplet behaviors, such as droplet shape and spreading energy. To better understand the LiDAR performance from the optical perspective, wettability is quantified using a thickness to contact diameter (t/D) ratio in addition to static WCA. The main reason is due to the hypothesis that droplets are small localized lenses that change the optical path. Therefore, the curvature and contact profiles are key parameters dictating the optical paths with reference to Fresnel’s equations [
37] explaining transmission, reflection, and refraction.
3.2. Cover Optical Properties
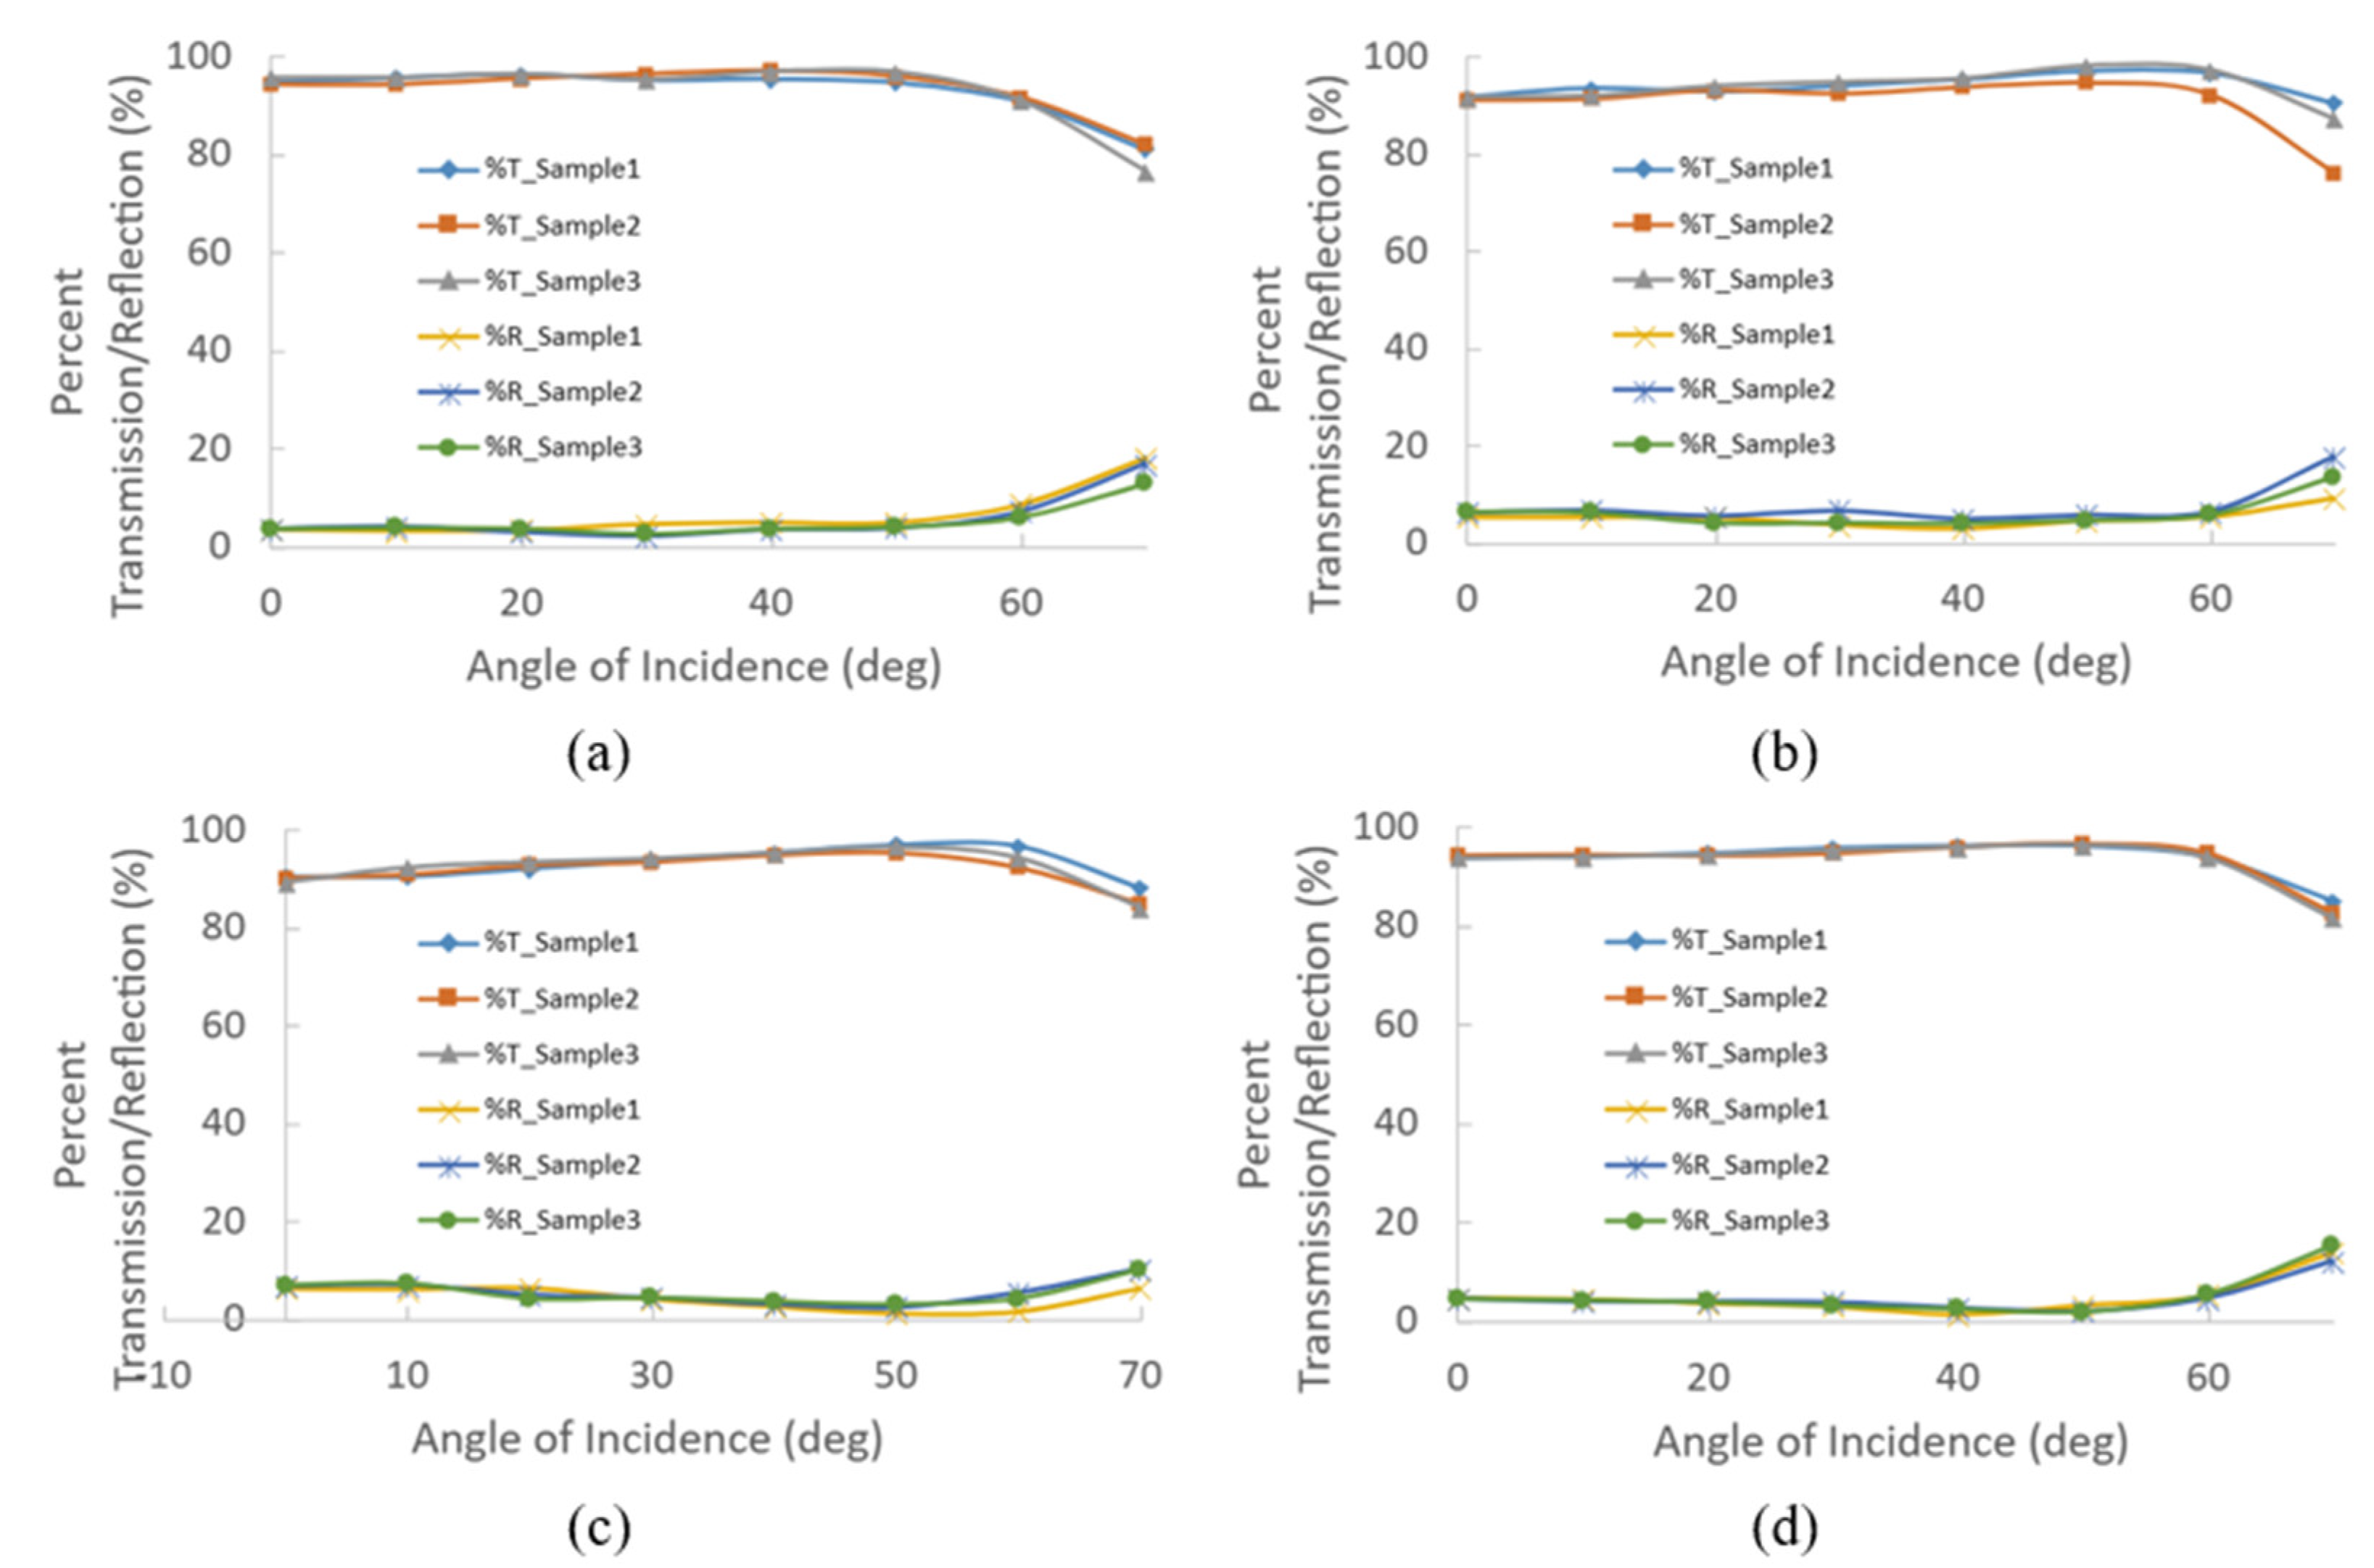
The cover optical properties are characterized by transmittance (%T) and reflectance (%R) over different angles of incidence and by measuring at three different spots on the cover, labeled as Samples 1, 2, and 3 in
Figure 6. As mentioned before, the cover is made of polycarbonate with coatings applied on the external surface when used with a LiDAR unit. The laser path sequence is as follows: it leaves the laser source traveling through air, then it meets the polycarbonate cover with coating on the outer side, then it travels through the air again towards the detector.
Depending on the polarization of light, whether it be unpolarized, s-polarized, or p-polarized, the amount of incident power reflected changes. Using Fresnel’s equations, for p- and s-polarized lights, the total transmission decreases while reflectance increases as the angle of incidence increases between a light source and a medium. In this paper, p-polarized light is used; an anomaly is presently known as the Brewsters effect, specifically at an angle equal to the arctan of the refractive index of the second material (polycarbonate, n = 1.586) over the first material (air, n = 1). Ideally, there should be no reflection; however, in real applications, this leads to a higher transmission and lower reflection in some of the covers at around 57.7o angle of incidence for a polycarbonate material.
The refractive index changes slightly with an added thin layer of coating, which has caused differences in transmission and reflection for the four covers. The same idea can be applied for anti-reflection purposes by creating interference; the reduction in reflection will result in an increase in transmission through the material. In contrast, surface roughness may cause deviations in measurements as light is diffused away from the original position, which lowers the measured power. As mentioned in the cover material properties above, the transmittance and reflectance are affected by both surface roughness and the material composition. Although the covers cannot be directly compared, the optical results presented provide a reference on functional LiDAR covers and the recommended placement of the cover with respect to the LiDAR lens to maximize transmittance and minimize reflectance to ensure good LiDAR vision.
3.3. LiDAR Performance with the Presence of Droplets
The LiDAR visibility when using a cover is compared to the baseline without cover, reported in
Table 2, which are measured to be 87.3%, 86.6%, 89.1%, and 98.8% with hydrophilic, almost-hydrophobic, hydrophobic, and superhydrophobic covers, respectively. Using a cover lowers the LiDAR visibility slightly, which aligns well with the optical property characterization. It is worth noting that laser beams emitted by the LiDAR diverge in different directions to obtain a wide FOV; thus, they are incident to the cover at different angles. As a result, the dry visibility with a flat cover parallel to the LiDAR lens is expected to differ from the optical property characterized by a single-point laser. However, the visibility should lie in between the range of transmittance measured.
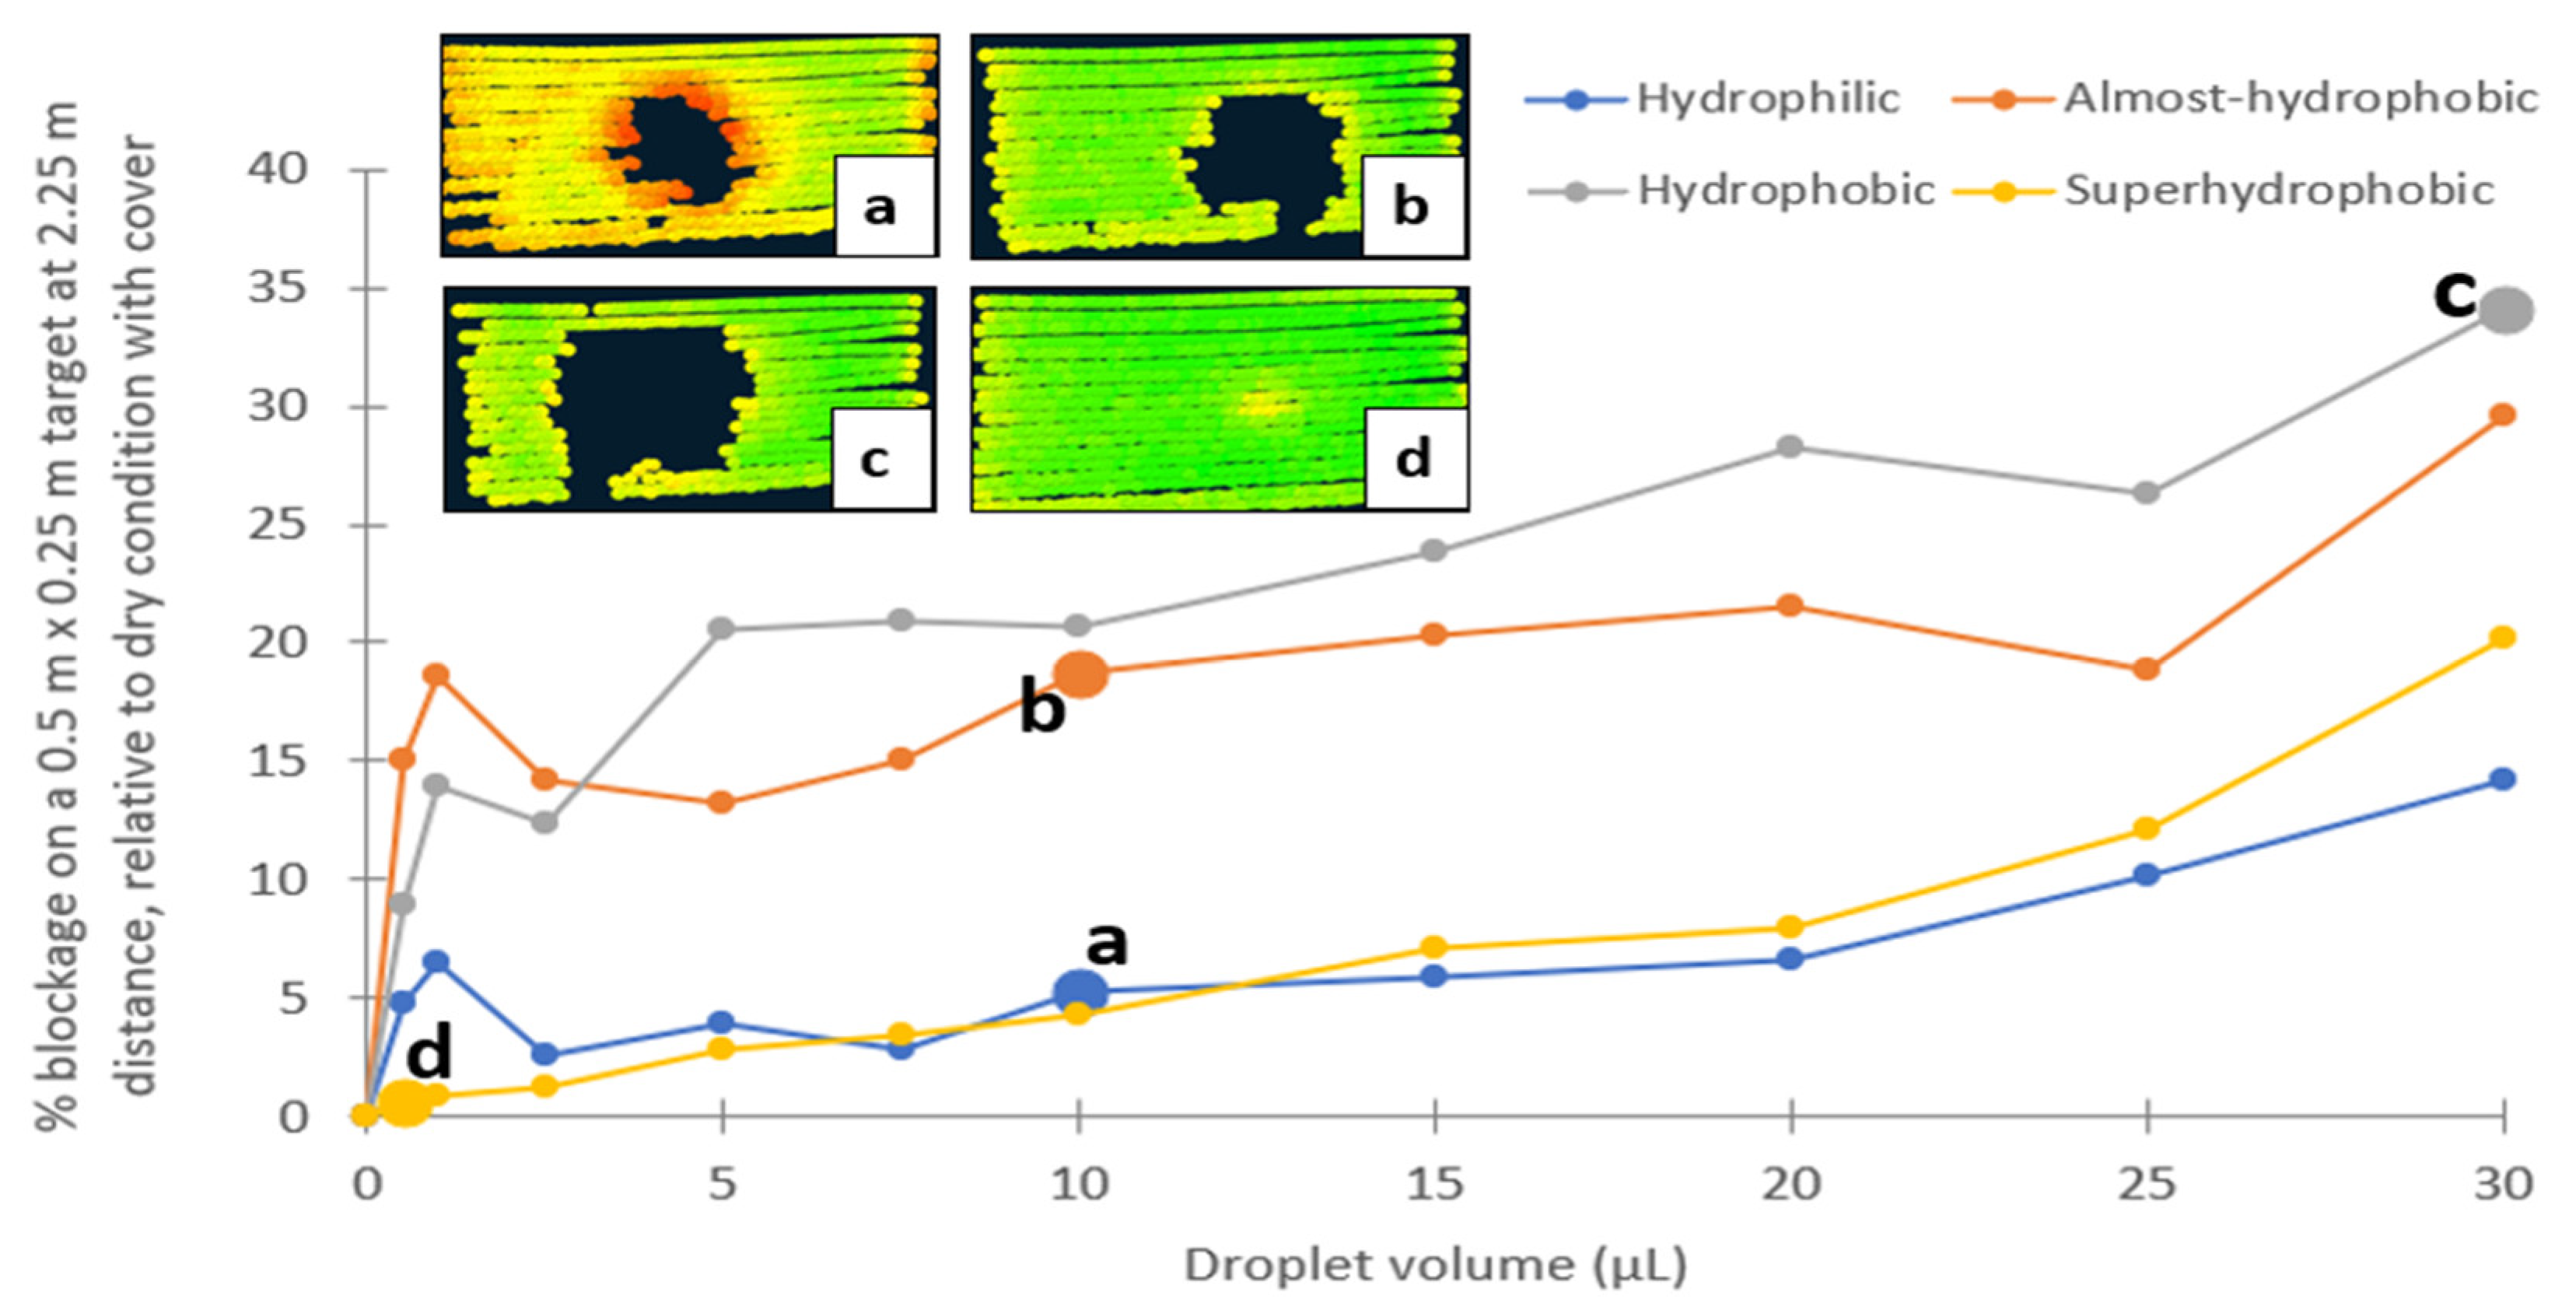
The influence of adherent droplets on LiDAR vision is investigated with controlled single droplet tests with different droplet volumes. The presence of droplets causes missing points and it is referred to as signal blockage in
Figure 7. The trend is non-linear; it could be because of several uncontrolled variables, including point cloud jittering, droplet molecular motion and spreading, droplet position, and laser beams angle of incidence within the masked FOV region to accommodate different droplet volumes. In general, however, the larger the droplet, the larger the blockage and the lower the visibility.
The rate of increase in blockage size with respect to droplet size is faster with smaller droplets on hydrophilic, almost-hydrophobic, and hydrophobic covers, this may be caused by more scattering, resulting in point cloud being less dense as partial beams are deflected. At smaller droplet sizes (≤ 2.5 μL), the blockage on the almost-hydrophobic cover is larger than that of the hydrophobic cover, likely due to the wider contact diameter from the spreading energy on the almost-hydrophobic cover while having a hemispherical shape. When the droplet volume increases (≥ 5 μL), the almost-hydrophobic cover induces more spreading and lowers the height of the droplet, which then helps to retain more visibility than a hydrophobic cover.
From the selected sample images of the blockage behavior in
Figure 7, it is observed that reflectivity (signal strength) is affected, demonstrated by the change in color of the point clouds, with red having lower and green having higher reflectivity. When comparing the mean reflectivity in dry condition with the 30 μL droplet condition at points around the main blockage, the reduction in reflectivity is reported in
Table 3, recorded to be 11%, 9%, 5%, and 8% for hydrophilic, almost-hydrophobic, hydrophobic, and superhydrophobic covers, respectively. Hydrophilic cover wets the most where the thinner region of the droplet is spread and resembles a water film, causing refraction and reduction in transmitted power. With less spreading, the almost-hydrophobic cover is 2% less affected than the hydrophilic cover. The hydrophobic cover generally causes missing point clouds without much effect on reflectivity changes; this is likely due to a consistent hemispherical shape regardless of droplet weight such that either beams are being trapped or they are extremely deflected. The superhydrophobic cover case only performs well at smaller droplet volumes and there are more partial droplet contacts due to droplet weight with larger volume, which began to have a larger effect on the laser paths.
3.4. Fundamental Optical Studies
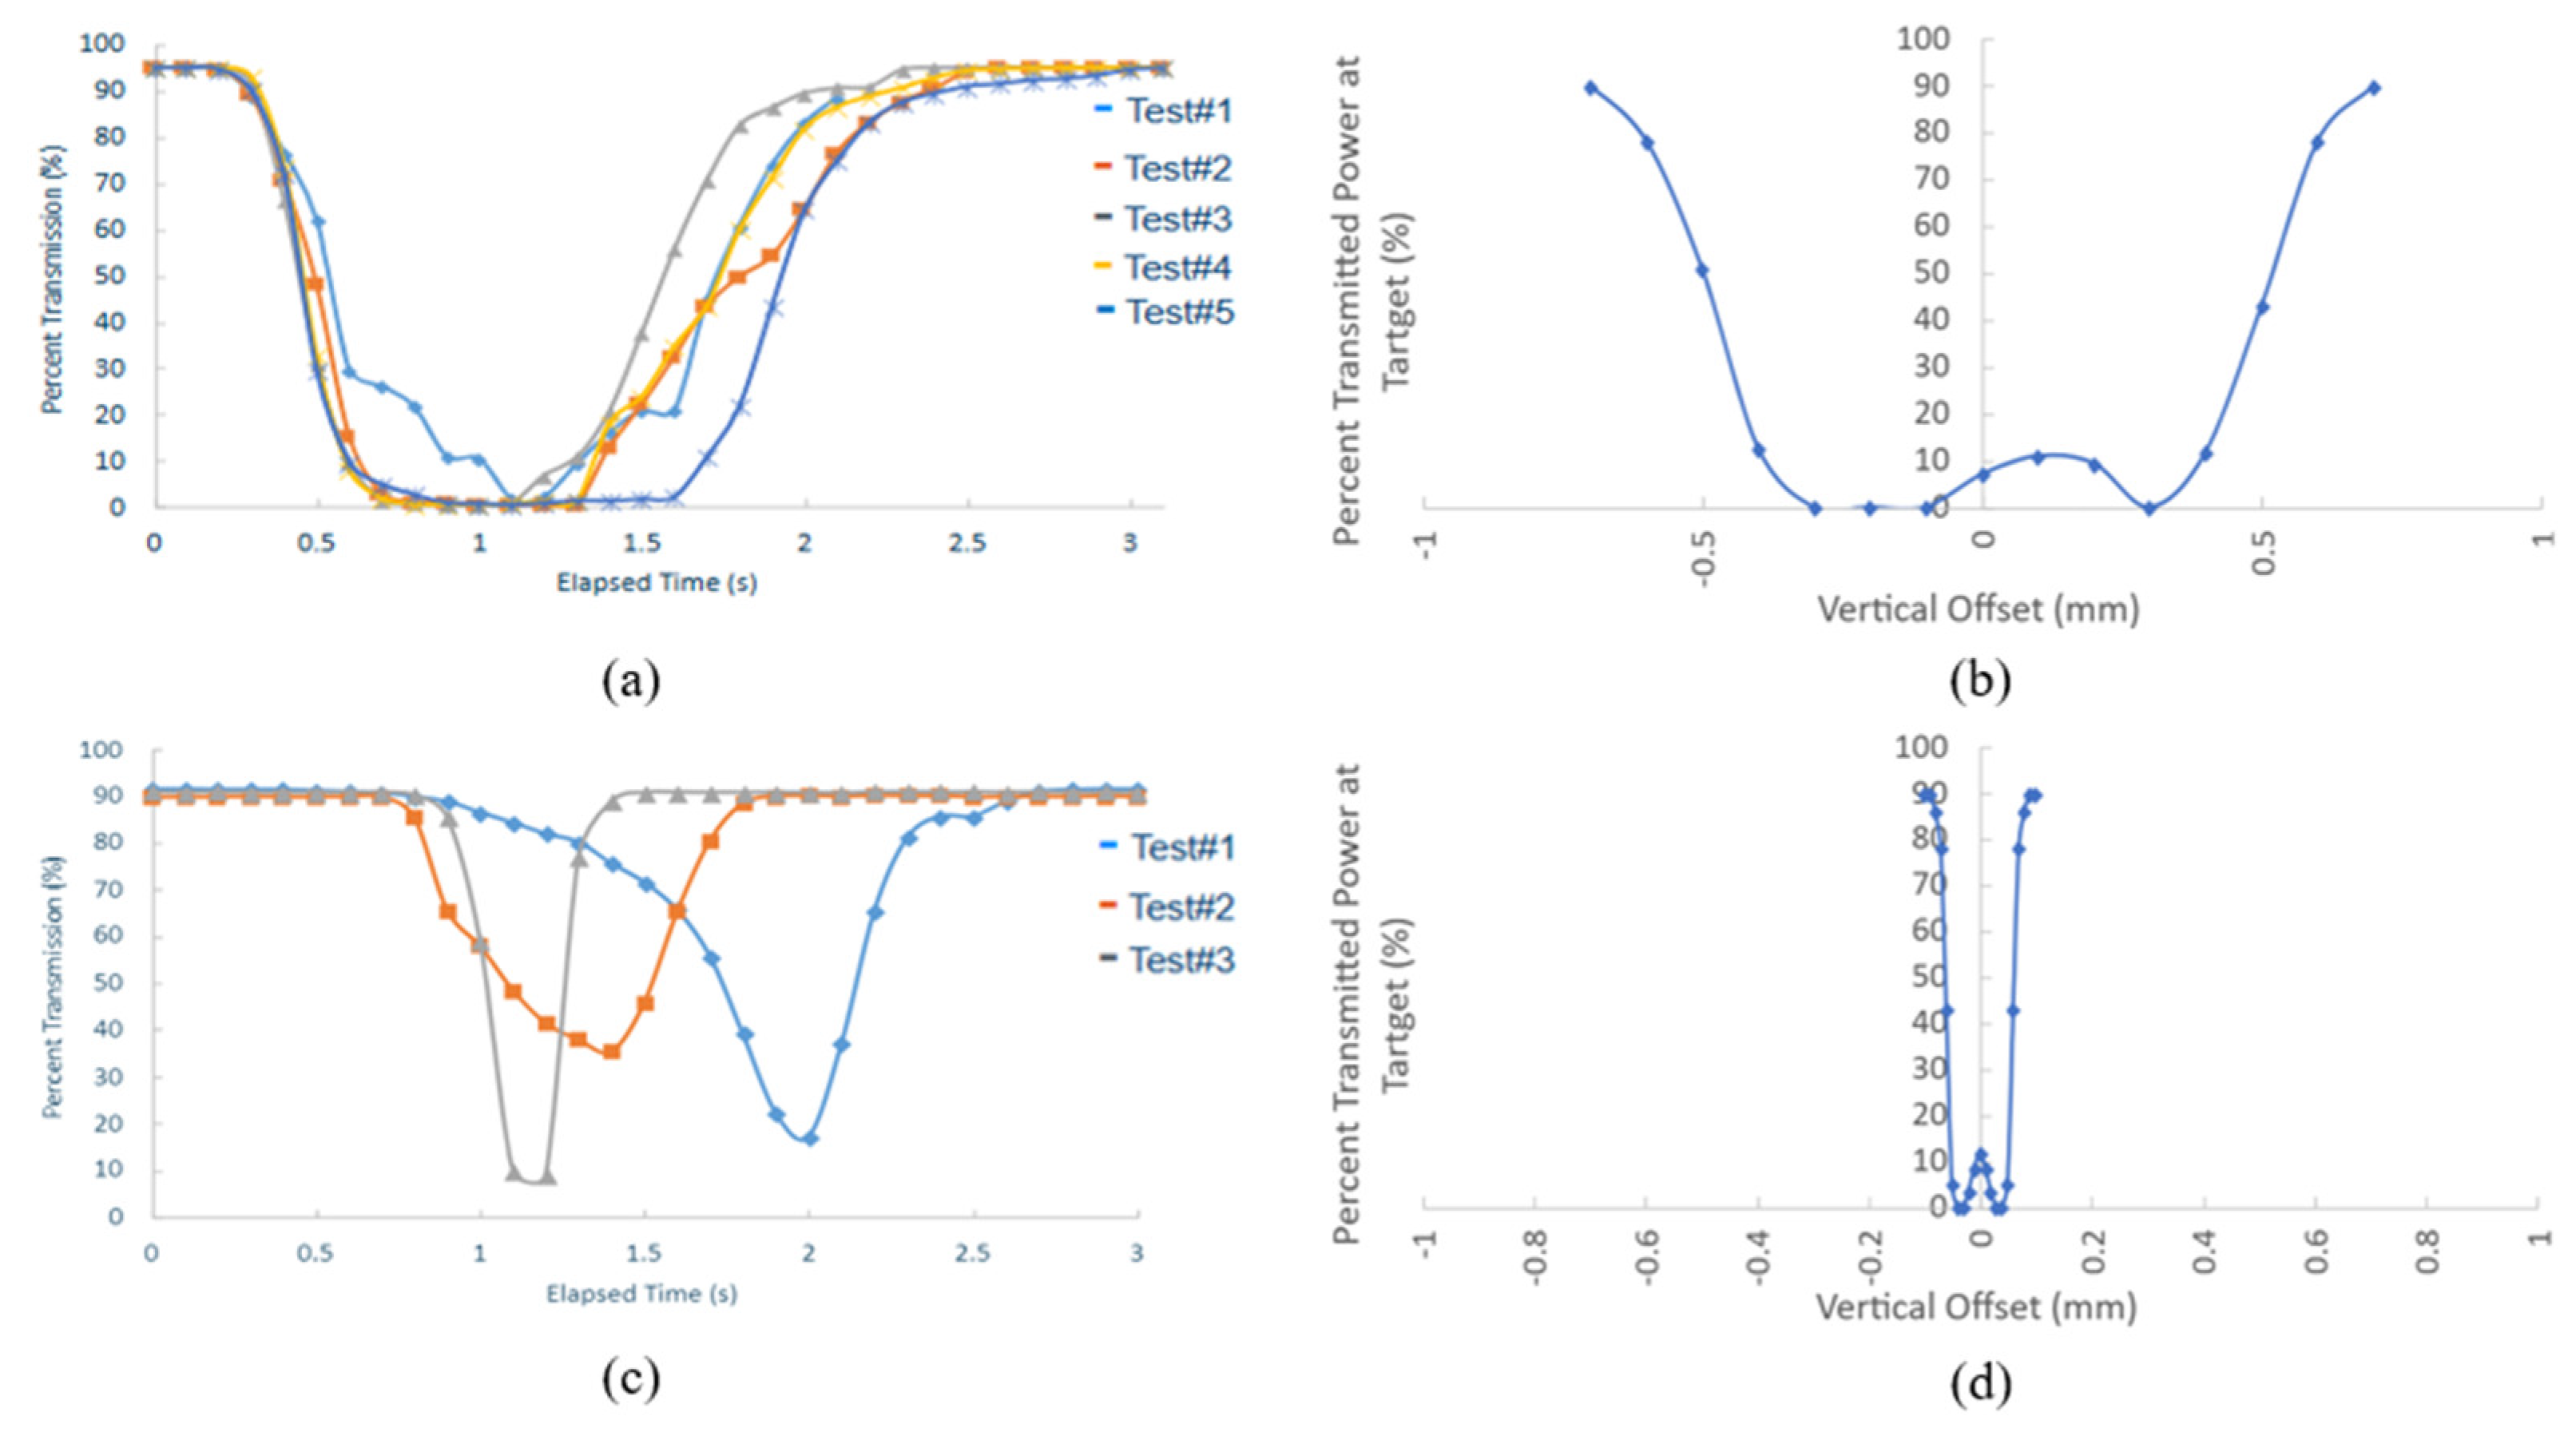
To understand the phenomena of missing point clouds and the reduction in reflectivity due to the presence of a droplet on the cover, a droplet is dispensed physically and modeled on the cover, and allowed to slide down across the laser beam. It is found that the presence of droplets caused an obstruction to the laser signal as transmittance dropped to almost zero for most cases.
Figure 8a,c shows the duration of droplet influence on optical transmittance for hydrophilic and hydrophobic covers, whereas
Figure 8b,d shows the effects of droplet position and curvature on optical transmittance for almost-hydrophobic and superhydrophobic covers without considering the sliding speed. A teardrop shaped droplet slides down slower on a hydrophilic cover compared to a hemispherical droplet on a hydrophobic cover, evident by the wider trough in the transmittance curve for hydrophilic cover. This phenomenon aligns well with expectations as the hydrophobic surface is less wetting and can facilitate droplet removal faster. Whereas arbitrarily larger droplet (1.0 mm) on the almost-hydrophobic cover has a wider impact on transmittance than a smaller droplet (0.1 mm) on the superhydrophobic cover. The impact is quite symmetrical for a rounder droplet on the superhydrophobic cover. Some transmission is still permitted when the laser aligns with the center of the droplet, but the signal strength is weak, hence probably why the LiDAR point cloud shows the projected shadow of the droplet with no point cloud seen at the center when having a 10% reflectivity threshold for this LiDAR unit.
Laser beams are traced in the simulation model to visualize the weakening of signal power that results in a decrease in optical transmittance when a droplet is in the laser path.
Figure 9 shows the laser paths through a hydrophobic cover towards the detector in dry and when a droplet is present at two different positions with respect to the center of the emitted laser beam. In a dry condition or no droplet (
Figure 9a), most of the emitted laser power is captured by the detector on the other side, recorded to be 91% of the total power when having a 3 mm polycarbonate cover. However, when a 1 mm droplet is introduced (
Figure 9b), the majority of the beam is deflected and does not reach the detector. Thus, the detected power is only 10% of the emitted power. Laser paths are observed to be sensitive to droplet position, which changes the angles of incidence at the droplet curvature. An offset of 0.1 mm (
Figure 9c) of height lower than the center of the emitted laser beam further reduces the power by 5%. Therefore, it can be concluded that a droplet acts as a localized lens.
5. Conclusions
This paper investigates automotive LiDAR performance degradation in rain from material and optical perspectives through fundamental studies using isolated droplets and various characterizations. The work demonstrates the state-of-the-art LiDAR grade covers made of polycarbonate panel, which has good optical transmission in dry conditions at 905 nm. Four classes of cover coatings are used, including hydrophilic, almost-hydrophobic, hydrophobic, and superhydrophobic, the water contact angles (WCAs) are measured to be 57o, 82o, 90o, and 152o, respectively. The covers are further characterized by thickness, surface roughness, as well as the effect of angle of incidence on optical transmittance and reflectance to understand the property dependence of LiDAR vision.
When the LiDAR and cover assembly is exposed to a single droplet, it is observed that LiDAR performance degrades by missing point clouds or reducing signal strengths (reflectivity). The rankings of severity from the least affected to the most affected are superhydrophobic, hydrophilic, almost-hydrophobic, and hydrophobic. It seems counter-intuitive that a hydrophobic cover is an undesired approach to maintain good LiDAR vision in rain, as there are a lot of commercially available hydrophobic coating products for soiling mitigation purposes. To explain this, the optical studies suggest that a hemispherical droplet formed on the hydrophobic cover has the highest chance of not having the laser beam reach the target object due to refraction and total internal reflection, thus, translating to missing point clouds. Raindrop influence on LiDAR point clouds is numerically modeled and expanded the demonstration onto a wider spectrum of wettability, including a superhydrophilic (WCA ~ 5o) and two more hydrophilic (WCA ~ 25o and ~ 35o) covers. This paper has focused on the investigation of laser paths during the complex multiphase interactions between air, water droplets, LiDAR cover, and the optical laser beam.
In general, LiDAR performance degrades when adherent droplets are not removed quickly, and the direction of the originally emitted laser path changes such that few beams can reach the target object. This is demonstrated in the phenomenological models proposed, for which they serve as signal enhancing criteria. The material and optical analyses performed in this study provided insights into factors influencing LiDAR performance degradation. Based on the findings, several signal enhancing strategies are recommended. The current work focuses primarily on the optical path and the amount of original laser power able to reach the target object. It provides critical insights for ADAS/AV operation in terms of visibility, i.e., the ability of the vehicle to detect an obstacle. However, in future work, the distance ranging should also be investigated as it is another critical aspect for sensor perception that determines the detection accuracy.
Author Contributions
“Conceptualization, W.P., J.H., L.L., M.A., L.R., J.K., A.B. and K.M.; methodology, W.P., J.H. and L.L.; validation, W.P., J.H. and L.L.; formal analysis, W.P. and J.H.; investigation, W.P. and J.H.; resources, M.A., L.R., J.K. and A.B.; data curation, W.P. and J.H.; writing—original draft preparation, W.P. and J.H.; writing—review and editing, M.A., L.R., J.K., A.B., K.M.; visualization, W.P. and J.H.; supervision, M.A., L.R., J.K., A.B., K.M.; project administration, M.A., L.R., J.K., A.B., K.M.; funding acquisition, M.A., L.R., J.K., A.B., K.M. All authors have read and agreed to the published version of the manuscript.
Figure 1.
Demonstration of cover with integrated sensor modules behind in a vehicle.
Figure 1.
Demonstration of cover with integrated sensor modules behind in a vehicle.
Figure 2.
(a) LiDAR sees raindrops in mid-air which causes signal attenuation effects; (b) LiDAR sees raindrops adhering to the external surface of the sensor assembly which causes signal deflection and obstruction effects.
Figure 2.
(a) LiDAR sees raindrops in mid-air which causes signal attenuation effects; (b) LiDAR sees raindrops adhering to the external surface of the sensor assembly which causes signal deflection and obstruction effects.
Figure 3.
A matrix showing sample images of behind-cover camera perception, front-cover soiling behavior, and resulting LiDAR perception for hydrophilic (top), hydrophobic (middle), and superhydrophobic (bottom) covers. Soiling images are collected from wind tunnel rain tests based on the method reported in [
29].
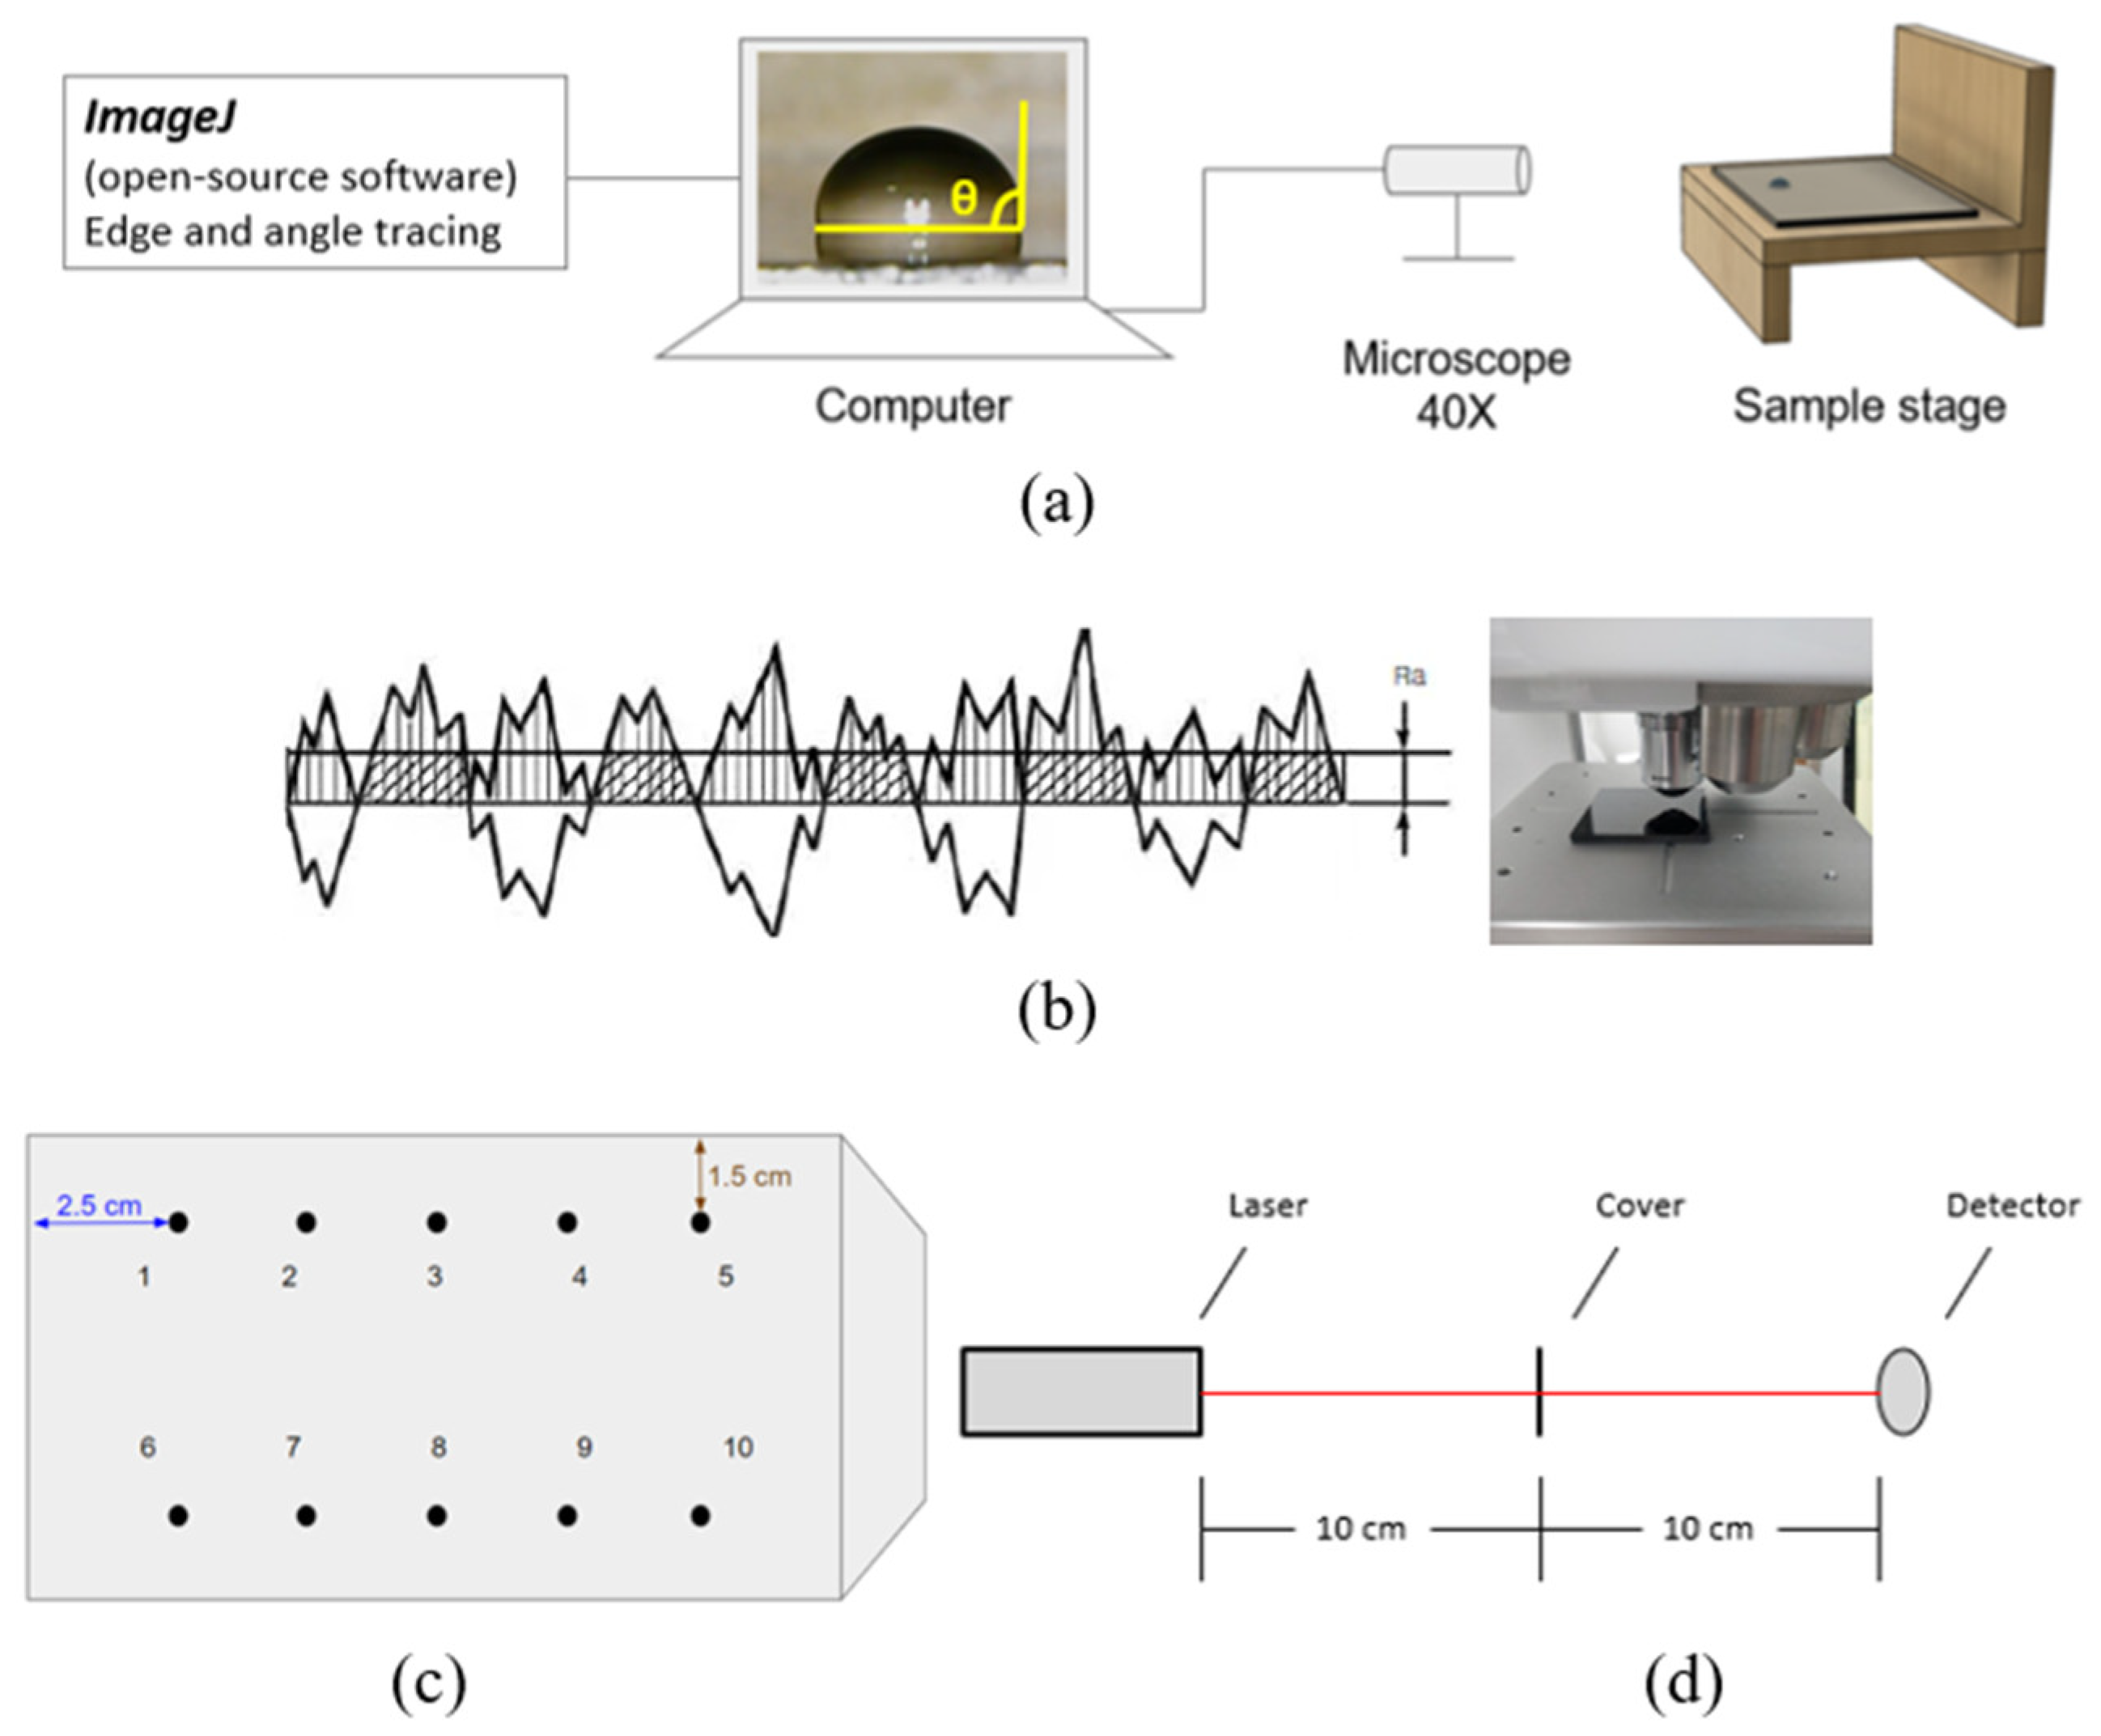
Figure 4.
Characterization test benches for (a) static water contact angle (WCA), (b, c) surface roughness, and (d) transmittance/reflectance.
Figure 4.
Characterization test benches for (a) static water contact angle (WCA), (b, c) surface roughness, and (d) transmittance/reflectance.
Figure 5.
Material characterizations of the (a) hydrophilic; (b) almost-hydrophobic; (c) hydrophobic; and (d) superhydrophobic covers on static water contact angle and surface roughness graphed at the same scale.
Figure 5.
Material characterizations of the (a) hydrophilic; (b) almost-hydrophobic; (c) hydrophobic; and (d) superhydrophobic covers on static water contact angle and surface roughness graphed at the same scale.
Figure 6.
Transmittance and reflectance measurement for the (a) hydrophilic; (b) almost-hydrophobic; (c) hydrophobic; and (d) superhydrophobic covers using an optical test bench.
Figure 6.
Transmittance and reflectance measurement for the (a) hydrophilic; (b) almost-hydrophobic; (c) hydrophobic; and (d) superhydrophobic covers using an optical test bench.
Figure 7.
Percent missing point cloud (blockage) due to different droplet volumes on (a) hydrophilic; (b) almost-hydrophobic; (c) hydrophobic; and (d) superhydrophobic covers.
Figure 7.
Percent missing point cloud (blockage) due to different droplet volumes on (a) hydrophilic; (b) almost-hydrophobic; (c) hydrophobic; and (d) superhydrophobic covers.
Figure 8.
Influence on optical transmission due to a sliding droplet on a (a) hydrophilic; (b) almost-hydrophobic; (c) hydrophobic; and (d) superhydrophobic cover. (a, c) are recorded from physical experiments on duration of influence; (b, d) are recorded from simulation in COMSOL on the effect of position of the droplet.
Figure 9.
Laser paths for (a) no droplet; (b) a 1 mm hemispherical droplet with no position offset; and (c) a 1 mm hemispherical droplet with 0.1 mm position offset.
Figure 9.
Laser paths for (a) no droplet; (b) a 1 mm hemispherical droplet with no position offset; and (c) a 1 mm hemispherical droplet with 0.1 mm position offset.
Figure 10.
Phenomenological models explaining the behaviors of LiDAR laser beams for (a) dry condition; (b) hydrophilic cover with a disturbed film; (c) hydrophilic cover with a teardrop shaped droplet; (d) almost-hydrophobic/hydrophobic cover with a hemispherical droplet; and (e) superhydrophobic cover with non-adhering droplets.
Figure 11.
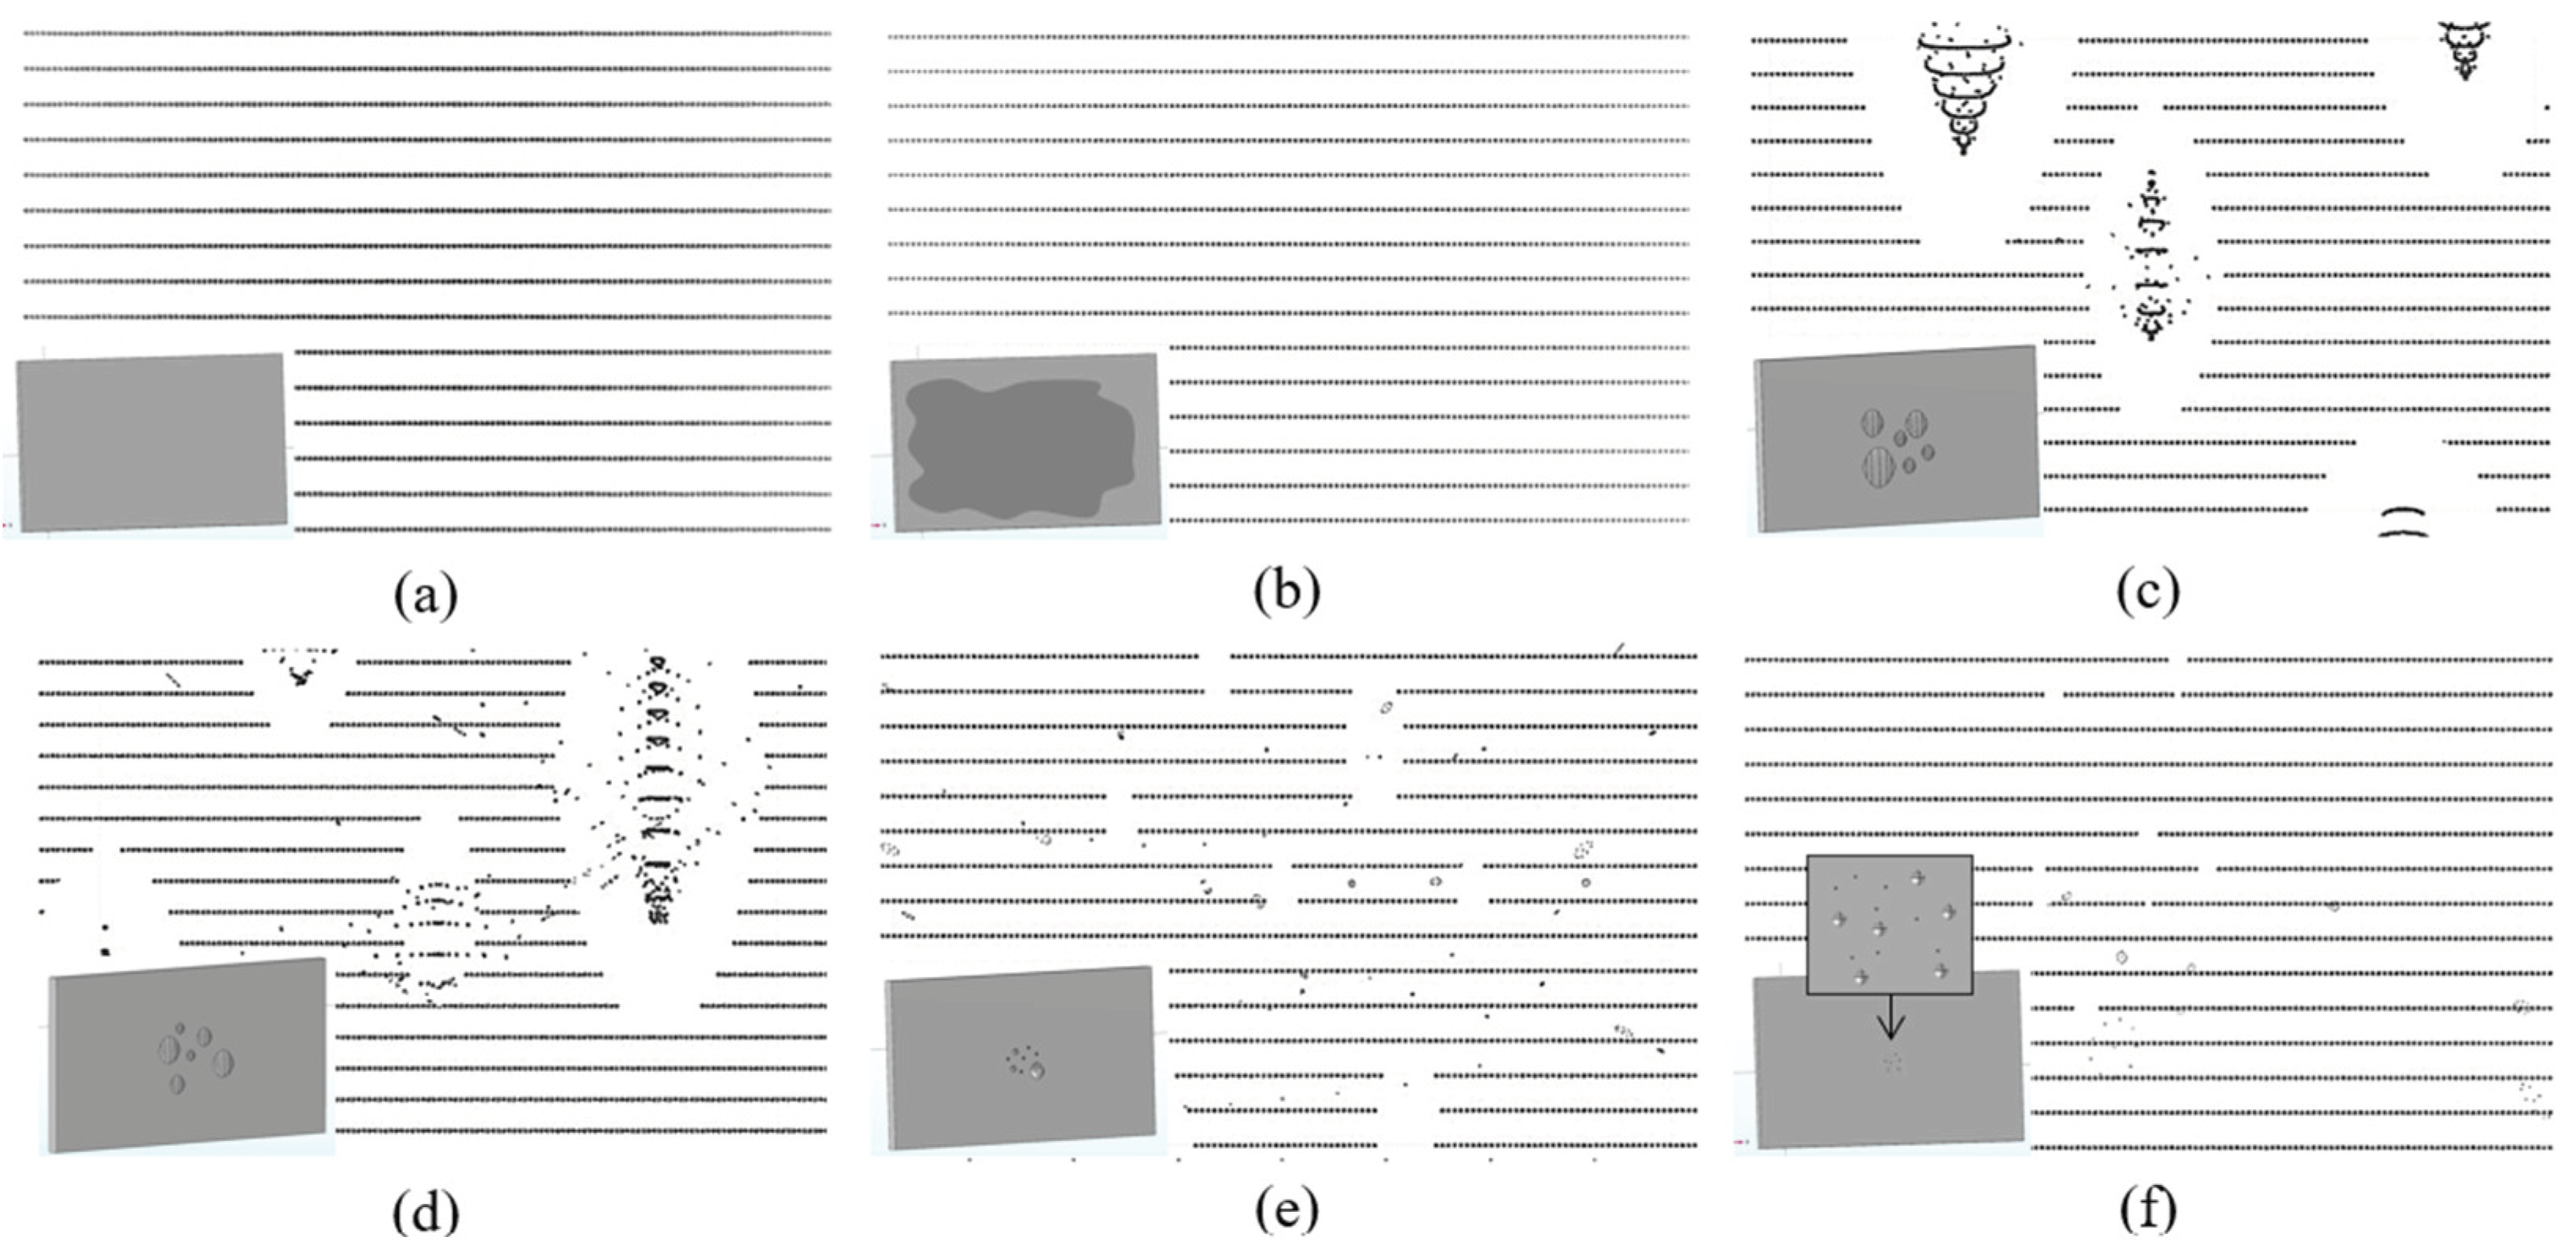
Simulated soiling condition and the resultant point clouds for (a) dry condition; (b) superhydrophilic cover with a stable film (WCA ~ 5o); (c) more-hydrophilic cover with large spreading droplets (WCA ~ 25o); (d) hydrophilic cover with large droplets (WCA ~ 35o); hydrophobic cover with hemispherical droplets (WCA = 90o); and (e) superhydrophobic cover with small droplets (WCA ~ 150o). Ther modeled cover and droplets are shown at the bottom left for each condition.
Table 1.
Characterized material properties for the four classes of covers.
Table 1.
Characterized material properties for the four classes of covers.
| Cover |
Cover thickness |
Arithmetic mean roughness |
Static WCA |
t/D ratio with 15 μL droplet |
| |
(mm) |
(nm) |
(deg) |
|
| Hydrophilic |
2.90 ± 0.05 |
35.61 ± 4.42 |
57.08 ± 4.86 |
0.29 ± 0.03 |
| Almost-hydrophobic |
2.91 ± 0.03 |
40.05 ± 8.66 |
81.86 ± 2.06 |
0.41 ± 0.02 |
| Hydrophobic |
2.98 ± 0.01 |
52.31 ± 3.28 |
90.08 ± 0.44 |
0.45 ± 0.01 |
| Superhydrophobic |
3.21 ± 0.03 |
44.66 ± 5.42 |
151.95 ± 3.05 |
1.14 ± 0.10 |
Table 2.
Measured LiDAR visibility in dry condition using different covers in the sensor assembly, relative to a baseline without cover.
Table 2.
Measured LiDAR visibility in dry condition using different covers in the sensor assembly, relative to a baseline without cover.
| Cover |
Visibility in dry (%) |
| No cover |
100.0 |
| Hydrophilic |
87.3 |
| Almost-hydrophobic |
86.6 |
| Hydrophobic |
89.1 |
| Superhydrophobic |
98.8 |
Table 3.
Measured reduction in LiDAR reflectivity in the presence of a 30 μL droplet on the cover.
Table 3.
Measured reduction in LiDAR reflectivity in the presence of a 30 μL droplet on the cover.
| Cover |
Reduction in reflectivity (%) |
| Hydrophilic |
11 |
| Almost-hydrophobic |
9 |
| Hydrophobic |
5 |
| Superhydrophobic |
8 |
