1. Introduction
For millennia, transition metal complexes have served as captivating agents of color in human-made art, their vibrancy enchanting viewers long before the sources of these colors were fully understood [
1,
2]. From the brilliant blues of Ancient Roman glass mosaics [
3] to the striking turquoises of Ancient Egyptian faience [
4], transition metal complexes have found themselves at the center of artistic expression across civilizations. Despite the extensive usage of these pigments, the nuanced exploration of the precise mechanisms underlying their coloration is a more modern pursuit. It has been recognized that their vibrant colors are the visual manifestations of d-orbital splitting, ligand field theory, and charge transfer [
3,
5,
6,
7,
8] features inherent to the transition metal complexes within the pigment. These complexes are not fixed, however, and their constitutions can be altered by various environmental factors and interactions [
9,
10,
11,
12], therefore altering the visual light wavelengths they absorb and reflect [
13]. There are multiple examples of this, both during and after the artistic process, where a new color arises that is different from the one initially applied [
11,
13]. To understand the origins of these color changes, it is essential to delve into the intricate mechanisms governing color formation within the complexes. With this knowledge, the ability to exercise enhanced control in both preventative and intentional alterations of these pigments in diverse applications can be developed [
14]. This review concentrates on employing a bottom-up scientific approach to investigate the molecular origins of colors produced by transition metal complexes in pigments and ceramic glazes, utilizing advanced spectroscopy techniques. Furthermore, it explores the impact of processing conditions on color variations, providing valuable insights for artists and manufacturers aiming to enhance the accuracy and quality of their creations while reducing environmental impact. This is discussed alongside future implementation of high-level computational analyses and fine-tuned laboratory synthesis techniques.
The following sections (1.1-1.3) aim to provide brief background information or establish context, assisting readers in comprehending the content presented in the review article.
1.1. Perception of Color in Ceramics and Pigments
The vibrant world of pigments is fundamentally a phenomenon of light’s interaction with materials. As light encounters an object, it undergoes several modifications including reflection, transmission, absorption, scattering, dispersion, interference, and diffraction. These interactions collectively contribute to our perception of colors as white, black, or colored. Central to this interaction, and also this review, lies the principle of absorbance. This principle delineates how specific wavelengths of light are absorbed by a material, while others are either reflected or transmitted, ultimately determining the color we perceive [
15].
Transition metal complexes in pigments are characterized by their ability to serve as chromophores, undergoing electronic transitions that enable them to absorb specific wavelengths of light within the visible range of the electromagnetic spectrum. The wavelengths that these pigments fail to absorb are instead reflected, determining their color. This selective absorbance and reflection process is at the heart of the color these pigments produce [
13].
1.2. Transition Metal Complexes
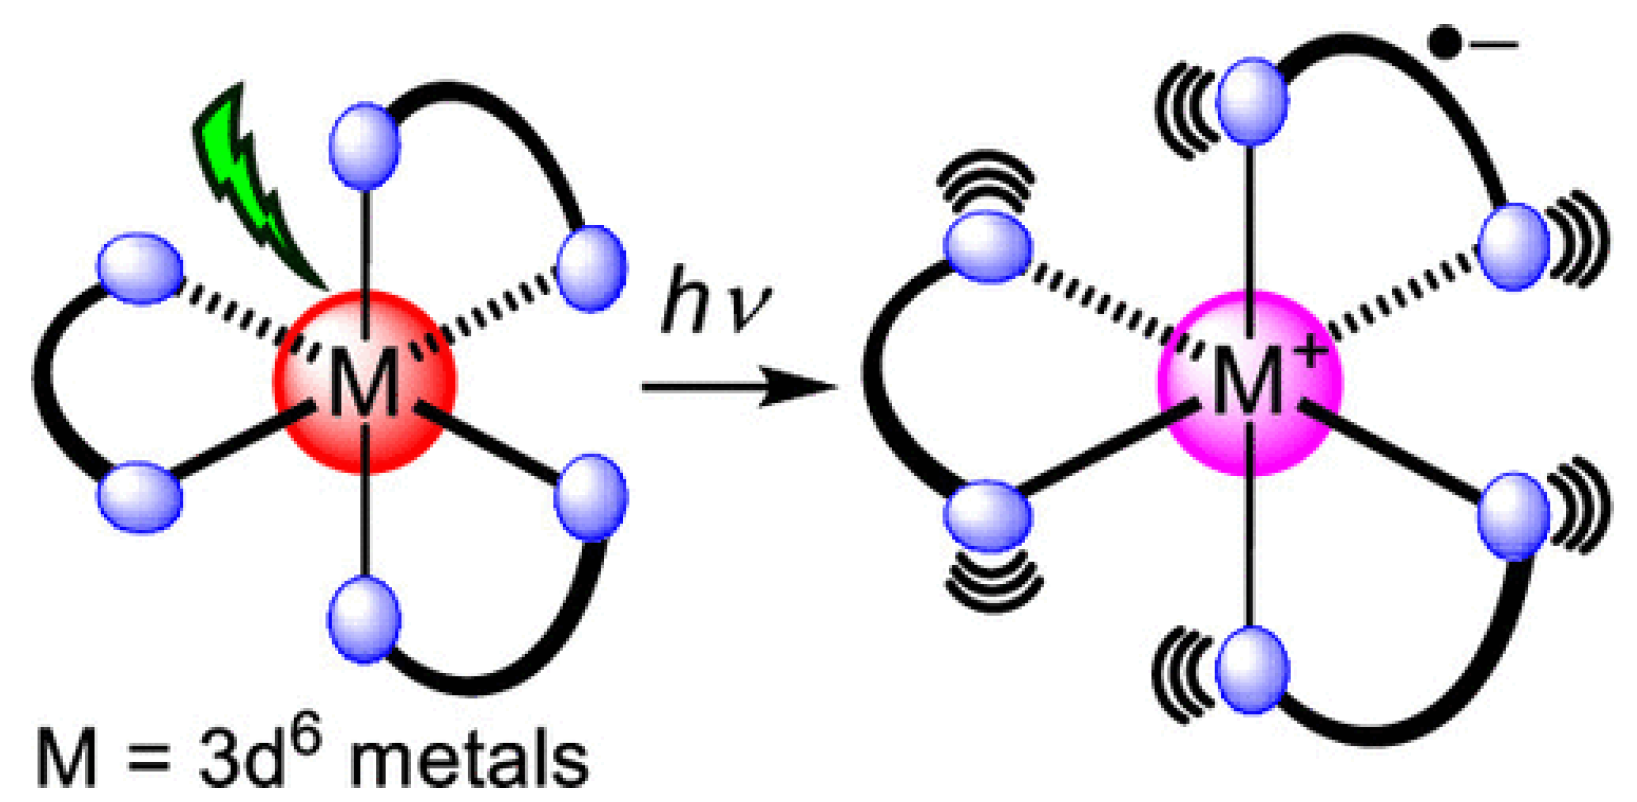
A transition metal complex, also known as a coordination complex, is a compound comprised of a central metal ion surrounded by one or more ligands, typically functioning as Lewis Bases [
16,
17] (
Figure 1a). These ligands donate their electrons to establish coordinate covalent bonds with the metal center [
13,
18]. Transition metals readily form complexes due to their ability to coordinate with other molecules or ions, deemed ligands [
6]. Notably, colored complexes can be found naturally, particularly in minerals, or artificially synthesized for a diverse array of applications [
13].
The unique quality of transition metals that gives them the ability to produce these bright, visible wavelengths of light derives from their unfilled valence d-orbitals and ligand interactions, resulting in d-d orbital splitting and/or charge transfer [
3,
13,
19]. The energetic interaction of visible light with the electrons in the d-orbitals of the central metal ion and at times with those of the ligands, as well as other variables that will be discussed, determine the magnitudes of the wavelengths that the gaps between such orbitals (
Figure 1b,c) [
20,
21,
22]. These magnitudes are influenced by several factors including the electronic structure of the center metal ions, geometry of the molecular structure, particle size, coordination number, and ligand field strength.
1.3. Historical Usage of Transitional Metal Complexes as Color Centers
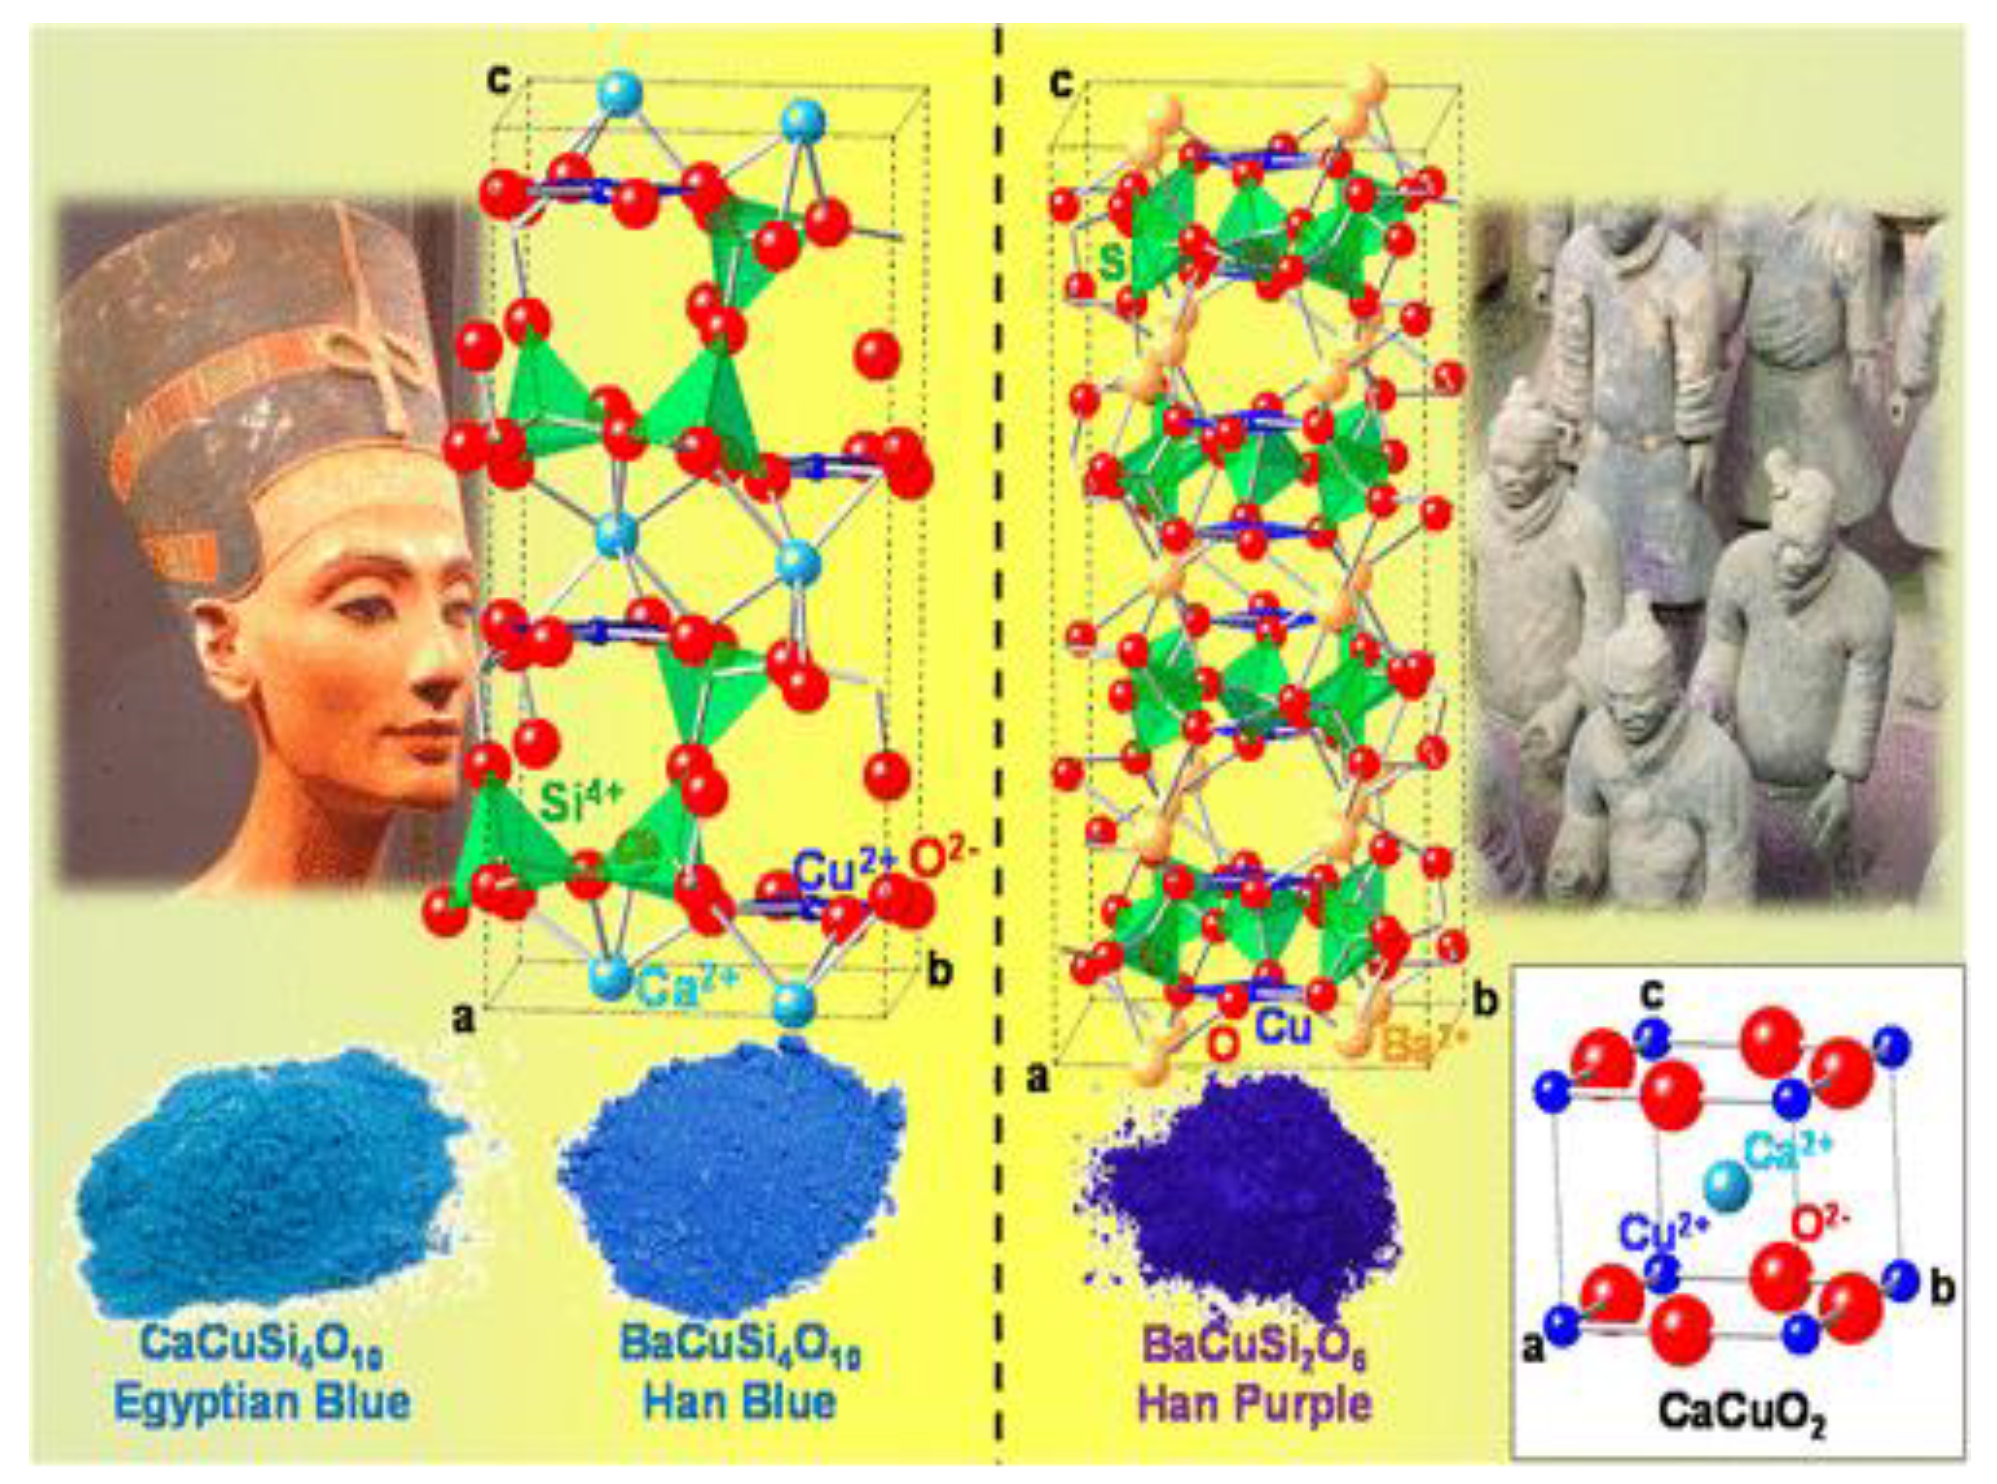
The use of transition metals to create vibrant colors in art and art objects has been documented extensively across civilizations. Dating back to 2500 BCE, Egyptian blue faience ceramics utilized the first synthetic pigment, Egyptian blue [
23]. This pigment was employed in early dynasties on notable historical artifacts and landmarks, such as the famous bust of Queen Nefertiti (
Figure 2), and as far as at the ruins of the Parthenon and Pompeii in Rome [
2]. Egyptian blue, CaCuSi
4O
10, makes use of copper as a metallic center, much like other early synthetic pigments such as Chinese Han blue, BaCuSi
4O
10, and Han purple, BaCuSi
2O
6, which were both theorized to be developed independently from Egyptian blue [
24,
25].
Multiple transition metals have been studied for their role in creating the blue and green glazes of ancient Chinese pottery, most notably cobalt, manganese, copper, iron, and titanium [
26,
27,
28]. High iron content and the use of iron oxides have been a rarer yet still historically documented source of blue colorants in ceramics. This has been observed in Jun ware glazes and specifically an analysis of the Tenmoku “Blue” glaze – a rare and highly valued glaze utilized during the Song dynasty, with few surviving fragments [
26]. Its beauty was written about extensively, distinguished as a “supreme product,” and was considered to have involved an incredibly complicated and unpredictable firing process lacking in production reliability [
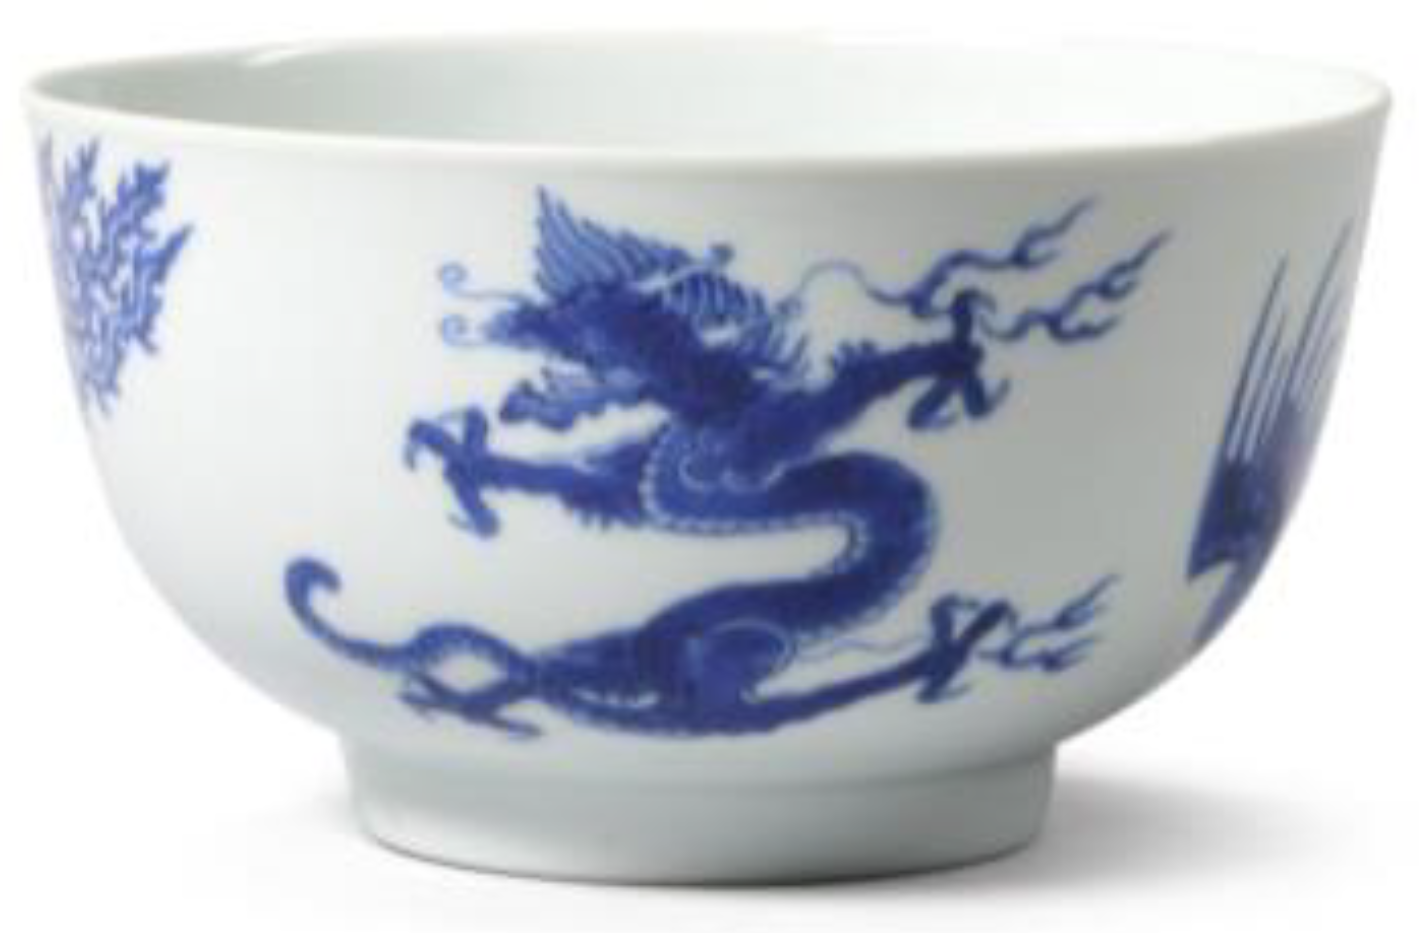
26]. The cool-toned, bright white and blue colors that typically come to mind with the mention of Chinese pottery, especially Chinese porcelain (
Figure 3), also were not originally consistent results [
29]. The bright white color of porcelain can be attributed to the use of kaolin, composed mainly of the mineral kaolinite. However, kaolin clay was also not originally a reliable material, as its whiteness often varied based on the presence of other materials in the clay, such as titanium and iron, which are some of the most common transition metals and “contaminants” found in Chinese pottery [
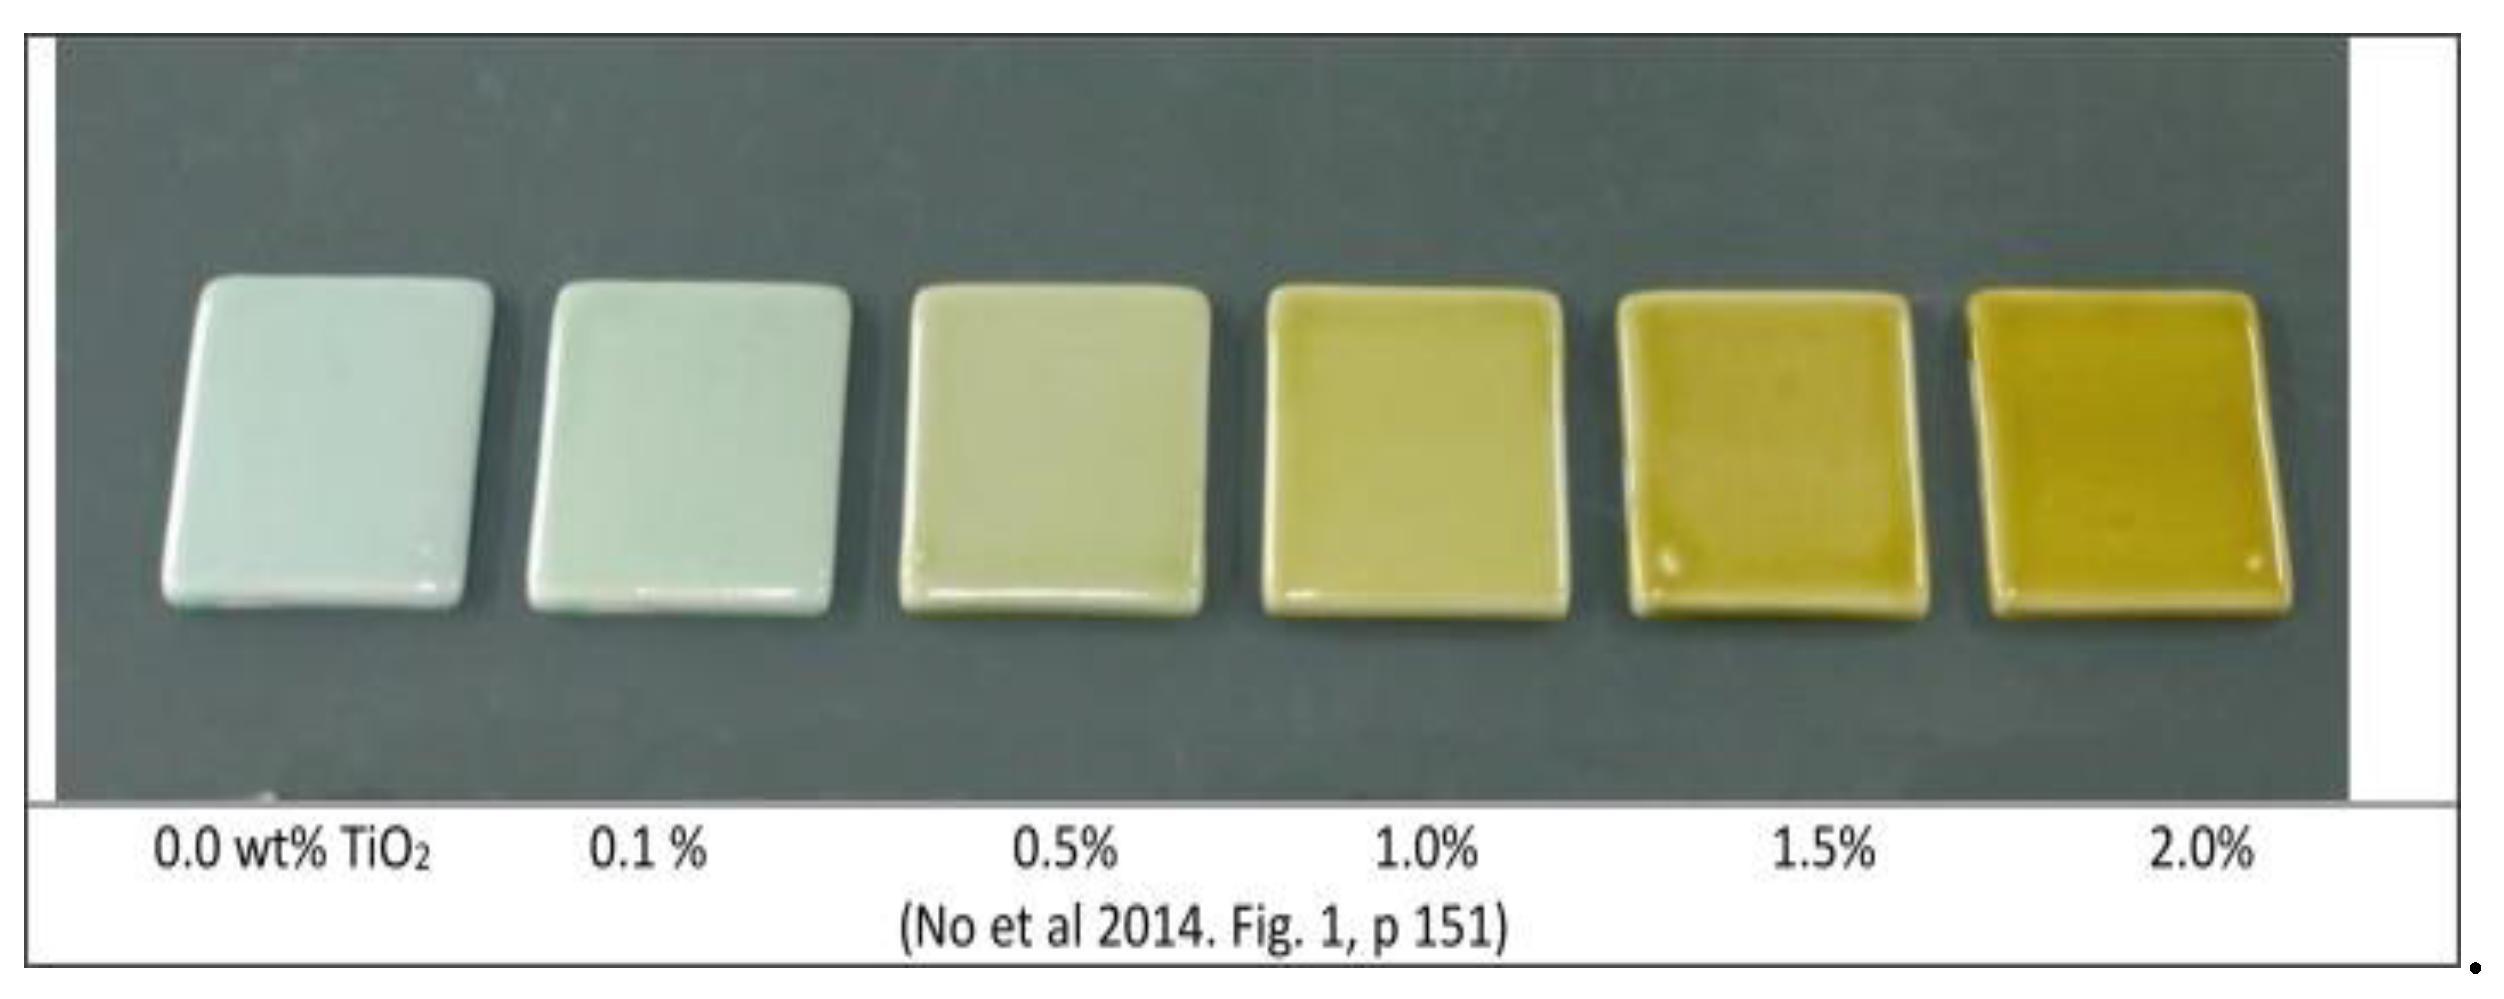
30]. To be more intentional with designs’ final appearances, titania (TiO
2) has been studied for its ability to oxidize iron, causing what would be a bright white or a creamy pale blue to become greener and subsequently impact its quality rating (
Figure 4) [
27]. This will be further discussed in more detail in section 3.3 of this review. Over time, empirical methods were developed to whiten and “purify” the underlying clay, resulting in what we now can connect to lower titania levels and therefore more consistently cool-toned ceramics.
The deep blue of Chinese porcelain (
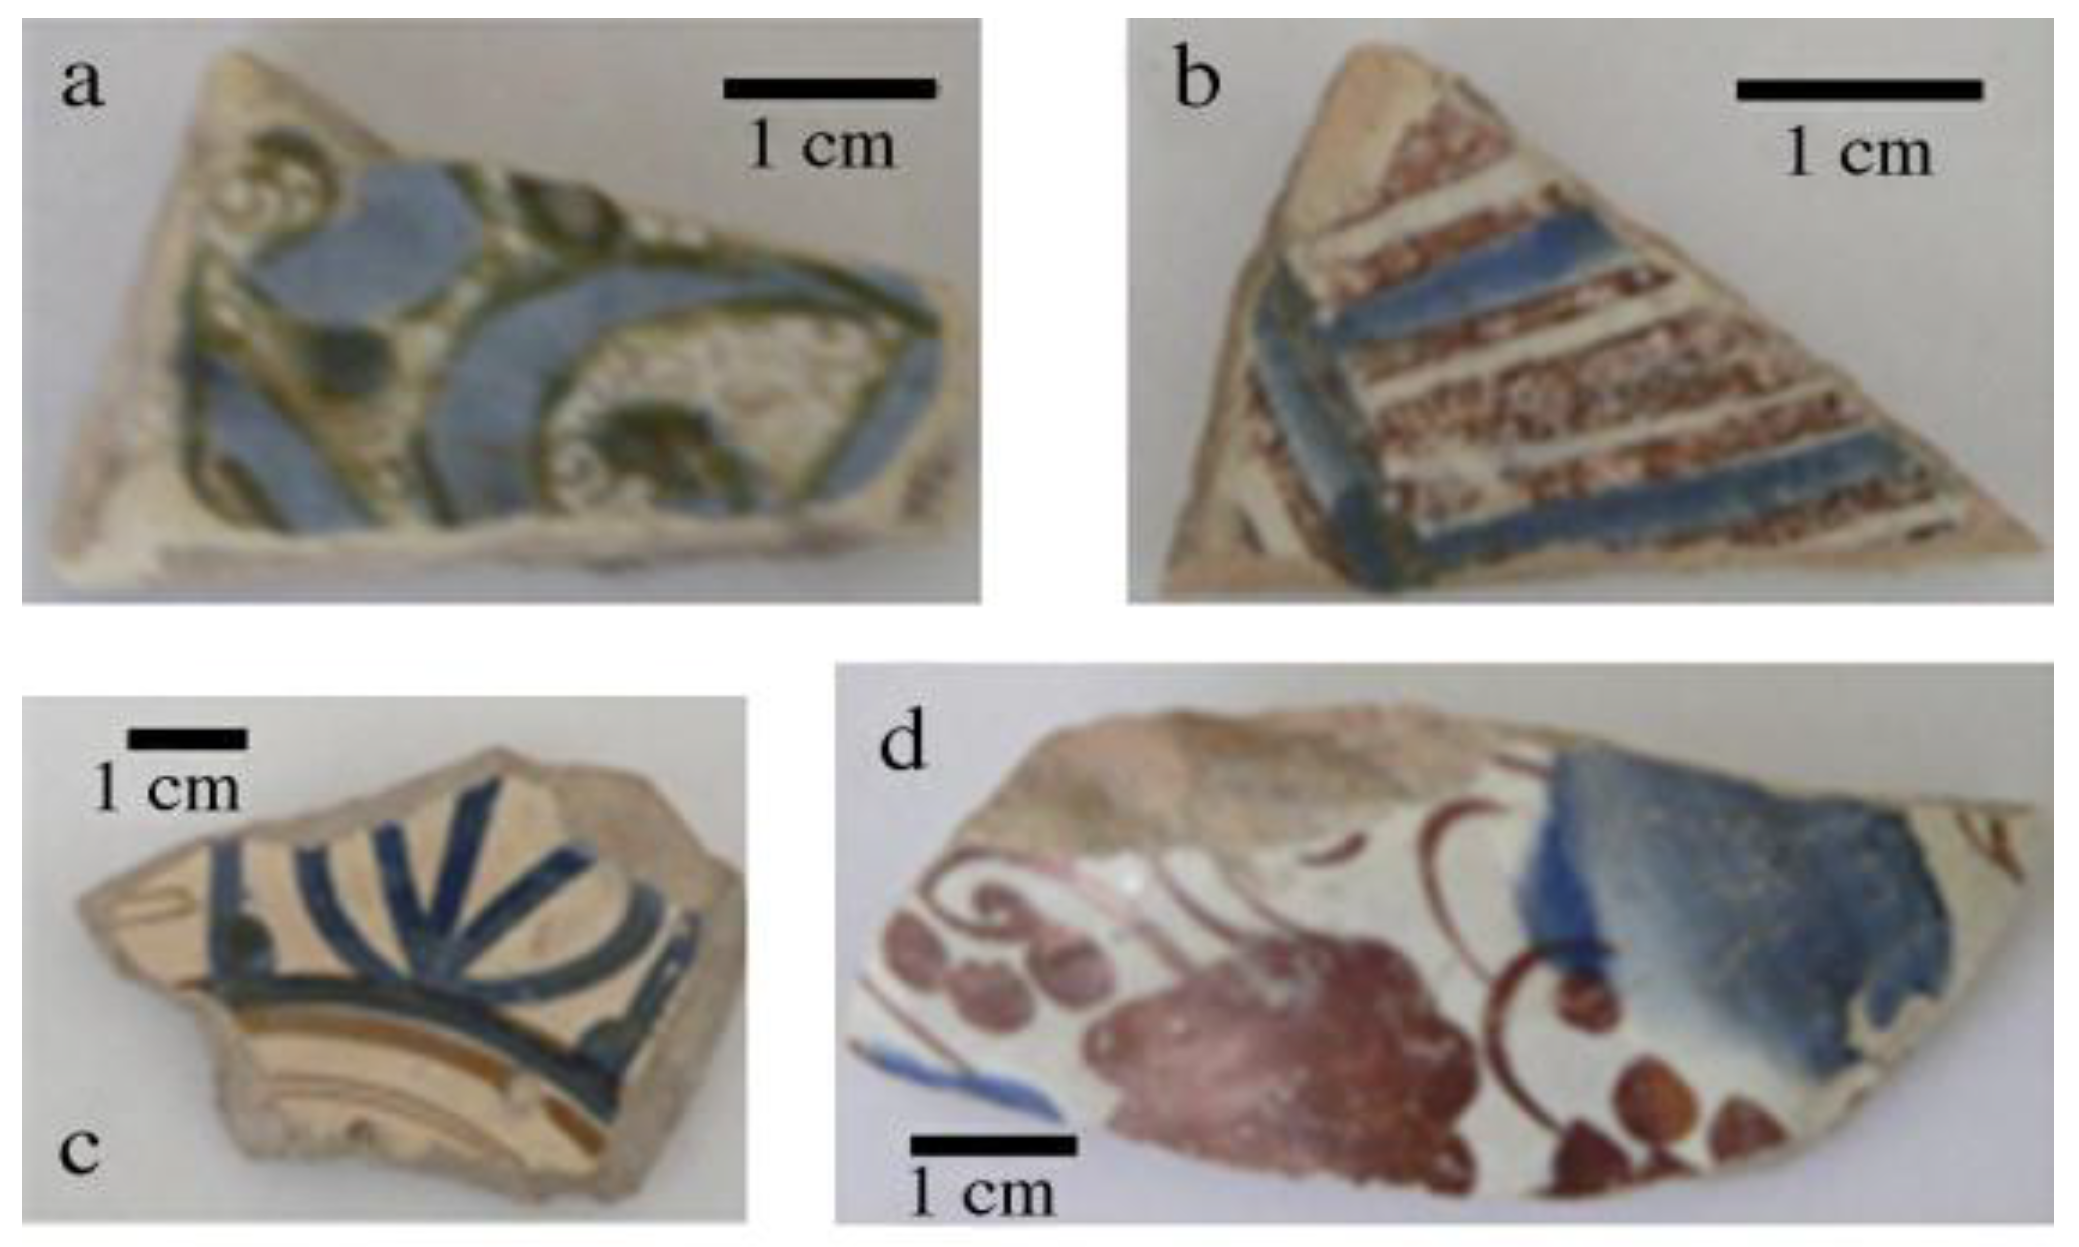
Figure 3), meanwhile, originates from the use of cobalt, a method that came to be shared with ceramicists across the world. In the Middle Ages, cobalt began to be used extensively in Valencian ceramic workshops as a glaze colorant (
Figure 5) [
31]. Before this, cobalt had only been used in Europe as a colorant for stained glass. The earliest examples of these cobalt-blue glazes date back to the 14th century CE, in Paterna and Manises, and this practice continued until the 18th and 19th centuries. The blue colorant would have been applied over or under a white metal oxide glaze, though the chemical composition of the pigment would likely have varied based on different workshop recipes and available raw materials [
31].
In the 19th century, with the Industrial Revolution, major strides were made in developing vibrant synthetic pigments for commercial use, most notably Prussian blue [
32]. The popularity of synthetic pigments gave artists a much wider color palette to work within their art, along with making painting a more portable activity. These changes played a major role in the rise of impressionism, and synthetic pigments became staples in the palettes of painters such as Van Gogh and Picasso [
1]. Prussian blue was also useful in Japanese
ukiyo-e woodprints in the 19th century as a cheap alternative to the organic pigments they were using, sometimes being employed simultaneously, allowing for more blue colors to be featured in their works [
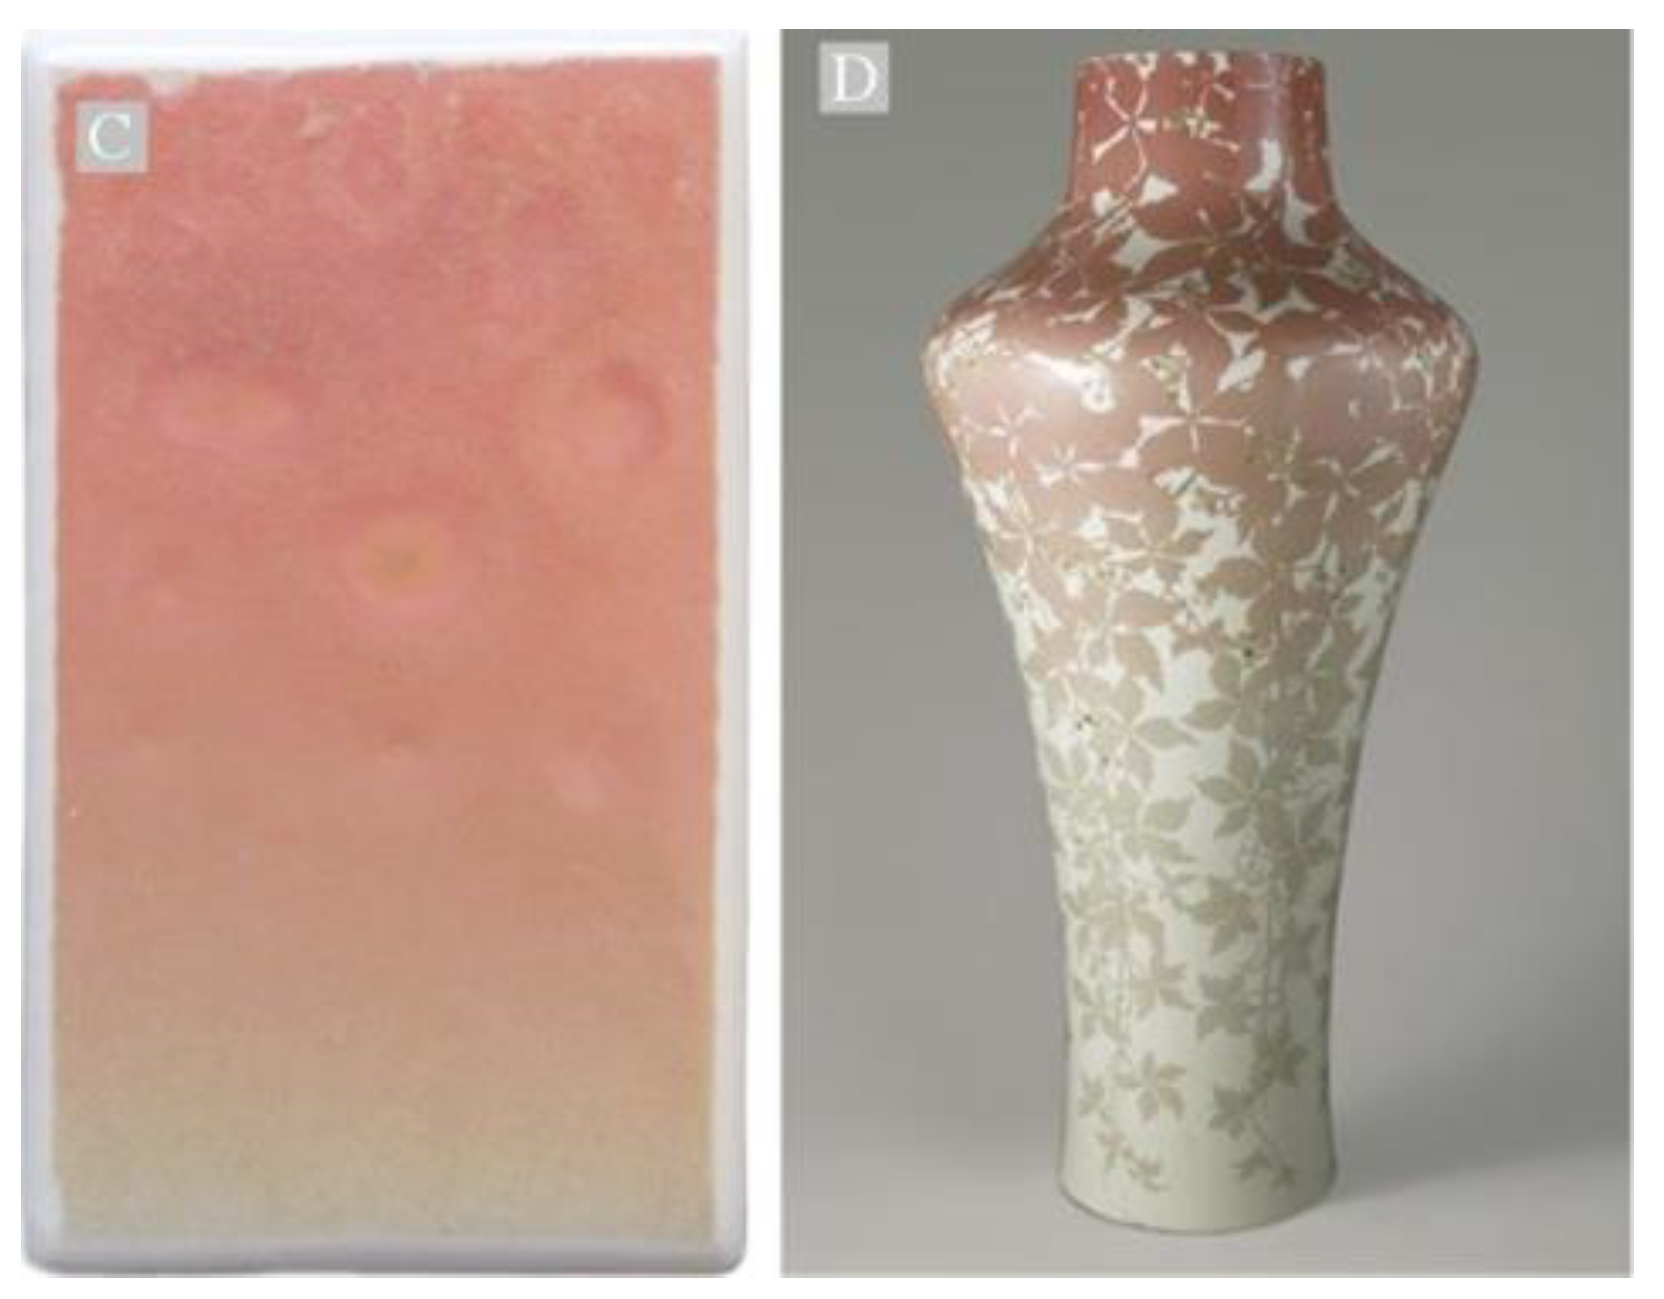
33]. In addition, the recent discovery of chromium introduced an entirely new transition metal to use as a coloring agent, which led to significant growth in new ceramic glaze colors and recipes (
Figure 6) [
11]. The ‘Manufacture de Sèvres’, a prominent French porcelain factory, was a prime example of this sudden growth, as the Sèvres laboratory went on to develop 76 chromium oxide glazes in the 19th century, comprising over half of the 138 pigments established in the laboratory [
11].
2. Chemical Origin of Color in Ceramics with Transition Metal Complexes
Delving deeper into the theory behind the coloring of transition metal complexes acts as a basis of knowledge that can be used to understand their color variability through various stages of production. Although earlier review articles [
1,
8] have explored the origin of color attributed to transition metal complexes, this review offers a distinct perspective by focusing on the role of transitional metal d orbitals, selection rules, and ligand field effects. Within this context, two primary mechanisms — d-orbital splitting and charge transfer — which encompass the energetics of the complex's orbital systems, are examined in detail.
2.1. d-Orbital Splitting
Transition metals, not bound to any ligands, have electrons occupying 5 degenerate d-orbitals. Yet this is altered when involving ligands in a coordination complex, causing some of their d-orbitals to energetically shift and become nondegenerate [
5]. This phenomenon, called d-orbital splitting, is the most common coloration mechanism for transition metal complexes [
34]. Consequently, valence electrons can transition from lower energy d-orbitals to those of higher energy when subjected to radiation [
19]. When the energy difference between the split orbitals falls within the visible light range of the electromagnetic spectrum, these electronic transitions manifest as vibrant and distinct colors, complementary to the wavelengths of light absorbed [
9].
The quantity of d-electrons as well as the nature, number, and geometric configuration of the ligands encircling the metal ion influence the magnitude of the energy gaps between their orbitals [
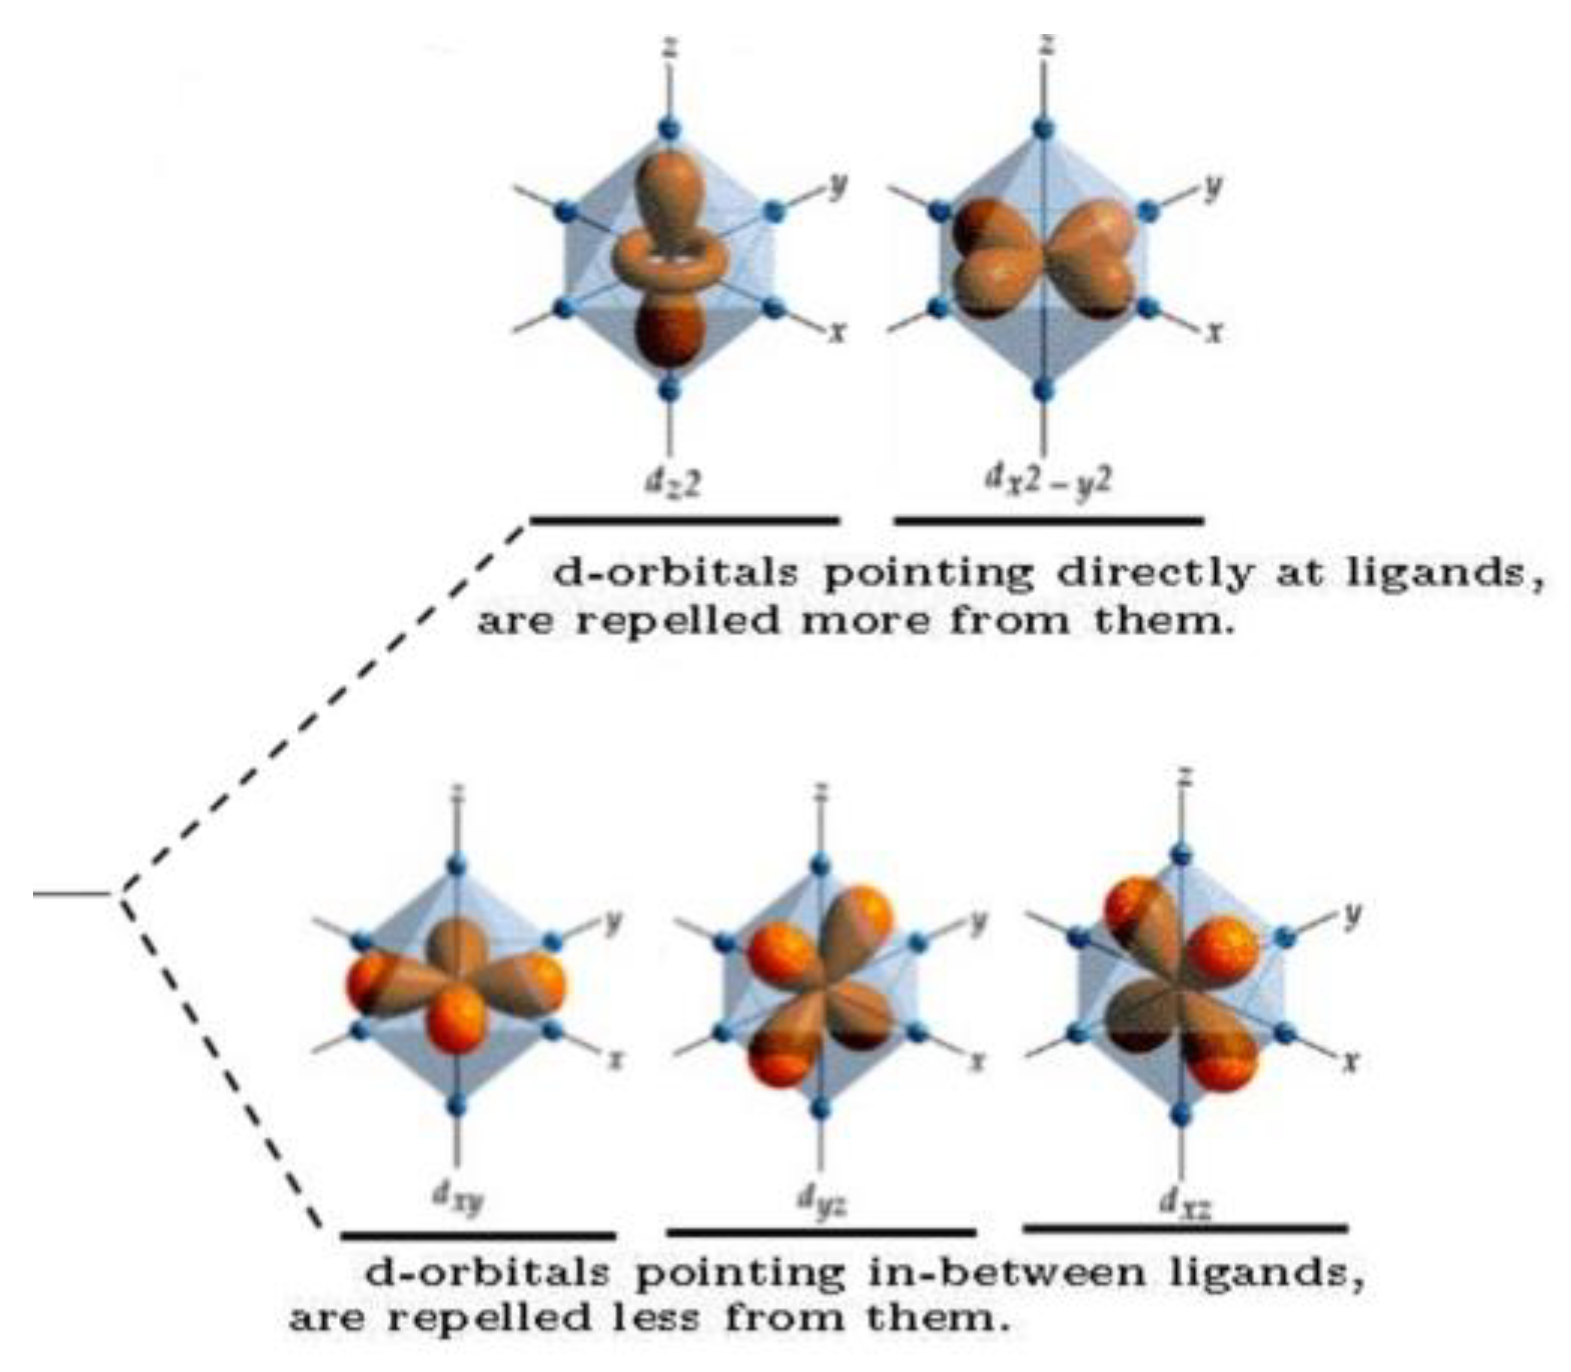
19]. The electron density of the 5 d-orbitals is distributed along the axes for the d
x2-y2 and d
z2 orbitals, and between the axes for the d
yz, d
xy, and d
xz orbitals [
35]. Upon ligands binding to the metal, the behavior of the two axial orbitals diverges from that of the three non-axial in an octahedral complex (
Figure 7) [
35]. Orbital orientations allowing overlapping with ligands’ bonding orbitals are energetically shifted relative to the non-bonding d-orbitals due to electrostatic repulsions of their like negative charges [
7,
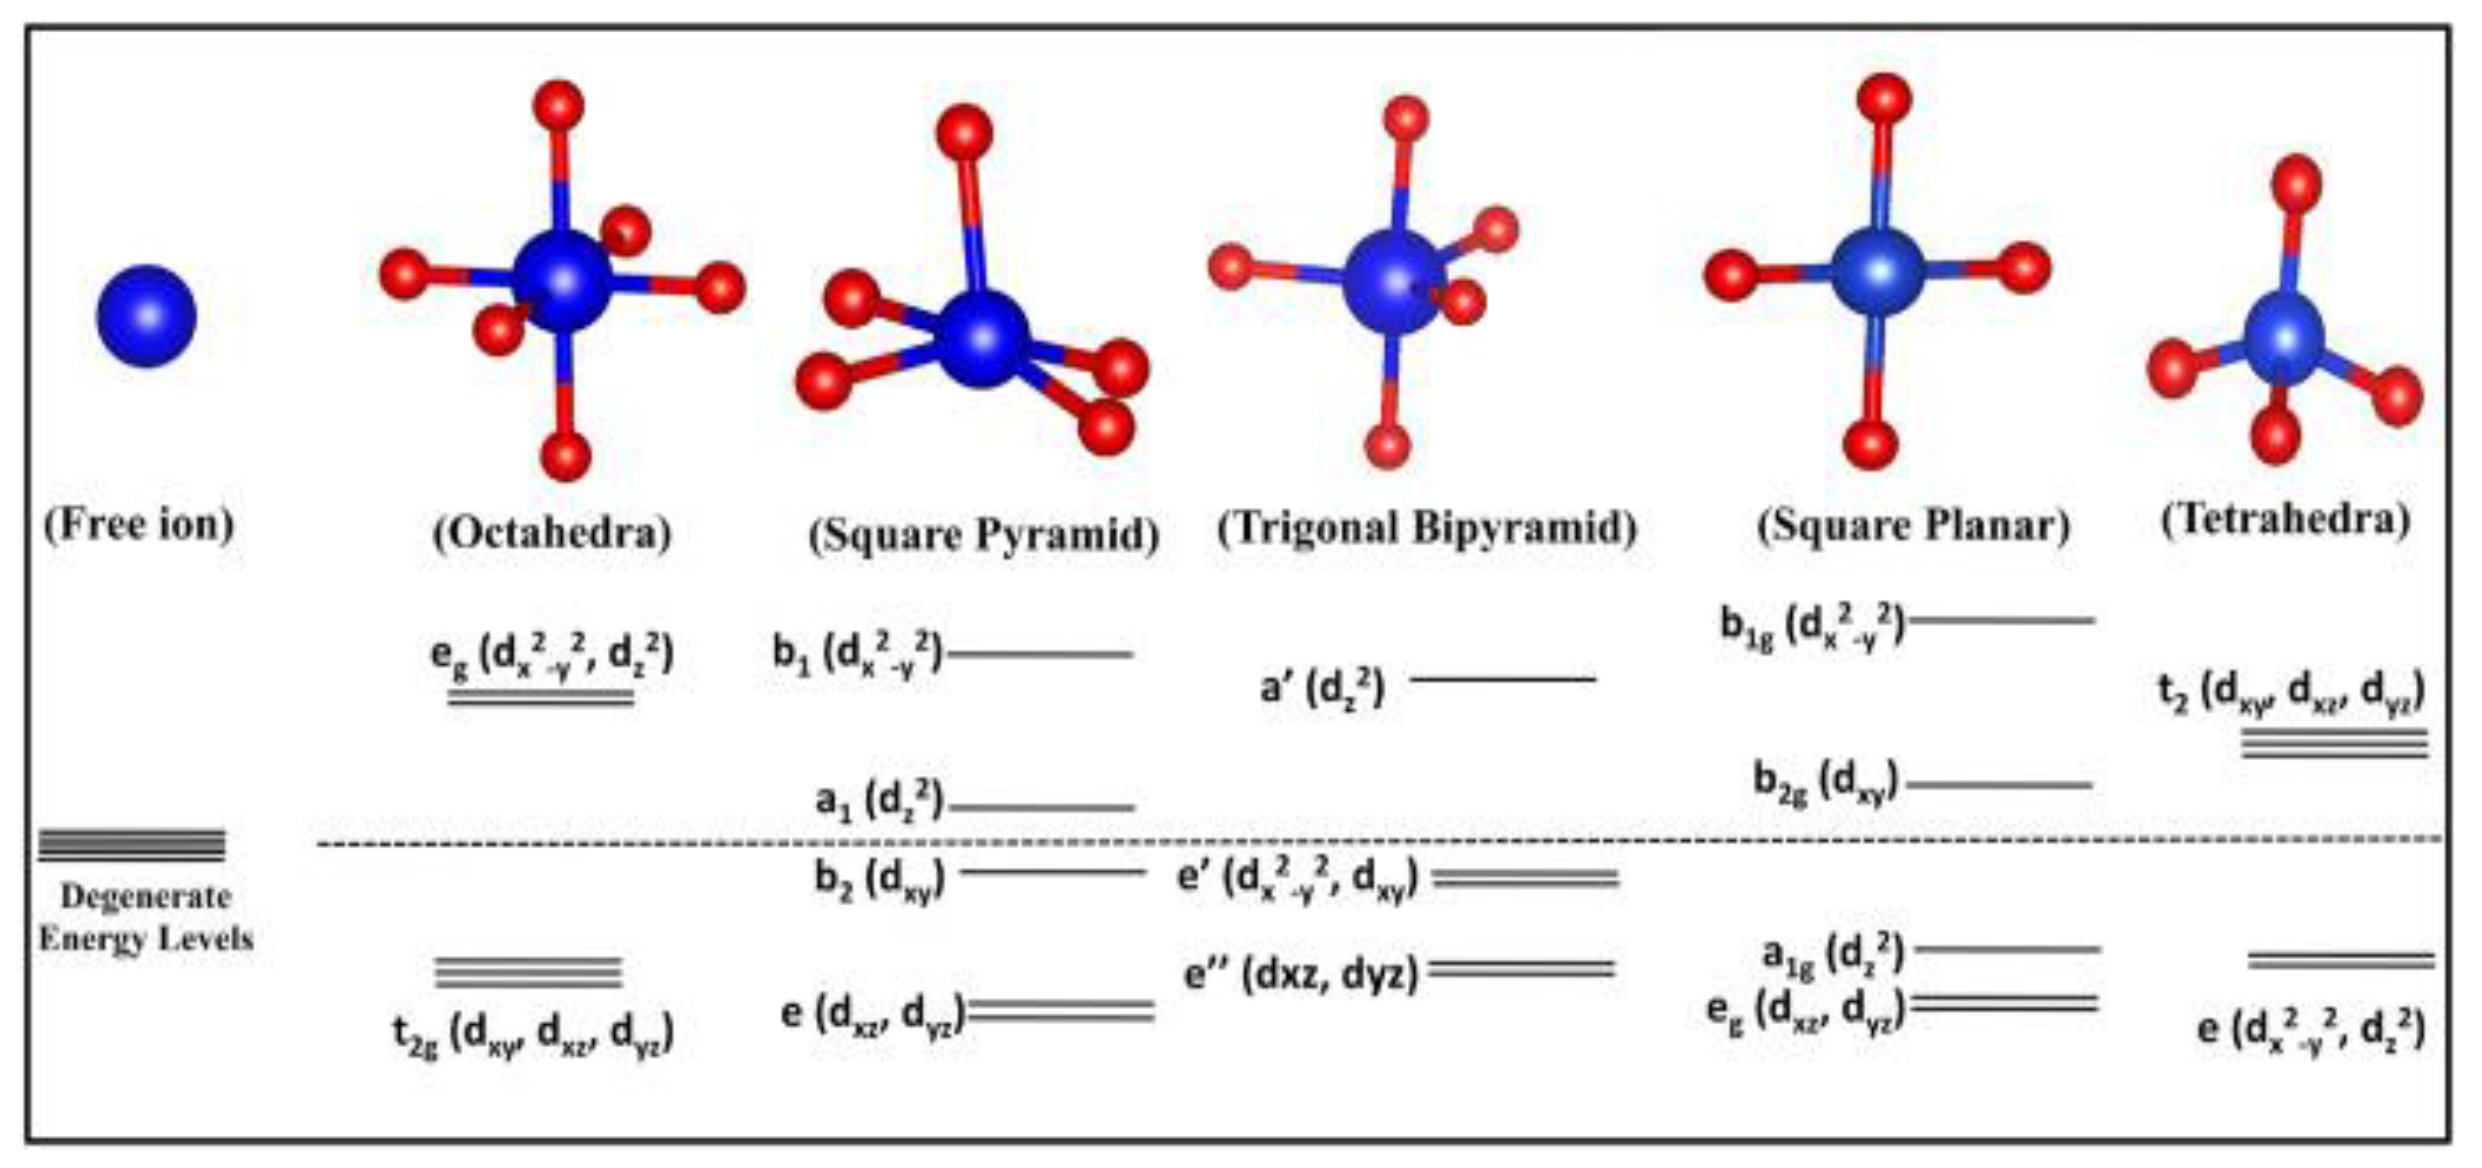
35]. Consequently, this leads to an energy disparity between the previously degenerate orbitals. Since the orientation of ligands and coordination number can vary, the relative energies of different d-orbitals can also change. Therefore, different complex geometries exhibit characteristic magnitudes of energy discrepancies in their metallic or molecular orbitals [
36] (
Figure 8).
The higher symmetry of a transition metal complex can be disrupted, leading to a lower symmetry configuration, as a result of Jahn-Teller distortions [
37,
38]. The Jahn–Teller effect dictates that any non-linear molecule with a degenerate electronic ground state will experience a geometrical distortion that resolves the degeneracy, as this distortion decreases the overall energy of the complex. The theoretical basis of the Jahn-Teller effect lies in vibronic coupling, which represents a breakdown of the Born-Oppenheimer approximation. A non-linear molecule with a degenerate ground state (the degree of degeneracy depends on the ligand field strength and the number of d-electrons of a transition metal ion) must break its symmetry to lower the molecule's energy via vibronic coupling [
37,
38]. For instance, consider an octahedral Cu
2+ complex with a d
9 configuration, which demonstrates a doubly-degenerate ground state when three electrons occupy the e
g orbitals (
Figure 1). Octahedral Cu
2+ complexes with O
h symmetry commonly undergo distortions, resulting in unequal bond lengths. Specifically, the two axial bonds may either shorten or lengthen compared to the equatorial bonds. This distortion reduces the molecular symmetry from O
h to D
4h, primarily due to the influence of the Jahn-Teller effect [
37,
38]. Therefore, in an open-shell octahedral complex with O
h symmetry, the e
g and t
2g orbitals undergo further splitting, resulting in four energy levels for the distorted complex with D
4h symmetry (either in elongated or compressed forms). Jahn-Teller distortions are observable through various spectroscopic techniques. In UV-VIS absorption spectroscopy, Jahn-Teller distortions lead to band splitting in the spectrum due to symmetry reduction (from O
h to D
4h) [
37,
38].
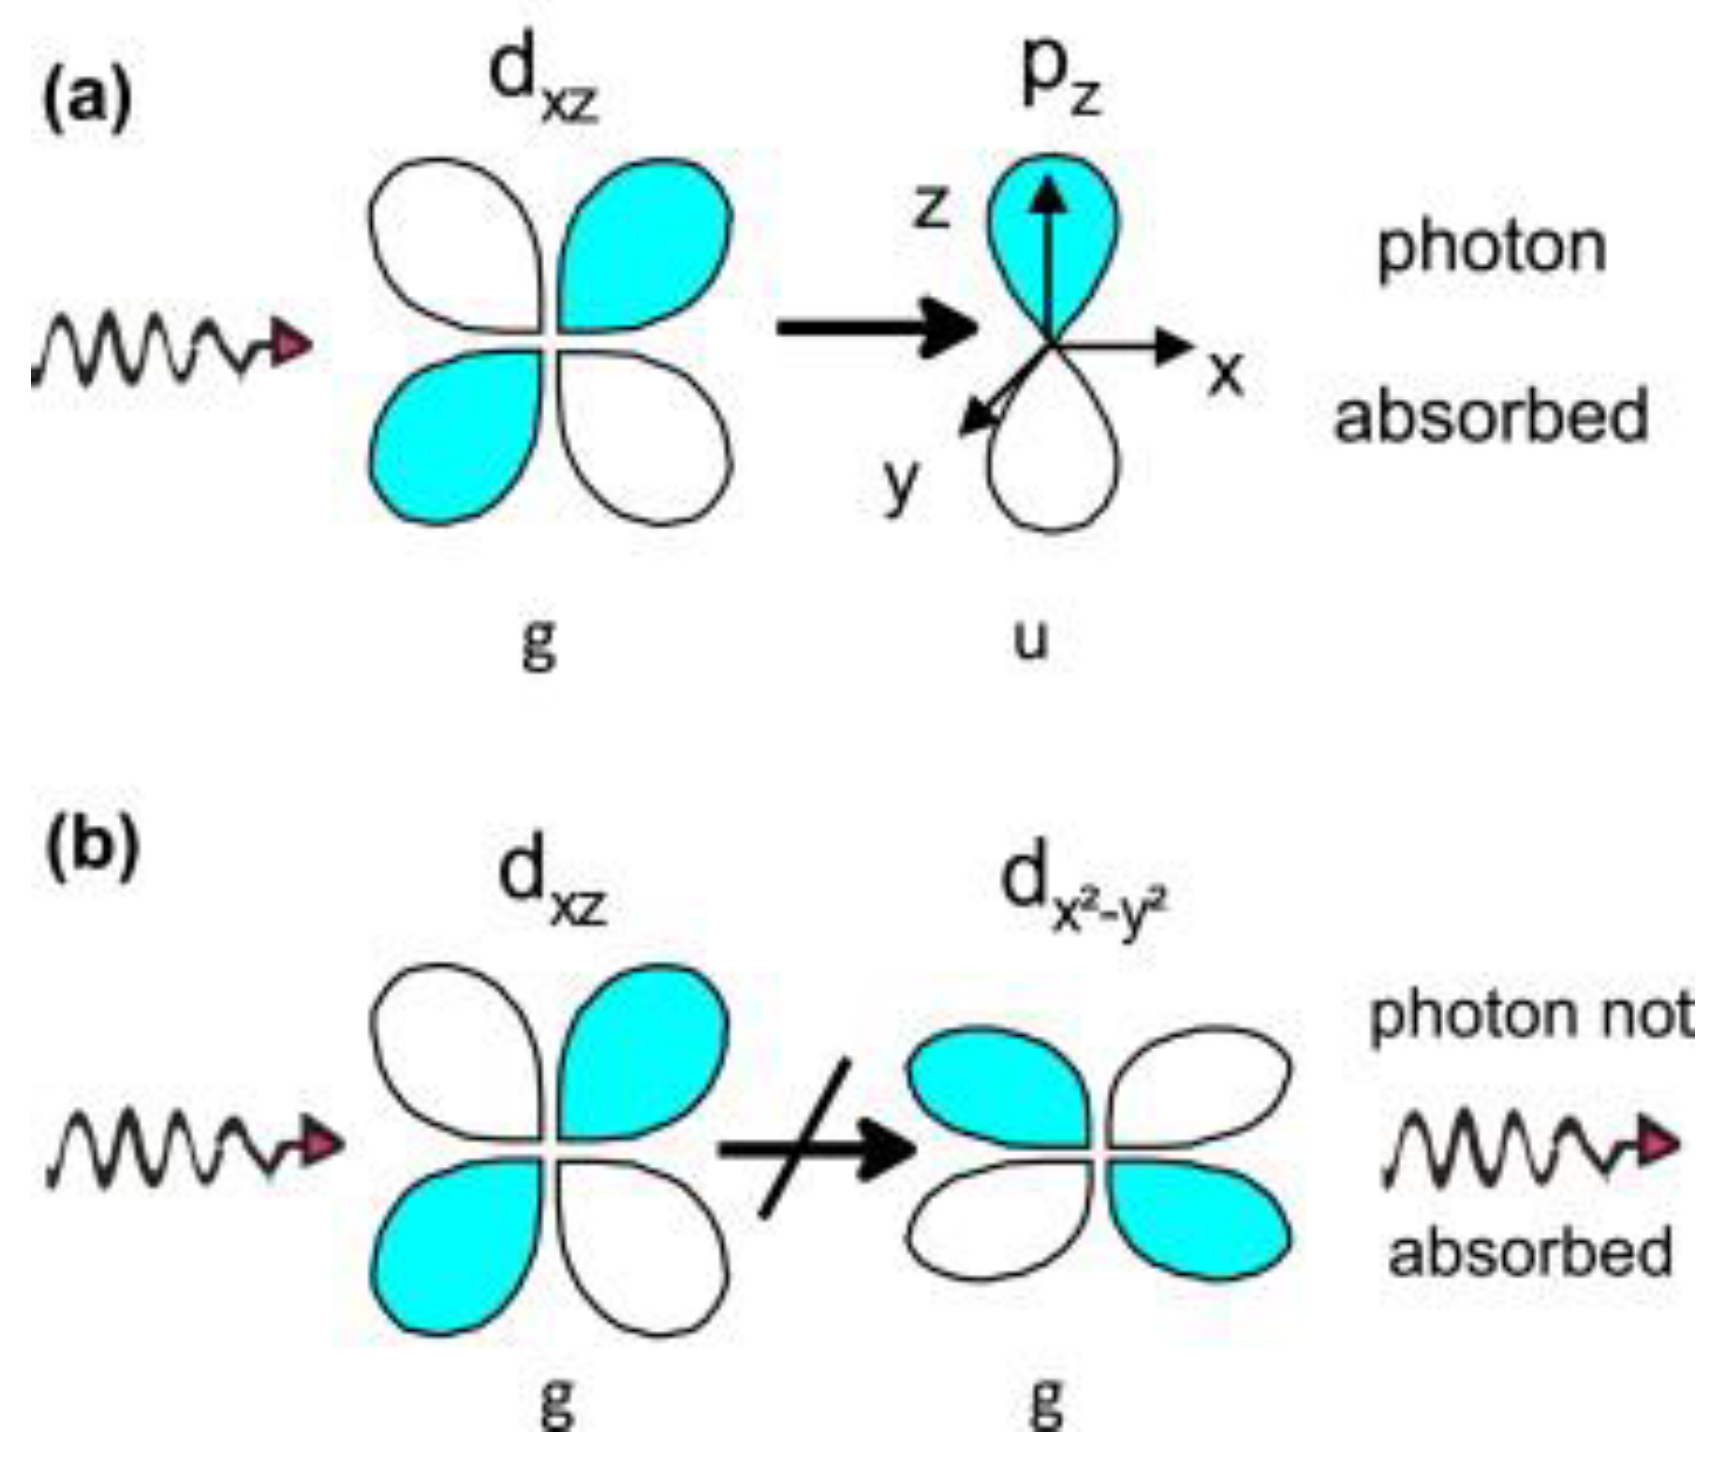
In the realm of d-d transitions in transition metal complexes, the Laporte selection rule significantly influences the observed absorption spectra [
3]. This rule dictates that transitions not involving changes in parity (the symmetry concerning inversion through the center of symmetry) would be forbidden [
21,
34]. Forbidden transitions, occurring between states with the same parity, are notably weaker than allowed transitions between states with different parity, which is possible if the transitions are intramolecular rather than intra-atomic [
21]. In other words, electronic transitions involving changes in the angular quantum number (e.g. Δ L = ± 1), from 0 or 2 (
s or
d) to 1 or 3 (
p or
f), are favored more so than if the number was constant, for instance from 2 to 2 (
d-d) (
Figure 9) [
3,
21,
34,
36]. However, any characteristic of the complex that would compromise its symmetry, like the structure of ligands, complex geometry, and asymmetric sphere vibrations, relaxes this rule and allows for complexes to conduct electron transfers with d-d splitting, which is the case for many complexes. This is due in part to the mixing of d-p orbital character upon bonding with the ligands as well [
3,
21].
Additionally, alongside the Laporte selection rule, all electronic transitions must adhere to the spin selection rule, which dictates that allowed transitions between electronic states must conserve electron spin (ΔS = 0). Any electronic transitions involving a change in spin multiplicity are forbidden. For instance, in an octahedral half-filled d
5 high spin complex, transitioning from t
2g orbitals to e
g, is prohibited due to the change in spin multiplicity (resulting in a non-zero ΔS). Consequently, such transitions do not contribute to determining the intensity of the absorbed color [
3,
21].
2.2. Charge Transfer
Similarly, color can arise from the charge transfer within the orbitals of the metal center and ligands rather than solely within the d-orbitals of the metal. This electronic transfer can be from the metal to the ligand (MLCT) (
Figure 10), the ligand to the metal (LMCT), or between metals of different oxidation states called intervalence charge transfer (IVCT) [
8,
39,
40]. LMCT transitions reduce the metal center while MLCT causes its oxidation. For example, the purple color of the permanganate ion (MnO
4−) is due to charge transfer originating from the filled oxygen p-orbitals to empty orbitals from manganese (VII), making it an instance of LMCT [
7]. Also, in Prussian blue, (Fe
4[Fe(CN)
6]
3), the presence of alternating Fe
2+ and Fe
3+ ions participate in IVCT [
8].
This color is theoretically more favorable than those occurring in the d-orbitals of a single metallic center [
21]. Unlike d-orbital transitions, charge transfer transitions are allowed under the Laporte selection, rendering these transitions inherently higher energy with absorption wavelengths mainly in the UV range, yet they may extend into the visible range [
3]. Additionally, charge transfer transitions exhibit greater orbital overlap between the metal's orbitals and the ligand’s orbitals, amplifying the strength of the transitions [
21]. The covalent nature of charge transfer transitions, indicative of bonding between the metal and ligands, results in enhanced orbital mixing compared to the ionic bonding observed in d-orbital transitions, further contributing to their increased intensity [
3,
21,
34]. Though this phenomenon can occur concurrently with d-orbital transitions to produce the overall reflected color of the complex, charge transfer does not require any of the d-orbitals to be filled at all [
41]. Charge transfer complexes are instead influenced by how the ligands and metal interact, in terms of their electric fields, geometries, and quantities.
2.3. The Influence of Ligand Fields
When ligands bind to the metal center, they create an electric field around the metal ion, deemed the ligand field, which arises from the distribution of electron density in the metal-ligand bonds [
6,
42]. The strength of the ligand field, influenced by the ligands' nature (strong-field or weak-field) [
17], determines the intensity of the metal’s d-orbital splitting and/or degree of charge transfer [
20,
43,
44]. The energy differences between the molecular orbitals of the ligands and the valence d-orbitals of the metallic center suggest the relative magnitude of the highest occupied and lowest unoccupied molecular or d-orbital [
16]. Such magnitudes of energy may lie in the visible light range, with wavelengths complementary to the color reflected, therefore ligand fluctuation manifests in color changes.
The spectrochemical series ranks ligands based on a qualitative measure of ligand strength, which subsequently affects electronic transitions and the observed colors in transition metal complexes [
16,
17,
20,
42]. Ligands are arranged in order from those causing the weakest d-orbital splitting to those inducing larger splitting. Strong-field ligands lead to pronounced energetic splitting in the central metal ion, resulting in the absorption of higher-energy violet or blue light. Conversely, complexes with weak-field ligands typically absorb lower-energy wavelengths, such as yellow, orange, or red light [
17].
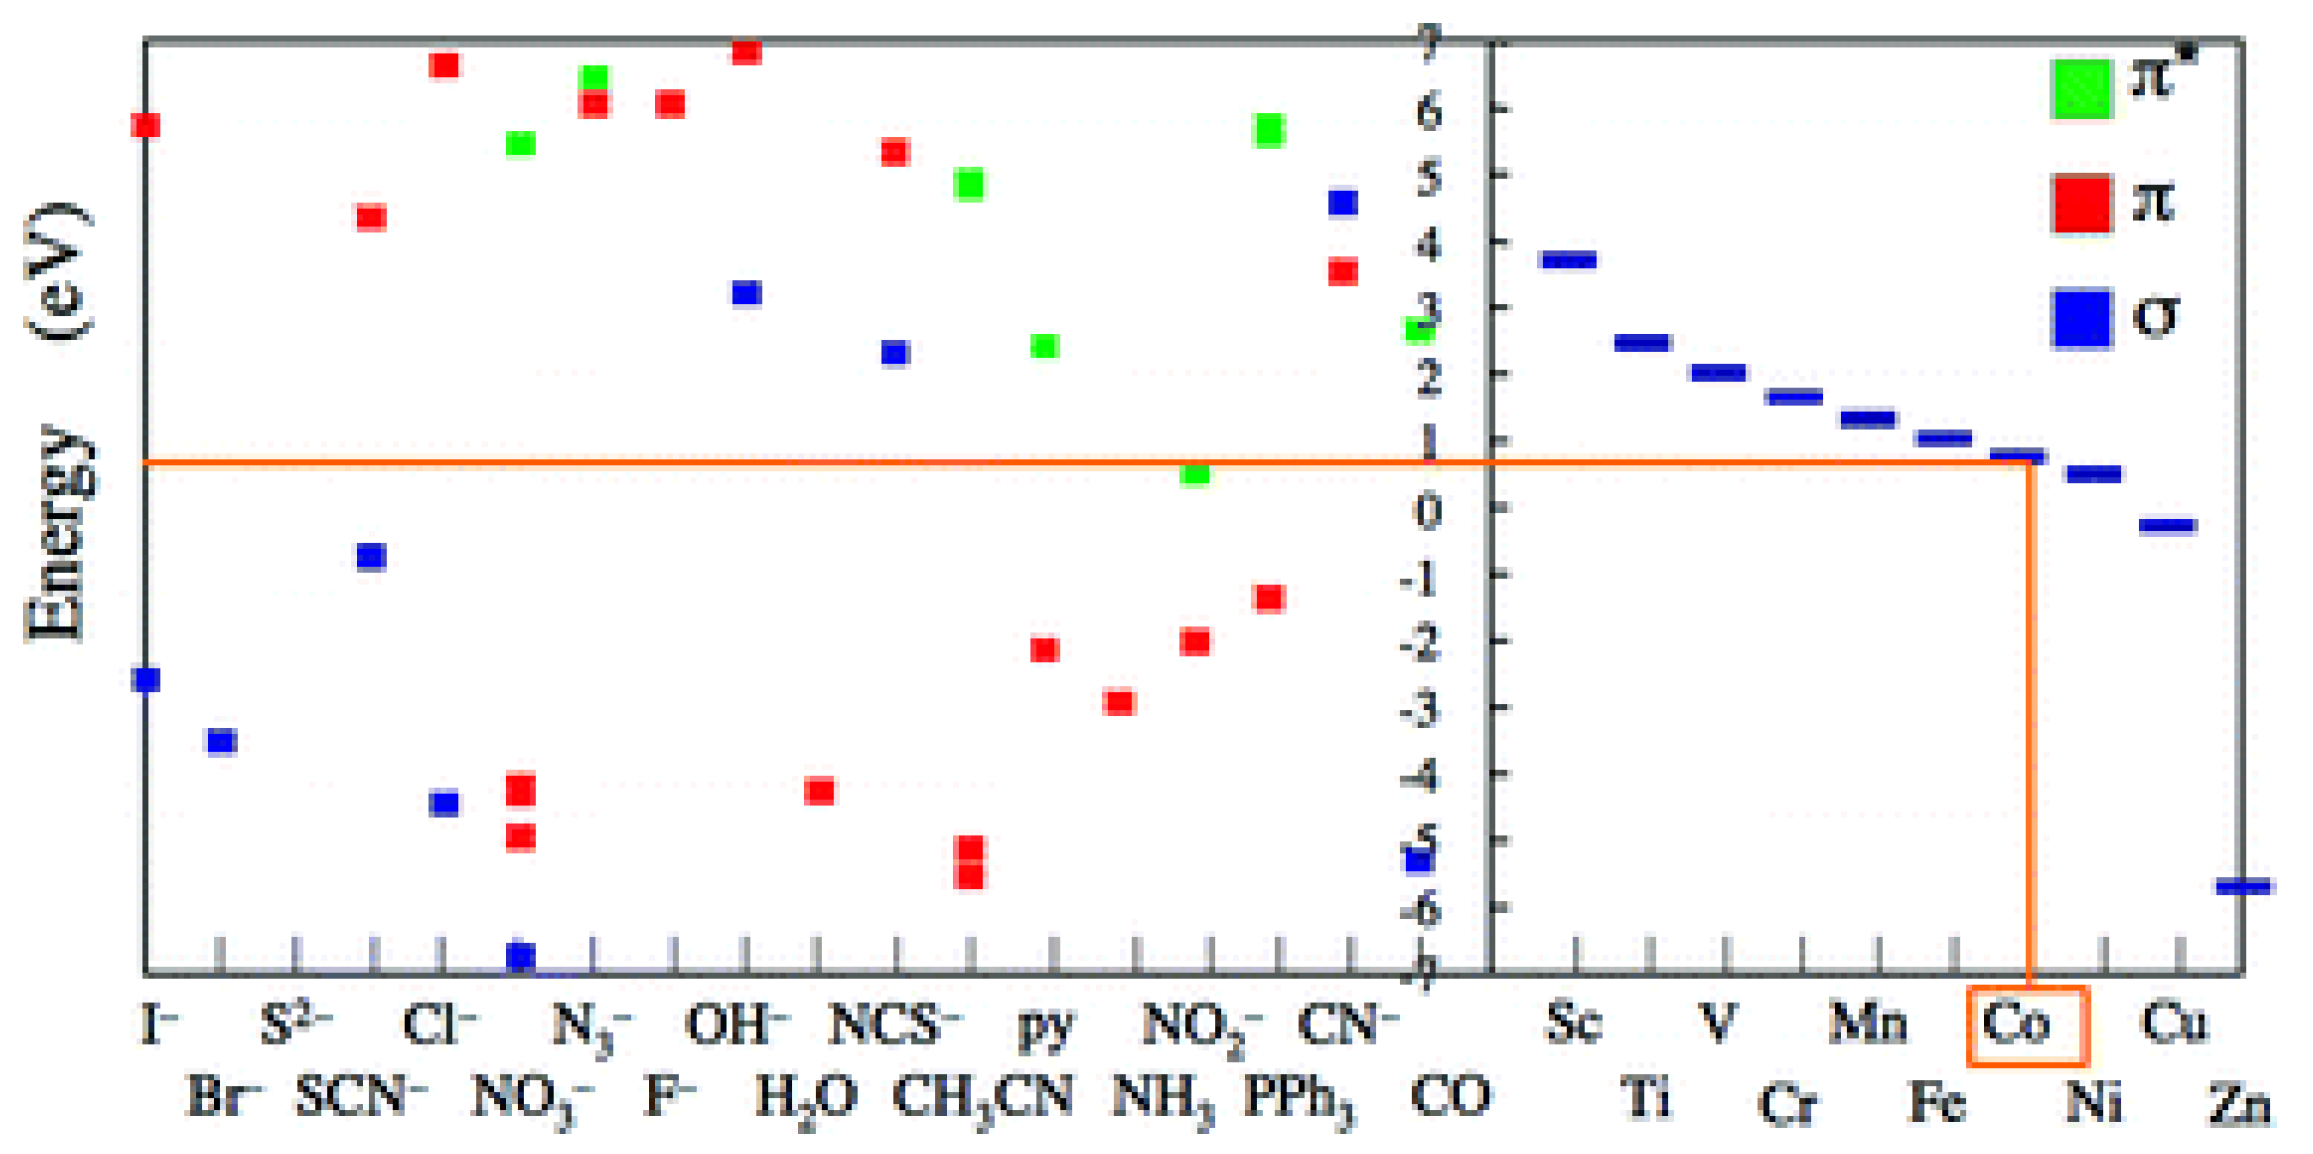
However, defining a single series to describe ligands across multiple metal complexes and environments is nuanced, considering various factors influencing the degree of orbital splitting in metallic centers beyond the ligand's identity alone. Ishii and Tsuboi [
16] have sought to address these discrepancies by proposing an adjusted spectrochemical series using advanced computational methods, accounting for different metallic centers and environments. This revised series aims to provide a more comprehensive understanding of ligand field effects (
Figure 11) [
16].
In terms of charge transfer, a ligand’s proclivity to either donate or accept π electrons is a key factor in determining whether the metal and the ligands would participate in LMCT or MLCT [
45]. The spectrochemical series goes in order of π donors (i.e halides) to acceptors (i.e CO, CN
-) [
16]. LMCT is observed more with π donor ligands while MLCT tends to occur with π acceptor ligands [
45]. Therefore, the spectrochemical series is useful when discerning between these modes of charge transfer.
The interplay between ligand field theory and coordination complexes manifests in captivating ways, as demonstrated by various studies illustrating how ligand alterations dynamically shape the colors and optical characteristics of coordination complexes across diverse chemical systems. A 2021 study by Hills-Kimball et al. revealed that carboxylic acid byproducts, generated from the autoxidation process of linseed oil, interact with Cu
2+ ions in the georgite pigment's complex structure, resulting in a shift in the reflected wavelengths from blue to green. This color shift occurs because "carboxylated copper complexes may slightly alter the d-d absorption band due to different metal–ligand interactions" [
13]. This phenomenon highlights the profound effect that changes in ligand identities and geometries have on the energetic properties of metal d-orbitals
Substitutions of the metallic center can also result in the alteration of the reflected color. In the 2022 paper by Goga et. al, the color of the Co
(1-x)Ni
xCr
2O
4 pigments changed from blue to greenish-blue as the concentration of Ni
2+ ions (x) increased in the CoCr
2O
4 spinel oxide matrix [
46]. This color change is attributed to the substitution of Ni
2+ ions for Co
2+ ions in the spinel structure, altering the metallic centers coordinated to O
2- in the matrix. As the concentration of Ni
2+ increased, there was a corresponding rise in the intensity and occurrence of charge transfer bands "assigned to a charge transfer of Ni
2+ cation" and "due to the d-d transition of Ni
2+ ions in the tetrahedral coordinated O
2− environment" [
46]. This is because Ni
2+ ions have a smaller radius than Co
2+ ions and disrupt the spinel structure, altering the crystal field splitting energies and thus the energies of electronic transitions. The changing intensities of absorption bands with increasing Ni
2+ concentration correlate to the observed systematic shift towards greener pigments. Adjusting the nickel content enabled control over the color of the pigment, demonstrating the profound influence of ligand field theory on the optical properties and color variations of coordination complexes in diverse systems [
46].
Ligand geometry can significantly impact the color of complexation [
47,
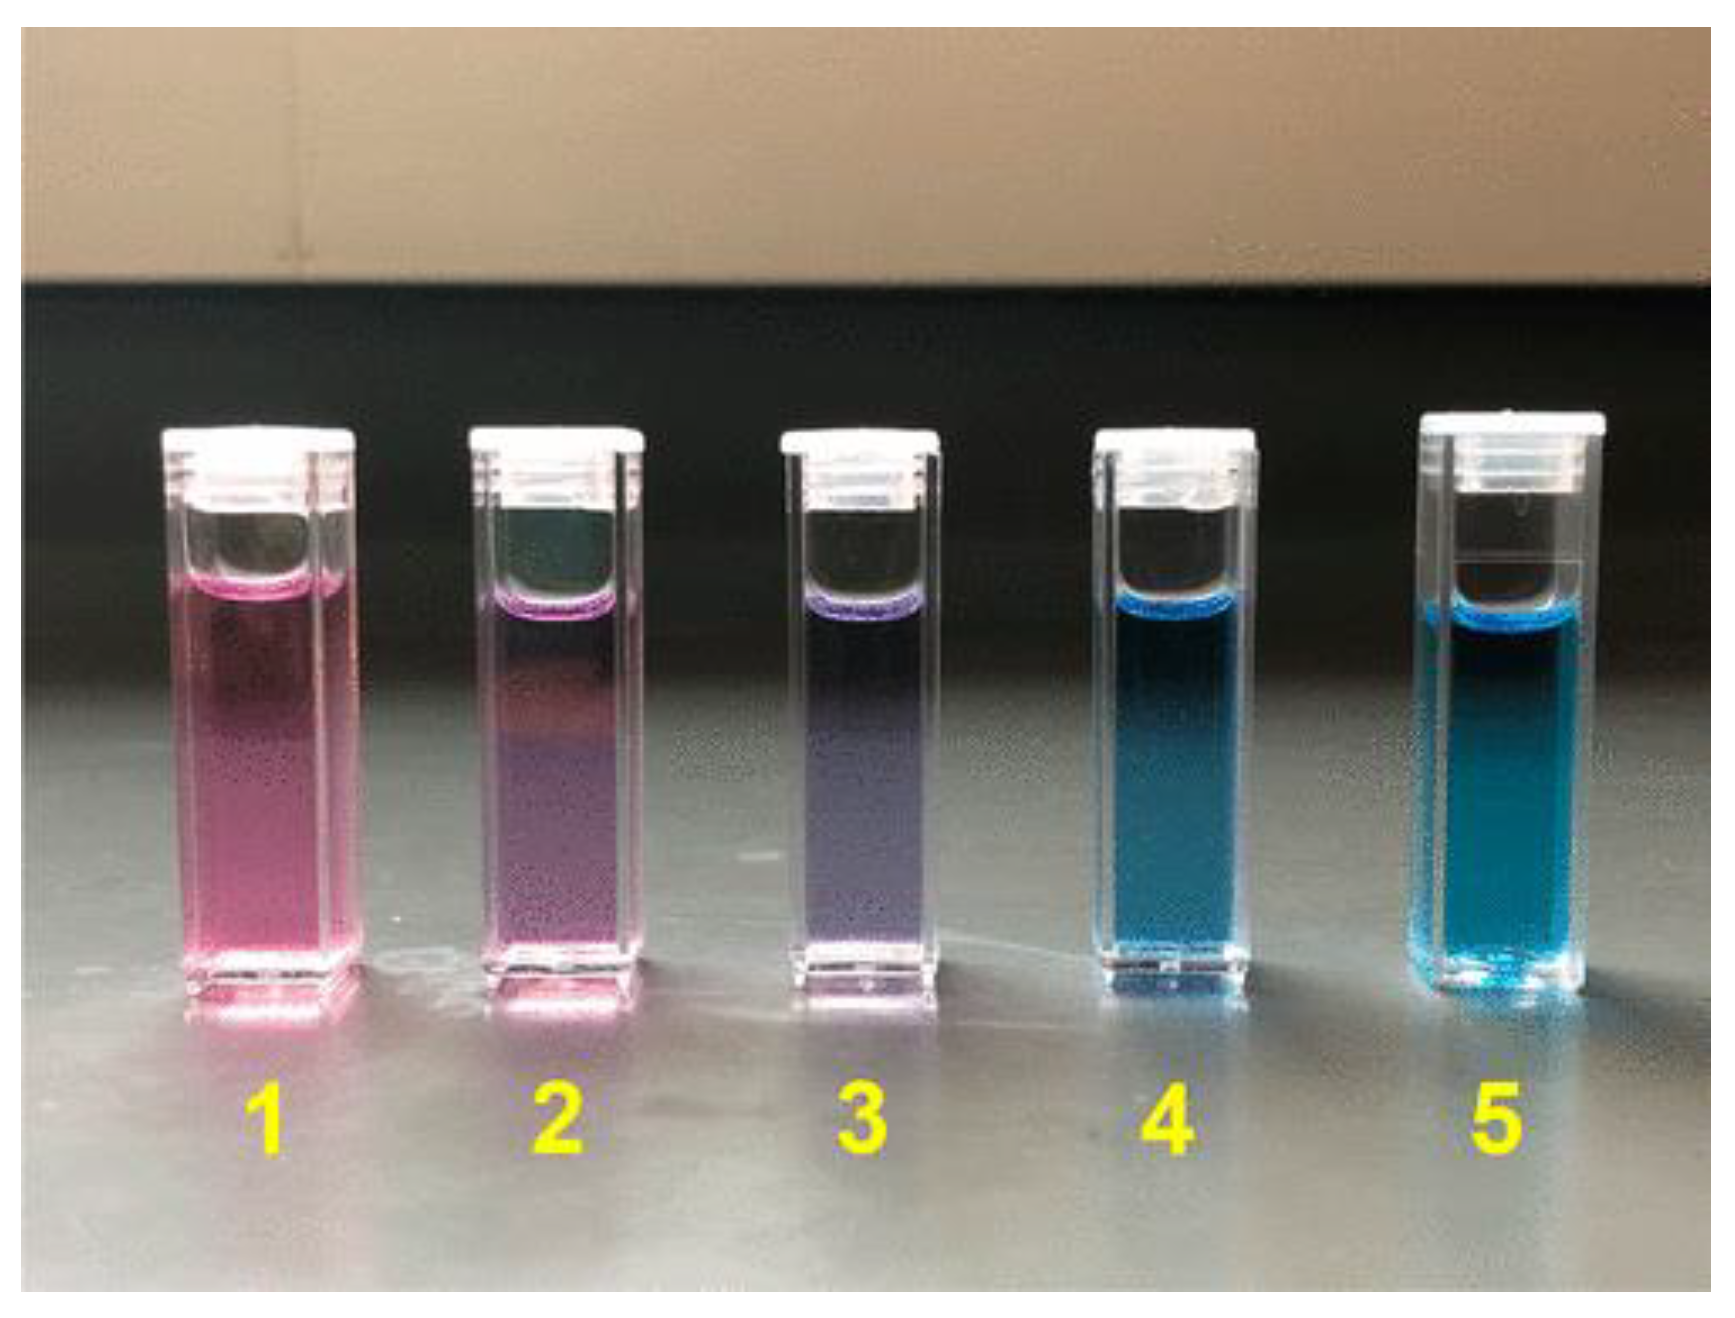
48]. In a study conducted by Ren et al., alcohol of varying concentrations was employed to observe differences in Co
2+ ions coordinated in octahedral (pink) or tetrahedral (blue) environments [
9].
Figure 12 illustrates the solutions in descending order of alcohol-based octahedral Co complex concentration (pink). The chemical equilibrium shifts towards producing more tetrahedral Co complex (blue) with increasing propanol concentration, acting as ligands [
9]. As discussed in section 2.1, different ligand geometries coincide with varying bonding and nonbonding orbital interactions, thereby altering the energetic properties of molecular orbitals, including the d-orbital splitting of the metallic center. This study underscores how ligands can influence the geometry (or coordination number) of transition metal complexes, resulting in variations in orbital energies and, consequently, color.
Beyond the influence of ligands and central transition metals, the surrounding environment of transition metal complexes, such as alkaline earth counter ions (e.g., Ca
2+, Ba
2+) in the crystal lattice, appears to influence the color or energy splitting. For instance, the copper silicate pigments Egyptian Blue (CaCuSi
4O
10) and Han Blue (BaCuSi
4O
10) share isomorphous structures, differing only in the exchange of the alkaline earth metal ion (Ca
2+ and Ba
2+ as counter ions, respectively) [
49]. Both feature layered structures wherein (SiO)
4 silicate squares form the framework, and they utilize the same CuO
46- chromophore as their coloring agent. The subtle variation in tonality between the two pigments can be traced back to the slight difference in the Cu−O distance. Experimentally, there is a 0.36% reduction in the Cu−O distance observed from CaCuSi
4O
10 (R = 1.929 Å) to BaCuSi
4O
10 (R = 1.921 Å) [
2], which aligns with Density Functional Theory (DFT) calculations predicting a 359 cm
−1 increase in E(z
2) when the Cu−O distance shifts from 1.929 to 1.921 Å. Consequently, the presence of different counter ions (Ba
2+ vs. Ca
2+) within the layered structures results in slightly different surrounding environments for the transition metal complexes, leading to minor alterations in the Cu-O bond length and the observed differences in tonalities between Egyptian Blue and Han Blue [
2,
49,
50].
3. The Impact of Processing Conditions on Complex Coloration
The creation of art objects typically involves multiple stages, each influenced by a unique set of external factors that collectively shape the final appearance. The optical properties of transition metal complexes are particularly sensitive to these factors, leading to variability in their appearance. As a result, artists often refine their techniques through trial and error [
51]. For artists seeking greater control over their artwork's final appearance, incorporating these transition metal complexes while comprehending the effects of various controllable processing conditions can be immensely beneficial. Adopting a bottom-up approach to understand how processing conditions impact the color of transition metal complexes is essential for rational design and improved control of materials or artistic creations.
3.1. Temperature
Temperature plays a crucial role in influencing the coloration of final products involving transition metal complexes as coloring agents. The creation of ceramic art pieces with colored glaze coatings involves exposing the pieces to a range of temperatures that often exceed 1150 °C [
19,
52]. At high temperatures, significant structural changes occur in ceramic glazes which can interact with colorants, causing a change in appearance during the firing process. Examining the entire firing process is essential for exploring the interactions between colorants and glazes at intermediate stages [
19].
A study by Peng. et al investigated the impact of temperature on the hue of ceramic glazes with transition metal pigments throughout the entire firing process [
19]. The laboratory experiment was designed to understand the underlying mechanism of color change as a function of the temperature using a bottom-up approach, complementary to the previous top-down approach focusing on historical objects or artifacts [
1]. This sheds light on intermediate colorant-glaze interactions that are beneficial for understanding and predicting glaze coloring upon exposure to varying temperatures, and the results from this study can be applied to better-controlled glaze production for artists and a deeper appreciation of ceramic glaze chemistry and aesthetics.
The study utilized two common colorants: black copper (II) oxide (CuO) and blue-green basic copper carbonate (malachite, Cu
2CO
3(OH)
2) as initial colorant materials. The experimental procedure involved integrating these colorants into other raw glaze materials, which were subsequently applied to a bisque disk to create four distinct glaze variants: one containing 1% CuO, another containing 1% malachite, a third combining 1% CuO and 1% SiC, and a control mixture devoid of any colorant. Initial observations at 550 °C revealed a darkening of the malachite-infused glaze, attributed to the decomposition of malachite, Cu
2CO
3(OH)
2, into CuO. By the time the temperature reached 850 °C, a sintering phase of the glazes was evident, resulting in a light blue hue. This transformation occurred below the glaze's melting point, suggesting that complete vitrification is not necessary to achieve color in the glaze [
19].
Following the elevation of temperature beyond 850 °C, the malachite, Cu
2CO
3(OH)
2 and CuO exhibited a uniform light blue coloration. Upon exceeding 1000 °C on the bisque disk, the glaze without colorant turned transparent and colorless. Both the 1% malachite and 1% CuO glazes shared a transparent, light blue appearance [
19] (
Figure 13). It was concluded that the colors of copper-containing glazes are not due to the colorant in the physical mixture of the raw glaze but rather to a change in overall glaze structure and transition metal complexation as the firing temperature approaches and exceeds 850 °C. The increase in temperature and resulting vitrification of the glaze prompt the coordination of the silica-alumina matrix to the metallic center of the colorant, adopting modified geometries and therefore reflecting altered colors (
Figure 13). Other than the color transformations visible with the naked eye, the authors utilized various analytical techniques (which will be discussed in
Section 4, Methods of Investigation) at the microscopic scale to make this conclusion [
19].
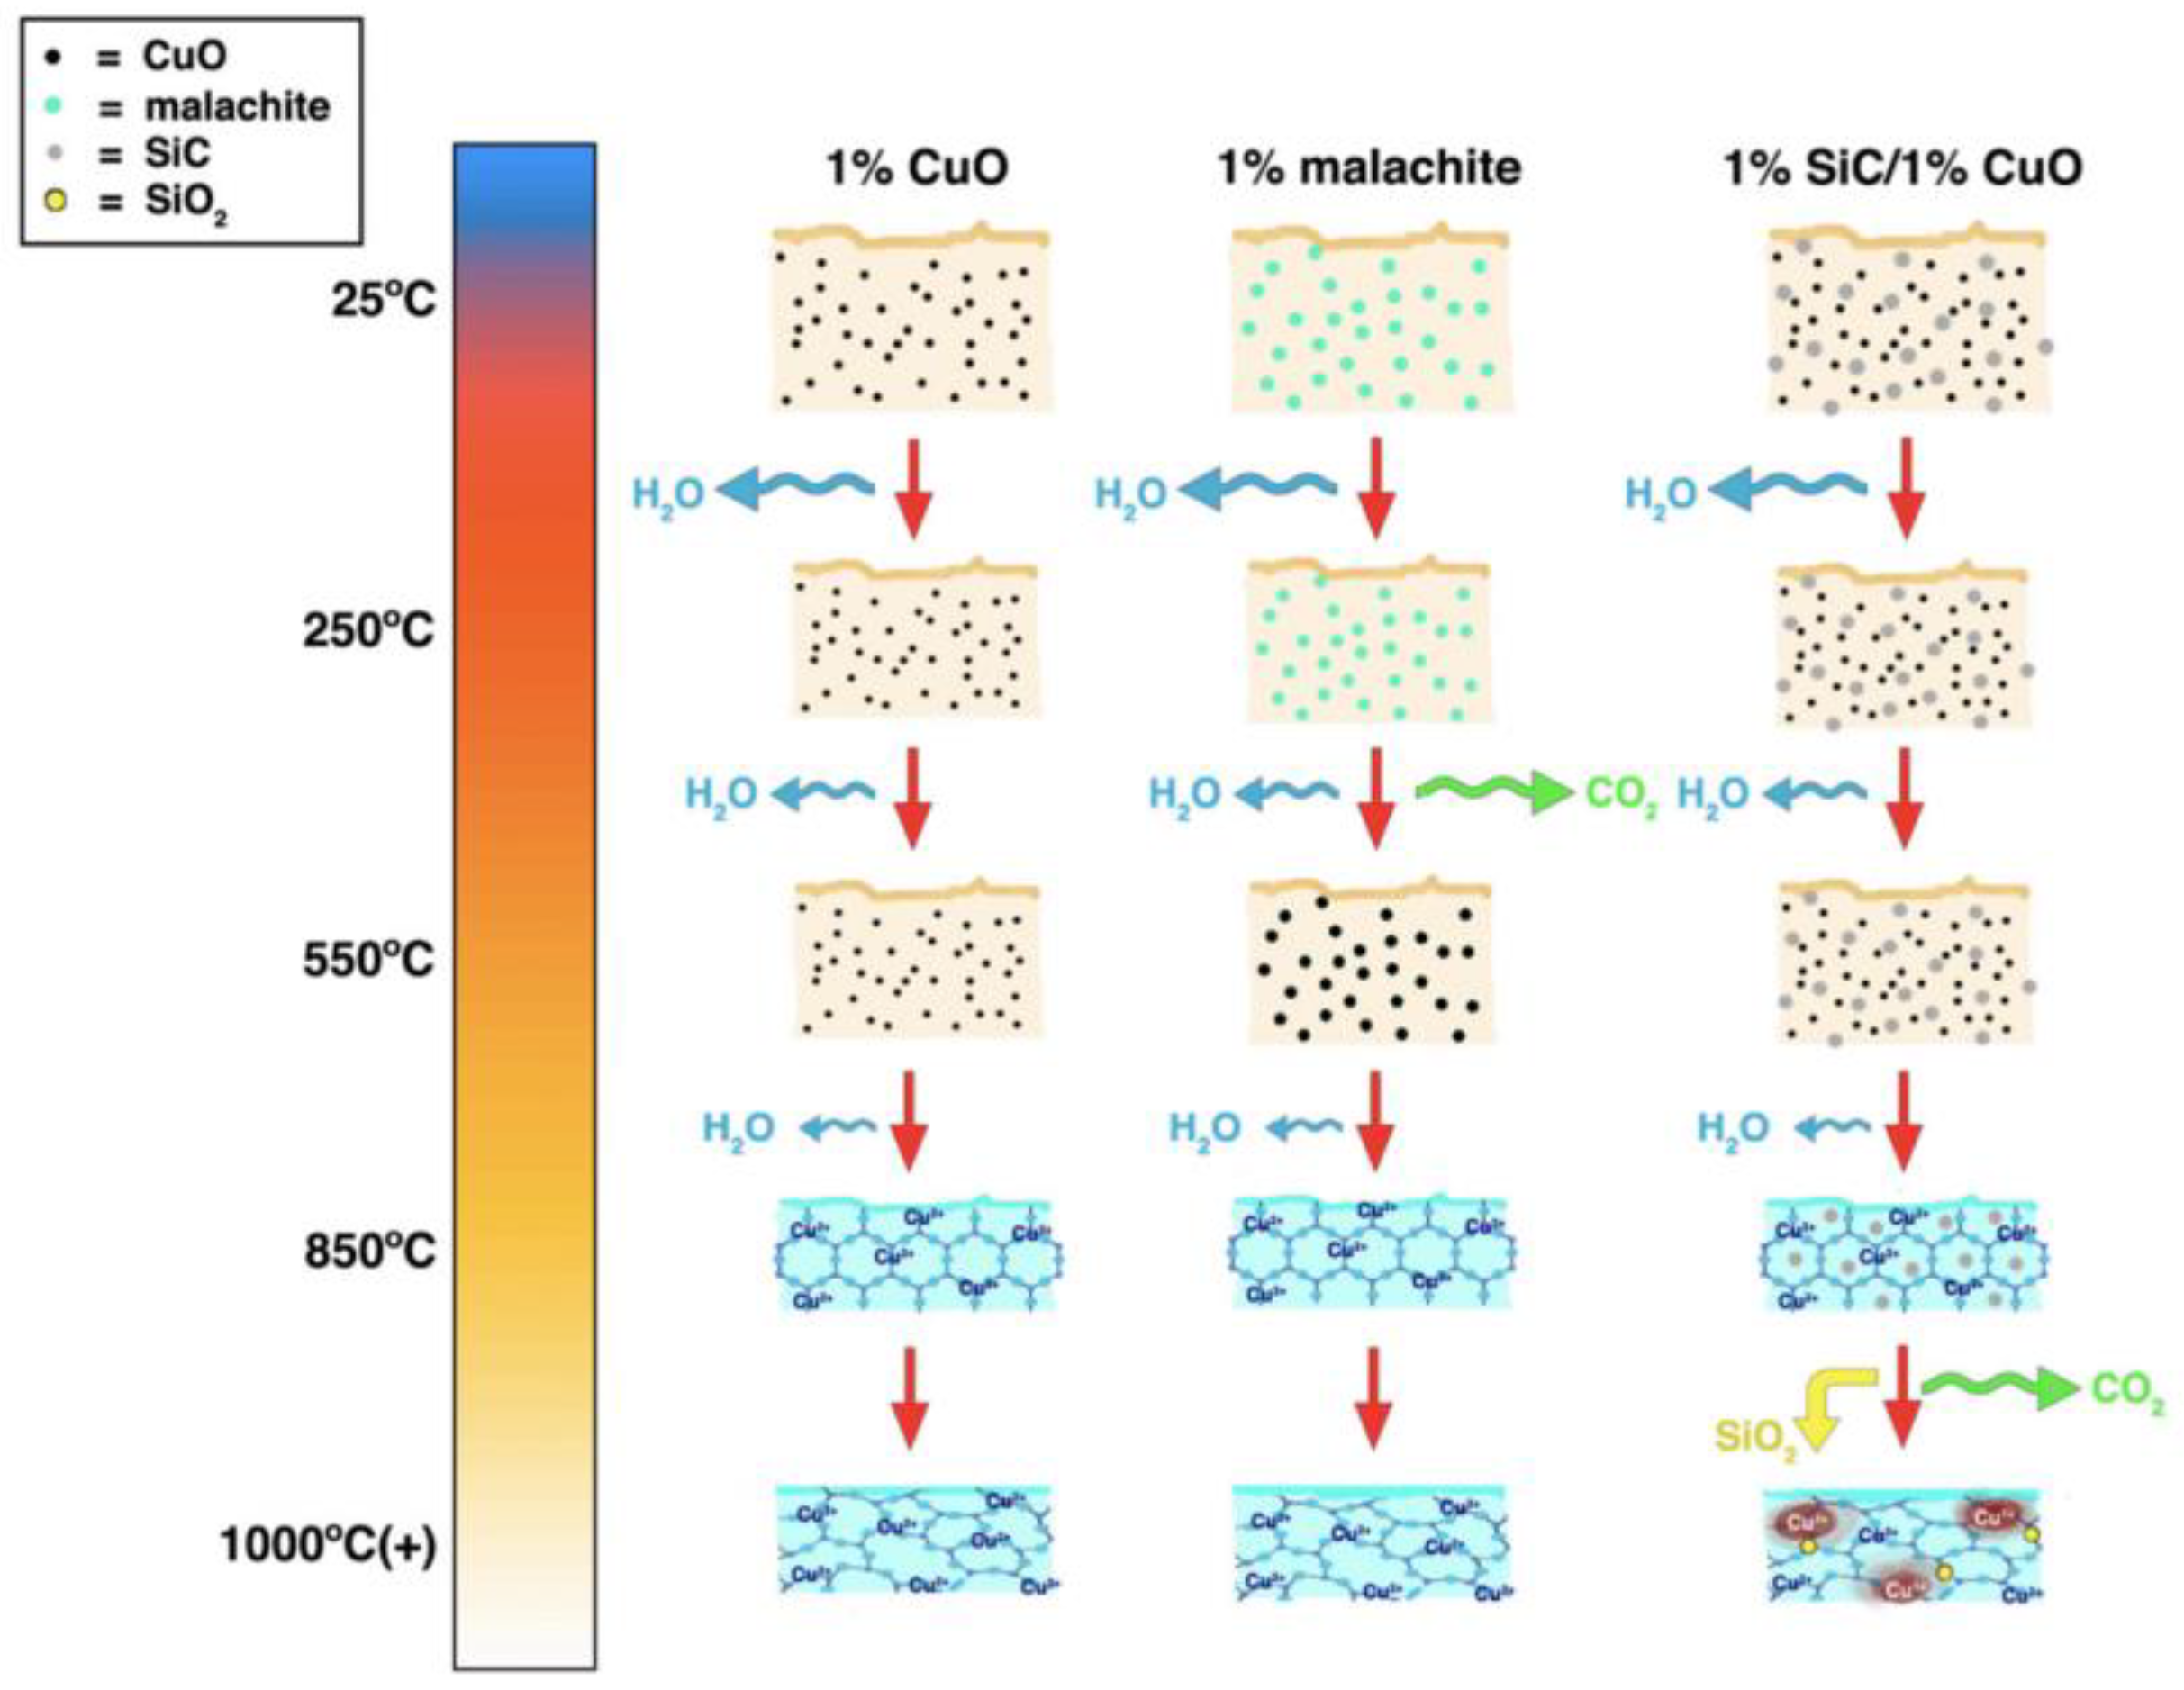
Proposed mechanisms and timelines of the firing process for the "Robin's egg blue" glaze variations, based on spectroscopy measurements, are illustrated in
Figure 14 [
19]. At room temperature, CuO and malachite, represented by black and turquoise dots respectively, exist as a physical mixture with other raw glaze materials (tan). As the kiln temperature rises, free water particles and lattice-bound water evaporate, as depicted by the blue arrows. For the 1% malachite glaze, by 550 °C, malachite (turquoise dots) decomposes to CuO (black dots), producing CO
2 as a byproduct (green arrow). By 850 °C, the presence of color due to Cu
2+ coordination suggests the presence of a silica-alumina matrix (represented by the regularly ordered lattice structure), which becomes more disordered as the glaze transforms into glass while maintaining the same local structure with the same coordination around the Cu
2+ center ions. In the case of the 1% SiC/1% CuO glaze, SiC (gray dots) remains unreacted until temperatures exceed 1000 °C, when it reacts with CO
2 to reduce Cu
2+ to Cu+, generating SiO
2 as a byproduct (yellow dots). This study [
19] underscores the significance of employing a bottom-up approach to investigate the molecular mechanisms underlying coloring in ceramics or other pigment production.
3.2. Redox Environment
In addition to temperature throughout the firing process, the end color of the glaze is also affected by firing conditions and may vary based on whether the firing is performed in an oxidative or reductive kiln. Kiln firings in environments with abundant oxygen concentrations promote oxidative conditions, whereas environments with limited oxygen availability facilitate reductive conditions [
53,
54]. Copper-based transition metal oxides are commonly used as colorants in ceramic glazes because of their ability to produce a wide range of colors depending on the redox environment [
4,
53,
54,
55,
56]. More precisely, copper-based colorants usually exhibit blue and green colors during oxidative firing conditions. Conversely, under reductive firing conditions, they induce red tones through Cu
1+O
2 and/or Cu
0 nanostructures [
19,
57,
58,
59].
This dichotomy was explored in the same study discussed previously by Peng et al. [
19]. On top of exploring the effect of temperature as discussed in section 3.1, the study also aimed to investigate the effect of the redox environment on copper colorants in ceramic glazes. To do this, the authors intentionally added silicon carbide (SiC) to a glaze with CuO to create copper reds in an oxidizing atmosphere instead of the normal reduction kiln [
19,
53]. After being applied to a bisque and fired at 1000 °C, the glaze turned to a light greenish-blue and appeared to include uniformly scattered reddish areas (
Figure 14). The authors hypothesized that the red color in the final glaze, achieved by using SiC as a reducing agent during firing, originated differently compared to the blue color produced under oxidative conditions. Specifically, SiC was used to reduce Cu
2+ to Cu
+1 or Cu
0, and the red color could be from Cu
2O (Cu
+1) or nanostructures [
19,
53,
59,
60,
61].
3.3. Raw Materials
The composition and properties of raw materials utilized in the creation of art objects significantly influence the aesthetic characteristics. One of the most notable instances of this is Kaolin clay, a finely granulated white clay commonly used in the production of paints and ceramics, particularly in porcelain. It is primarily composed of the mineral kaolinite [Al
2Si
2O
5(OH)
4], which is favored for its white color and chemically inert properties [
30]. From the beginning of the Yuan through to the Qing Dynasty, kaolin was added to improve the whiteness and quality of porcelain objects. Kaolinite clay, along with the diverse cobalt blue minerals, contributed to the distinctiveness of Chinese porcelain (
Figure 3) [
62]. Small variations in kaolin composition have been observed to affect the whiteness of the bodies it is added to. The main contaminants in commercial kaolin are iron and titanium [
63]. Impurities diminish the whiteness of kaolinite by incorporating within its layered structure, substituting aluminum ions (Al
3+) with iron ions (Fe
3+). This substitution disrupts the crystal field symmetry, affecting the material's optical properties. The enhancement of kaolin's whiteness in industry is achieved through a series of processing steps that include magnetic separation to remove iron impurities and chemical treatment designed to reduce ferric iron (Fe
3+) to a soluble ferrous (Fe
2+) complex, facilitating its removal from the kaolin matrix [
30].
Beyond the ceramic body, impurities can also influence the color of fired glazes. In the blue and white Chinese porcelain depicted in
Figure 3, the blue pigment originates from cobalt blue minerals (Al
2CoO
4), where Co
2+ is bonded to four equivalent O
2- atoms to form CoO
4 tetrahedra that share corners with twelve equivalent AlO
6 octahedra. The cobalt blue mineral (Al
2CoO
4) exhibits its blue color due to the tetrahedral Co
2+ color center, consistent with observations from previous studies [
9] (
Figure 12) discussed in section 3.3. Any contamination in raw materials, whether in Kaolin or cobalt blue minerals, could lead to changes in color, explaining the varying shades of blue found in Chinese blue and white porcelains. In the case of Egyptian Blue minerals, detailed analysis suggests that the presence of contaminants within the reactants, notably sodium chloride (NaCl), iron (Fe), alongside elevated concentrations of zinc (Zn) and calcium (Ca), is associated with the formation of greenish-hued byproducts within the glazes of Egyptian Blue [
64].
4. Methods of Investigation
Accurate characterization of complexation in transition metal complexes can be achieved through a variety of research techniques. These investigative methods play a crucial role in understanding the interactions between metal ions and ligands that govern the dynamic properties of transition metal complexes. This section will particularly delve into two notable studies by Hills-Kimball et al. and Peng et al. [
13,
19], which utilize a bottom-up approach with common techniques for analyzing transition metal complexes as colorants and tracking their fluctuations in response to changes in external conditions. Furthermore, this section will draw upon examples from other studies to underscore the significant role of advanced analytical techniques including using synchrotron radiation as a light source in chemical analysis.
4.1. UV-Vis Spectroscopy
UV-Vis spectroscopy is a widely used investigative technique for analyzing light absorbance of colorants, distinguished by its non-invasive and cost-effective nature in contrast to chromatographic methods. To gather the absorption spectra using UV-Vis spectroscopy, an incident beam of UV or visible light passes through a sample and measures the absorbance of light at different wavelengths [
65]. Molecules absorb specific wavelengths of light due to the energy transitions of their electrons. The absorption spectrum produced provides valuable information about the electronic structure of the molecules in the sample. There are two modes of detection used in UV-visible measurements: absorption, applicable to liquid samples where light can penetrate, and reflection, employed for solid samples where light cannot penetrate. Fiber optic reflectance spectroscopy (FORS), a non-invasive analytical technique capable of identifying certain types of colorants, is necessary for assessing the reflective light from solid pigment samples [
65]. The Reflectance data provide detailed insights into the wavelengths absorbed and reflected, attributed to d-d orbital splitting and charge transfer interactions, facilitating precise analysis of transition metal complexes as they respond to changing external conditions.
In the study by Hills-Kimball et al [
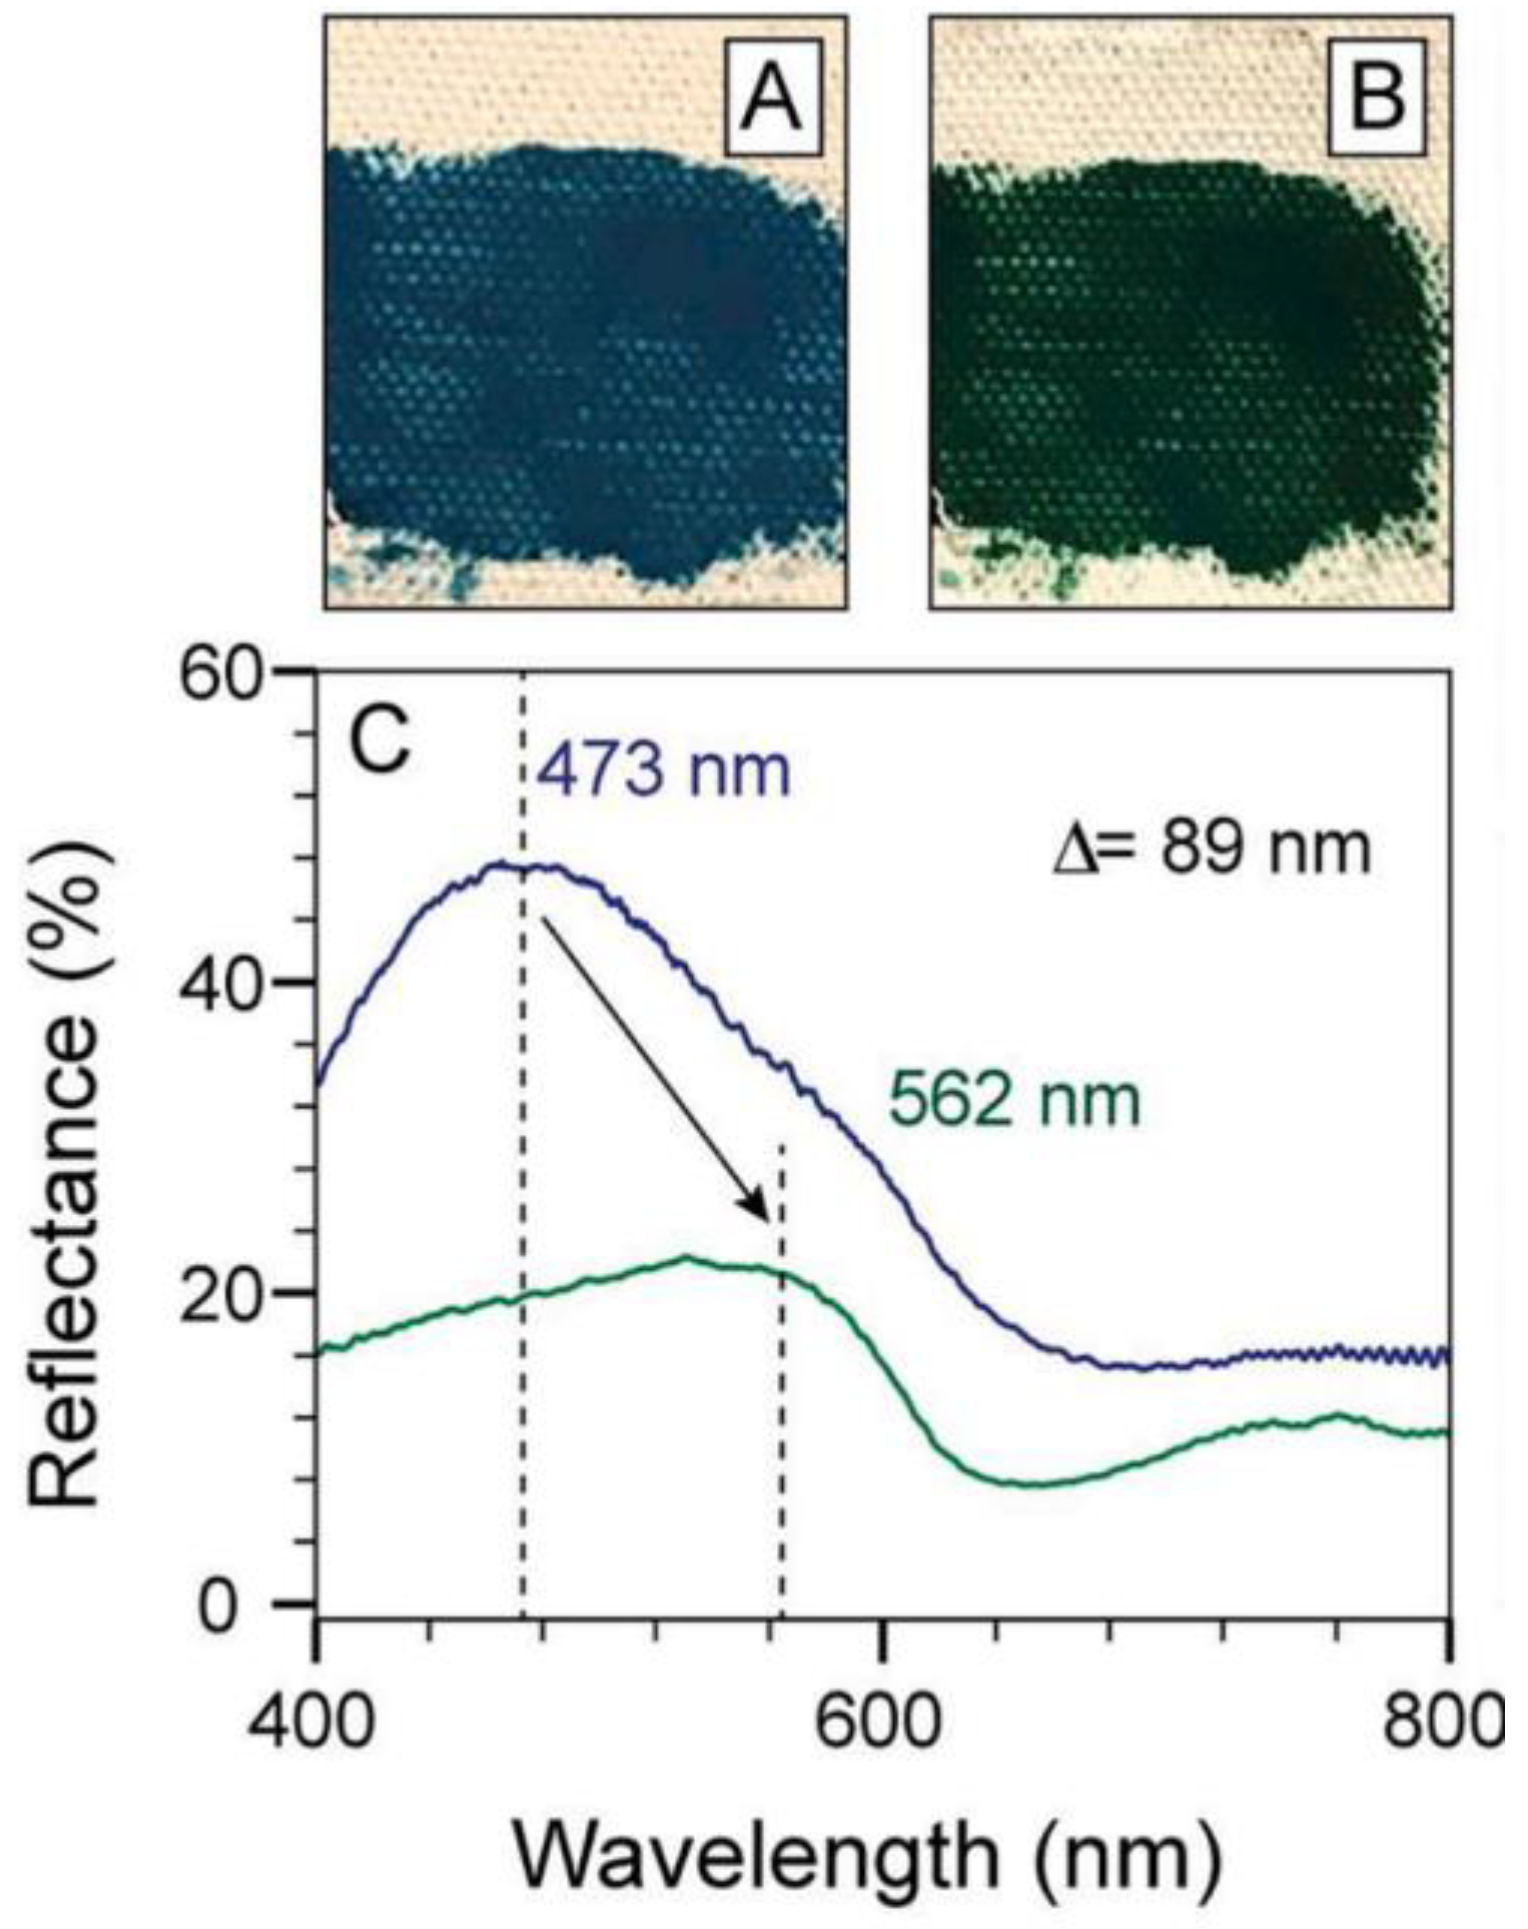
13], UV-Vis Fiber Optic Reflectance Spectroscopy (FORS) was used to quantify the color change of blue georgite pigment in linseed oil over time. Specifically, the reflectance peak of the georgite and linseed oil paint red-shifted 89 nm (from 473 nm to 562 nm) upon paint drying (
Figure 15) [
13]. The advantage of UV-Vis measurements over visual observation is that UV-Vis spectroscopy can distinguish whether the color green arises from changes in complexation or results from physically mixing separate yellow and blue pigments to create green. UV-Vis data ruled out the possibility that the green color observed was due to the mixing of the blue pigment of georgite with "yellowish " linseed oil; rather, it confirmed that the color change was indeed caused by alterations in the complexes. This method of investigation provided accurate reflectance data that showed how chemical interactions affected molecule absorption, setting the stage for a thorough examination of the cause of these absorption changes using additional techniques.
Peng et al. [
19] also utilized the UV-Vis FORS technique on glaze samples which revealed that increased temperatures led to a blue shift in reflectance peaks for 1% CuO and one with 1% CuO and 1% malachite glazes, indicating changes in their optical properties [
19]. Additionally, for a glaze containing 1% CuO + 1% SiC, the method identified dual reflectance peaks on a red spot in the glaze, pointing to the coexistence of red and blue copper centers that occurred from the differing redox environments.
Goga et al. utilized UV-Vis spectroscopy to observe the change in absorption spectra as the concentration of Ni
2+ ions increased in the Co
(1−x)Ni
xCr
2O
4 (x = 0, 0.25, 0.50, 0.75, 1) matrix [
46]. Upon gathering data for 4 solutions of each x value, a distinct trend correlating to Ni
2+ concentration was the broadening and increasing intensity of the band at 350 nm, a relative decrease in absorbance from 747-700 nm, and an increase in visibility of bands at 750-760 nm and 820 nm. The band at 350 nm is associated with charge transfer involving Ni
2+ while the bands at 750-760 nm and 820 nm derive from the energetic transitions among split d-orbitals of Ni
2+ in a tetrahedral complex with O
2- ligands. The appearance of these peaks in the absorption spectra act as identifiers of the Ni
2+ ions coordinated in the spinal matrix while displaying a computational representation of the blue to blue-green color shift [
46].
4.2. X-ray Diffraction Spectroscopy
X-ray diffraction spectroscopy (XRD) is an analytical technique that can be employed to analyze the structure and relative positions of molecules in crystalline materials. This nondestructively measures the diffraction, or the constructive interference, resulting from the interaction of incident x-ray beams with a sample to determine relative electron distance and therefore structure/crystallinity. These constructive interferences occur in a diffraction pattern that contains information about the spacing between planes of atoms [
66]. A sample with an amorphous structure yields a weak or unsubstantial signal, while a crystalline sample exhibits defined peaks in its spectra [
67]. This information can be used to grasp the relationship between a crystalline pigment sample’s color and its structure.
In the same study by Hills-Kimball [
13], XRD was utilized to identify changes in the degree of crystallinity before and after adding a linseed oil binder [
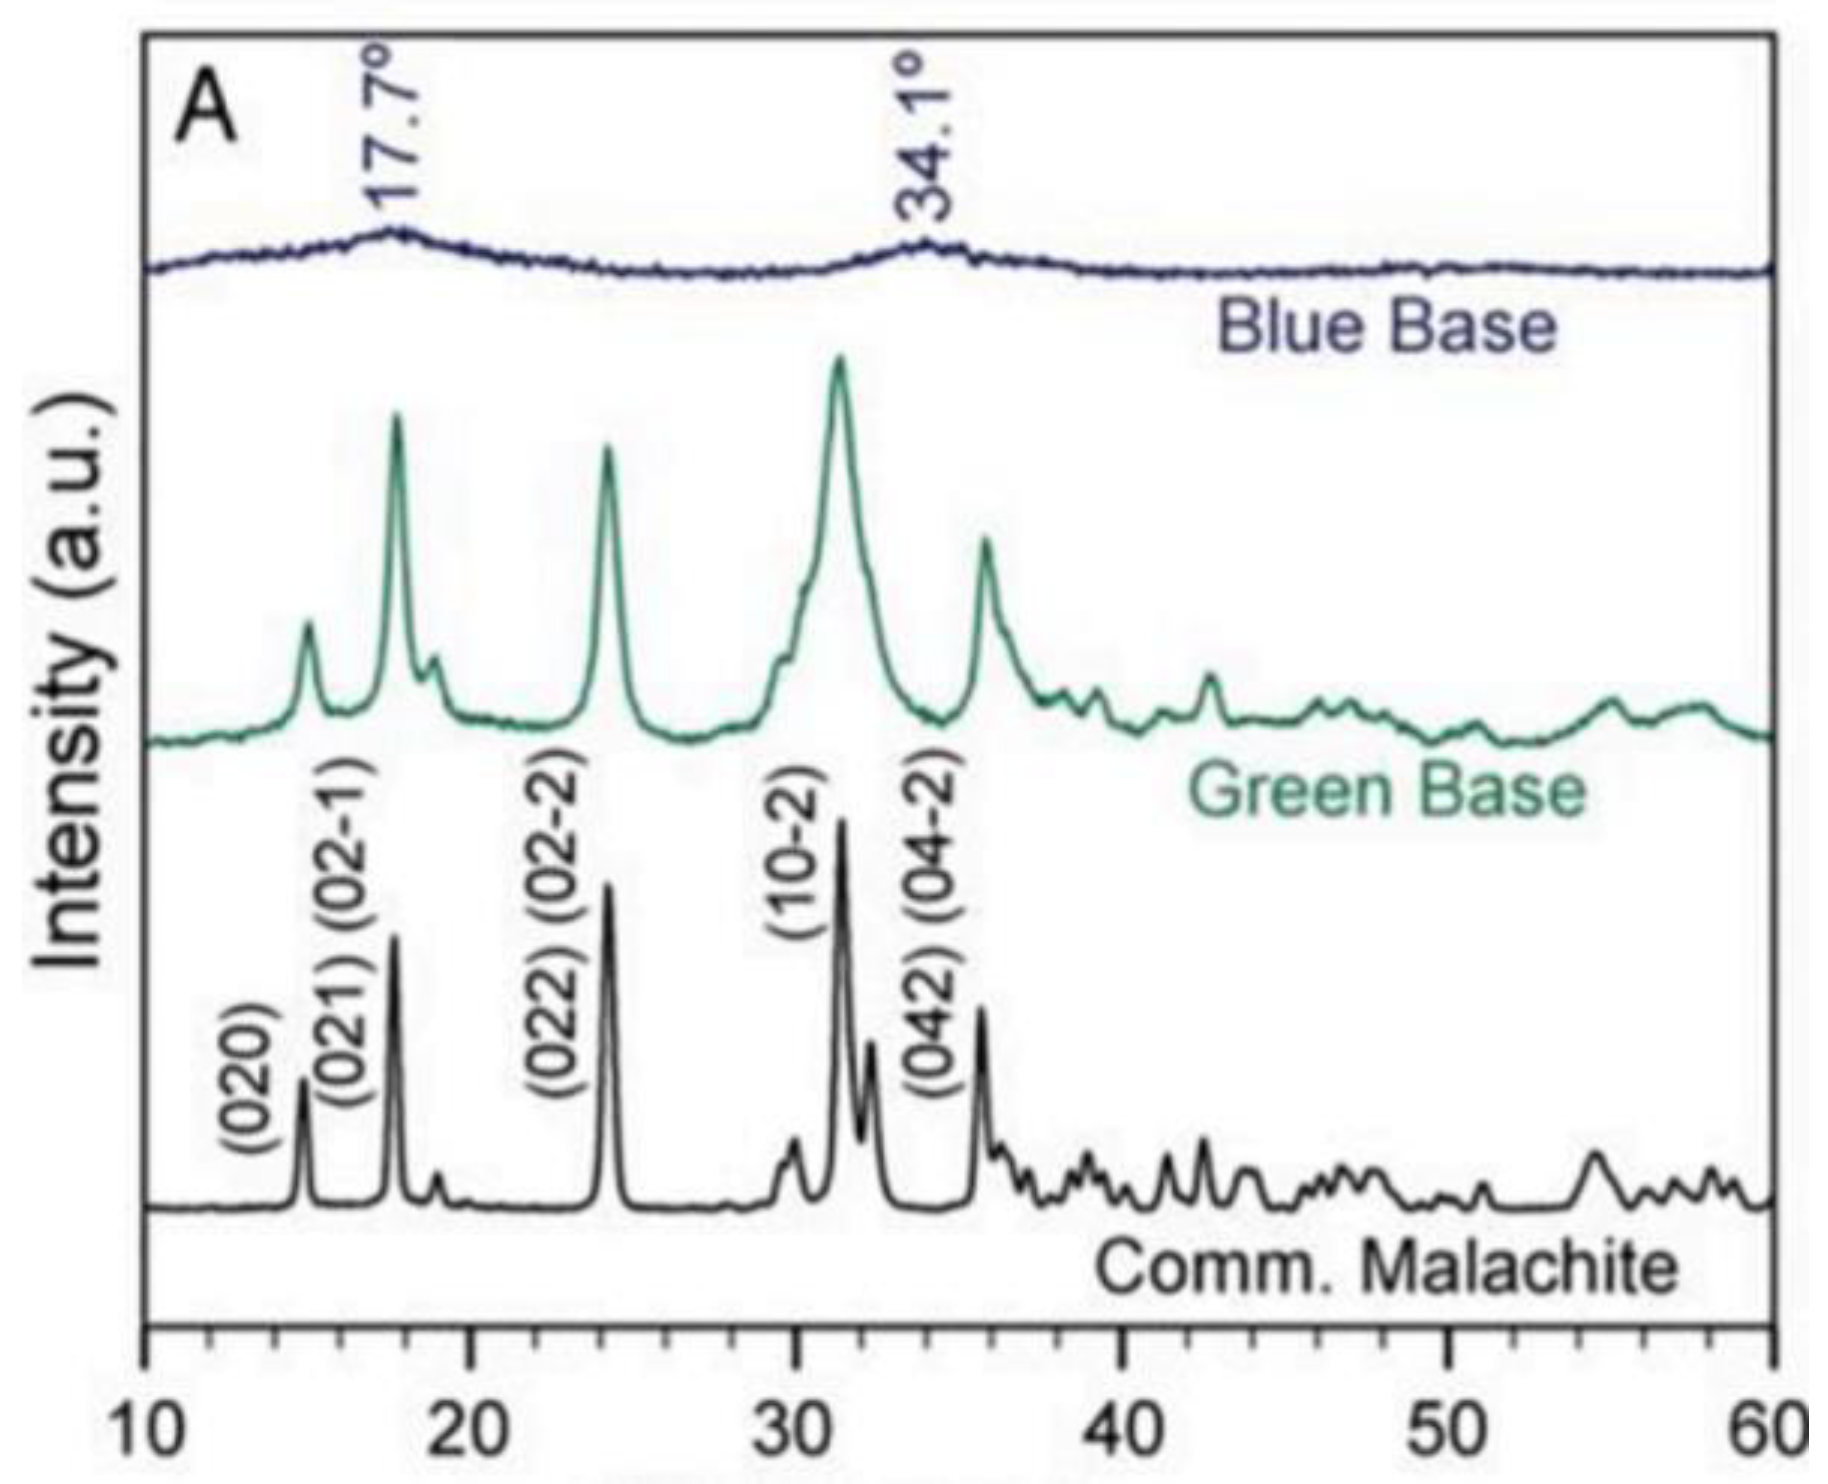
13]. XRD analysis revealed that the synthesized blue pigment (georgite) is amorphous, unlike the crystalline form of malachite (
Figure 16). Additionally, no changes in the degree of crystallinity of the amorphous blue pigment of georgite were observed after mixing it with linseed oil, compared to their original states. Both malachite and georgite-based paints maintained broad peaks typical of linseed oil in their XRD spectra, indicating minimal alteration in their crystalline structure during the curing process. This XRD analysis led to the conclusion that the transition of georgite from blue to green upon drying was not due to the formation of the green-colored crystalline form of malachite. Instead, it suggested that the color changes were likely attributable to chemical interactions at the molecular level, such as the formation of new Cu
2+-carboxylate complexes, rather than changes in the crystal structure of the pigments.
XRD also played a critical role in the study by Peng et al., revealing phase transitions and changes in crystallinity with varying firing temperatures [
19]. As temperatures increased to 850 °C, XRD analysis confirmed the development of a silica-alumina matrix that alters the complexation of the transition metal pigments in the ceramic glaze. This structural reorganization is crucial for the emergence of the blue hue in copper-based glazes.
4.3. Infrared and Raman Spectroscopy
To discover information about the specific chemical nature of translation metal complexes throughout manufacturing processes, Infrared spectroscopy (IR) and Raman spectroscopy serve as common investigative techniques. IR is a method that analyzes molecular vibrations and transmittance. Broader peaks indicate weaker vibrations, suggesting a less organized structure [
68]. Raman spectroscopy measures the energy shift of scattered photons caused by interactions with vibrational modes, whereas IR spectroscopy identifies the absorption of infrared radiation associated with molecular vibrations. Vibrations specific to the structure of certain pigments can be identified and compared to signals of known structural characteristics [
68].
Hills-Kimball et al. [
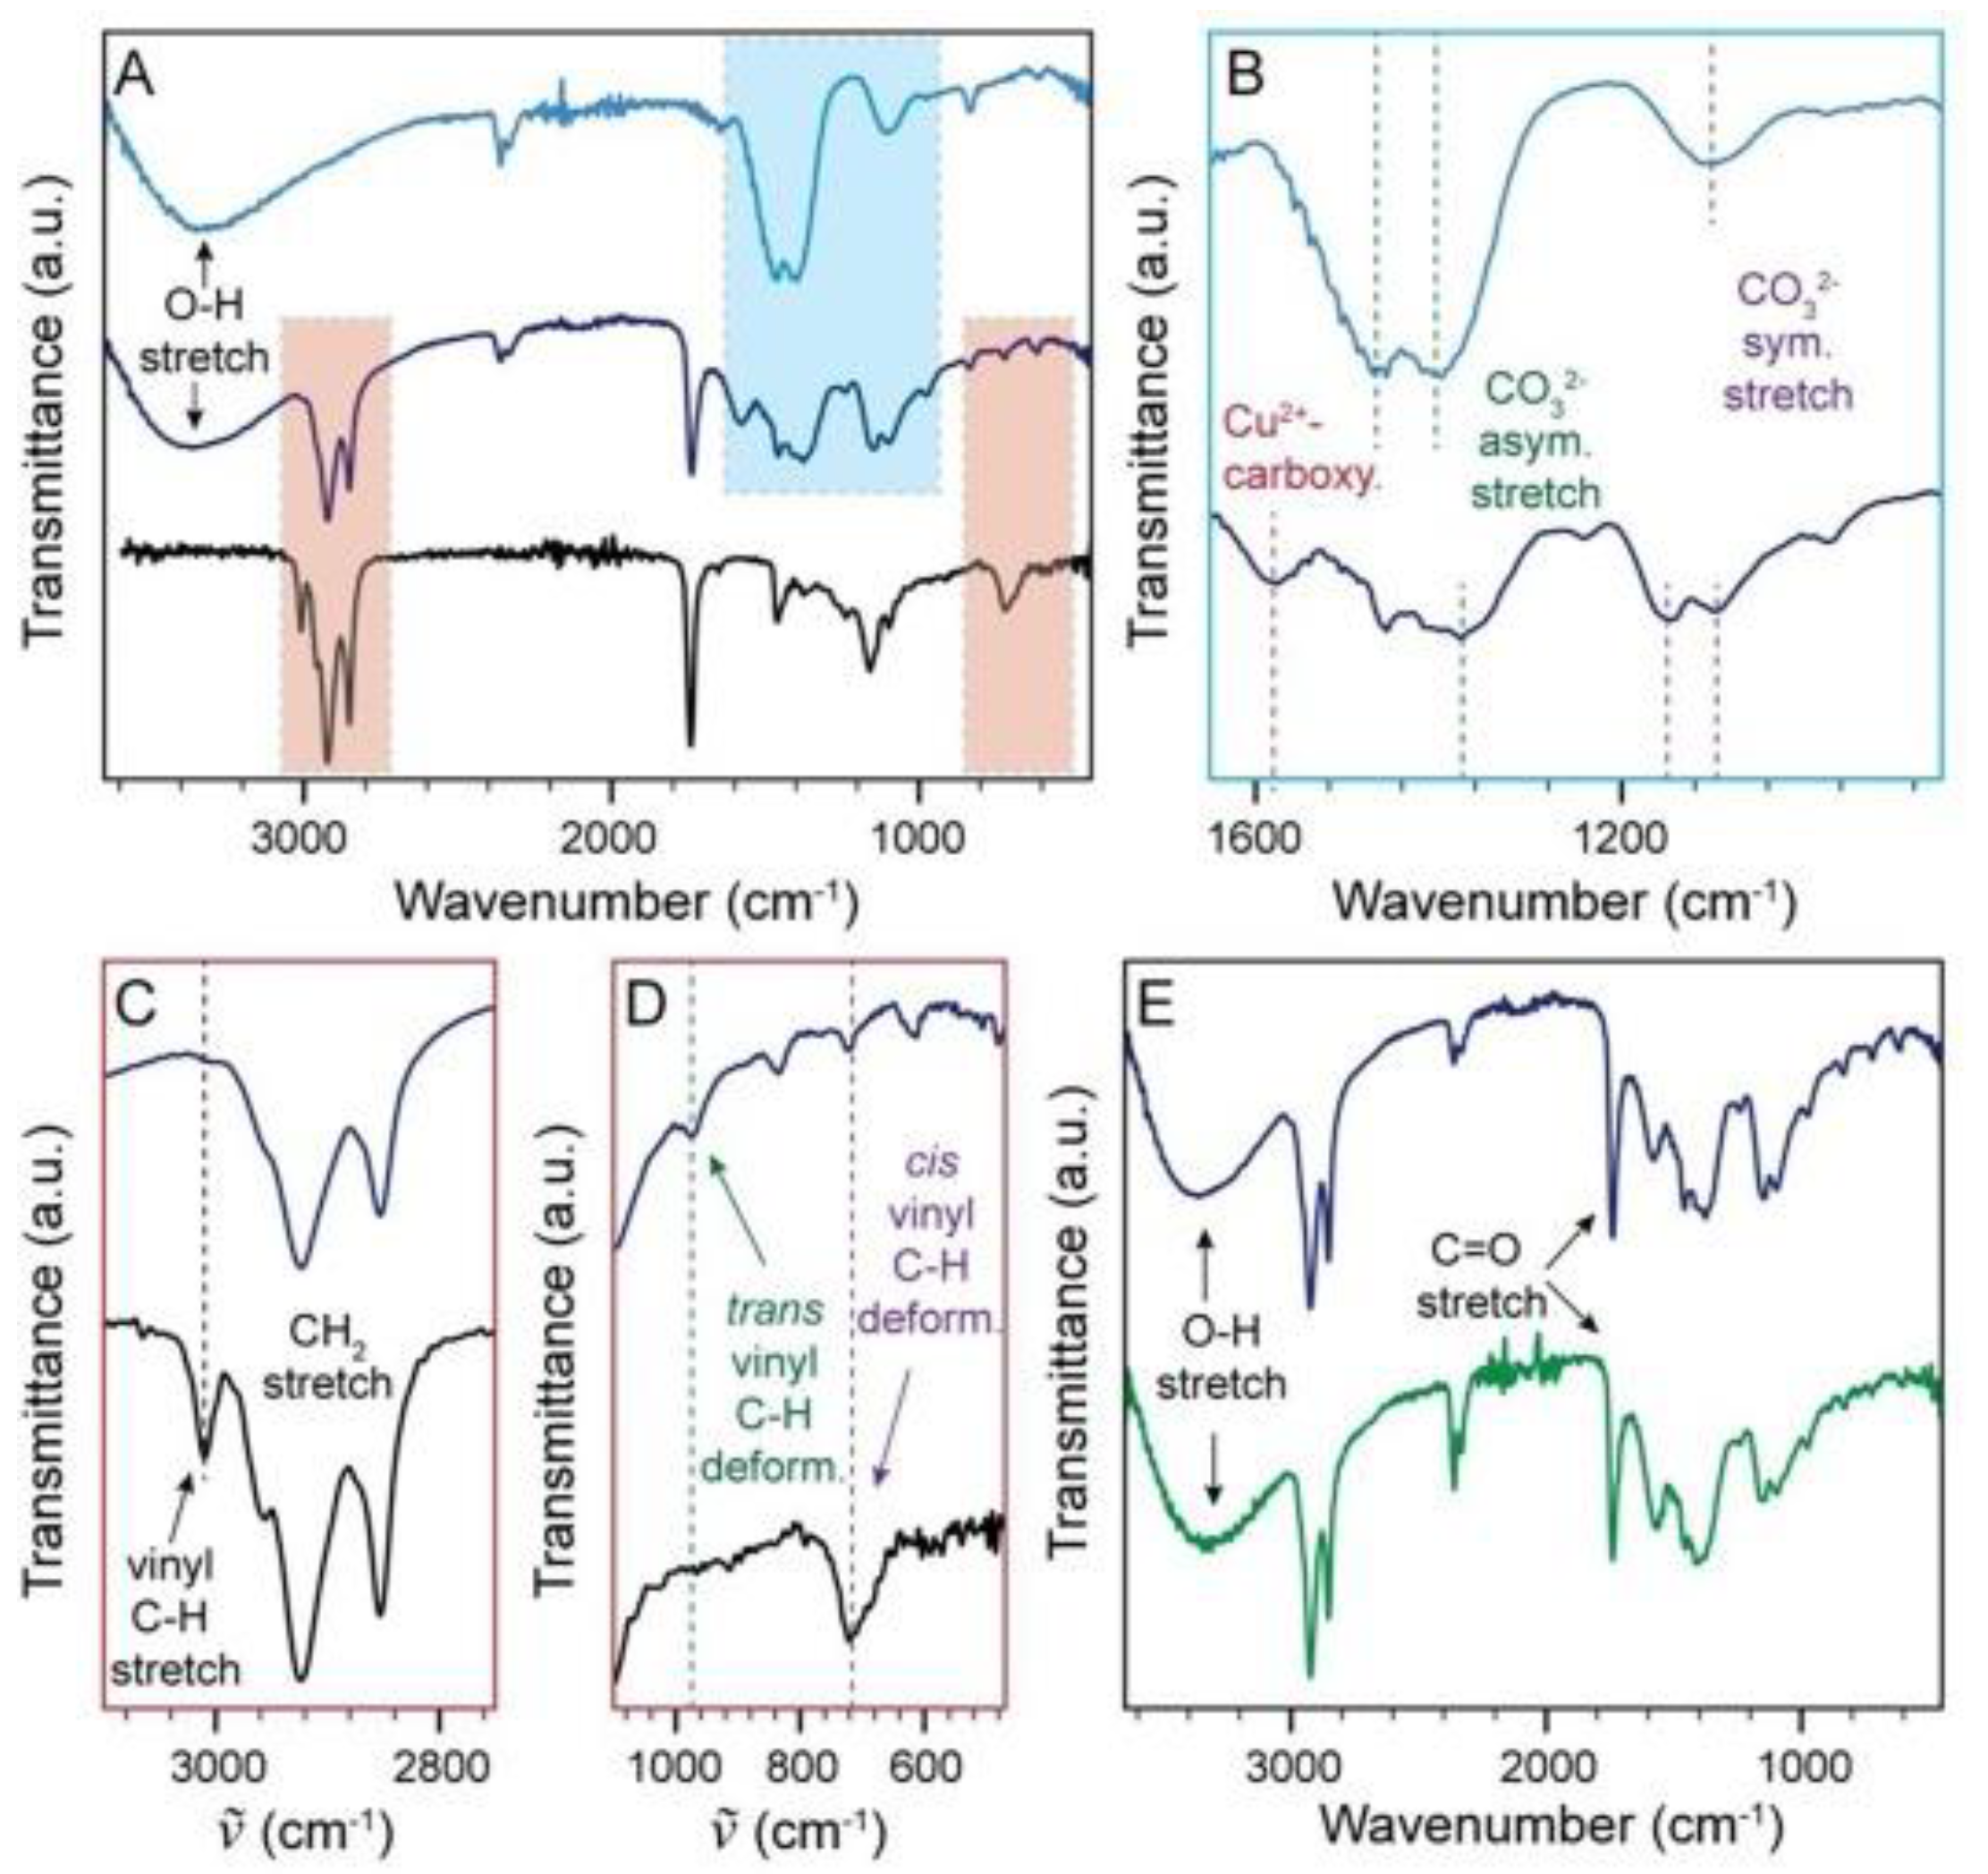
13] employed Fourier-transform infrared (FTIR) spectroscopy to identify the alteration of ligands bound responsible for the color change in copper-based colorants after curing in linseed oil-based paint. Specifically, the carbonate asymmetric stretching peaks shifted, and symmetric stretching peaks were split into two peaks (
Figure 17A,B), indicating a change in the short-range order of the georgite pigment upon incorporation into the paint. An additional Cu
2+-carboxylate peak also emerged at ~1575 cm
-1 due to pigment interactions with the linseed oil binder. Surprisingly, the FTIR spectrum for the malachite linseed oil-based paint matched the spectrum of the georgite linseed-oil based paint (
Figure 17E), indicating similar short-range order for both pigments following paint curing, which is most likely responsible for the similar final green color of the two paints. Since both pigments possessed the Cu
2+-carboxylate vibrational peak, it is evident that carboxylate acid moiety byproducts of the linseed oil autoxidation reaction are able to disrupt Cu
2+-carbonate interactions in both pigments, forming Cu
2+-carboxylate complexes. This study demonstrated that FTIR spectroscopy is highly sensitive to any changes in the local ligand environment surrounding the transition metal ions in complexes.
IR spectroscopy methods were instrumental in detecting Prussian Blue in a mixture with indigo pigments in Japanese ukiyo-e woodprints from the 19th century, where other methods were ineffective. Identified by the very specific and intense cyano stretching vibration ν(C ≡ N), Prussian blue would not have been detected without FTIR. In this case, IR spectroscopy contributed significantly to the analysis and dating of the development of Prussian Blue’s implementation globally [
33].
Raman spectroscopy, complementary to FTIR, relies on the phenomenon of inelastic scattering of photons, known as Raman scattering, to reveal information about the vibrational modes of molecules or complexes. Widely used in art and industry, Raman spectroscopy is a non-destructive chemical analysis technique that provides detailed insights into chemical structure, phase, polymorph, crystallinity, and molecular interactions.
Raman spectroscopy stands out as one of the most powerful techniques for identifying ancient pigments like Ultramarine Blue, Egyptian Blue, Han Blue, and Han Purple due to their characteristic fingerprint patterns in the spectrum. Interestingly, variations in Raman spectra are observed between samples of virtually pure Egyptian Blue from the crown of the Bust of Nefertete and from a sample of fresco in the Monastery of Müstair, Switzerland [
49]. Similarly, discrepancies are noted in Raman spectra of Han Purple from samples obtained from the pigment layer of the Terracotta Army in Xian, China, and frescoes from the tomb of Bin Wang [
49]. These differences highlight the sensitivity of Raman spectroscopy in identifying ancient blue pigments from different sources, attributed to variations in microstructures such as phases and the degree of crystallinity, which may vary depending on synthesis conditions.
4.4. Electron Paramagnetic Resonance
Electron Paramagnetic Resonance (EPR) is an analytic method that detects the spin of unpaired electrons. When the imposed magnetic field matches the energy difference between the electron's spin states, resonance occurs, and the electrons transition between spin states, absorbing energy from the microwaves [
69]. By measuring the absorption of this energy, information about the unpaired electrons' environment, such as their quantity, spin state, and interactions with neighboring atoms or molecules, can be obtained. In the context of transition metal complexes, EPR can be employed to investigate the presence of paramagnetic species, potentially identify specific metal ions or radical species, and discern structural changes around the metal center ions [
69].
In the study by Peng et al, EPR data further confirmed that the new coordinated Cu
2+ complexes after firing at 850 °C are formed due to the interaction with the glass matrix under high temperatures [
19]. The data specifically suggested that before the glaze became completely molten, Cu
2+ was already coordinated with the other glaze compounds as evidenced by the light blue color. Additionally, EPR data also gave insight into the oxidation state of the copper center throughout firing: the 1% malachite and 1% CuO glazes kept an oxidation state of Cu
2+ throughout the entire firing process, indicating that no redox reactions occurred [
19].
In the study conducted by Hills-Kimbal et al., EPR data provided evidence of changes in the electron paramagnetic resonance of georgite pigment when it was mixed with linseed oil and allowed to dry [
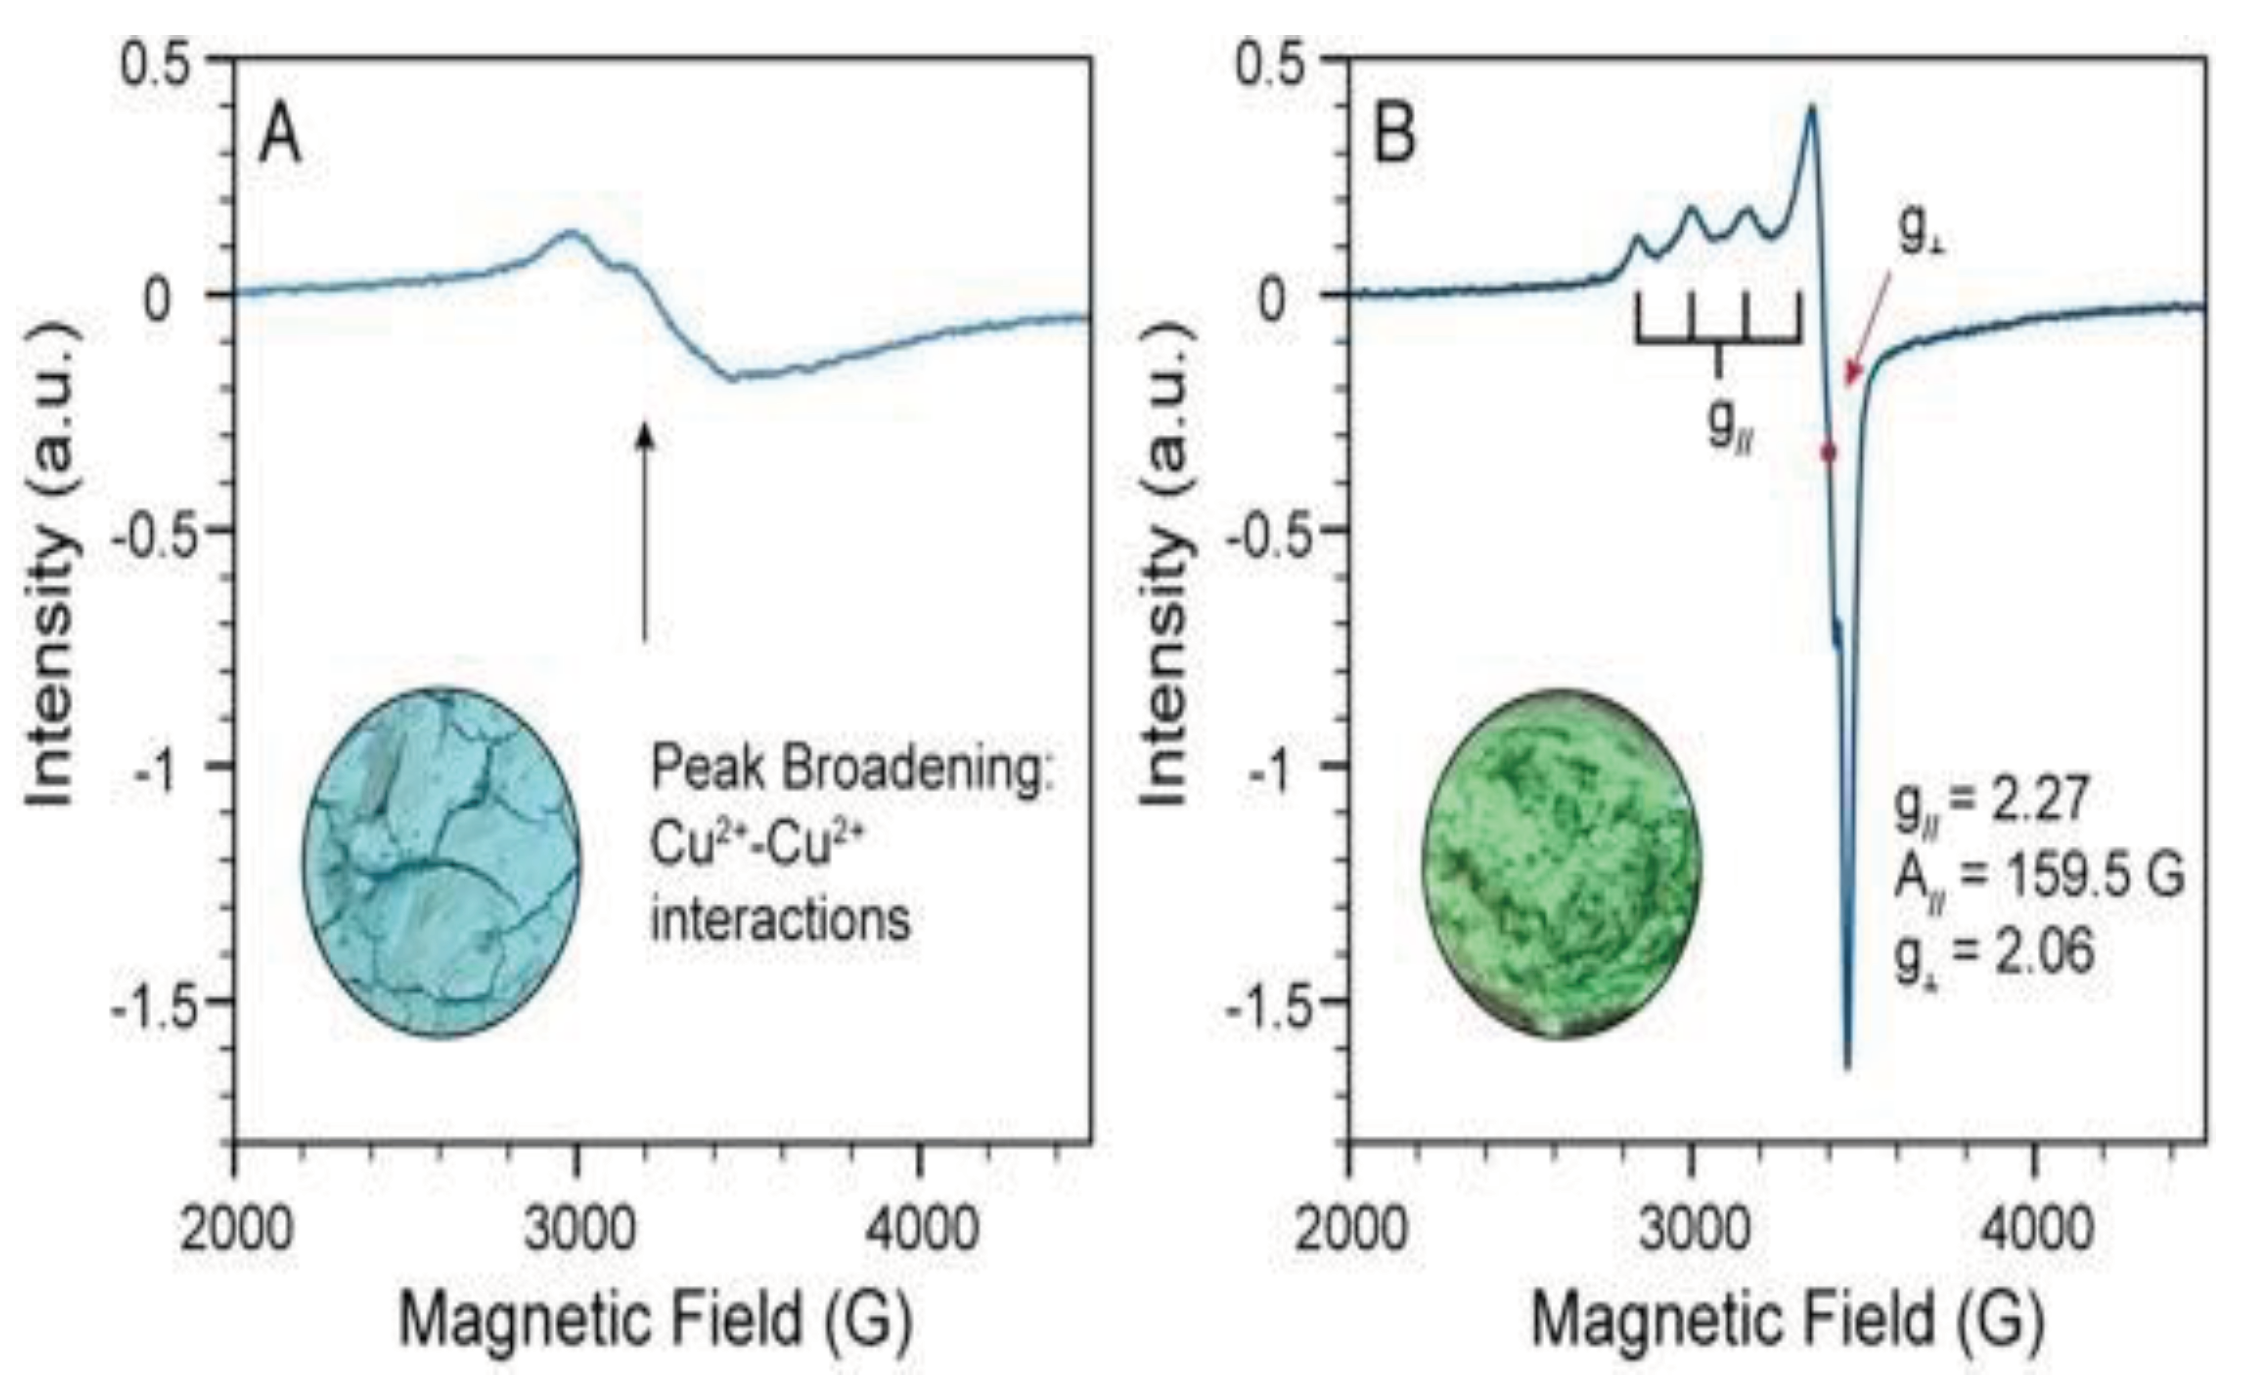
13]. This observation suggests that there is an interaction between the linseed oil and the copper centers within the pigments, impacting the metallic center’s d-orbital splitting. The EPR spectra of the paints showed an anisotropic Cu
2+ signal, which points to the presence of a square-planar Cu
2+ molecular complex (
Figure 18). This evidence suggests that carboxylic acid byproducts produced during the autoxidation of linseed oil were effective in extracting Cu
2+ ions from the structure of georgite. Consequently, this process resulted in the formation of evenly dispersed Cu
2+ molecular complexes within the paint, causing a color change [
13].
EPR spectra techniques can also be used to control the quality of ceramic objects by detecting impurities in clay. In a study by Bertolino et al, EPR was a powerful technique used to detect and quantify iron included in between the structural layers of Kaolin, which had the greatest impact on whiteness. The researchers determined that EPR is an effective method for tracking the elimination of iron from kaolin throughout the various stages of its industrial processing [
30].
4.5. Synchrotron Radiation (SR) Based Techniques
Synchrotron radiation (SR) generates intense light beams suitable for various spectroscopic applications [
70]. The high-intensity X-ray beams produced by SR surpass conventional high-performance rotating anode X-ray tubes by 8 to 12 orders of magnitude, offering superior spectral resolution and signal-to-noise ratio. Owing to its brightness, these X-ray beams can be focused to a one-micrometer spot size while maintaining high photon fluxes (>10
10 ph/s/mm
2), enabling rapid acquisition of diffraction patterns with exposure times of mere seconds. This capability facilitates the swift investigation of microstructural features at multiple locations within a single object [
71]. For instance, employing SR-based high-resolution X-ray diffraction (XRD) analysis enabled the identification of crystallographic phases within a minute quantity of Han purple pigment sourced from a Terracotta soldier [
71]. Chemical and phase mapping provided insights into the pigment's synthesis process. Data from various measurements, including SR-based micro X-ray diffraction (
μ-XRD), micro X-ray fluorescence (
μ-XRF), and Scanning Electron Microscopy (SEM) based Energy Dispersive X-ray (EDX), demonstrated that Chinese Han Blue and Han Purple were produced independently of Egyptian blue, despite their similar coordination numbers and center transition metal ions. The primary evidence supporting this conclusion was the detection of lead oxide, a flux used in Han purple production, whereas no lead was detected in Egyptian blue [
71].
In addition to discerning the crystalline structure and morphology of pigments and identifying elements, understanding the chemical environment surrounding transition metal center ions and their interactions with ligands, as well as coordination numbers, is crucial for comprehending pigment degradation, color mechanisms, and structure-property relationships in transition metal complexes. SR-based X-ray absorption near edge structure (XANES) spectroscopy has proven effective in probing the molecular environment, including oxidation states, coordination numbers, site symmetry, and distortion, providing essential insights with chemical specificity [
72]. Whereas SR-based Extended X-ray absorption fine structure (EXAFS) analysis, performed by scanning X-ray energy far beyond the absorption edge of interest, yields quantitative information on specific bond distances between center ions and surrounding ligands, as well as coordination numbers, through the analysis of constructive and destructive interference patterns between outgoing and backscattered photoelectron waves [
72]. Furthermore, SR-based micro-Fourier Transform Infrared Spectroscopy (
μ-FTIR) can offer greater power than conventional laboratory-based techniques, enabling the measurement and mapping of small pigment quantities or large painting areas and providing valuable insights into the interactions between transition metal ions and surrounding ligands [
70].
5. Future Perspective
The concepts and research methods outlined in this review article have numerous practical applications. Advancements in understanding the color-producing mechanisms inherent in transition metal complexes hold potential for aiding in the development of new pigment synthesis routes, thereby offering a broader spectrum of options for manufacturers and consumers [
73]. The examination of interactions within transition metal complexes presents exciting opportunities for discovering new phenomena, given the varied outcomes resulting from specific ligands and conditions. Additionally, gaining precise insights into pigment and glaze matrix interactions during firing can provide valuable information on further refining the final color of ceramics [
19].
The bottom-up research approach discussed here could also benefit artists or individuals interested in working with the vibrant colors offered by transition metals. Just as this research aids in developing alternative pigments or methods for their creation in various applications [
14,
74], these same pigments could be utilized to develop new paints or ceramic glazes. Gaining more knowledge and control over ceramic glaze colors and impurities, and understanding how to consistently achieve a desired color or effect, holds immense value. This heightened accuracy and control can lead to time and material savings at a production level. From an artistic perspective, a deeper understanding of kiln processes and pigment properties empowers artists to use their materials to create art that aligns with their original intentions, allowing for more confident experimentation and the development of new techniques or glazes.
Advanced computational methods, when paired with experimental techniques, play a crucial role in utilizing a bottom-up approach to inform rational design and deepen our understanding of the function of transition metal complexes in color formation. Higher-level computational techniques become imperative for resolving disparities between experimental observations and theoretical predictions.
For instance, recent computational investigations [
2] have revealed that the d-d splitting energy is not solely influenced by the ligand type and coordination number, but also by the configuration of the internal electrostatic potential, denoted as VR(r). This potential is contingent upon the lattice structures surrounding the transition metal complexes. By integrating the internal electrostatic potential, VR(r), into computations, accurate predictions of absorption band energies for substances like Egyptian blue become achievable [
2].
Although similar calculations have not been conducted for Han Purple, it has been suggested that differences in lattice network arrangement or VR(r) may result in changes in d-d splitting energies, leading to the purple color observed in Han Purple. However, Han Purple synthesized using ancient procedures did not exhibit a purple color but rather appeared dark blue. It was proposed that the purple color observed in the terracotta warriors arises from the presence of red impurities of copper(I) oxide, Cu2O (known as cuprite), generated by the decomposition of Han Purple. This discrepancy between experimental results and theoretical predictions necessitates further investigation to verify the findings and resolve inconsistencies. Therefore, future high-level calculations, such as those involving the internal electrostatic potential, VR(r), are required to reconcile experimental and theoretical results. The development of more advanced computational methods will also aid in the rational design of novel materials by modifying the structure of the insulating lattice in which a given chromophore resides.
Collaborative research among experimental and theoretical scientists, as well as artists or art historians, employing a bottom-up approach, will advance our understanding of the origin of color in various materials and facilitate the rational design of novel, less toxic, and cost-effective pigment materials beneficial to artists and society at large. For instance, laboratory-synthesized Han blue, obtained through a low-temperature hydrothermal reaction, exhibits intriguing magnetic properties and quantum effects, making it useful not only as a pigment for artists but also as advanced functional materials, such as nanomaterials and optical sensors [
25]. Similarly, the laboratory-synthesized brilliant blue pigment YInMn blue, as demonstrated by Subramanian, represents another promising example of future developments [
36].
Efforts to develop environmentally sustainable colorants, such as the study by Goga et al., which explored Nickel substitution as an alternative to Cobalt pigments, are critical for reducing reliance on potentially toxic pigments [
46]. These endeavors aim not only to enhance control over impurities and refine color nuances but also to provide a bottom-up methodology for understanding the molecular mechanisms underlying these vibrant colors. For instance, chromium, commonly used as a pigment for pink or green colors in cookware, exists naturally as Chromium III or Chromium VI ions, with the latter posing health risks upon ingestion. Thermal treatment can oxidize Chromium III into Chromium VI, which can then be absorbed by the body, leading to adverse health effects. Similarly, consumer exposure to cobalt pigments used in various applications, including cookware, has been linked to health issues affecting multiple organ systems. Therefore, the bottom-up approach, allowing for the rational design of safer pigments, is instrumental in developing safe pigments for food and ceramic cookware.
6. Conclusion
This review employs a bottom-up scientific approach, integrating scientific inquiry, artistic expression, and industry demands to explore the role of transition metal complexes in pigments while discussing sources of variability in their appearances. The investigation unveils the molecular origins of coloration, with a focus on d-orbital splitting and charge transfer mechanisms. Factors influencing color, such as temperature, redox environment, and the nature and orientation of ligands, are thoroughly examined, offering valuable insights for enhanced control during artistic or manufacturing processes. Utilizing analytical methods such as UV-visible spectroscopy, X-ray Diffraction, Infrared Spectroscopy, Electron Paramagnetic Resonance, and synchrotron radiation-based spectroscopies provides crucial insights into the color-shifting phenomena observed in transition metal complexes.
The knowledge gained from this exploration carries significant implications for art, manufacturing, and materials science. It has the potential to lead to the development of novel pigments and glazes that are both less toxic and cost-effective, benefiting artists and society at large. Collaborative research among experimental and theoretical scientists, artists, and art historians, employing a bottom-up approach, will further advance understanding of color origins and facilitate the rational design of innovative pigments. From ancient ceramicists in China to contemporary manufacturers and artists, users of transition metal complex pigments strive to ensure their products achieve the desired colors. Thanks to the capabilities of modern analytical techniques and theoretical knowledge, a wealth of new insights has emerged, allowing for a deeper understanding and adherence to aesthetic intentions across diverse applications.
Author Contributions
Conceptualization, A.C., J.R. and L.-Q.W.; methodology, A.C., J.R. and L.-Q.W.; validation, A.C., J.R. and L.-Q.W.; resources, A.C., J.R. and L.-Q.W.; writing—original draft preparation, A.C., J.R., O.K. and L.-Q.W.; writing—review and editing, A.C., J.R. and L.-Q.W.; visualization, A.C., J.R. and O.K.; supervision, L.-Q.W.; project administration, L.-Q.W.; funding acquisition, L.-Q.W. All authors have read and agreed to the published version of the manuscript.
Acknowledgments
The authors would like to thank the Brown University Independent Research Program which allows students to work on the research project during the semester. This review article includes some of our previously published research data. We are grateful to Dr. Hector Garces, Anthony McCormick, and the Institute for Molecular and Nanoscale Innovation for their help with using EPR and SEM machinery, as well as David Katz (Department of Ceramics, Rhode Island School of Design) for his expertise, glaze recipe, and materials.
Conflicts of Interest
The authors declare no conflict of interest.
References
- Orna, M.V.; Fontani, M. The Modernity of Ancient Pigments: A Historical Approach. Colorants 2022, 1, 307–346. [Google Scholar] [CrossRef]
- García-Fernández, P.; Moreno, M.A.; Vegas, I. Origin of the Exotic Blue Color of Copper-Containing Historical Pigments. Inorganic Chemistry 2015, 54, 192–199. [Google Scholar] [CrossRef] [PubMed]
- Möncke, D.; Papageorgiou, M.; Winterstein-Beckmann, A.; Zacharias, N. Roman Glasses Coloured by Dissolved Transition Metal Ions: Redox-Reactions, Optical Spectroscopy and Ligand Field Theory. Journal of Archaeological Science 2014, 46, 23–36. [Google Scholar] [CrossRef]
- Tite, M.; Shortland, A.; Paynter, S. The Beginnings of Vitreous Materials in the Near East and Egypt. Accounts of Chemical Research 2002, 35, 585–593. [Google Scholar] [CrossRef]
- Rubenstein, D.; Patterson, W.P.; Peng, I.; Schunk, F.; Mendoza-Garcia, A.; Lyu, M.; Wang, L.-Q. Introductory Chemistry Laboratory: Quantum Mechanics and Color. Journal of Chemical Education 2020, 97. [Google Scholar] [CrossRef]
- Nassau, K. The Fifteen Causes of Color: The Physics and Chemistry of Color. Color Research & Application 1987, 12, 4–26. [Google Scholar] [CrossRef]
- Miessler, G.L.; Fischer, P.J.; Tarr, D.A. Inorganic Chemistry; Pearson: Boston, 2014. [Google Scholar]
- Cartechini, L.; Miliani, C.; Nodari, L.; Rosi, F.; Tomasin, P. The Chemistry of Making Color in Art. Journal of Cultural Heritage 2021, 50, 188–210. [Google Scholar] [CrossRef]
- Ren, J.; Lin, T.; Sprague, L.W.; Peng, I.; Wang, L.-Q. Exploring Chemical Equilibrium for Alcohol-Based Cobalt Complexation through Visualization of Color Change and UV–Vis Spectroscopy. Journal of Chemical Education 2019, 97, 509–516. [Google Scholar] [CrossRef]
- Verger, L.; Dargaud, O.; Menguy, N.; Troadec, D.; Cormier, L. Interaction between Cr-Bearing Pigments and Transparent Glaze: A Transmission Electron Microscopy Study. Journal of Non-Crystalline Solids 2017, 459, 184–191. [Google Scholar] [CrossRef]
- Verger, L.; Dargaud, O.; Rousse, G.; Cormier, L. Reactivity of Chromium-Based Pigments in a Porcelain Glaze. Comptes Rendus Physique 2018, 19, 589–598. [Google Scholar] [CrossRef]
- Hund, F. Inorganic Pigments: Bases for Colored, Uncolored, and Transparent Products. Angewandte Chemie International Edition in English 1981, 20, 723–730. [Google Scholar] [CrossRef]
- Hills-Kimball, K.; Lovelace, I.; Peng, I.; Wang, J.; Garces, H.F.; Rios, M.; Chen, O.; Wang, L.-Q. New Insights to the Interactions between Amorphous Georgite Pigment and Linseed Oil Binder That Lead to a Drastic Color Change. Inorganica Chimica Acta 2022, 529, 120661. [Google Scholar] [CrossRef]
- Sanchez, C.; Belleville, P.; Popall, M.; Nicole, L. Applications of Advanced Hybrid Organic–Inorganic Nanomaterials: From Laboratory to Market. Chemical Society Reviews 2011, 40, 696. [Google Scholar] [CrossRef]
- Orna, M.V. Chemical Origins of Color. Journal of Chemical Education 1978, 55, 478–478. [Google Scholar] [CrossRef]
- Ishii, T.; Tsuboi, S.; Sakane, G.; Yamashita, M.; Breedlove, B.K. Universal Spectrochemical Series of Six-Coordinate Octahedral Metal Complexes for Modifying the Ligand Field Splitting. Dalton Transactions 2009, 680–687. [Google Scholar] [CrossRef] [PubMed]
- Yarranton, J.T.; McCusker, J.K. Ligand-Field Spectroscopy of Co(III) Complexes and the Development of a Spectrochemical Series for Low-Spin D6 Charge-Transfer Chromophores. Journal of the American Chemical Society 2022, 144, 12488–12500. [Google Scholar] [CrossRef] [PubMed]
- Stallmann, O. Use of Metal Complexes in Organic Dyes and Pigments. Journal of Chemical Education 1960, 37, 220–220. [Google Scholar] [CrossRef]
- Peng, I.; Hills-Kimball, K.; Lovelace, I.M.; Wang, J.; Rios, M.; Chen, O.; Wang, L.-Q. Exploring the Colors of Copper-Containing Pigments, Copper (II) Oxide and Malachite, and Their Origins in Ceramic Glazes. Colorants 2022, 1, 376–387. [Google Scholar] [CrossRef]
- Baker, A. The Ligand Field Spectra of Copper(II) Complexes. Semantic Scholar 1998, 75. [Google Scholar] [CrossRef]
- Reddy, S.L.; Endo, T.; Reddy, G.S. Electronic (Absorption) Spectra of 3d Transition Metal Complexes. In Advanced Aspects of Spectroscopy; InTech Open, 2012. [Google Scholar]
- Pashanova, K.I.; Ershova, I.V.; Trofimova, O.Y.; Rumyantsev, R.V.; Fukin, G.K.; Bogomyakov, A.S.; Arsenyev, M.V.; Piskunov, A.V. Charge Transfer Chromophores Derived from 3d-Row Transition Metal Complexes. Molecules 2022, 27, 8175. [Google Scholar] [CrossRef]
- Kupferschmidt, K. In Search of Blue. Science 2019, 364, 424–429. [Google Scholar] [CrossRef] [PubMed]
- Nicola, M.; Gobetto, R.; Masic, A. Egyptian Blue, Chinese Blue, and Related Two-Dimensional Silicates: From Antiquity to Future Technologies. Part A: General Properties and Historical Uses. Rendiconti lincei. Scienze fisiche e naturali 2023, 34, 369–413. [Google Scholar] [CrossRef]
- Chen, Y.; Zhang, Y.; Feng, S. Hydrothermal Synthesis and Properties of Pigments Chinese Purple BaCuSi2O6 and Dark Blue BaCu2Si2O7. Dyes and Pigments 2014, 105, 167–173. [Google Scholar] [CrossRef]
- Feng, L.; Wang, F.; Luo, H.; Zhu, J.; Wang, M.; Yang, C.; Jianxing, S.; Wang, T. Phase-Separated Tenmoku “Blue” Glaze: Microstructure and Coloring Mechanism. Journal of the European Ceramic Society 2023, 43, 6581–6589. [Google Scholar] [CrossRef]
- Wood, N. Nought-Point-Two per Cent Titanium Dioxide: A Key to Song Ceramics? Journal of Archaeological Science: Reports 2021, 35. [Google Scholar] [CrossRef]
- Wang, T.; Zhu, T.Q.; Feng, Z.Y.; Fayard, B.; Pouyet, E.; Cotte, M.; De Nolf, W.; Salomé, M.; Sciau, Ph. Synchrotron Radiation-Based Multi-Analytical Approach for Studying Underglaze Color: The Microstructure of Chinese Qinghua Blue Decors (Ming Dynasty). Analytica Chimica Acta 2016, 928, 20–31. [Google Scholar] [CrossRef] [PubMed]
- Kim, S. The Allure of Chinese Blue and White Porcelain; Skinner Inc.
- Bertolino, L.C.; Rossi, A.M.; Scorzelli, R.B.; Torem, M.L. Influence of Iron on Kaolin Whiteness: An Electron Paramagnetic Resonance Study. Applied Clay Science 2010, 49, 170–175. [Google Scholar] [CrossRef]
- Pérez-Arantegui, J.; Resano, M.; García-Ruiz, E.; Vanhaecke, F.; Roldán, C.; Ferrero, J.; Coll, J. Characterization of Cobalt Pigments Found in Traditional Valencian Ceramics by Means of Laser Ablation-Inductively Coupled Plasma Mass Spectrometry and Portable X-Ray Fluorescence Spectrometry. Talanta 2008, 74, 1271–1280. [Google Scholar] [CrossRef]
- Ware, M. Prussian Blue: Artists’ Pigment and Chemists’ Sponge. Journal of Chemical Education 2008, 85, 612. [Google Scholar] [CrossRef]
- Biron, C.; Mounier, A.; Le Bourdon, G.; Servant, L.; Chapoulie, R.; Daniel, F. A Blue Can Conceal Another! Noninvasive Multispectroscopic Analyses of Mixtures of Indigo and Prussian Blue. Color Research & Application 2019, 45, 262–274. [Google Scholar] [CrossRef]
- Burns, R.G. Mineralogical Applications of Crystal Field Theory, 2nd ed.; Cambridge University Press, 1993. [Google Scholar]
- Stamokostas, G.L.; Fiete, G.A. Mixing of T2g−Eg Orbitals in 4d and 5d Transition Metal Oxides. Physical Review B 2018, 97. [Google Scholar] [CrossRef]
- Subramanian, M.A.; Li, J. YInMn Blue—200 Years in the Making: New Intense Inorganic Pigments Based on Chromophores in Trigonal Bipyramidal Coordination. Materials today advances 2022, 16, 100323. [Google Scholar] [CrossRef]
- Begum, Y.; Wright, A.J. Relating Highly Distorted Jahn–Teller MnO6 to Colouration in Manganese Violet Pigments. Journal of Materials Chemistry 2012, 22, 21110. [Google Scholar] [CrossRef]
- Gupta, S.; Pandey, T.; Singh, A.K. Suppression of Jahn–Teller Distortions and Origin of Piezochromism and Thermochromism in Cu–Cl Hybrid Perovskite. Inorganic Chemistry 2016, 55, 6817–6824. [Google Scholar] [CrossRef] [PubMed]
- Sinha, N.; Wenger, O.S. Photoactive Metal-To-Ligand Charge Transfer Excited States in 3d6 Complexes with Cr0, MnI, FeII, and CoIII. Journal of the American Chemical Society 2023, 145, 4903–4920. [Google Scholar] [CrossRef] [PubMed]
- Janes, R.; Moore, E. Charge-Transfer Bands in the Electronic Spectra of Transition-Metal Complexes. The Royal Society of Chemistry eBooks 2004, 75–82. [Google Scholar] [CrossRef]
- Turner, W.H. Optical Absorption Spectra of Iron in the Rock-Forming Silicates: A Discussion. American Mineralogist 1967, 52, 553–555. [Google Scholar]
- Warzecha, E.; Berto, T.C.; Wilkinson, C.C.; Berry, J.F. Rhodium Rainbow: A Colorful Laboratory Experiment Highlighting Ligand Field Effects of Dirhodium Tetraacetate. Journal of Chemical Education 2019, 96, 571–576. [Google Scholar] [CrossRef]
- Reinen, D.; Rauw, W.; Kesper, U.; Atanasov, M.; Güdel, H.U.; Hazenkamp, M.; Oetliker, U. Colour, Luminescence and Bonding Properties of Tetrahedrally Coordinated Chromium(IV), Manganese(v) and Iron(VI) in Various Oxide Ceramics. Journal of Alloys and Compounds 1997, 246, 193–208. [Google Scholar] [CrossRef]
- Bartecki, A.; Kurzak, K. Colour of 3d Transition Metal Compounds. Part 1. Experimental Quantitative Studies and Ligand-Field Based Predictions for D1, D4, D6 and D9 Systems. Reviews in Inorganic Chemistry 2006, 26, 389–442. [Google Scholar] [CrossRef]
- Mohapatra, L.; Parida, K. A Review of Solar and Visible Light Active Oxo-Bridged Materials for Energy and Environment. Catalysis Science & Technology 2017, 7, 2153–2164. [Google Scholar] [CrossRef]
- Goga, F.; Bortnic, R.A.; Avram, A.; Zagrai, M.; Barbu Tudoran, L.; Mereu, R.A. The Effect of Ni2+ Ions Substitution on Structural, Morphological, and Optical Properties in CoCr2O4 Matrix as Pigments in Ceramic Glazes. Materials 2022, 15, 8713. [Google Scholar] [CrossRef]
- Bhim, A.; Laha, S.; Gopalakrishnan, J.; Natarajan, S. Color Tuning in Garnet Oxides: The Role of Tetrahedral Coordination Geometry for 3D Metal Ions and Ligand–Metal Charge Transfer (Band-Gap Manipulation). Chemistry—An Asian Journal 2017, 12, 2734–2743. [Google Scholar] [CrossRef] [PubMed]
- Tang, Y.; Wu, C.; Song, Y.; Zheng, Y.; Zhao, K. Effects of Colouration Mechanism and Stability of CoAl2O4 Ceramic Pigments Sintered on Substrates. Ceramics International 2018, 44, 1019–1025. [Google Scholar] [CrossRef]
- Berke, H. The Invention of Blue and Purple Pigments in Ancient Times. ChemInform 2007, 38. [Google Scholar] [CrossRef]
- García-Fernández, P.; Moreno, M.A.; Vegas, I. Origin of the Anomalous Color of Egyptian and Han Blue Historical Pigments: Going beyond the Complex Approximation in Ligand Field Theory. Journal of Chemical Education 2016, 93, 111–117. [Google Scholar] [CrossRef]
- Hall, F.P. The Influence of Chemical Composition on the Physical Properties of Glazes. Journal of the American Ceramic Society 1930, 13. [Google Scholar] [CrossRef]
- Pradell, T.; Molera, J. Ceramic Technology. How to Characterise Ceramic Glazes. Archaeological and Anthropological Sciences 2020, 12. [Google Scholar] [CrossRef]
- Denio, A.A. The Joy of Color in Ceramic Glazes with the Help of Redox Chemistry. Journal of Chemical Education 2001, 78, 1298. [Google Scholar] [CrossRef]
- Chaowu, Z.; Fen, W. Structure and Coordination Investigation of Iron-Ion Tinting Principle in Ferreous Glass. Journal of Wuhan University of Technology-Mater. Sci. Ed. 2005, 20, 8–11. [Google Scholar] [CrossRef]
- Hill, P.S. Teaching Geochemistry through the Artistic Use of Glass, Ceramics, and Glazes. Journal of Geoscience Education 2000, 48, 276–278. [Google Scholar] [CrossRef]
- Norton, F.H.; Dulplin, V.J. Color Formation in Vitreous Bodies. Journal of the American Ceramic Society 1932, 15, 206–212. [Google Scholar] [CrossRef]
- Luo, M.; Cheng, L.; Hu, X.; Liang, H.; Xiao, Z.; Shi, H.; Tang, C. Study on the Preparation of Copper Red Glaze and Parameters Affecting Its Colour. Materiały Ceramiczne 2019, 71, 397–407. [Google Scholar]
- Li, Y.; Yang, Y.; Zhu, J.; Zhang, X.; Jiang, S.; Zhang, Z.; Yao, Z.; Solbrekken, G. Colour-Generating Mechanism of Copper-Red Porcelain from Changsha Kiln (A.D. 7th–10th Century), China. Ceramics International 2016, 42, 8495–8500. [Google Scholar] [CrossRef]
- Zhu, J.; Duan, H.; Yang, Y.; Guan, L.; Xu, W.; Chen, D.; Zhang, J.; Wang, L.; Huang, Y.; Wang, C. Colouration Mechanism of Underglaze Copper-Red Decoration Porcelain (AD 13th–14th Century), China. Journal of Synchrotron Radiation 2014, 21, 751–755. [Google Scholar] [CrossRef]
- Wakamatsu, M.; Takeuchi, N.; Nagai, H.; Ishida, S. Chemical States of Copper and Tin in Copper Glazes Fired under Various Atmospheres. Journal of the American Ceramic Society 1989, 72, 16–19. [Google Scholar] [CrossRef]
- Wakamatsu, M.; Takeuchi, N.; Ishida, S. Effect of Furnace Atmosphere on Color of Iron Glaze. Journal of Non-Crystalline Solids 1987, 95–96, 733–740. [Google Scholar] [CrossRef]
- Kerr, R.; Wood, N. Science and Civilisation in China. Cambridge University Press 2004, 5, 658–692. [Google Scholar] [CrossRef]
- Muller, J.-P.; Calas, G. Genetic Significance of Paramagnetic Centers in Kaolinites. Clay Minerals Society eBooks 1993. [Google Scholar] [CrossRef]
- Warner, T.E. Artificial Cuprorivaite CaCuSi (Egyptian Blue) by a Salt-Flux Method. John Wiley & Sons, Ltd., 2011; pp. 26–49. [Google Scholar] [CrossRef]
- Mohrig, J.R. Laboratory Techniques in Organic Chemistry: Supporting Inquiry-Driven Experiments, 4th ed.; Freeman: New York, NY, USA, 2014. [Google Scholar]
- Ali, A.; Chiang, Y.W.; Santos, R.M. X-Ray Diffraction Techniques for Mineral Characterization: A Review for Engineers of the Fundamentals, Applications, and Research Directions. Minerals 2022, 12, 205. [Google Scholar] [CrossRef]
- Pradell, T.; Molina, G.; Molerà, J.; Pla, J.-M.; Labrador, A. The Use of Micro-XRD for the Study of Glaze Color Decorations. Applied Physics A 2012, 111, 121–127. [Google Scholar] [CrossRef]
- Świderski, G.; Wilczewska, A.Z.; Świsłocka, R.; Kalinowska, M.; Lewandowski, W. Spectroscopic (IR, Raman, UV–Vis) Study and Thermal Analysis of 3d-Metal Complexes with 4-Imidazolecarboxylic Acid. Journal of Thermal Analysis and Calorimetry 2018, 134, 513–525. [Google Scholar] [CrossRef]
- Basu, P. Use of EPR Spectroscopy in Elucidating Electronic Structures of Paramagnetic Transition Metal Complexes. Journal of Chemical Education 2001, 78, 666–666. [Google Scholar] [CrossRef]
- Janssens, K.; Alfeld, M.; Van der Snickt, G.; De Nolf, W.; Vanmeert, F.; Radepont, M.; Monico, L.; Dik, J.; Cotte, M.; Falkenberg, G.; Miliani, C.; Brunetti, B.G. The Use of Synchrotron Radiation for the Characterization of Artists’ Pigments and Paintings. Annual Review of Analytical Chemistry 2013, 6, 399–425. [Google Scholar] [CrossRef] [PubMed]
- Liu, Z.; Mehta, A.; Tamura, N.; Pickard, D.; Rong, B.; Zhou, T.; Pianetta, P. Influence of Taoism on the Invention of the Purple Pigment Used on the Qin Terracotta Warriors. Journal of Archaeological Science 2007, 34, 1878–1883. [Google Scholar] [CrossRef]
- Cotte, M.; Susini, J.; Dik, J.; Janssens, K. Synchrotron-Based X-Ray Absorption Spectroscopy for Art Conservation: Looking Back and Looking Forward. Accounts of Chemical Research 2010, 43, 705–714. [Google Scholar] [CrossRef] [PubMed]
- Martos, M.; Martínez, M.; Cordoncillo, E.; Escribano, P. Towards More Ecological Ceramic Pigments: Study of the Influence of Glass Composition on the Colour Stability of a Pink Chromium-Doped Ceramic Pigment. Journal of the European Ceramic Society 2007, 27, 4561–4567. [Google Scholar] [CrossRef]
- Molinari, C.; Conte, S.; Zanelli, C.; Ardit, M.; Cruciani, G.; Dondi, M. Ceramic Pigments and Dyes beyond the Inkjet Revolution: From Technological Requirements to Constraints in Colorant Design. Ceramics International 2020, 46, 21839–21872. [Google Scholar] [CrossRef]
- Leyssens, L.; Vinck, B.; Van Der Straeten, C.; Wuyts, F.; Maes, L. Cobalt Toxicity in Humans—a Review of the Potential Sources and Systemic Health Effects. Toxicology 2017, 387, 43–56. [Google Scholar] [CrossRef]
|
Disclaimer/Publisher’s Note: The statements, opinions and data contained in all publications are solely those of the individual author(s) and contributor(s) and not of MDPI and/or the editor(s). MDPI and/or the editor(s) disclaim responsibility for any injury to people or property resulting from any ideas, methods, instructions or products referred to in the content. |
© 2024 by the authors. Licensee MDPI, Basel, Switzerland. This article is an open access article distributed under the terms and conditions of the Creative Commons Attribution (CC BY) license (http://creativecommons.org/licenses/by/4.0/).

