
Submitted:
27 March 2024
Posted:
29 March 2024
You are already at the latest version
Abstract
The healthcare sector in Kuwait has been nurtured for many decades by the government where the Ministry of Health (MoH) controls up to 80 percent of the country’s health services. General and specialized public hospitals represent a significant proportion of health expenditures in Kuwait; amidst dwindling health resources, a declining global oil market in an oil-dependent welfare state, and a heavy reliance on a non-national clinical workforce. Although healthcare services in public sector hospitals are at highly subsidized rates, causing private sector involvement in healthcare to be considerably low, the growing demands for private delivery of care burgeoned participation of private hospitals in Kuwait, and improving hospital efficiency and productivity is more critical and timelier than ever. This paper aims to analyze public health system efficiency and hospital performance in the State of Kuwait, where we begin by evaluating the input-oriented technical efficiency (TE) of MoH hospitals in 2015-2019 and identifying potential areas for efficiency improvement by exploring influencing institutional and environmental factors. Over the five years between 2015 and 2019, TE in MoH hospitals has decreased by an average of 2.98% solely based on technical regress, where the six MoH general hospitals reported a pooled mean efficiency of 86.58%, and the nine sampled MoH specialized hospitals had a five-year pooled average of 65.47% efficiency. MoH policymakers should focus on improving allocative efficiency in the public health system, and healthcare policy reforms should focus on strengthening management structures in Kuwait’s public hospitals to improve production efficiency and financial sustainability.
Keywords:
Applied econometrics
; data envelopment analysis
; government hospital
; healthcare delivery
; health economics
; health policy
; health services research
; Kuwait
; operations research
; productivity
; public
1. Introduction
Despite the government and community attempts to enhance public health awareness and education, the health burden continues to rise, hence increasing the demand for health financing. As practically all present health expenditures are paid by oil income, the state’s ability to fulfill expanding demand will depend on raising oil revenues at the same rate, lowering spending in other sectors, restricting health service supply, or boosting the efficiency of health expenditures. Current research implies that oil income may drop while healthcare expenditures rise. In addition, the projections for oil prices in the following years do not indicate that revenue will be sufficient to cover the increasing need for healthcare.
With the growing demand for healthcare and increasing government expenditure, securing an efficient, equitable, and cost-effective healthcare system is both a national imperative and global responsibility. The United Nations (UN) has recognized the vital role of healthcare systems in the achievement of Universal Health Coverage (UHC) goals[1]. The State of Kuwait joins several other nations that also experienced substantial population growth, increased life expectancy (aging population 65+), and the proliferation of lifestyle-related diseases (non-communicable diseases; NCDs). These combined circumstances have increased the demand for healthcare services at a time of scant health resources [2].
When monitoring the health financing function, performance must also be measured relative to monetary funding entering the public health system. Thus, we need to consider the resources potentially available to the system, the conditions that influence how difficult it might be to mobilize these resources, and the broader budget constraint faced by policymakers in the public health sector. In addition to more general macroeconomic data (i.e., GDP per capita), a further indicator that tends to reveal more than just Kuwait’s (or any given country’s) health financing function is public sector expenditures as a share of gross domestic product (GDP); measuring the share of national income effectively captured and utilized by the public sector; in a sense, this represents the public sector’s budget constraint when allocating resources between different public demands[3].
If we begin evaluating the effectiveness of the financing function or Kuwait’s health financing policies, we can see that by 2019, the current health expenditure in Kuwait as a percent of GDP was 5.5 percent; that corresponds to a 7.77 percent increase from the previous year in 2018 and maintains the positive percent change consistently found through the years – except for the minor dip in 2017 that indicates a -1.64 percent reduction from 2016; nevertheless, as displayed in Table 1 and Figure 1 [4], [5], the overall trend of the line graph suggests consistent increase before 2015 but continues to climb again after 2015 with a positive percent change of almost 40 percent between 2015-2019.
This study will provide the necessary research to establish a difference in cost-effectiveness and quality of services; furthermore, this paper can contribute to the data and our later understanding and knowledge of the economic issues arising from increased healthcare costs. Healthcare decision-makers need empirical data to control healthcare costs without reducing access to high-quality healthcare [6].
Government leaders and policymakers may use this study's results to determine public hospitals' efficiency and examine possible internal and external factors for inefficiencies in Kuwait’s public health sector. Evaluating health system indicators and hospital-specific variables may also determine if hospitals provide cost-effective healthcare services for patients while limiting wastage. Governments are vested in the healthcare decision-making process through policies, regulations, and third-party funding [7]. Policies and regulations will allow governments to control healthcare expenditures [8]. Government leaders can then make informed choices about alternative health service delivery methods and cost-containment strategies.
Healthcare in Kuwait has dramatically evolved over the past two decades. The MoH continues to be the principal provider of healthcare through three main levels of care:
1.1. Primary Care
Community health facilities offer services, including general medicine, dentistry, childcare, maternity care, preventive medicine, school health, laboratory, and radiology. As the literature suggests and based on a previous study finding [5], more than 60 percent of MoH government health resources are exhausted by secondary and tertiary healthcare providers. Thus, this level of primary care is not included in the efficiency evaluation.
1.2. Secondary Care
Services are delivered across six (6) public acute care general hospitals, including Al-Amiri Hospital, Al-Adan Hospital, Al-Sabah Hospital, Mubarak Al-Kabeer Hospital, Al-Farwaniya Hospital, and Al-Jahra Hospital. The new Jaber Al-Ahmed Hospital is the latest facility now included in the 2019/2020 annual statistical reports but was not operating at the start of or throughout our 2015-2019 observation period.
1.3. Tertiary Care
Specialized hospitals and medical centers offer psychiatry, infectious diseases, physical medicine, and rehabilitation services. Nine (9) specialty hospitals that deliver a tertiary level of care are included based on the homogeneity of available services, including Al-Razi Specialized Hospital, Physical Medicine & Rehab Facility, Maternity Specialized Hospital, Specialized Chest Diseases Hospital, Specialized Infectious Disease Facility, Ibn Sina Specialized Hospital, Kuwait Cancer Control Center (KCCC), Allergy & Respiratory Specialty Center, and Sabah Al-Ahmad Specialized Urology Center.
2. Materials and Methods
The performance change of Ministry of Health (MoH) general and specialty public hospitals in Kuwait is analyzed over five years between 2015 and 2019 to identify the contextual factors that drive public health system inefficiency using a two-staged data envelopment analysis (DEA) technique. The second-stage Tobit regression is applied to investigate any potential external effects influencing the average technical efficiency scores of MoH hospitals, such as environmental or institutional factors, that may explain possible determinants of systemic public health inefficiency and low performance in government healthcare facilities.
2.1. Evaluating Efficiency in Healthcare
Data Envelopment Analysis (DEA) is a non-parametric, frontier-based approach based on linear programming. It was developed for calculating the relative efficiencies of a set of comparable entities, called Decision Making Units (DMUs), which are evaluated as the ratio of the total weighted output to the total weighted input [9]. In DEA, each hospital is compared against the estimated efficient frontier, which comprises the most efficient hospitals [10].
Based on the thesis introduced in [11], several DEA models have been built to analyze technological efficiency. The CCR model created by [9] is the most well-known of the DEA models; it posits that production has constant returns to scale (CRS). In addition, the BCC model established by [12] under the assumption of variable returns to scale (VRS) has been utilized frequently. The selection of the CCR or BCC model depends on the context of the examined problem (i.e., the technology linking the inputs and outputs in the transformation process) [13].
The CCR model generally stipulates that the efficiency frontier has a constant slope (CRS), meaning that every input change results in an equal output change [14]. When machines are included in the production process, constant returns to scale (CRS) may be implemented, which generally translates to doubling production outputs for each doubling of inputs. When employees (healthcare workers) participate in the process, however, it is unrealistic to expect them to maintain a steady pace. Regardless, it is suggested that DEA analysis is conducted from the decision-maker perspective to measure efficiency regardless of any managerial factors [15].
Since the CRS does not distinguish between scale and pure (managerial) technical efficiency, to which technical efficiency is not regarded as caused by a withdrawal from optimal scale and is thus linked to operations, CCR efficiency assessment may be impacted should our DMUs not be operating on the optimal scale size [16]. If the efficiency analysis is conducted from a management perspective, a BCC technology assumption is better suited for determining the scale of operations or whether the provider’s practice affects productivity [15]. Scale efficiency is defined as the ratio of CRS to VRS efficiency scores, indicating whether the DMU operates on the optimal scale size [17]. Nonetheless, the efficiency of DMUs can be thoroughly examined utilizing both CRS and VRS assumptions for more realistic changes in the production process and real-world implications. Other systematic reviews have revealed comparable results when both CRS and VRS assumptions were used in efficiency measures [18].
2.2. Model Orientation
Input orientation (i.e., outputs are held constant, whereas inputs are minimized in parallel with current outputs) and output orientation (i.e., inputs are held constant, whereas outputs are maximized proportionately with existing inputs) are rationally the most frequently utilized orientations in DEA analysis [2]. Previous empirical studies have argued that hospitals have relatively little control over their outputs (such as expanding surgical procedures or diagnostic tests) but more significant control over their inputs (such as medical devices) due to their social obligation to provide medical care through public hospitals in general [19]. Consequently, most research uses input orientation to evaluate the efficiency of hospitals [20], [21].
2.3. Input & Output Variables
We selected the hospital outputs that depend on the selected inputs, which cover a wide range of health services and health resources used by public hospitals. Notably, three inputs and two outputs were chosen based on the availability of the data in the Kuwaiti MoH context and previously conducted modeling trials. For the 2015-2019 MoH panel data of 15 public hospital units (DMUs), the inputs include: (i) the number of hospital beds; (ii) the number of full-time physicians; and (iii) the number of full-time nurses and midwives. The output variables chosen in this analysis were: (i) total visits (outpatient and emergency visits, accounting for hospitals with Emergency Departments); and (ii) discharges (adjusted for inpatient surgical interventions performed in addition to any non-surgical inpatient treatments).
2.4. Second-Stage Tobit Regression Variables
Exogenous variables (i.e., environmental, and institutional factors) not included in the efficiency model need to be accounted for in an additional analysis since different factors may contribute to inefficiency. The potentially contributing factors are often included in the second stage DEA study to identify possible barriers to efficiency and their impact on inefficient hospitals [22]. The external variables have been selected based on a literature review of the efficiency analysis of public/government hospitals and the effect of these variables on the production of healthcare services [23,24]. Factors that affect the efficiency of public hospitals are classified as institutional (i.e., physician per nurse ratio, hospital size proxied by bed capacity or number of beds), environmental factors (i.e., demographics of the population in the catchment area including under-five population and elderly population, percent of females and non-Kuwaitis), and health status (i.e., cases of under one-year-old deaths, number of external causes of morbidity and mortality) [25].
The following environmental and demographic factors were selected for the second-stage Tobit regression in our MoH DEA analysis of public hospital efficiency: (i) population number in the hospital catchment area (registered residents in selected hospital governorate); (ii) percentage of non-Kuwaiti population (expats need either health insurance or pay minimal fees for service); (iii) percentage of non-Kuwaiti population (free public services for nationals may translate into more healthcare consumption); (iv) percentage of females and percentage of males (different health risks in each gender); (v) proportion of 0-5 years old children and proportion of the elderly population 65 years old and older (vulnerable populations); (vi) number of under one year-old deaths; (vii) number of external causes of morbidity and mortality in catchment area; (viii) hospital bed size dummy variable (hospital beds >372 median bed size = 1, hospital beds <372 = 0); (ix) nurses per hospital bed ratio (nurse staffed beds); and (x) ratio of physician-to-nurses. All data were collected for the 2015-2019 observation period.
3. Analysis
The first stage, input-oriented efficiency analysis for 2015-2019 MoH public government hospitals, is conducted to identify the efficient facilities and evaluate exogenous variables affecting inefficient hospitals from doing things right. Pooling our sample yielded the maximum sample size, creating a balanced panel structure of N = 15 individual MoH hospitals, T = 5-year period between 2015 and 2019, and observations (n) in the dataset being n = N×T for a pooled total of 75 observations that can evaluate overall efficiency change over the period between 2015 and 2019 as depicted in Table 2. Our focus on determining technical inefficiency (CRS scores < 1) implies that the producer (hospital) is not achieving maximum output from a given input combination. It is as if workers or machines were misused, not working at full capacity, or perhaps not cooperating well.
This first-stage DEA identifies the technically inefficient firm (hospital) that falls off its frontier. Technical efficiency (CRS score) can be decomposed into two parts, one due to scale efficiency and the other due to pure technical efficiency (VRS score) [26]. Therefore, when mentioning pure technical efficiency, we refer to a firm’s (or hospital’s) ability to avoid waste by producing as much output as input usage allows or using as little input as output production allows. On the other hand, scale efficiency (SE) refers to the hospital’s ability to work (produce) at its optimal scale [26].
4. Results
4.1. Evaluation of Efficiency: First-Stage DEA Application
In interpreting our analysis in Table 2, we see the pooled average technical efficiency (CRS score) for MOH hospitals over the five years between 2015, and 2019 is 0.79, which is an overall efficiency of 79 percent with a standard deviation (Std. dev.) of 0.01; indicating that without changing current production and keeping efficiency levels as is, Kuwait’s public hospitals could still decrease the usage of all their inputs by 21 percent on average without any compromised reduction in service provision. Also in Table 2, the MoH 2015-2019 pooled average pure technical efficiency (VRS score) is 0.85, or 85 percent, with a Std. Dev. of 0.01, implying that if they run efficiently, the hospitals should decrease 15 percent of inputs for the same volume of outputs.
Annual, cross-sectional evaluations for 2015, 2016, 2017, 2018, and 2019 reveal 6 (40%), 7 (46.6%), 8 (53.3%), 7 (46.6%), and 7 (46.6%) hospitals, respectively, out of 15 hospitals per panel-year were defined as technically efficient.
This essentially means that those same technical efficiency levels per panel year could have still decreased the hospitals’ use of all inputs yearly by 60%, 53.4%, 46.7%, 53.4%, and 53.4%, respectively, while continuing to meet identical levels of healthcare delivery. As for pure technical efficiency for the years 2015, 2016, 2017, 2018, and 2019, 9 (60%), 9 (60%), 9 (60%), 8 (53.3%), and 8 (53.3%) hospitals, respectively, operated at the best efficiency levels with a VRS score of 1.000. These findings indicate further missed opportunities for decreasing annual input resources of up to 40%, 40%, 40%, 46.7%, and 46.7% by simply operating efficiently.
The pooled distribution of hospital observations across technical, purely technical, and scale efficiency scores is shown in Figure 2, showing 35 out of 75 hospital observations (46.7%) pooled for 2015-2019 to be both technically and scale efficient, thus indicating these hospitals utilize their inputs optimally. We also notice from Table 1 that average pure technical efficiency (managerial efficiency) and scale efficiency scores were not identical, with 0.85 and 0.92, respectively. Lastly, regarding returns to scale in Table 2 – other than the facilities operating under CRS – 45.3 percent of hospital observations in our pooled 2015-2019 dataset operated under increasing returns to scale (IRS) and 8 percent under decreasing returns to scale (DRS).
Hospitals operating on either IRS or DRS must adjust their capacity to run on their optimal scale size (i.e., at the CRS, which would be required to achieve technical efficiency and operate at their most productive size). As dimensions under the variable return to scale (VRS) assumption and not constant return to scale, IRS means a 1 percent increase in inputs will be followed by more than a 1 percent increase in outputs. In contrast, DRS means a 1 percent increase in inputs will result in less than a 1 percent increase in outputs [12]. Consequently, the 44 observed hospitals showing IRS suggests these facilities should expand their scale to become scale efficient. In comparison, the other six observed hospitals with DRS should scale down to become scale efficient. Since management (managerial) efficiency refers to using correct and optimal methods for management, it is crucial to measure management’s ability to save inputs to produce a particular volume of outputs, or to produce more outputs given a set of inputs, since it is associated with managerial decisions or bad managerial practices [27].
Strategic institutional decisions, among other resolutions on clinical care services and their delivery, are reached primarily by administrative procedures and guidelines, whereby management in Kuwait’s public hospitals are appointed mainly by the MoH, without well-designed mechanisms or well-defined regulations. Therefore, as indicated by [28], the lack of clearly defined rights and responsibility increases their subjectivity in decision-making, decreasing the quality of management practices and further influencing pure technical efficiency.
Our performance analysis also identified the slacks, which were either excess input utilization or shortages of output production. Slacks represent only the leftover portions of inefficiencies; after proportional reductions in inputs or increases in outputs, if a DMU cannot reach the efficiency frontier (to its efficient target), slacks are needed to push the DMU to the boundary (target) [29]. Therefore, inefficiently used inputs or not sufficiently produced outputs could be determined by healthcare management. In general, we should consider decision-making units (DMUs) truly efficient when our DEA score equals one (1) and all slacks are zero (0). If only the first condition is satisfied, then, as we have been doing above, the DMU (hospital unit) is called efficient in terms of ‘technical efficiency.’ Only when both conditions are satisfied (DEA score is one, all slacks equal zero) would we then deem the hospital DMU in our sample as efficient in terms of ‘strong’ efficiency [30].
The following empirical data in Table 3 reveals the mean pooled quantity of slack over five years in inefficient hospitals (<0.1, or under 100% efficiency). These are the values of the variables corresponding to the slack variables in the envelopment model. The variables show the scope for improving input and output values after the changes in input and output levels corresponding to the optimal value of the objective function. The findings combine the slack for all inefficient (TE scores <1) government public hospitals, stratified by inputs and outputs. Table 3 also demonstrates the average percent change (slacks) in the number of inputs or outputs required to eliminate the inefficiencies and achieve target levels. Nevertheless, we recognize that DEA results, in general, should be interpreted with caution to avoid providing any false, non-evidence-based claims for efficiency improvement and making inappropriate recommendations.
4.2. Determinants of Inefficiency: Second-Stage Tobit Regression
The Tobit regression (a censored regression model in econometric analysis) was used to relate technical efficiency scores to the external variables and some organizational factors of hospitals that may help explain potential unobservable forces behind the optimum performance. After obtaining input-oriented CRS scores of technical efficiency for each hospital in the first-stage DEA, specific institutional and environmental explanatory variables identified under 2.4 in the Materials and Methods section are included in the second-stage Tobit regression model to empirically isolate potential factor(s) with statistically significant influence on the dependent variable of technical efficiency. Explanatory variables are chosen based on: (i) data availability; and (ii) most likely mediating factors that may influence the production process in hospitals and potentially drive (in)efficiency. The results of the Tobit regression are displayed in Table 4, where standard errors are adjusted for clustered observations.
5. Discussion
The resulting regression coefficients in Table 4, coupled with the level of statistical significance for each variable, reveal: the above dummy variable indicative of each hospital’s capacity in terms of having >372 beds and also a proxy for actual hospital size (p ≤0.01), as well as the independent variable determinant of each hospital’s physician-to-nurse ratio (p ≤0.05), are found to be positively related with the CRS technical efficiency scores of hospital observations with a 1% and 5% level of significance, respectively; meaning that larger-sized hospitals with a more significant quantity of bed capacity (having >372 functional hospital beds for use at the time of analysis), as well as a 48.2 percent increase in a hospital’s physician per nurse ratio, are expected to yield higher technical efficiency and better hospital performance, thus, representing potential pursuits as favorable indicators in operational productivity improvement.
Since these two variables maintained their narrow estimated margins of accuracy even after an empirical robustness check, nor have they lost their statistical significance when regressed on bootstrap-adjusted CRS technical efficiency scores, we accept the regression coefficients of both variables and consider them to be strong correlates of hospital efficiency once adjusted for bias. As for the coefficient of the catchment area population variable (p ≤0.01), we see a negative association with a hospital’s CRS technical efficiency score with a highly reliable 1% level of significance; however, the coefficient result itself for this independent variable as an environmental factor impacting hospital efficiency is -1.59x10-06 (or -0.00000159) and so although statistically significant, it is deemed as immaterial.
The coefficients reported as negative values in Table 4 suggest their associated institutional or environmental factors represented by the independent variables that are regressed in the Tobit statistical model, indeed affect hospital efficiency adversely in the opposite direction (negative correlation). The Tobit regression indicates that when the proportion of non-Kuwaiti residents in an inefficient hospital’s catchment area population decreases by 20.83 percent, technical efficiency scores in those specific hospitals are expected to increase and achieve technical efficiency holding all other variables constant, suggesting that Kuwait’s modest public health sector and overall health system has noticeable limitations in dealing with a wide range of various medical conditions not commonly found or necessarily prevalent in the region yet is a certainty in any diverse, internationally representative population but seems to be negatively and significantly (p ≤0.05) driving inefficiency and possibly impacting public government hospital operations, production process, and performance productivity between 2015 and 2019.
Nevertheless, it is noteworthy that coefficients from Tobit regressions with dummy variables are not readily interpretable as effect sizes. Still, a preliminary interpretation of these coefficients can assess the negative or positive sign of the coefficient and whether it is statistically significant as a baseline for future efficiency improvement strategies. That said, considering the number of efficient government-owned general or specialized hospitals in Kuwait’s public health sector, study findings can prove helpful in drawing relevant and evidence-based conclusions from coefficient values.
6. Conclusion
With healthcare forming an increasing share of Kuwait’s GDP, government health expenditure has heightened concerns about fiscal sustainability and productivity of the public health sector. In allocating government funds for goods and services, societies spending more on healthcare, in effect, opt to invest in human capital in the form of health, where health status influences labor inputs and contributes to the production of goods and economic growth. Thus, health spending must be viewed, at least in part, as an investment rather than an expense such that a high return on investment suggests investment’s gains compare favorably to its cost.
This empirical evidence-based study began with a theoretical analysis of the inherent challenges in measuring health system efficiency. Considering the non-market context of public healthcare delivery, offering the necessary incentives for productivity improvement is difficult. On the one hand, one would believe it reasonably simple for policymakers to design more efficient health systems and for hospital management to push efficiency within such systems. However, the obstacles involved are not theoretical but rather practical, such as whether inputs and outputs are measured correctly and if the right incentives are in place to ensure managers can achieve efficiencies once identified [31].
This analysis first estimates the technical efficiency of public healthcare services in government-funded, MoH-operated general and specialized hospitals in the State of Kuwait over a five-year observation window from 2015 to 2019 in terms of outputs; the analysis then turns to the drivers of inefficiency in the delivery of care (or the barriers to efficiency in healthcare services), as an understanding of these factors and the types of inefficiencies that arise in the health system is essential to the development of measures of productivity and optimal hospital performance benchmarks that can assist managers and policymakers in identifying then rectifying inefficiencies.
Author Contributions
Conceptualization, Aljawhara Alsabah and Naser Alsabti; Data curation, Aljawhara Alsabah; Formal analysis, Aljawhara Alsabah; Investigation, Aljawhara Alsabah; Methodology, Aljawhara Alsabah; Resources, Naser Alsabti; Software, Aljawhara Alsabah; Supervision, Naser Alsabti; Validation, Naser Alsabti; Visualization, Aljawhara Alsabah; Writing – original draft, Aljawhara Alsabah; Writing – review & editing, Aljawhara Alsabah and Naser Alsabti.
Funding
This research received no external funding.
Data Availability Statement
The original data presented in the study are openly available in the health information repository of the State of Kuwait’s Central Administration of Statistics – Central Statistical Bureau https://www.csb.gov.kw/Pages/Statistics?ID=59&ParentCatID=70.
Acknowledgments
Much thanks are owed to the graduate faculty at New York Medical College (NYMC) – School of Health Sciences and Practice & Institute of Public Health. The valuable input and constant support by the Department of Public Health at NYMC were of great help throughout this research project.
Conflicts of Interest
The authors declare no conflict of interest.
References
- Yip, W. , Hafez R., “Improving Health System Efficiency: Reforms For Improving the Efficiency of Health Systems (Lessons From 10 Country Cases),” World Health Organization. https://apps.who.int/iris/handle/10665/185989 (accessed Nov. 24, 2022).
- Alatawi, A.D.; Niessen, L.W.; Khan, J.A.M. Efficiency evaluation of public hospitals in Saudi Arabia: an application of data envelopment analysis. BMJ Open 2020, 10, e031924. [Google Scholar] [CrossRef] [PubMed]
- Tasnim, N.; Afzal, M.N.I. An empirical investigation of country level efficiency and national systems of entrepreneurship using Data Envelopment Analysis (DEA) and the TOBIT model. J. Glob. Entrep. Res. 2018, 8, 37. [Google Scholar] [CrossRef]
- Ebaid, A.; Bahari, Z. The Nexus between Government Expenditure and Economic Growth: Evidence of the Wagner’s Law in Kuwait. Rev. Middle East Econ. Finance 2019, 15. [Google Scholar] [CrossRef]
- Alsabah, A.M.; Haghparast-Bidgoli, H.; Skordis, J. Measuring the Efficiency of Public Hospitals in Kuwait: A Two-Stage Data Envelopment Analysis and a Qualitative Survey Study. Glob. J. Heal. Sci. 2020, 12, p121. [Google Scholar] [CrossRef]
- de la Perrelle, L.; Radisic, G.; Cations, M.; Kaambwa, B.; Barbery, G.; Laver, K. Costs and economic evaluations of Quality Improvement Collaboratives in healthcare: a systematic review. BMC Heal. Serv. Res. 2020, 20, 1–10. [Google Scholar] [CrossRef]
- Bibbee, A. , Padrini F., “Balancing Health Care Quality and Cost Containment,” Organization for Economic Cooperation and Development. https://www.oecd-ilibrary.org/content/paper/557213833552 (acessed Nov. 12, 2022).
- Balkhi, B.; Alshayban, D.; Alotaibi, N.M. Impact of Healthcare Expenditures on Healthcare Outcomes in the Middle East and North Africa (MENA) Region: A Cross-Country Comparison, 1995–2015. Front. Public Heal. 2021, 8. [Google Scholar] [CrossRef]
- Charnes, A.; Cooper, W.W.; Rhodes, E. Measuring the efficiency of decision making units. Eur. J. Oper. Res. 1978, 2, 429–444. [Google Scholar] [CrossRef]
- A Kiadaliri, A.; Jafari, M.; Gerdtham, U.-G. Frontier-based techniques in measuring hospital efficiency in Iran: a systematic review and meta-regression analysis. BMC Heal. Serv. Res. 2013, 13, 312–312. [Google Scholar] [CrossRef]
- Farrell M., J. , “The measurement of productive efficiency,” Journal of the Royal Statistical Society, vol. 120, 1957. http://www.jstor. 2343. [Google Scholar]
- Banker, R.D.; Charnes, A.; Cooper, W.W. Some Models for Estimating Technical and Scale Inefficiencies in Data Envelopment Analysis. Manag. Sci. 1984, 30, 1078–1092. [Google Scholar] [CrossRef]
- Al-Hanawi, M.K.; Makuta, I.F. Changes in productivity in healthcare services in the Kingdom of Saudi Arabia. Cost Eff. Resour. Alloc. 2022, 20, 1–8. [Google Scholar] [CrossRef]
- Banker R., D. , Cooper W. W., Seiford L. M., Zhu J., “Returns to scale in DEA" in Handbook on Data Envelopment Analysis, 2nd ed, Springer, 2011, pp. 41-70.
- Gok, M.S.; Sezen, B. Analyzing the Efficiencies of Hospitals: An Application of Data Envelopment Analysis. J. Glob. Strat. Manag. 2011, 2, 137–137. [Google Scholar] [CrossRef]
- Hollingsworth, B. Non-Parametric and Parametric Applications Measuring Efficiency in Health Care. Heal. Care Manag. Sci. 2003, 6, 203–218. [Google Scholar] [CrossRef] [PubMed]
- Varabyova, Y.; Müller, J.-M. The efficiency of health care production in OECD countries: A systematic review and meta-analysis of cross-country comparisons. Heal. Policy 2016, 120, 252–263. [Google Scholar] [CrossRef] [PubMed]
- Cantor, V.J.M.; Poh, K.L. Integrated Analysis of Healthcare Efficiency: A Systematic Review. J. Med Syst. 2017, 42, 8–8. [Google Scholar] [CrossRef]
- Abou El-Seoud M., S. , “Measuring efficiency of reformed public hospitals in Saudi Arabia: An application of data envelopment analysis,” International Journal of Economics and Management Sciences, vol. 33, no. 1, pp. 36-62, 2013. [CrossRef]
- O’neill, L.; Rauner, M.; Heidenberger, K.; Kraus, M. A cross-national comparison and taxonomy of DEA-based hospital efficiency studies. Socio-Economic Plan. Sci. 2008, 42, 158–189. [Google Scholar] [CrossRef]
- Tynkkynen, L.-K.; Vrangbæk, K. Comparing public and private providers: a scoping review of hospital services in Europe. BMC Heal. Serv. Res. 2018, 18, 1–14. [Google Scholar] [CrossRef] [PubMed]
- Lin, C.-S.; Chiu, C.-M.; Huang, Y.-C.; Lang, H.-C.; Chen, M.-S. Evaluating the Operational Efficiency and Quality of Tertiary Hospitals in Taiwan: The Application of the EBITDA Indicator to the DEA Method and TOBIT Regression. Healthcare 2021, 10, 58. [Google Scholar] [CrossRef]
- Ganeshkumar, P.; Gopalakrishnan, S. Systematic reviews and meta-analysis: Understanding the best evidence in primary healthcare. J. Fam. Med. Prim. Care 2013, 2, 9–14. [Google Scholar] [CrossRef] [PubMed]
- Grant, M.J.; Booth, A. A typology of reviews: an analysis of 14 review types and associated methodologies. Health Inf. Libr. J. 2009, 26, 91–108. [Google Scholar] [CrossRef]
- Alatawi, A.D.; Niessen, L.W.; Khan, J.A.M. Determinants of Technical Efficiency in Public Hospitals: The Case of Saudi Arabia. Heal. Econ. Rev. 2020, 10, 1–11. [Google Scholar] [CrossRef]
- Parker, D.; Newbrander, W. Tackling wastage and inefficiency in the health sector. World Health Forum. 1994, 15, 107. [Google Scholar] [PubMed]
- Demerjian, P.; Lev, B.; McVay, S. Quantifying Managerial Ability: A New Measure and Validity Tests. Manag. Sci. 2012, 58, 1229–1248. [Google Scholar] [CrossRef]
- Wei, C.-K.; Chen, L.-C.; Li, R.-K.; Tsai, C.-H. Using the DEA-R model in the hospital industry to study the pseudo-inefficiency problem. Expert Syst. Appl. 2011, 38, 2172–2176. [Google Scholar] [CrossRef]
- Zyphur M., J. , Zhang Z., Preacher K. J., Bird L. J., Humphrey S. E., LeBreton J. M., "The handbook of multilevel theory, measurement, and analysis, 1st ed, American Psychological Association, 2018.
- Coelli T., J. , Rao D. S. P., O’Donnell C. J., Battese G. E., "An introduction to efficiency and productivity analysis. 2nd ed, Springer, 2005.
- Sarkis, J.; Talluri, S. Efficiency measurement of hospitals: issues and extensions. Int. J. Oper. Prod. Manag. 2002, 22, 306–313. [Google Scholar] [CrossRef]
1 No slacks were reported for the discharges output variable. The amount of slack for each inefficient hospital, along with their target values show precise inputs and outputs quantities each inefficient hospital should aim to reach for that hospital to achieve full efficiency. It is not provided in this paper due to limited publication space. |
2 *P ≤0.10, 10% level of significance. **P ≤0.05, 5% level of significance. ***P ≤0.01, 1% level of significance. Standard errors are adjusted for clustered observations. |
Figure 1.
Trend in Current Health Expenditure Per Capita (Current USD) in Kuwait, 2010-2019 Fiscal Year.
Figure 1.
Trend in Current Health Expenditure Per Capita (Current USD) in Kuwait, 2010-2019 Fiscal Year.
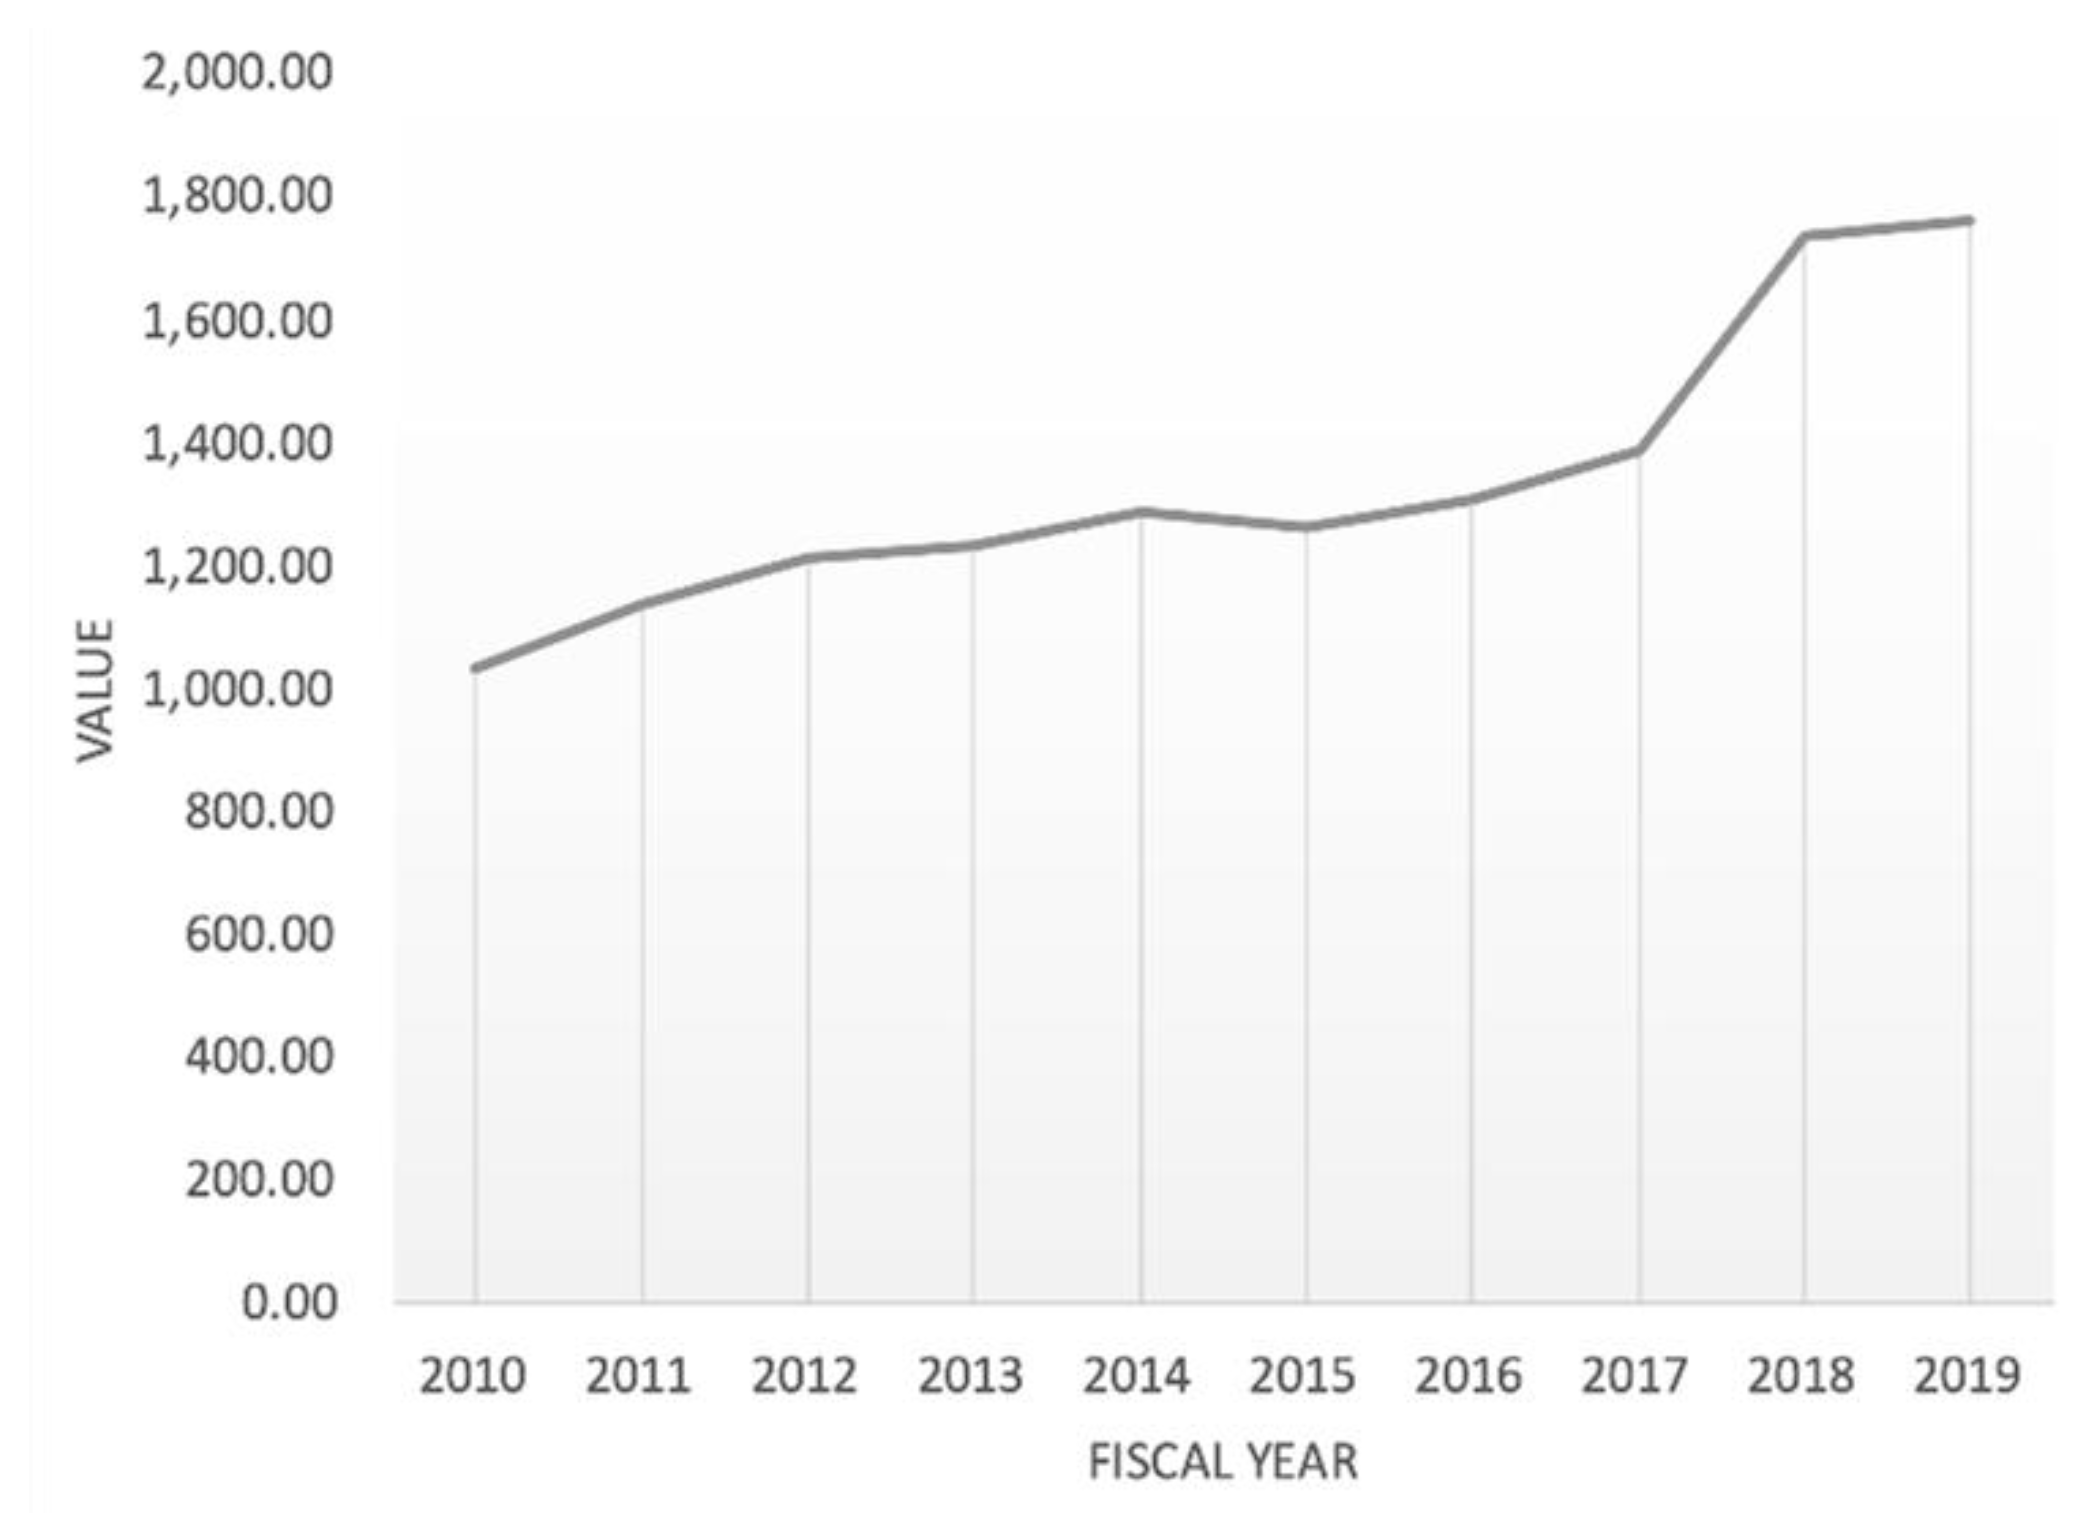
Figure 2.
Distribution of Hospital Observations Across Efficiency Scores of Technical (CRS), Pure (VRS), and Scale Efficiencies for 2015-2019.
Figure 2.
Distribution of Hospital Observations Across Efficiency Scores of Technical (CRS), Pure (VRS), and Scale Efficiencies for 2015-2019.
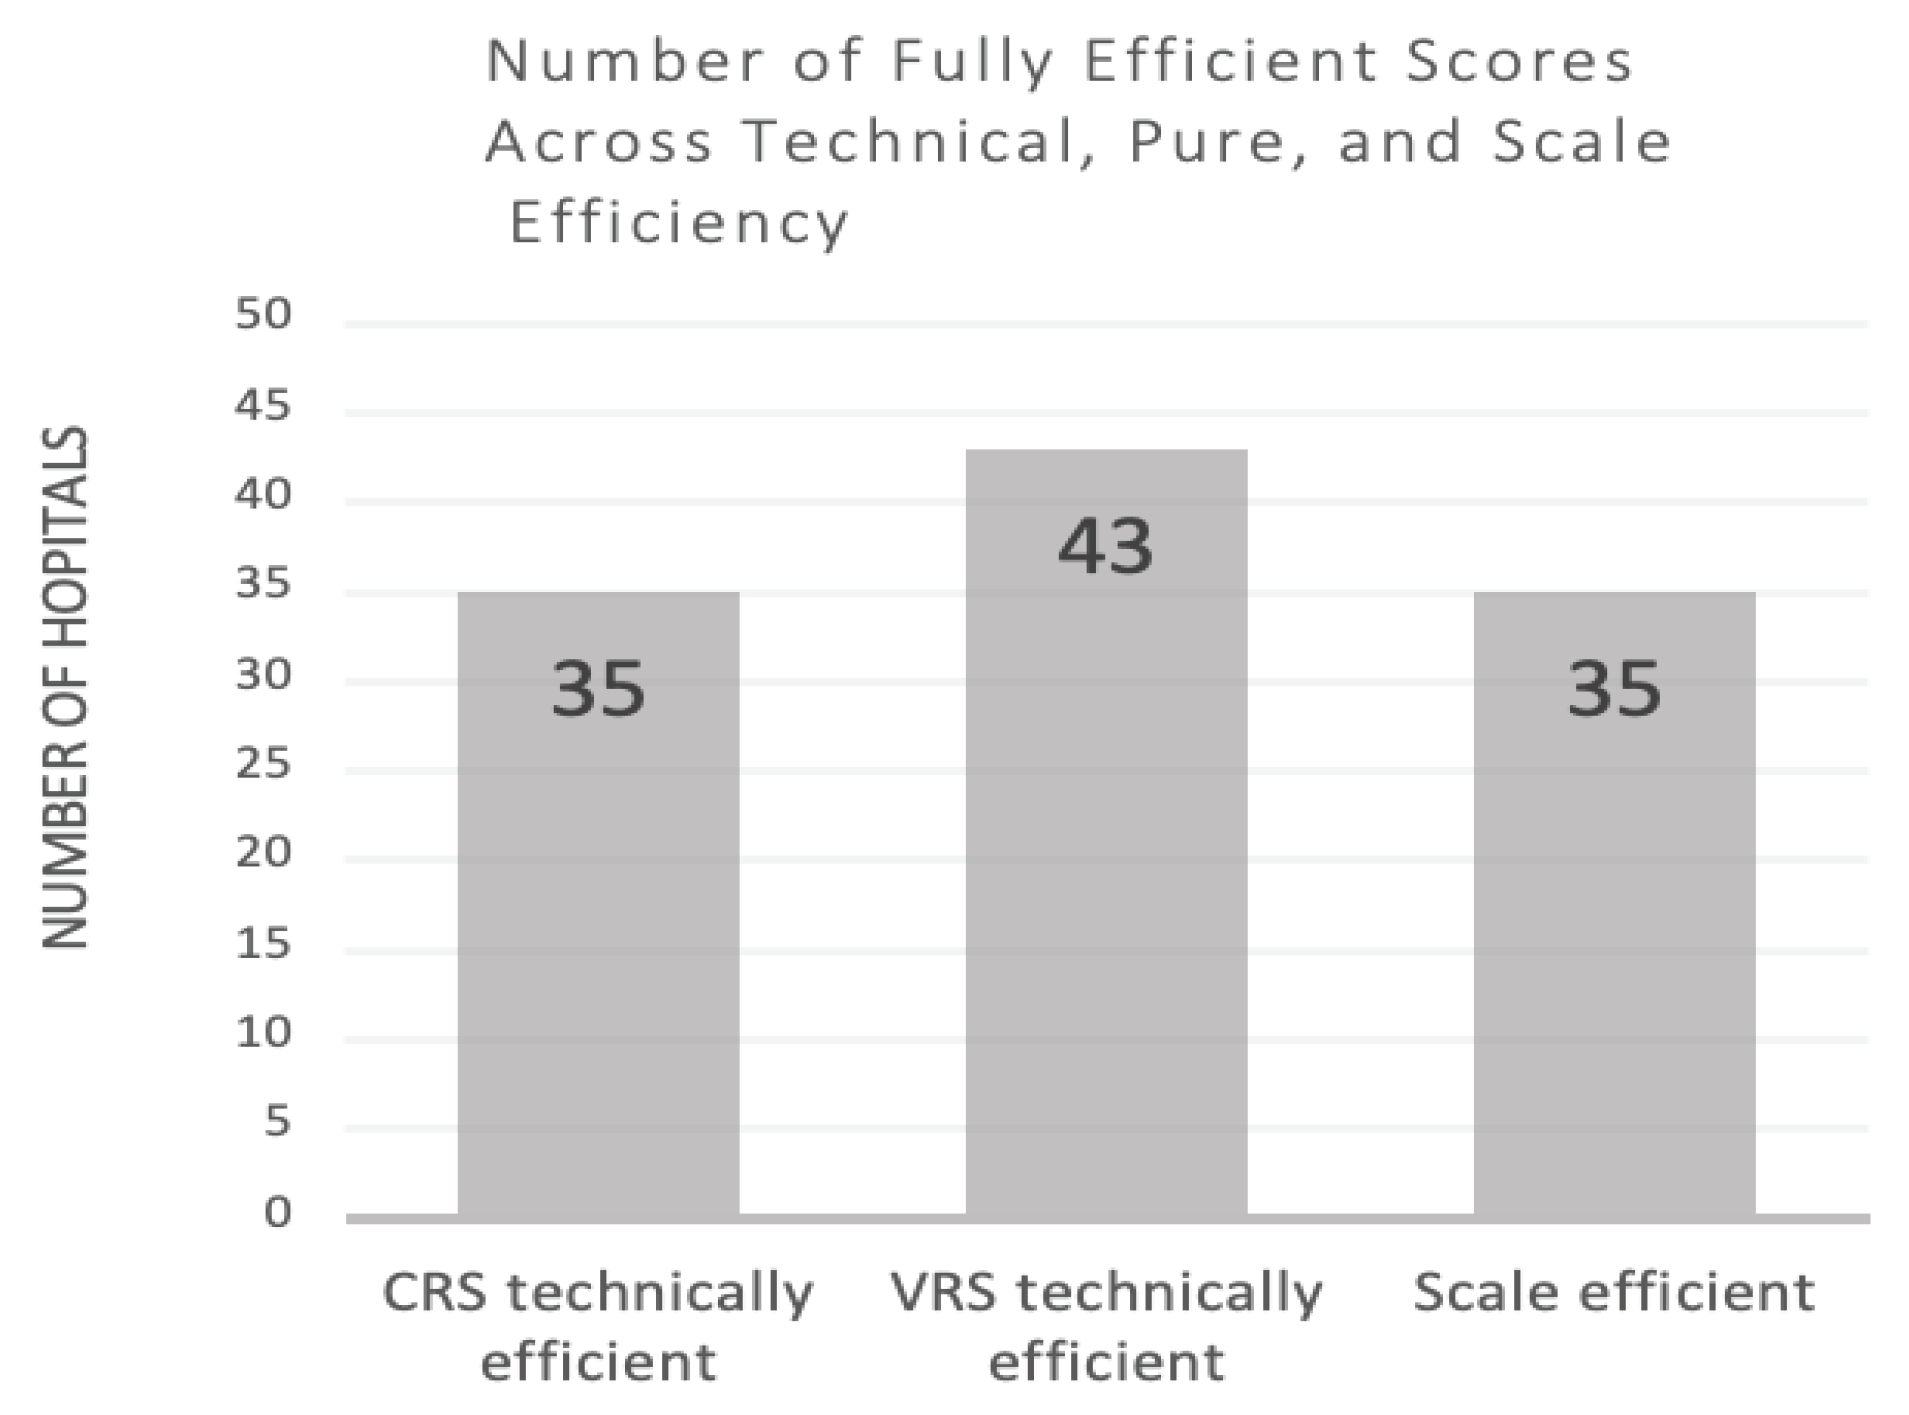

Table 1.
Numerical Values of Current Health Expenditure Per Capita (Current USD) in Kuwait, 2010-2019 Fiscal Year.
Table 1.
Numerical Values of Current Health Expenditure Per Capita (Current USD) in Kuwait, 2010-2019 Fiscal Year.
| DATE | VALUE | CHANGE % |
|---|---|---|
| 2019 | 1,758.67 | 1.43% |
| 2018 | 1,733.81 | 25.22% |
| 2017 | 1,384.58 | 5.85% |
| 2016 | 1,308.11 | 3.89% |
| 2015 | 1,259.18 | -2.01% |
| 2014 | 1,285.01 | 4.58% |
| 2013 | 1,228.77 | 1.34% |
| 2012 | 1,212.57 | 6.89% |
| 2011 | 1,134.39 | 9.77% |
| 2010 | 1,033.38 | 1.65% |
Table 2.
Technical Efficiency Scores and Returns to Scale of MoH Public Hospitals in Kuwait.
| CRS technical efficiency | VRS technical efficiency | Scale efficiency | RTS | Public hospital type | |
|---|---|---|---|---|---|
| 2015 | |||||
| Al-Adan | 1.00 | 1.00 | 1.00 | CRS | General |
| Al-Amiri | 0.78 | 0.80 | 0.98 | IRS | General |
| Al-Farwaniya | 1.00 | 1.00 | 1.00 | CRS | General |
| Al-Jahra | 1.00 | 1.00 | 1.00 | CRS | General |
| Al-Sabah | 0.98 | 1.00 | 0.98 | IRS | General |
| Mubarak Al-Kabir | 0.80 | 0.81 | 0.98 | DRS | General |
| Al-Razi | 0.70 | 0.70 | 1.00 | IRS | Specialized |
| Physical Med. & Rehab Facility | 1.00 | 1.00 | 1.00 | CRS | Specialized |
| Maternity Hospital | 0.99 | 1.00 | 0.99 | DRS | Specialized |
| Chest Diseases Hospital | 0.52 | 0.57 | 0.92 | IRS | Specialized |
| Infectious Disease Facility | 0.33 | 0.56 | 0.59 | IRS | Specialized |
| Ibn Sina Hospital | 1.00 | 1.00 | 1.00 | CRS | Specialized |
| Kuwait Cancer Control Center | 0.45 | 0.55 | 0.81 | IRS | Specialized |
| Allergy & Respiratory Center | 1.00 | 1.00 | 1.00 | CRS | Specialized |
| Sabah Al-Ahmad Urology Center | 0.50 | 1.00 | 0.50 | IRS | Specialized |
| Average | 0.80 | 0.87 | 0.92 | ----- | ----- |
| 2016 | |||||
| Al-Adan Hospital | 1.00 | 1.00 | 1.00 | CRS | General |
| Al-Amiri Hospital | 0.85 | 0.88 | 0.96 | IRS | General |
| Al-Farwaniya Hospital | 1.00 | 1.00 | 1.00 | CRS | General |
| Al -Jahra Hospital | 1.00 | 1.00 | 1.00 | CRS | General |
| Al-Sabah Hospital | 0.98 | 1.00 | 0.98 | IRS | General |
| Mubarak Al-Kabir Hospital | 0.78 | 0.78 | 1.00 | IRS | General |
| Al-Razi Hospital | 0.64 | 0.64 | 1.00 | DRS | Specialized |
| Physical Med. & Rehab Facility | 1.00 | 1.00 | 1.00 | CRS | Specialized |
| Maternity Hospital | 1.00 | 1.00 | 1.00 | CRS | Specialized |
| Chest Diseases Hospital | 0.46 | 0.50 | 0.91 | IRS | Specialized |
| Infectious Disease Facility | 0.30 | 0.53 | 0.56 | IRS | Specialized |
| Ibn Sina Hospital | 1.00 | 1.00 | 1.00 | CRS | Specialized |
| Kuwait Cancer Control Center | 0.37 | 0.47 | 0.78 | IRS | Specialized |
| Allergy & Respiratory Center | 1.00 | 1.00 | 1.00 | CRS | Specialized |
| Sabah Al-Ahmad Urology Center | 0.47 | 1.00 | 0.47 | IRS | Specialized |
| Average | 0.79 | 0.85 | 0.91 | ----- | ----- |
| 2017 | |||||
| Al-Adan Hospital | 1.00 | 1.00 | 1.00 | CRS | General |
| Al-Amiri Hospital | 0.68 | 0.71 | 0.96 | IRS | General |
| Al-Farwaniya Hospital | 1.00 | 1.00 | 1.00 | CRS | General |
| Al -Jahra Hospital | 1.00 | 1.00 | 1.00 | CRS | General |
| Al-Sabah Hospital | 1.00 | 1.00 | 1.00 | CRS | General |
| Mubarak Al-Kabir Hospital | 0.75 | 0.75 | 1.00 | IRS | General |
| Al-Razi Hospital | 0.68 | 0.70 | 0.97 | DRS | Specialized |
| Physical Med. & Rehab Facility | 1.00 | 1.00 | 1.00 | CRS | Specialized |
| Maternity Hospital | 1.00 | 1.00 | 1.00 | CRS | Specialized |
| Chest Diseases Hospital | 0.47 | 0.52 | 0.91 | IRS | Specialized |
| Infectious Disease Facility | 0.42 | 0.63 | 0.67 | IRS | Specialized |
| Ibn Sina Hospital | 1.00 | 1.00 | 1.00 | CRS | Specialized |
| Kuwait Cancer Control Center | 0.37 | 0.46 | 0.80 | IRS | Specialized |
| Allergy & Respiratory Center | 1.00 | 1.00 | 1.00 | CRS | Specialized |
| Sabah Al-Ahmad Urology Center | 0.62 | 1.00 | 0.62 | IRS | Specialized |
| Average | 0.80 | 0.85 | 0.93 | ----- | ----- |
| 2018 | |||||
| Al-Adan Hospital | 1.00 | 1.00 | 1.00 | CRS | General |
| Al-Amiri Hospital | 0.76 | 0.77 | 0.98 | IRS | General |
| Al-Farwaniya Hospital | 1.00 | 1.00 | 1.00 | CRS | General |
| Al -Jahra Hospital | 1.00 | 1.00 | 1.00 | CRS | General |
| Al-Sabah Hospital | 1.00 | 1.00 | 1.00 | CRS | General |
| Mubarak Al-Kabir Hospital | 0.77 | 0.77 | 0.99 | IRS | General |
| Al-Razi Hospital | 0.69 | 0.72 | 0.96 | IRS | Specialized |
| Physical Med. & Rehab Facility | 1.00 | 1.00 | 1.00 | CRS | Specialized |
| Maternity Hospital | 1.00 | 1.00 | 1.00 | CRS | Specialized |
| Chest Diseases Hospital | 0.53 | 0.57 | 0.92 | IRS | Specialized |
| Infectious Disease Facility | 0.44 | 0.73 | 0.60 | IRS | Specialized |
| Ibn Sina Hospital | 0.86 | 0.88 | 0.98 | IRS | Specialized |
| Kuwait Cancer Control Center | 0.36 | 0.45 | 0.81 | IRS | Specialized |
| Allergy & Respiratory Center | 1.00 | 1.00 | 1.00 | CRS | Specialized |
| Sabah Al-Ahmad Urology Center | 0.46 | 1.00 | 0.46 | IRS | Specialized |
| Average | 0.791 | 0.860 | 0.914 | ----- | ----- |
| 2019 | |||||
| Al-Adan Hospital | 1.00 | 1.00 | 1.00 | CRS | General |
| Al-Amiri Hospital | 0.66 | 0.68 | 0.97 | IRS | General |
| Al-Farwaniya Hospital | 1.00 | 1.00 | 1.00 | CRS | General |
| Al -Jahra Hospital | 1.00 | 1.00 | 1.00 | CRS | General |
| Al-Sabah Hospital | 0.89 | 0.92 | 0.97 | IRS | General |
| Mubarak Al-Kabir Hospital | 0.72 | 0.73 | 0.98 | DRS | General |
| Al-Razi Hospital | 0.84 | 0.87 | 0.97 | DRS | Specialized |
| Physical Med. & Rehab Facility | 1.00 | 1.00 | 1.00 | CRS | Specialized |
| Maternity Hospital | 1.00 | 1.00 | 1.00 | CRS | Specialized |
| Chest Diseases Hospital | 0.45 | 0.49 | 0.92 | IRS | Specialized |
| Infectious Disease Facility | 0.28 | 0.56 | 0.50 | IRS | Specialized |
| Ibn Sina Hospital | 1.00 | 1.00 | 1.00 | CRS | Specialized |
| Kuwait Cancer Control Center | 0.35 | 0.43 | 0.82 | IRS | Specialized |
| Allergy & Respiratory Center | 1.00 | 1.00 | 1.00 | CRS | Specialized |
| Sabah Al-Ahmad Urology Center | 0.57 | 1.00 | 0.57 | IRS | Specialized |
| Average | 0.78 | 0.84 | 0.91 | ----- | ----- |
| Pooled 2015-2019 sample (N=75 observations) | |||||
| CRS technical efficiency | VRS technical efficiency |
Scale efficiency |
IRS [N (%)] |
DRS [N (%)] |
|
| Mean | 0.79 | 0.85 | 0.92 | 34 (45.3%) | 6 (8%) |
| Std. dev. | 0.01 | 0.01 | 0.01 | ||
| Min. | 0.78 | 0.84 | 0.91 | ||
| No. of fully efficient scores | 35 (46.7%) |
43 (57.3%) | 35 (46.7%) |
||
Note. RTS, returns to scale; CRS, constant returns to scale; VRS, variable returns to scale; DRS, decreasing returns to scale; IRS, increasing returns to scale.
Table 3.
Evaluation of Pooled Slacks in Inefficient MoH Public Hospitals in Kuwait 1.
| Input Slacks | Mean difference of values from targets | Standard Deviation |
Percent change to target |
|---|---|---|---|
| Hospital Beds | 67.10 | 77.76 | -16.37 |
| Physicians | 75.71 | 124.83 | -18.83 |
| Nurses | 169.23 | 212.93 |
-16.84 |
| Output Slacks | |||
| Outpatient & Emergency Visits | 4955.39 |
30509.59 |
1.13 |
Table 4.
Second-Stage Tobit Regression Analysis 2.
| Explanatory Variables | Tobit Regression Coefficient |
|---|---|
| Hospitalbeds >327 (dummy variable for capacity) | 0.263*** |
| Catchment area population(n) | -0.00000159*** |
| External causes of morbidity & mortality in catchment area(n) | -0.0584 |
| <1 yr olddeaths in catchment (n) | 0.04891 |
| Females (%) | -0.0965* |
| Non-Kuwaitis (%) | -0.2083** |
| Children <5 years (%) | -3.632 |
| Elderly ≥65 years (%) | -21.107* |
| Physician-to-nurse ratio | 0.482** |
| Nurses per bed ratio | -0.0024* |
| _Constant | 2.906*** |
| Wald chi2(10) | 43.35 |
| Prob > chi2 | 0.0000*** |
| Log pseudolikelihood | -4.986 |
Disclaimer/Publisher’s Note: The statements, opinions and data contained in all publications are solely those of the individual author(s) and contributor(s) and not of MDPI and/or the editor(s). MDPI and/or the editor(s) disclaim responsibility for any injury to people or property resulting from any ideas, methods, instructions or products referred to in the content. |
© 2024 by the authors. Licensee MDPI, Basel, Switzerland. This article is an open access article distributed under the terms and conditions of the Creative Commons Attribution (CC BY) license (https://creativecommons.org/licenses/by/4.0/).
Copyright: This open access article is published under a Creative Commons CC BY 4.0 license, which permit the free download, distribution, and reuse, provided that the author and preprint are cited in any reuse.


