Submitted:
27 March 2024
Posted:
29 March 2024
You are already at the latest version
Abstract
Keywords:
1. Introduction
2. Results and Discussion
2.1. Continuous FBR Performance
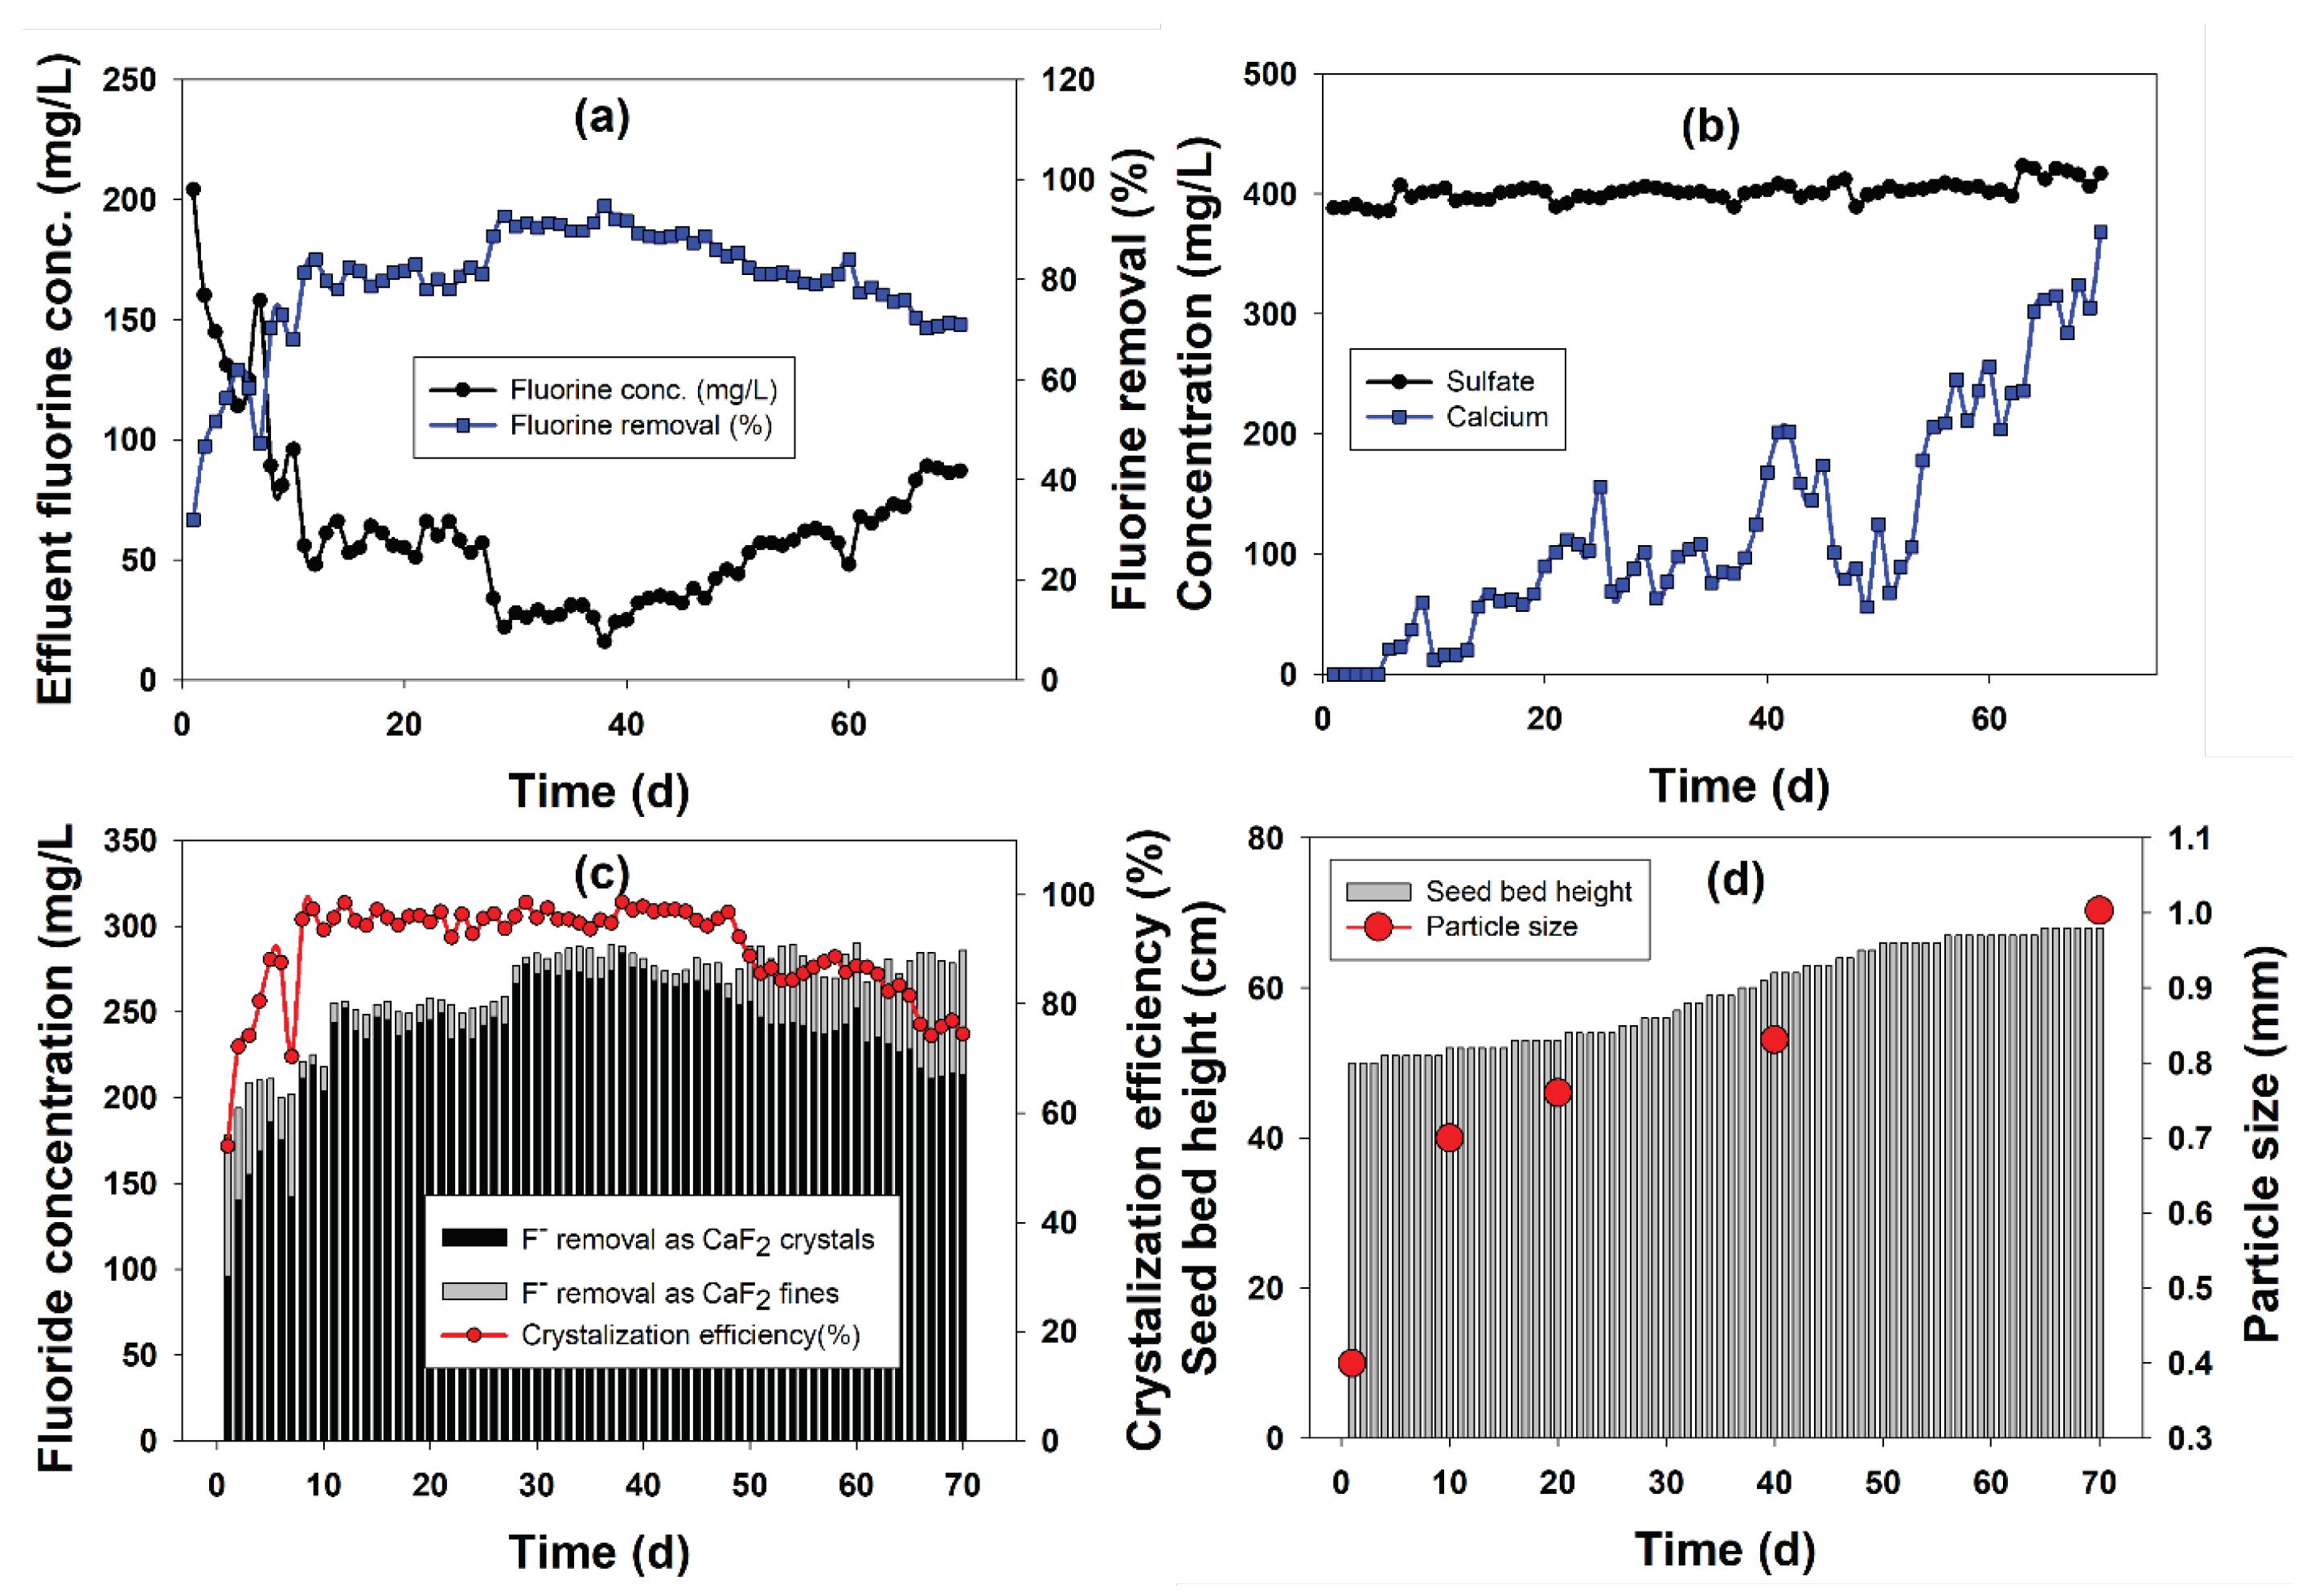
2.1.1. Fluoride Removal
2.1.2. Calcium and Sulfate Profile during FBR Operation
2.1.3. Crystallization Efficiency
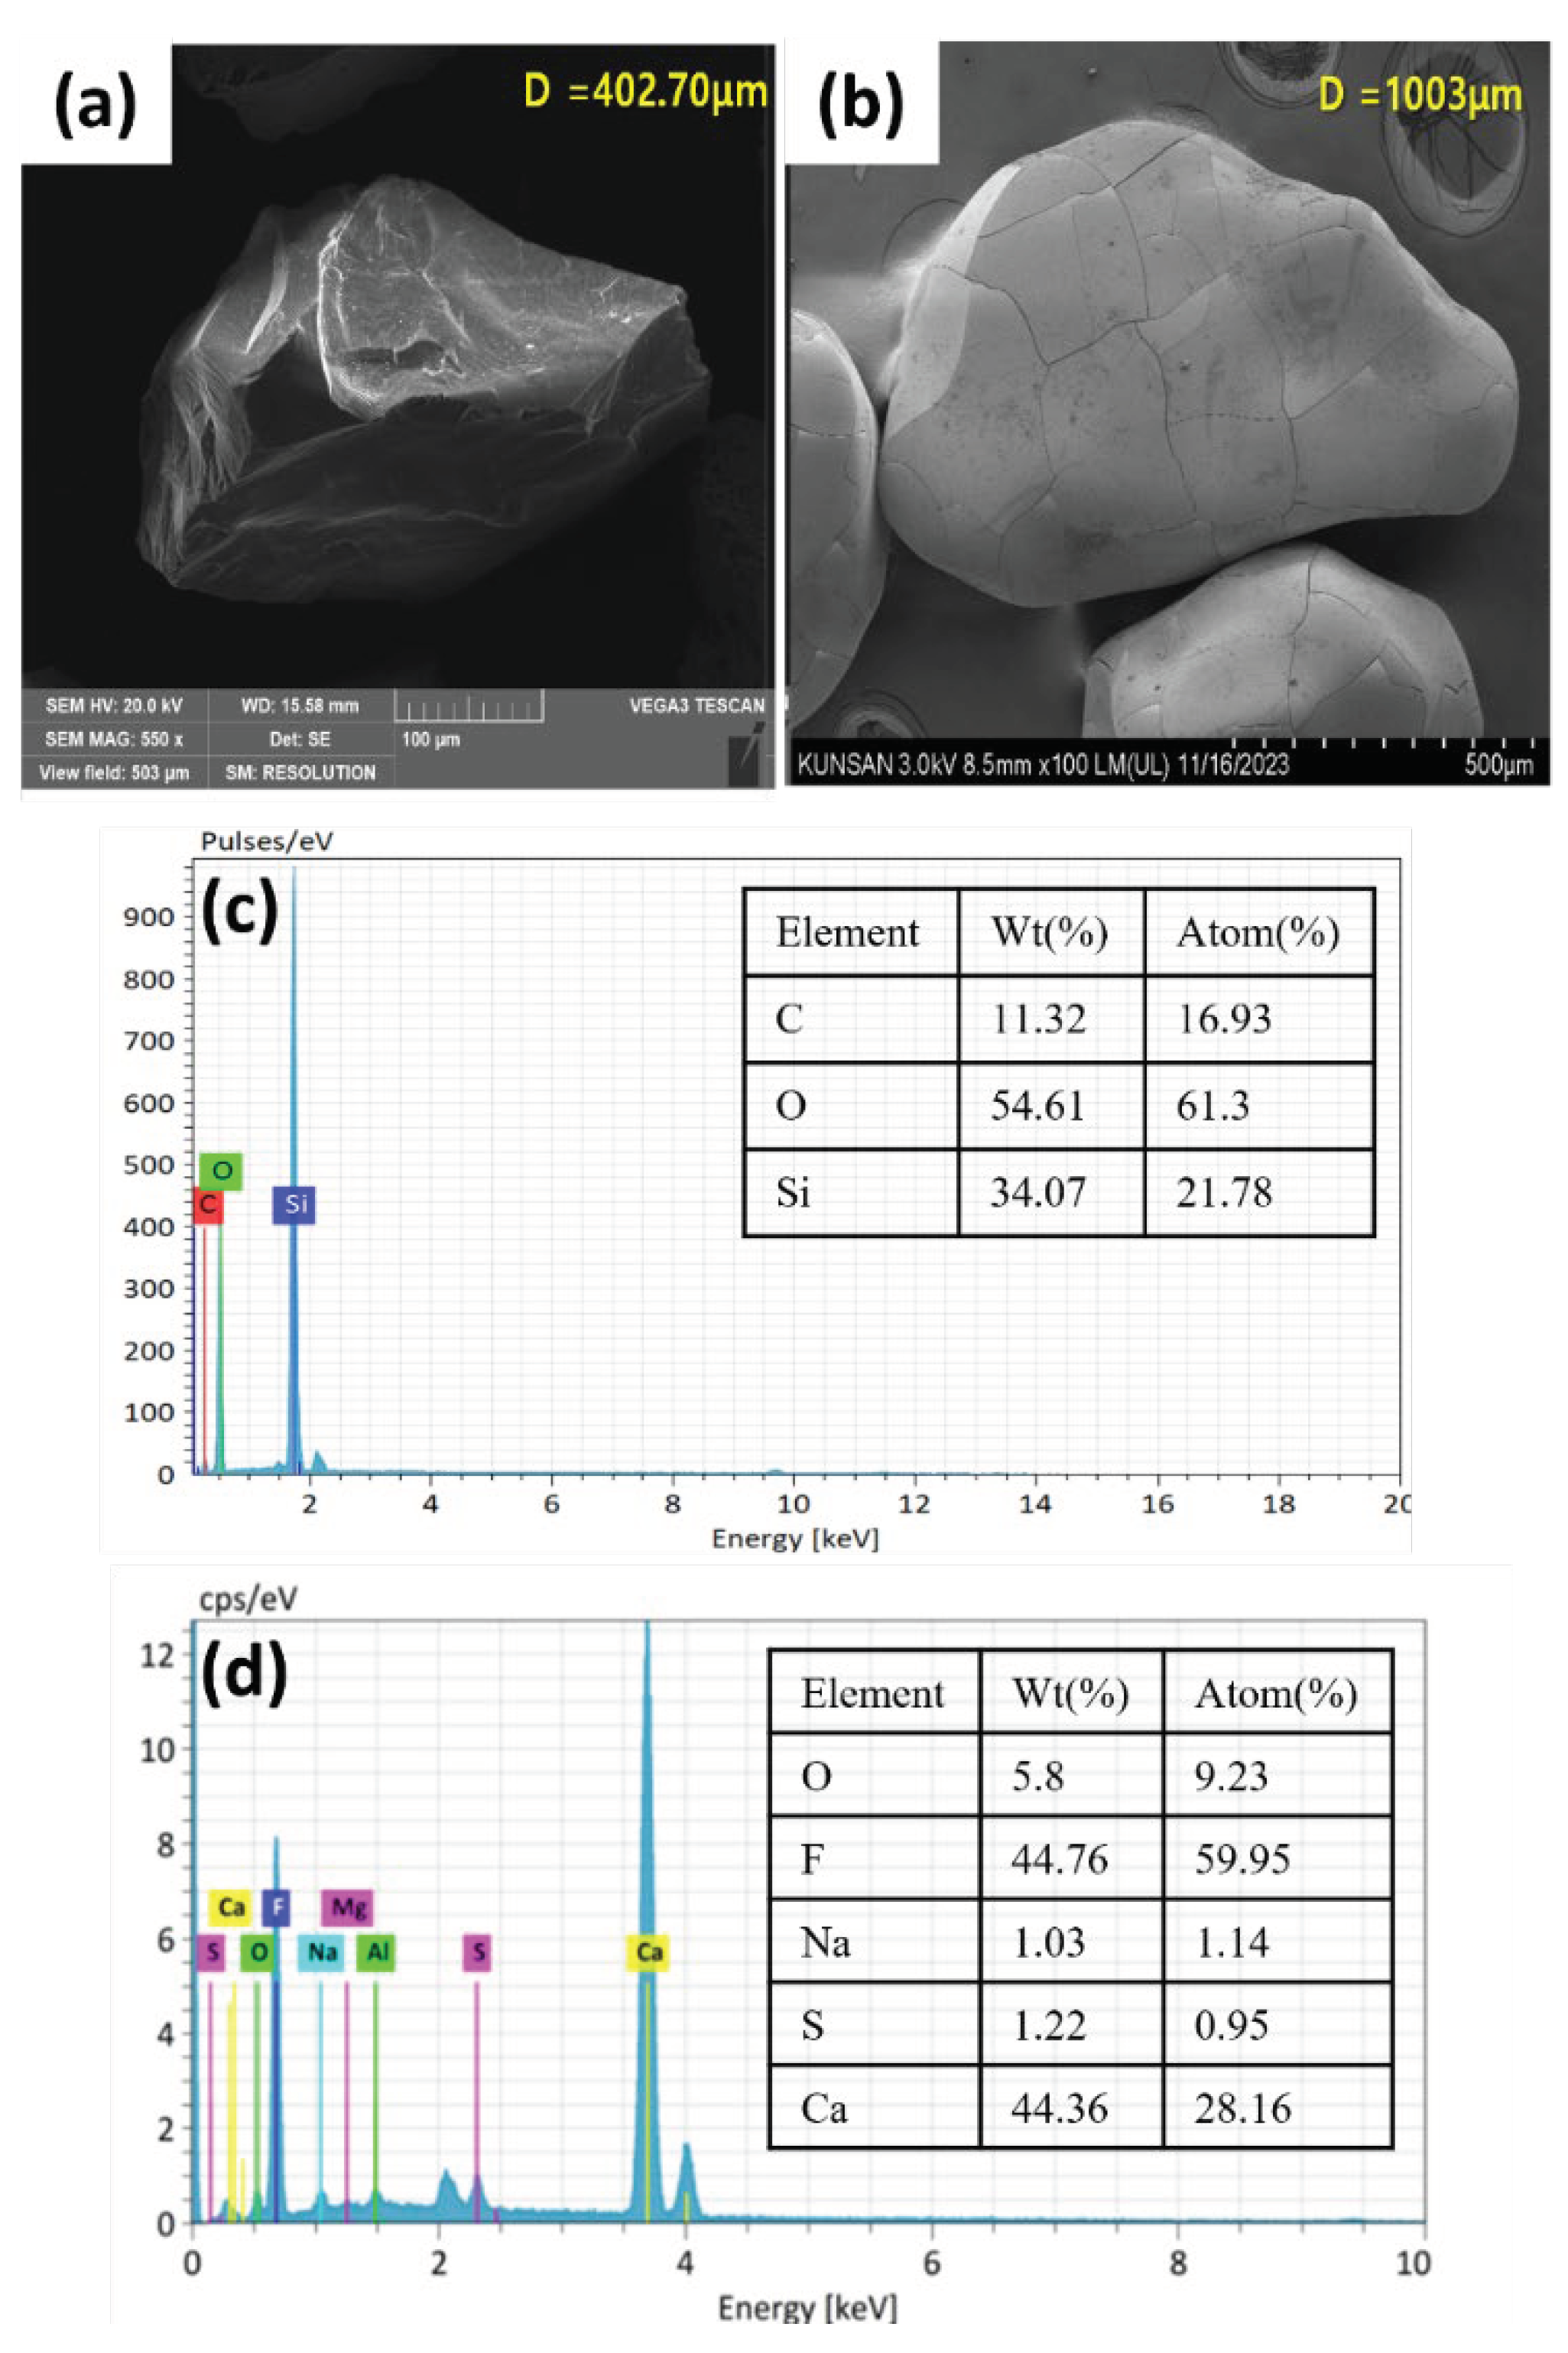
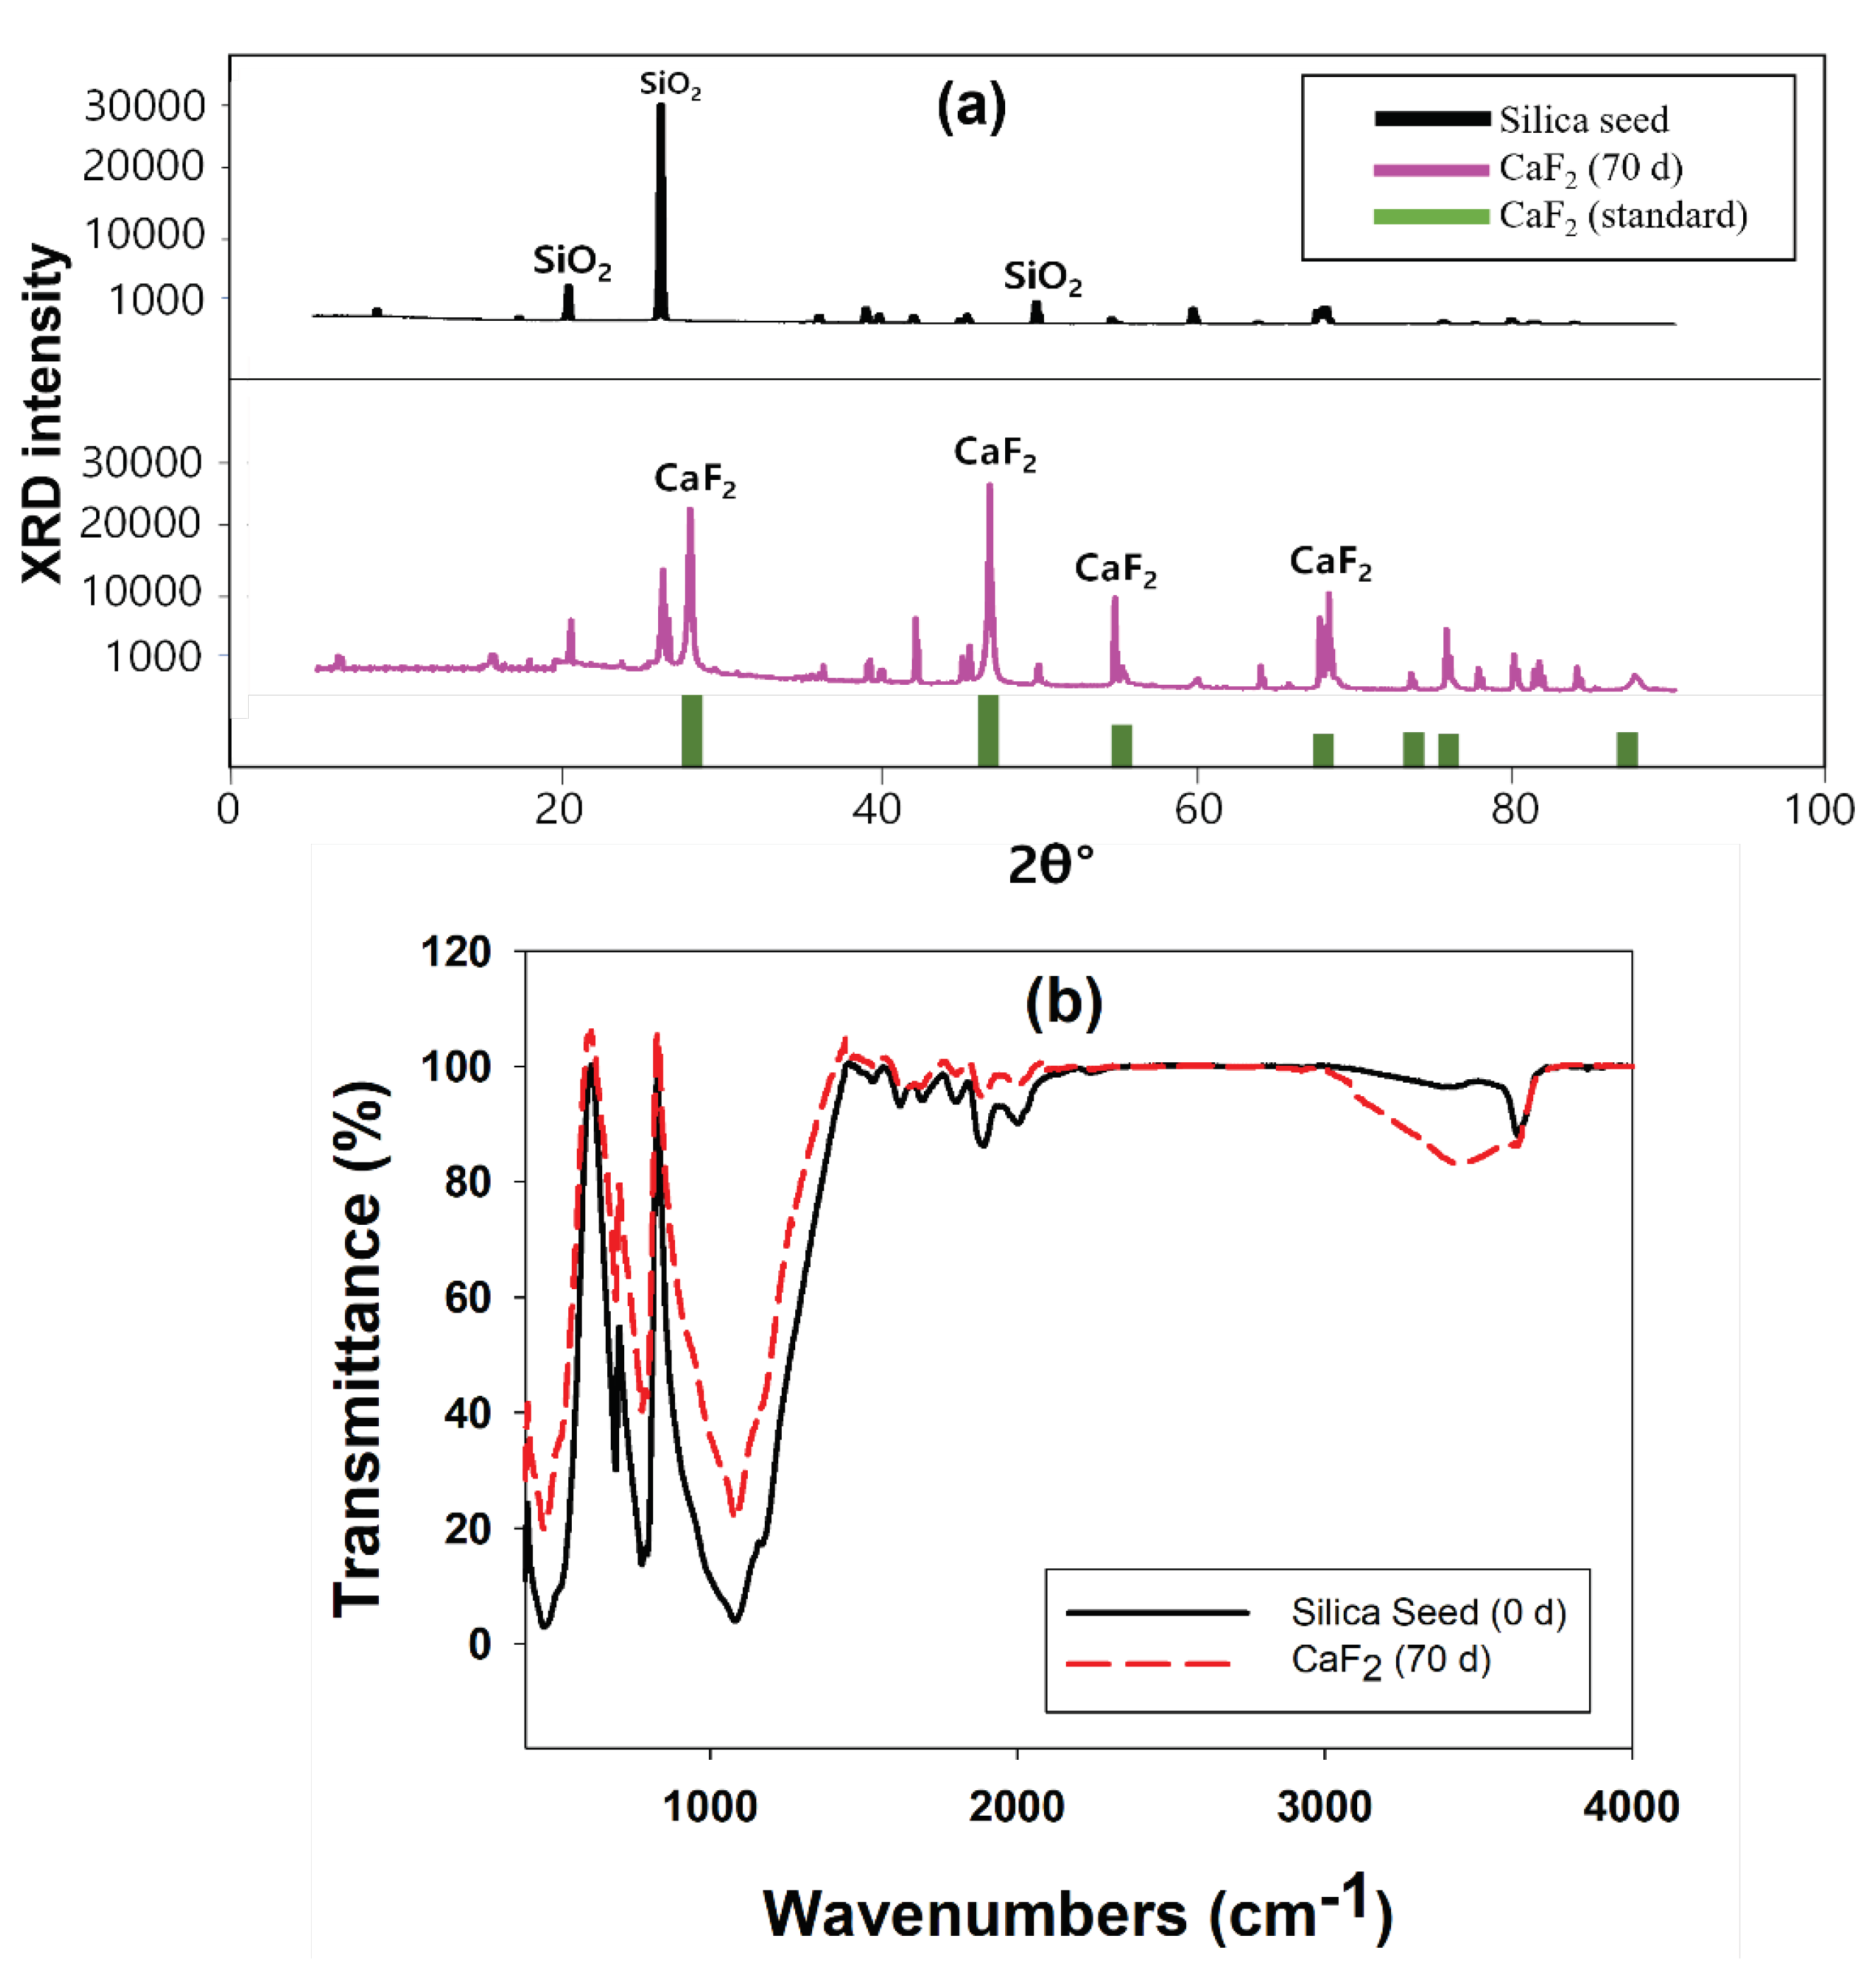
2.1.4. Characterization of Calcium Fluoride Crystals
| Element | Silica seed (%) | CaF2 - 70 day (%) |
|---|---|---|
| Sulfate (S) | 0.14 | 0.18 |
| Aluminium (Al) | 0.34 | 0.27 |
| Calcium (Ca) | 0.34 | 53.2 |
| Fluoride (F) | 1.53 | 44.4 |
| Copper (Cu) | 0.01 | 0.00 |
| Iron (Fe) | 0.70 | 0.56 |
| Potassium (K) | 0.27 | 0.36 |
| Magnesium (Mg) | 0.12 | 0.05 |
| Sodium (Na) | 0.38 | 0.47 |
| Phosphate (P) | 0.13 | 0.00 |
| Silica (Si) | 94.81 | 0.51 |
| Zinc (Zn) | 0.04 | 0.00 |
2.2. Process Improvement Strategies
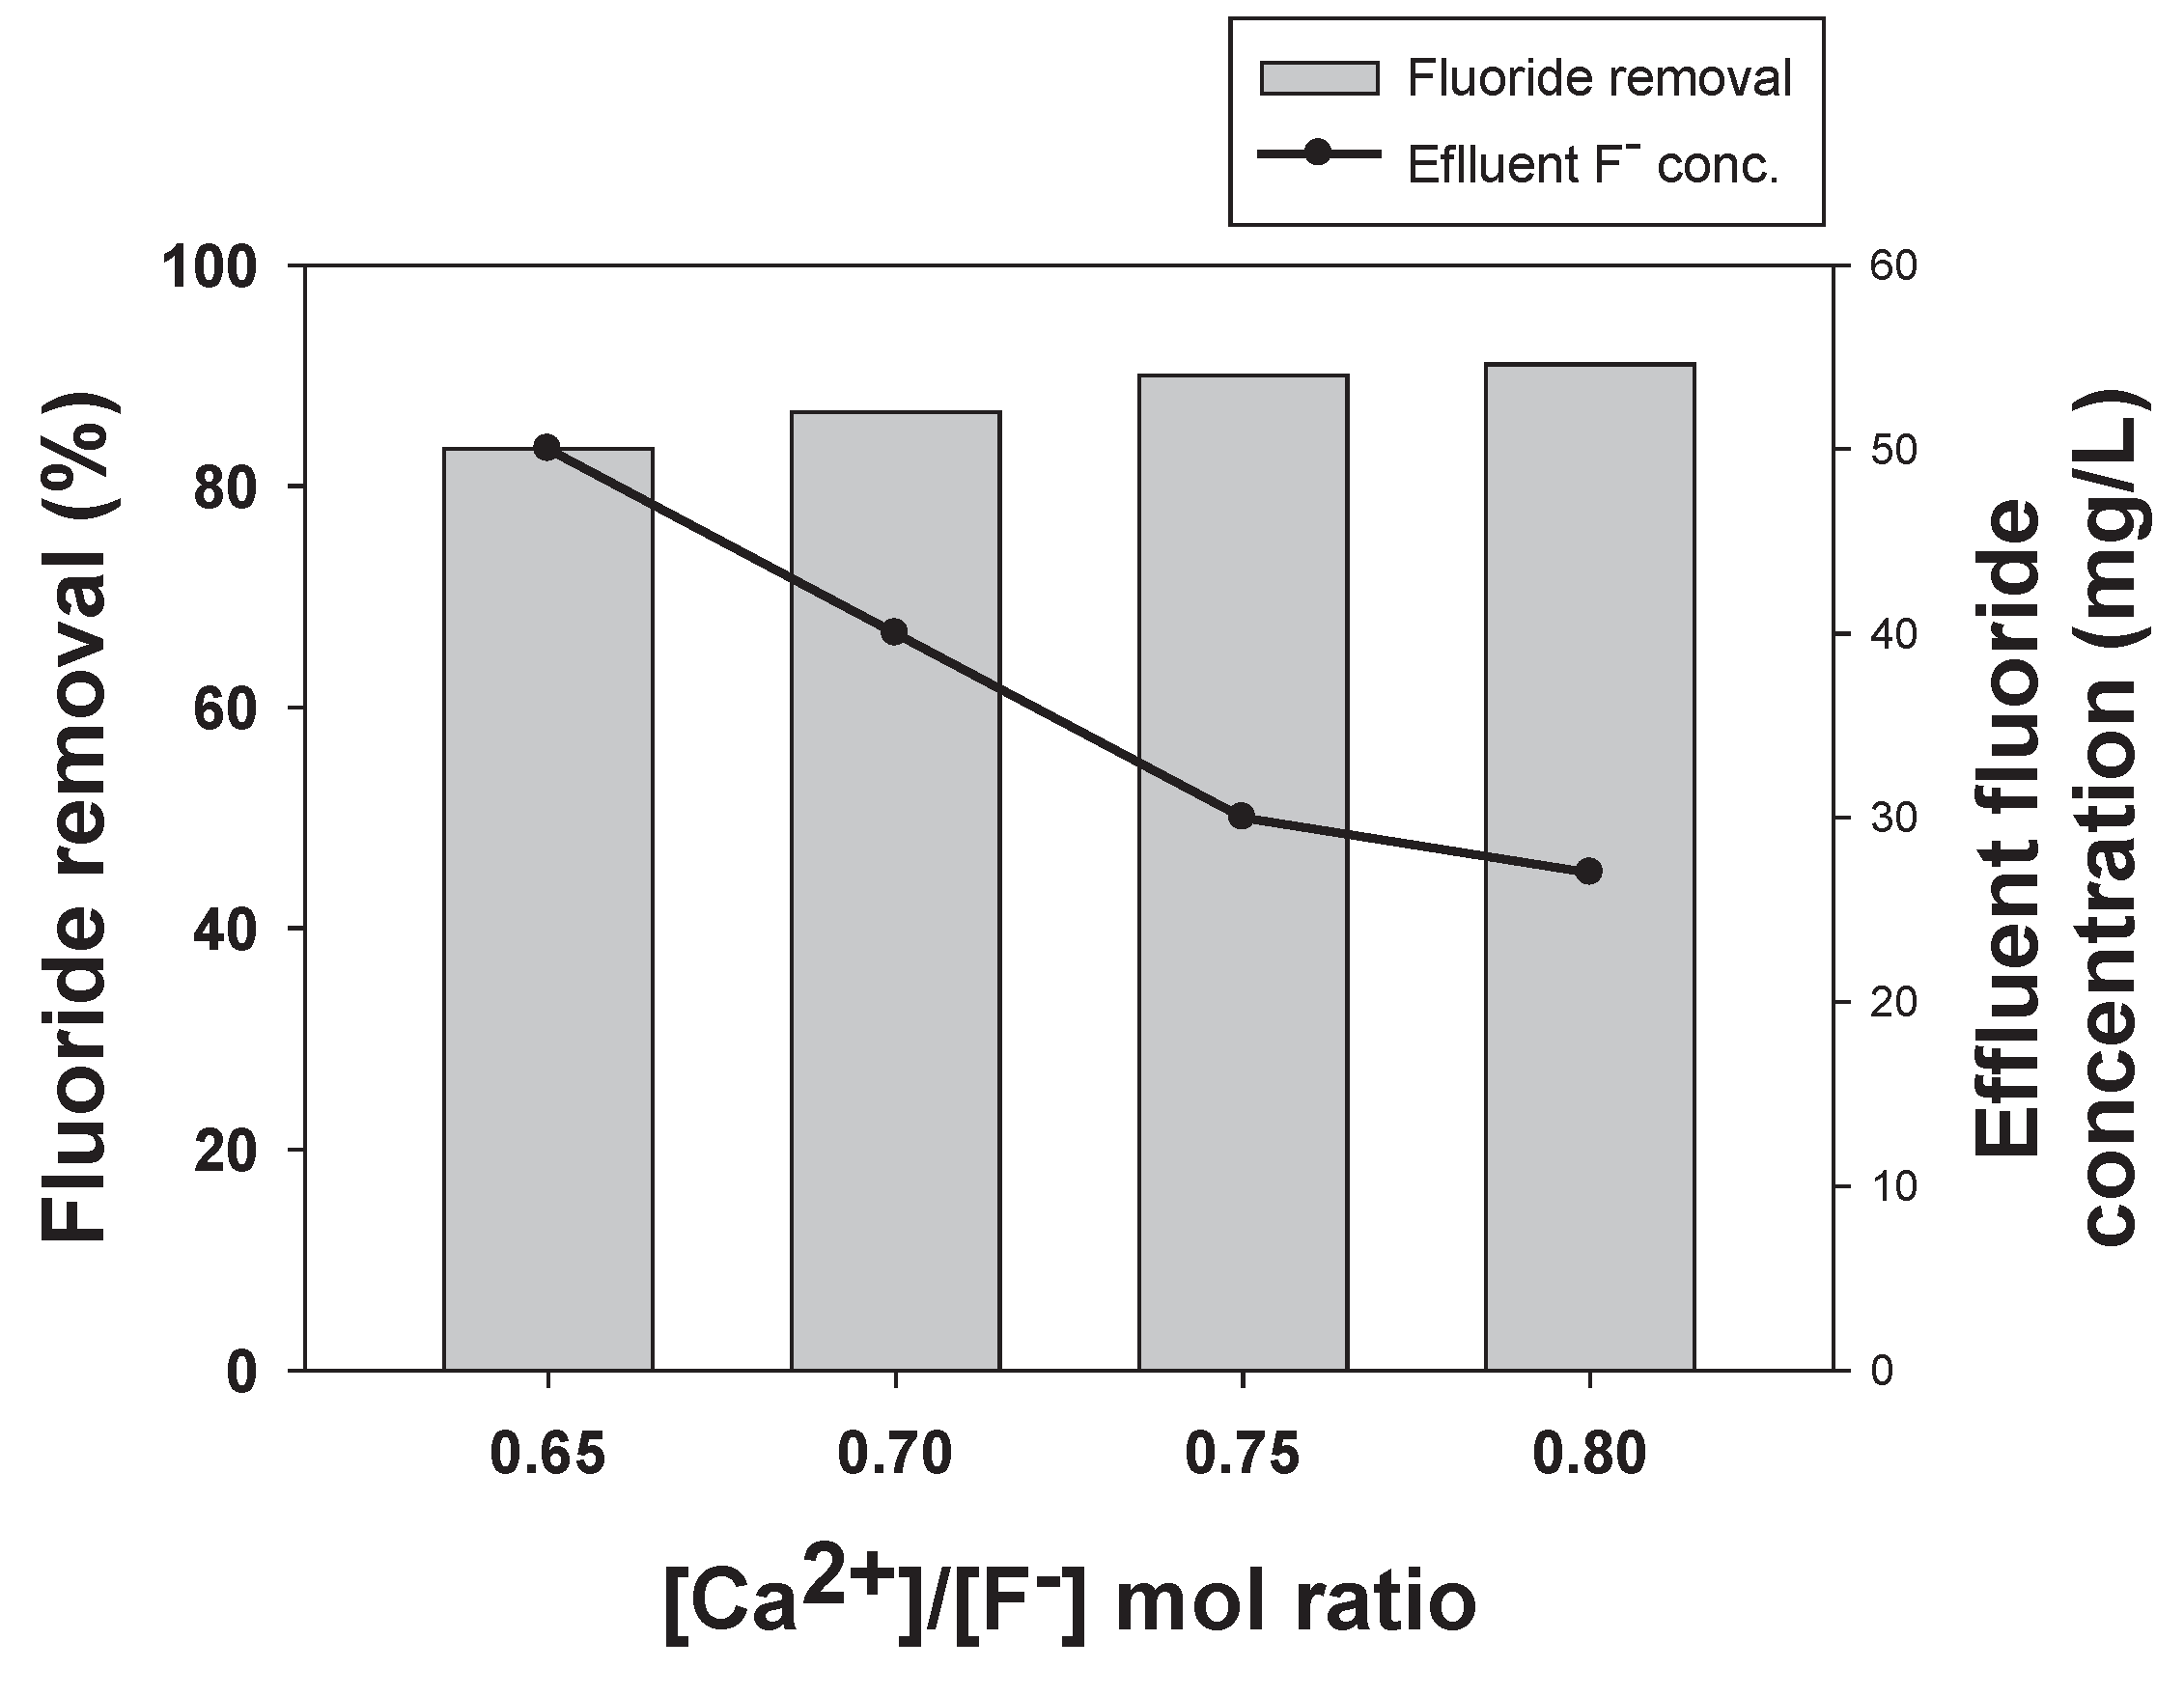
2.2.1. Effect of Increased Calcium Addition on Fluoride Removal
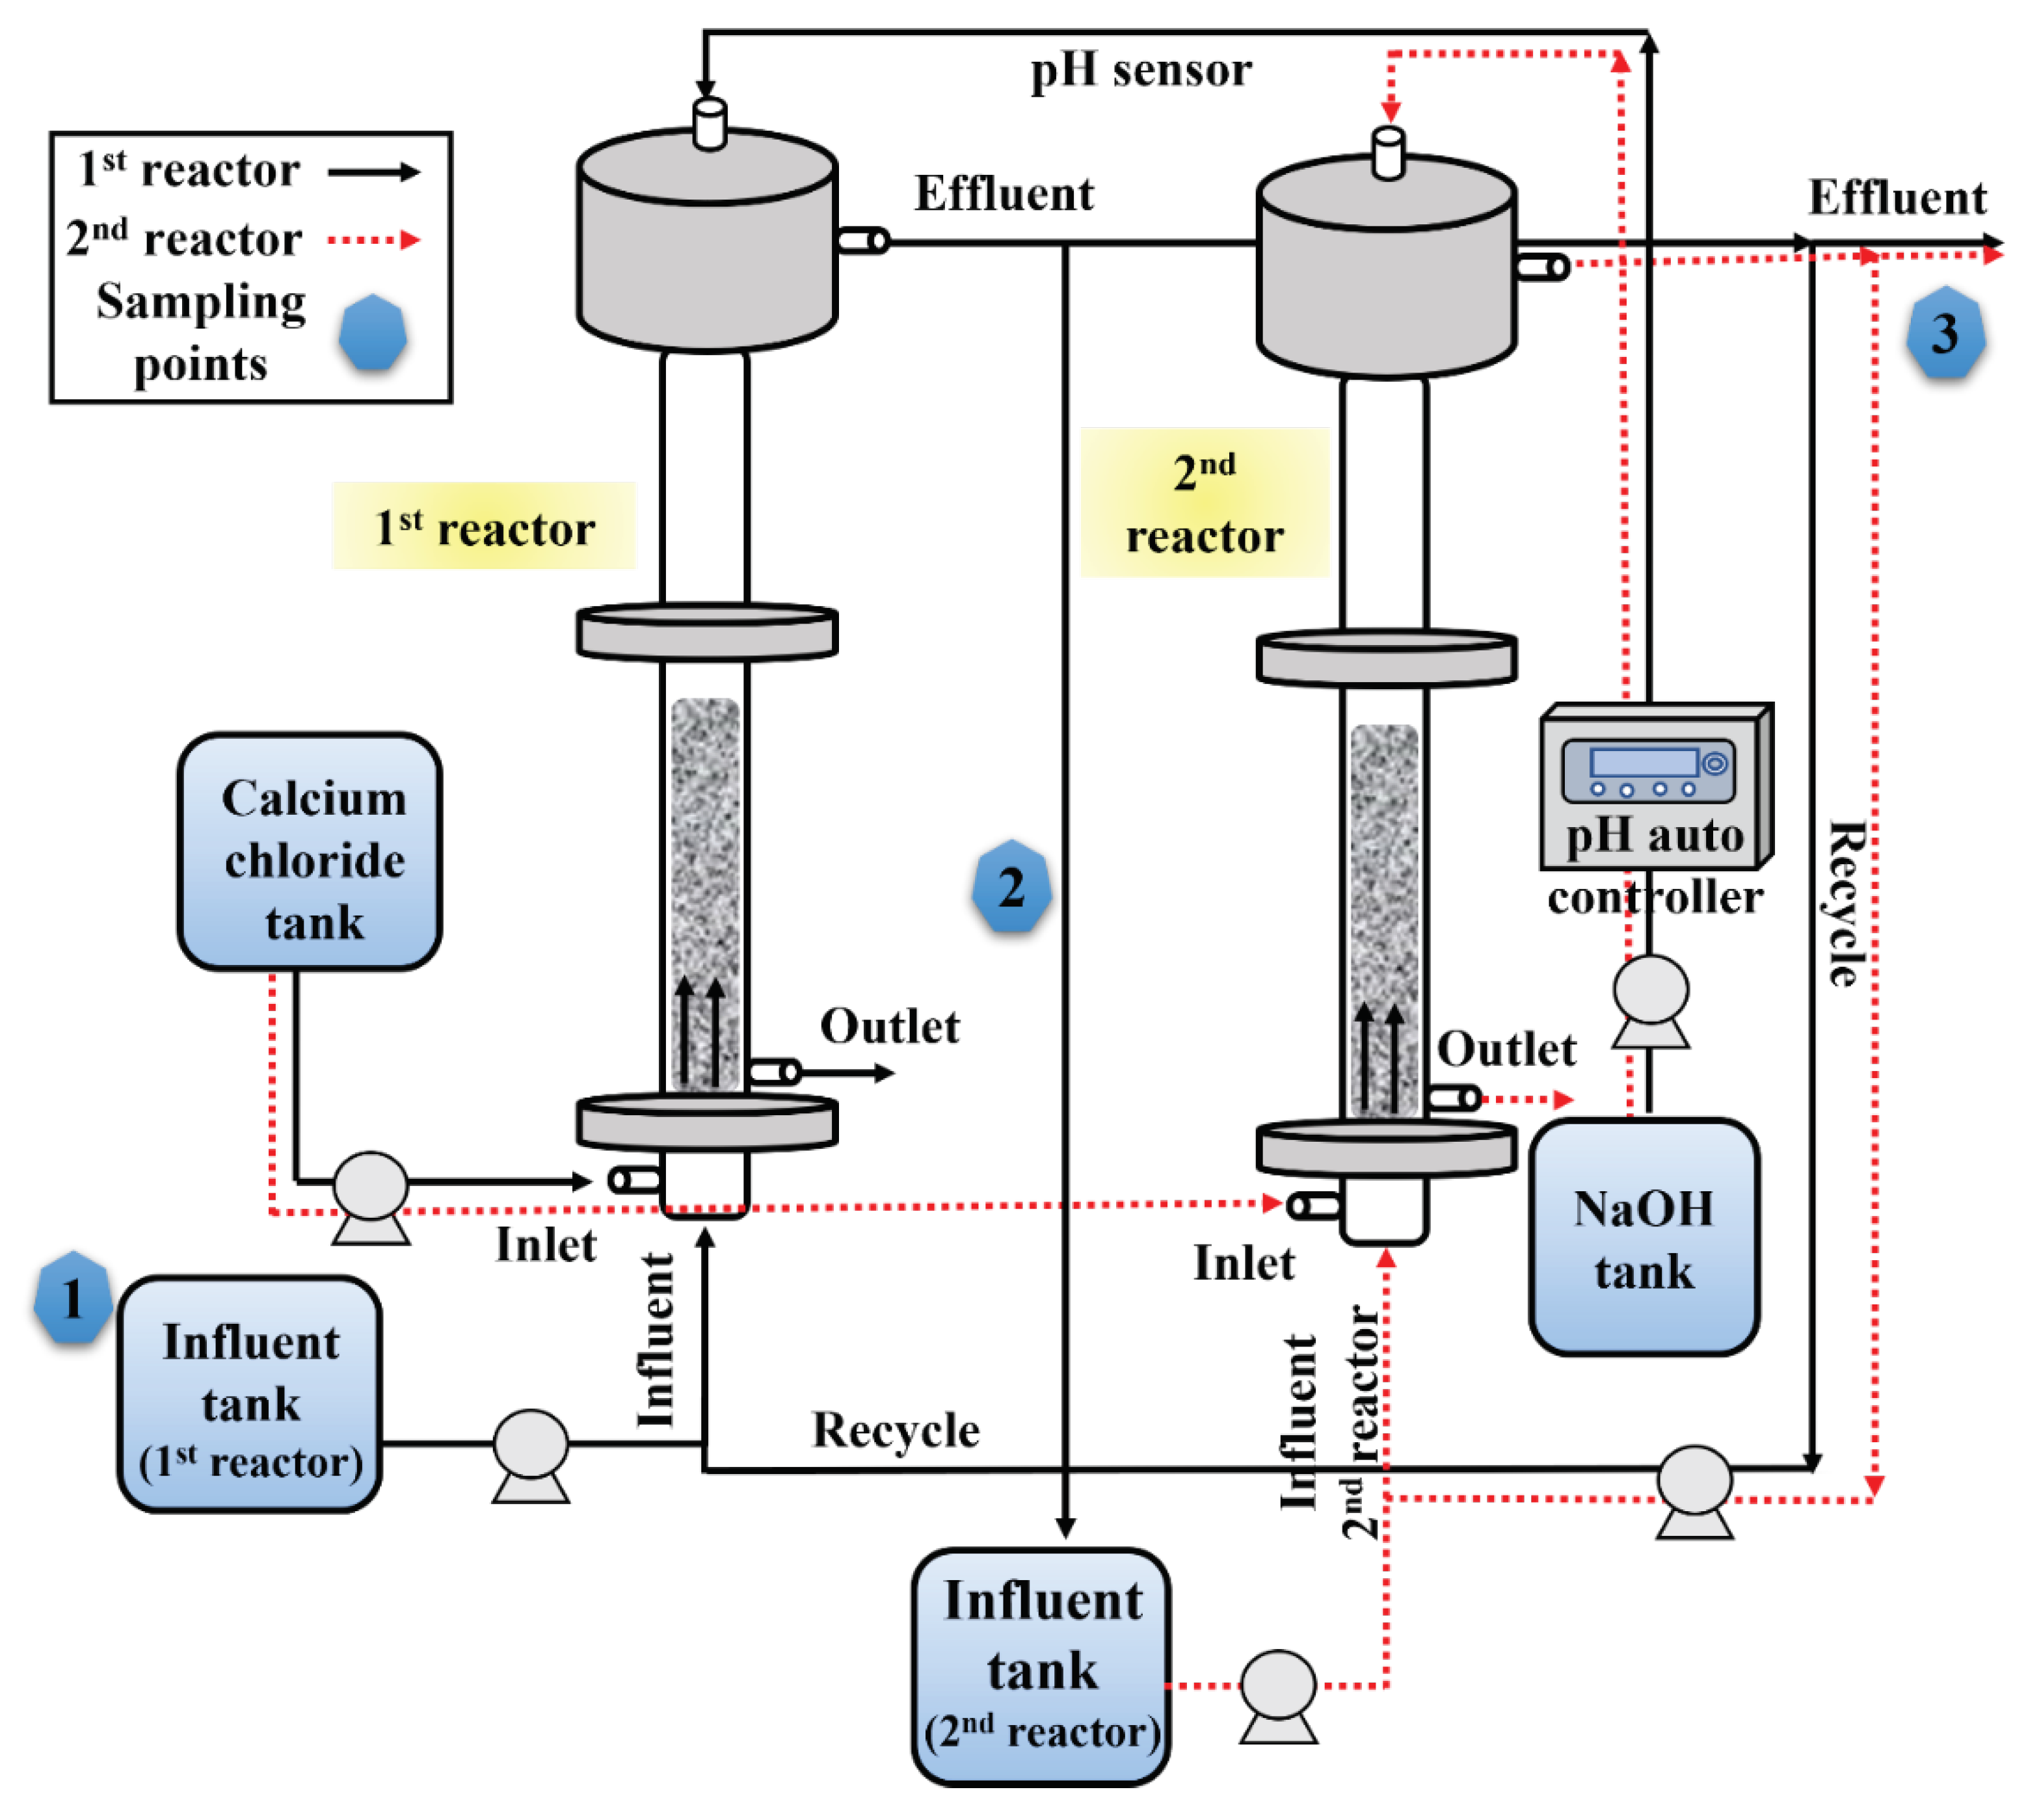
2.2.2. Performance of Two-Stage FBR for Fluoride Removal
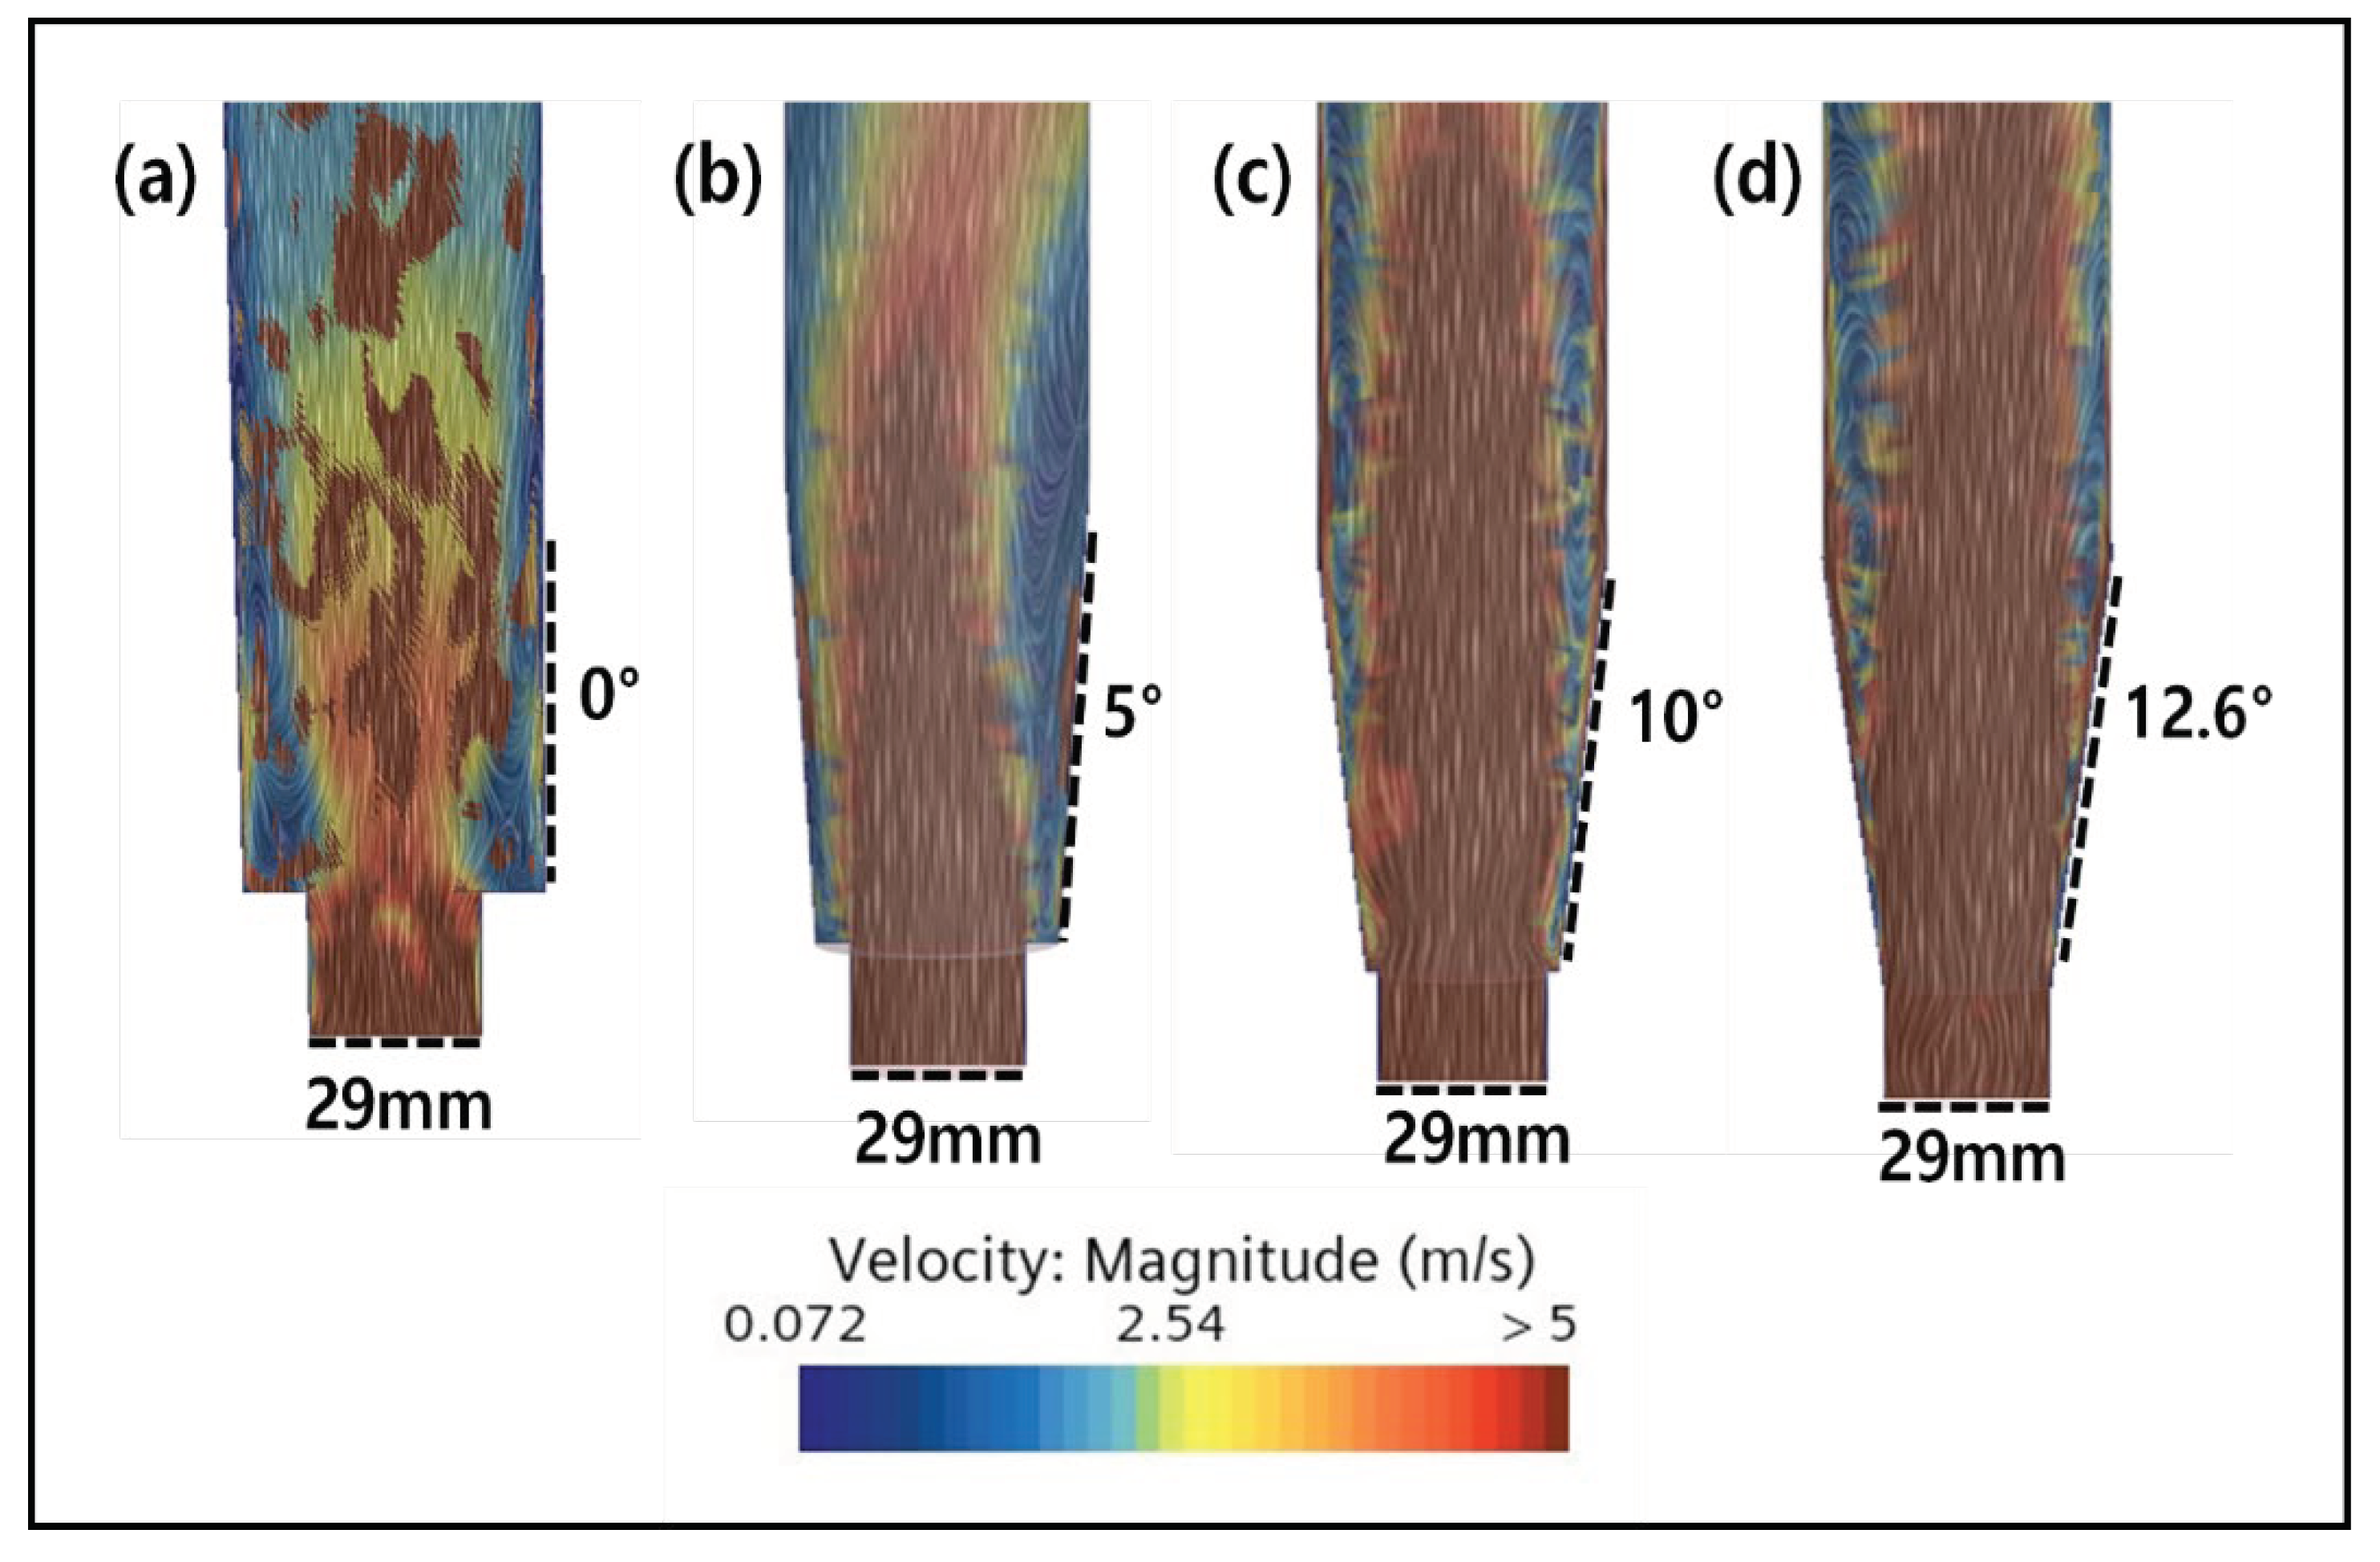
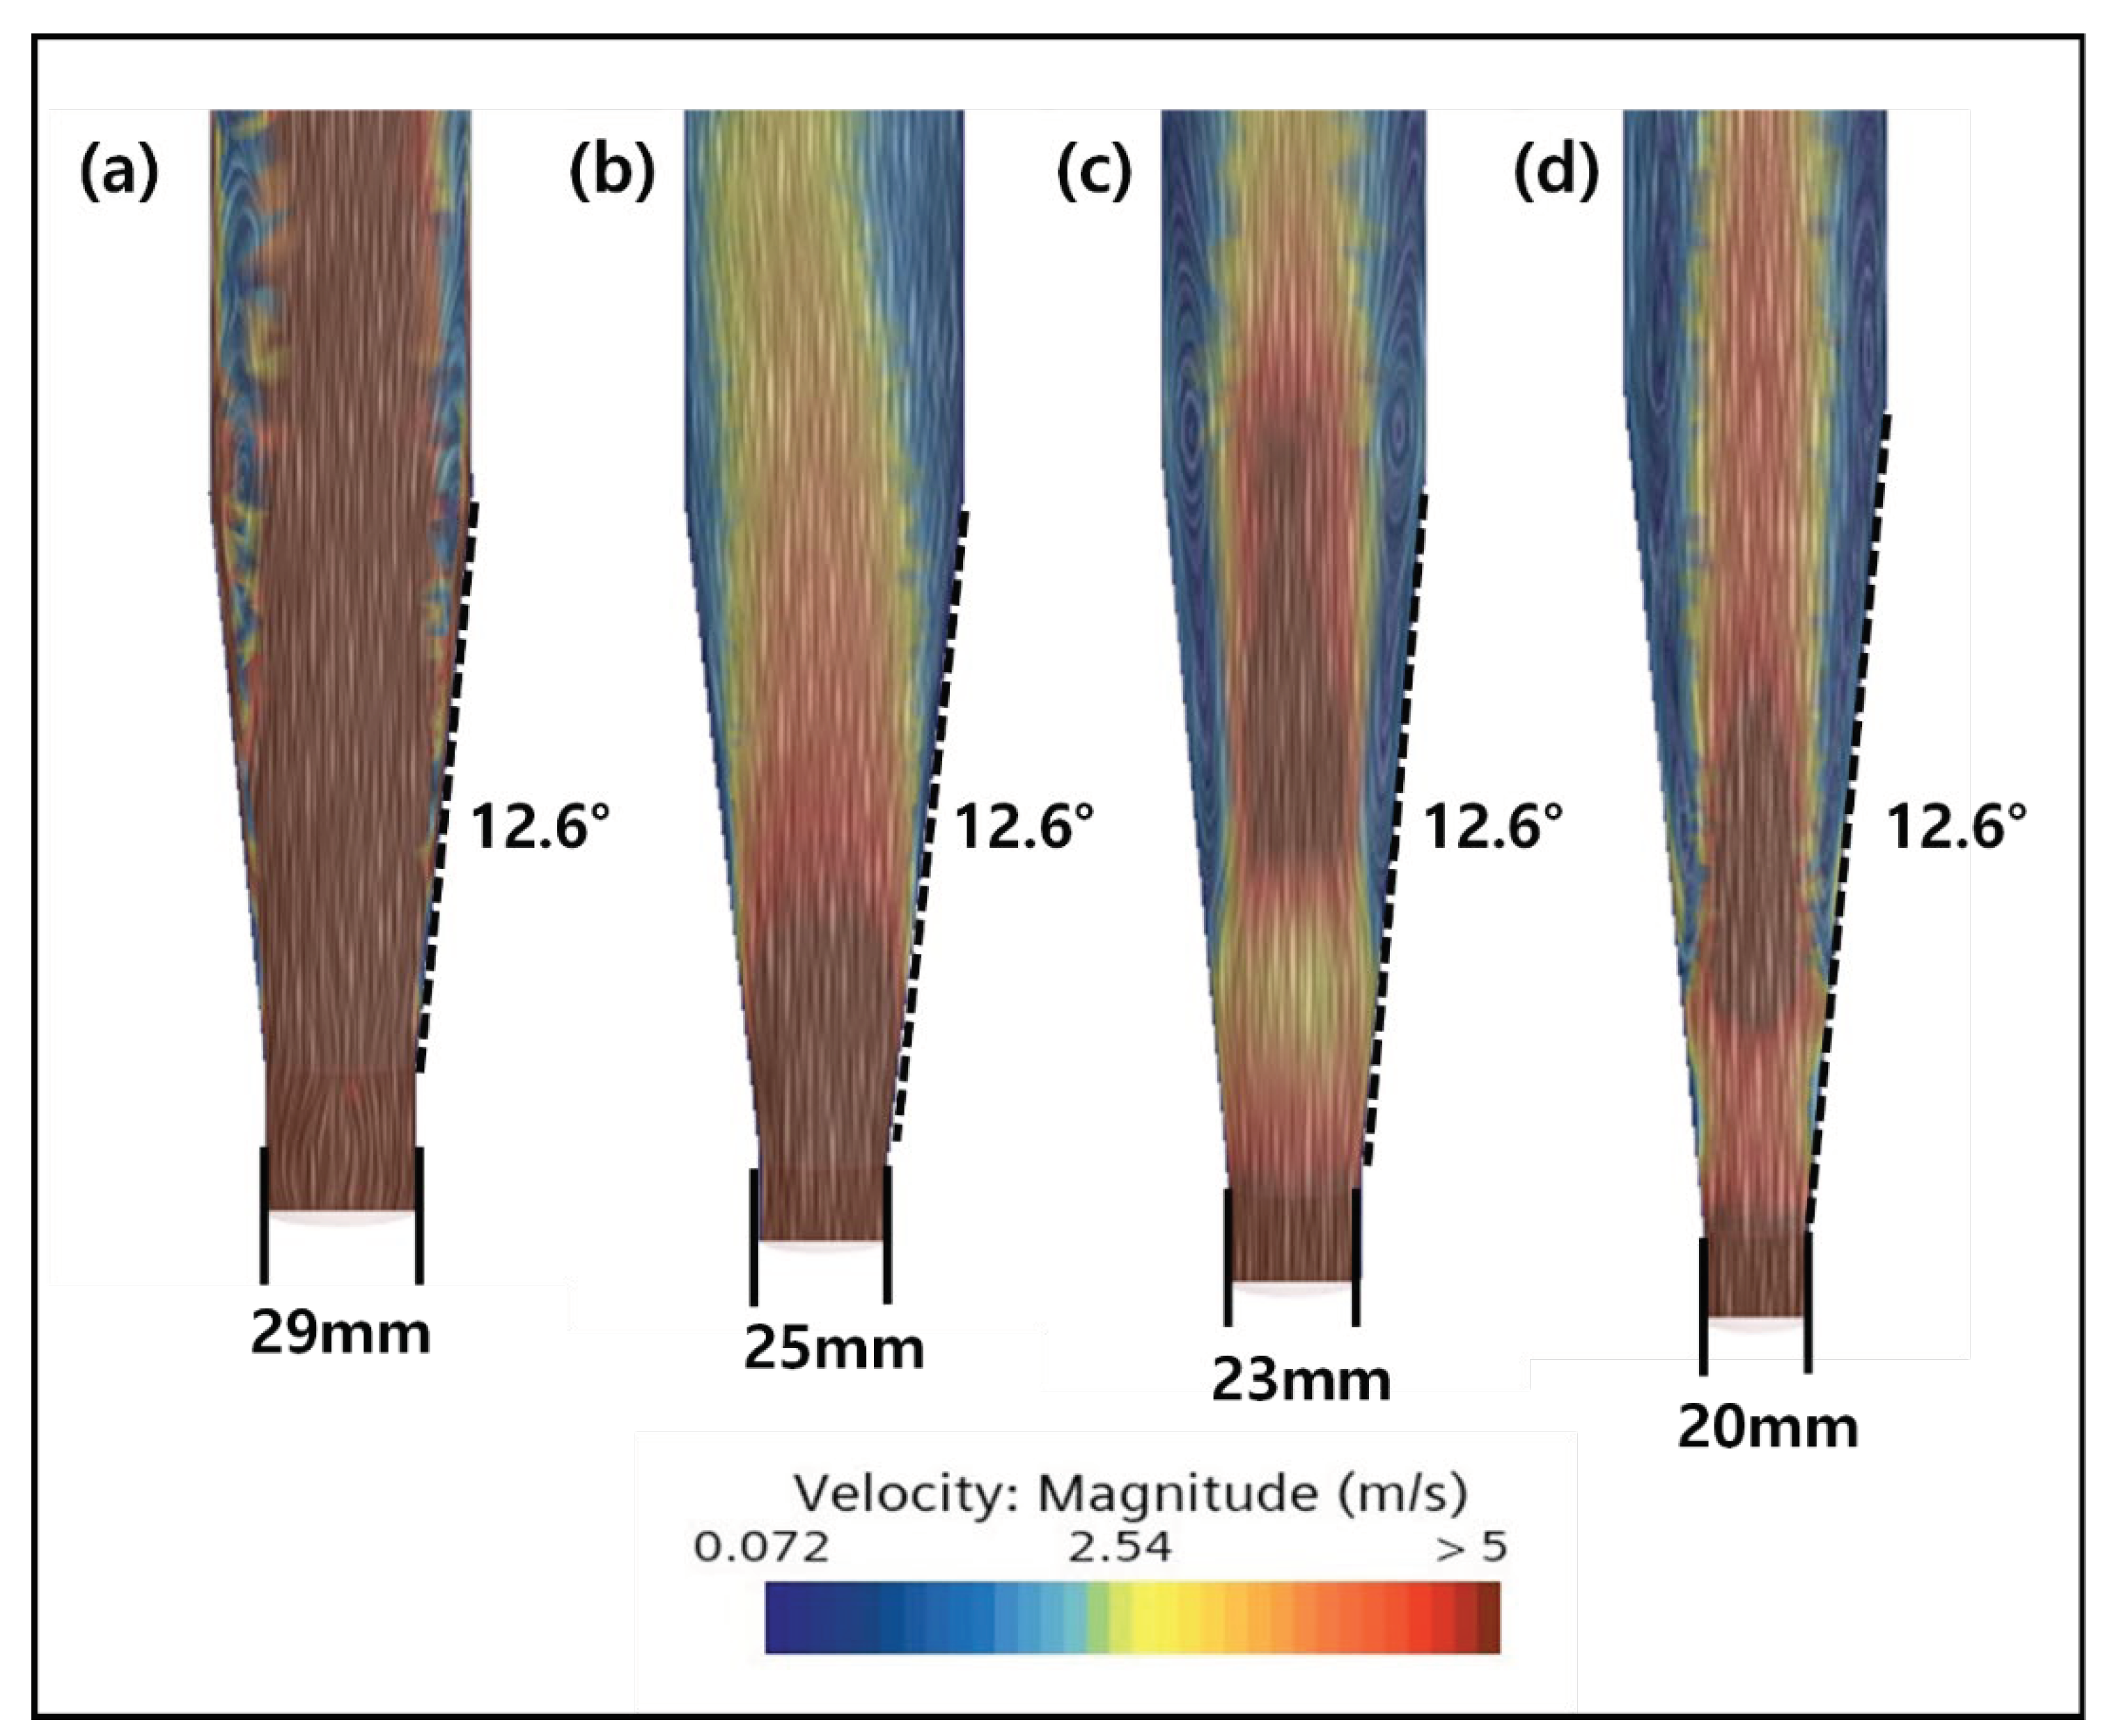
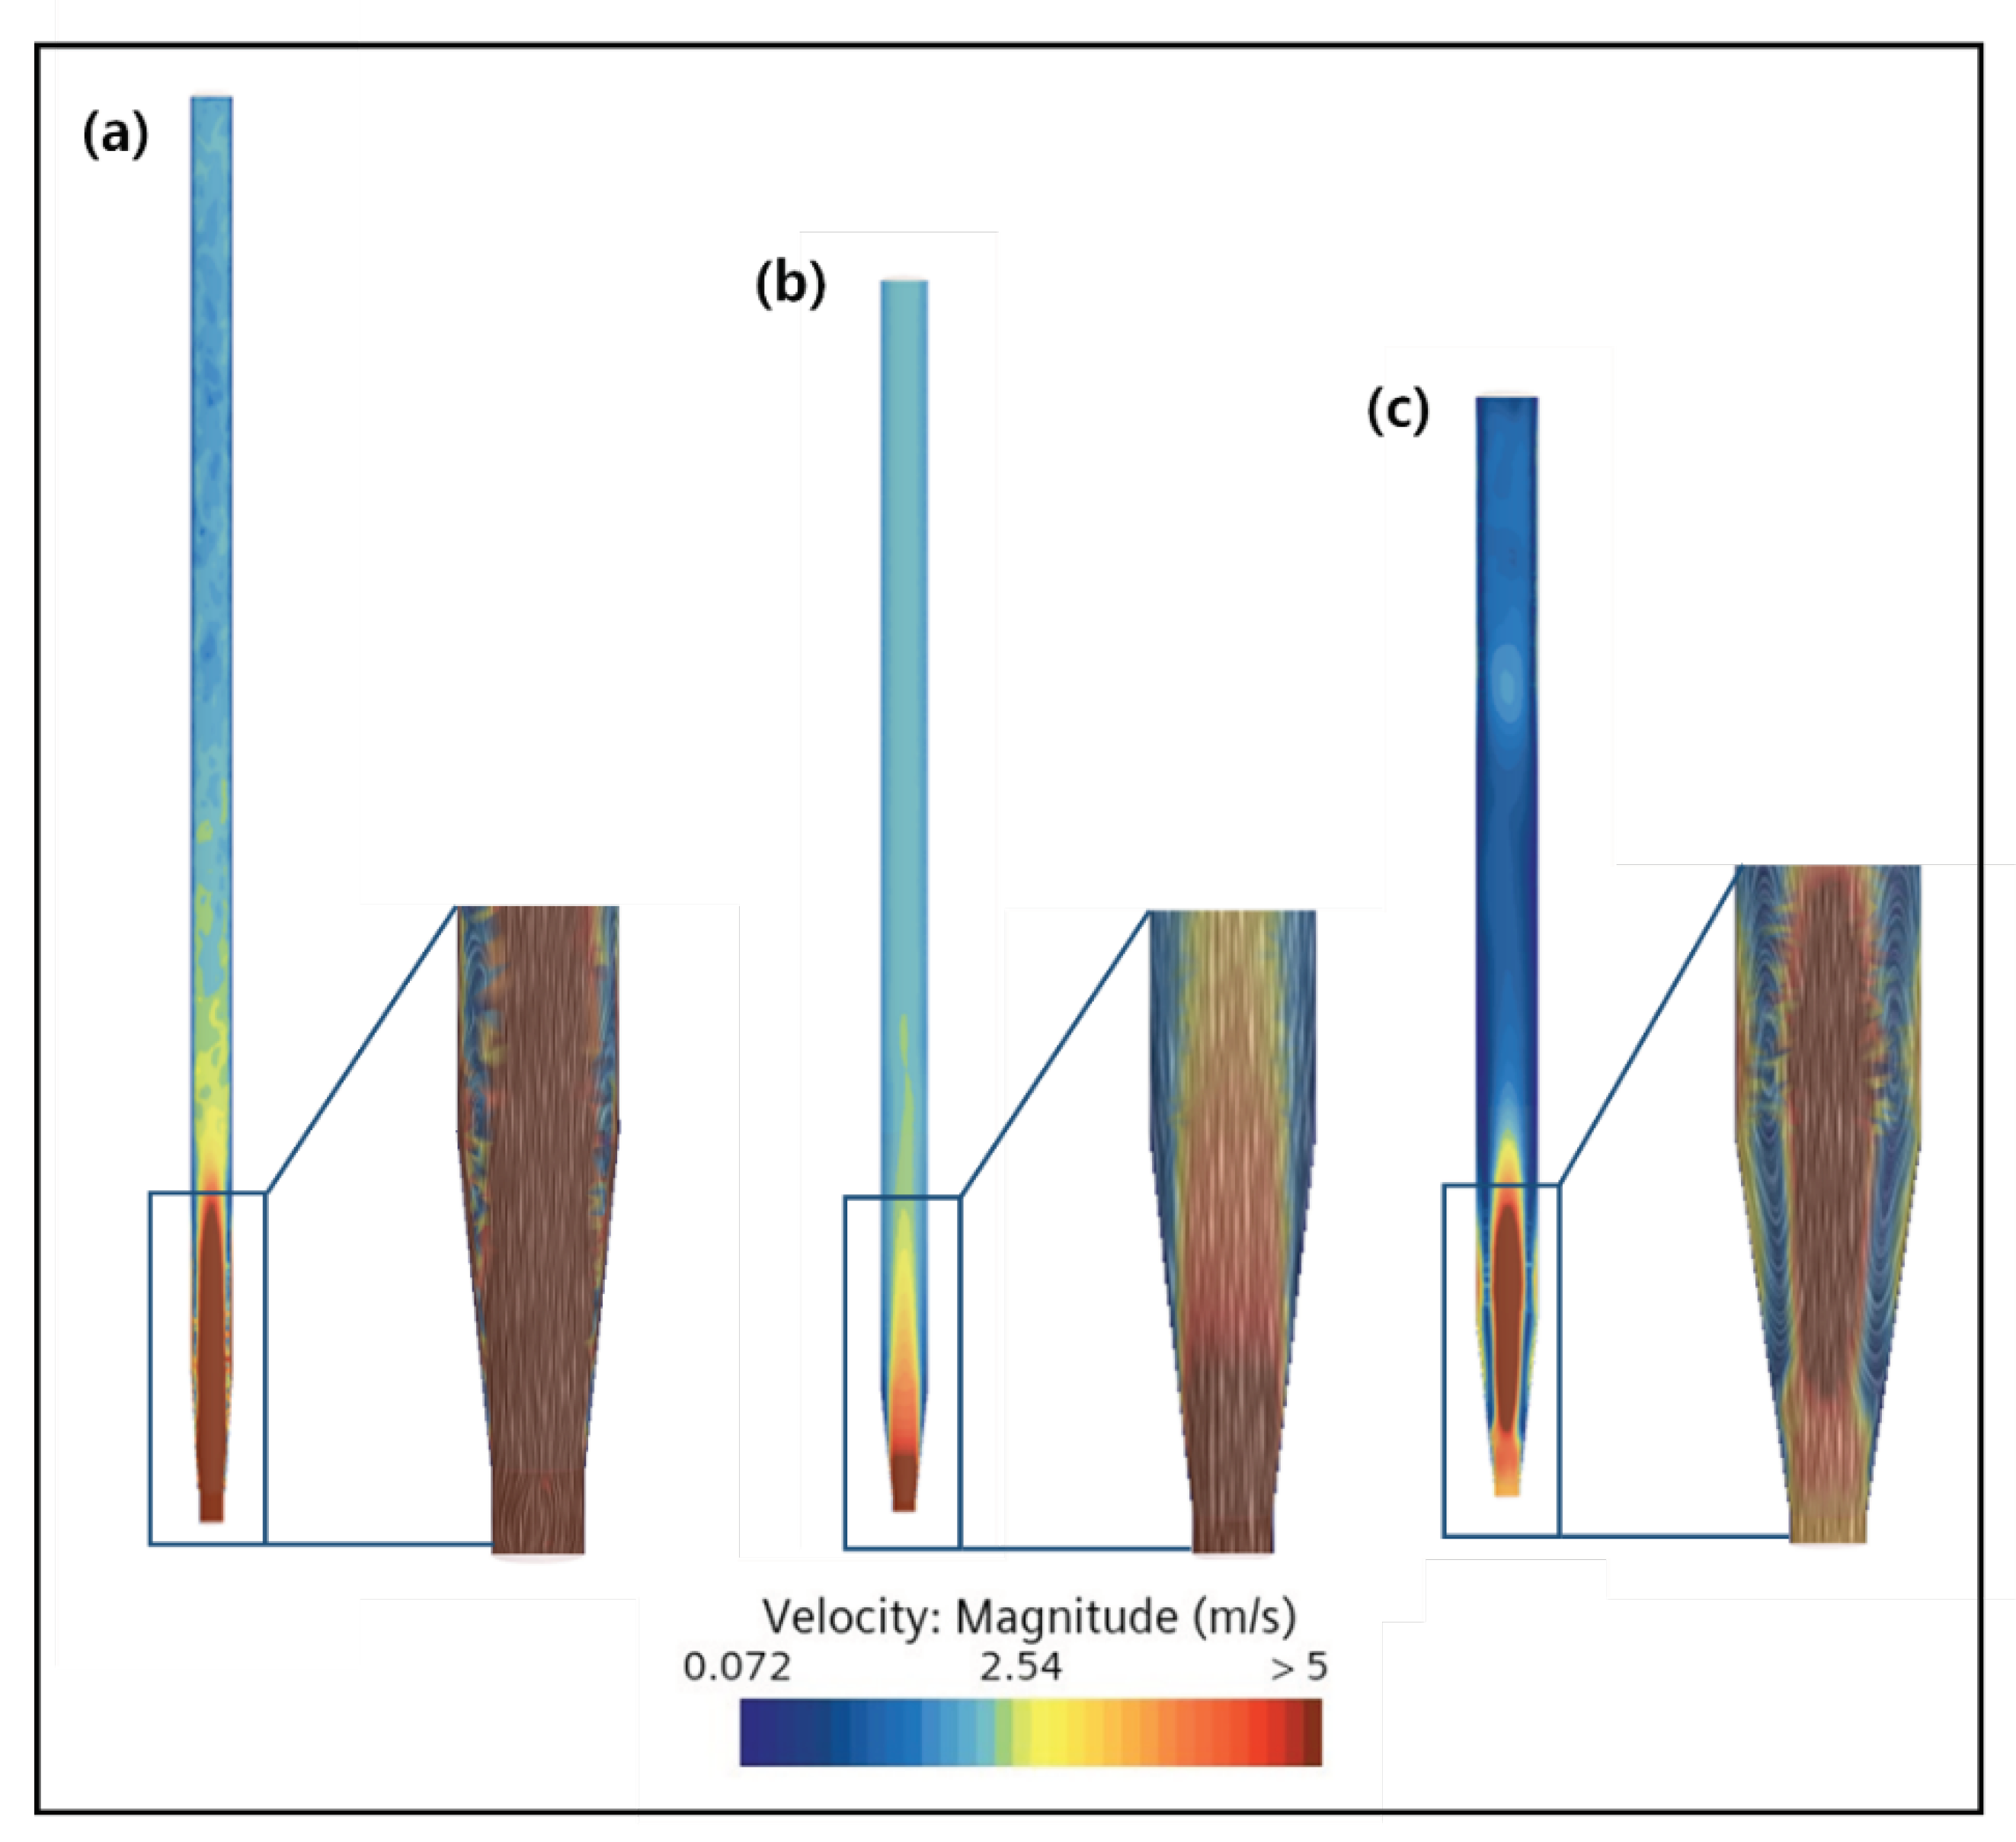
2.3. CFD Simulation of FBR Treating Fluoride Containing Wastewater
3. Material and Methods
3.1. Experimental Setup
3.2. Continuous Reactor Operation
3.3. Process Improvement Strategies
3.4. CFD Guided Optimization of FBR Configuration
| Condition (unit) | Value |
|---|---|
| Liquid density (kg/m3) | 997.561 |
| Dynamic viscosity (Pa-s) | 8.8871 E-4 |
| Cp (cal/g.k) | 0.998 |
| Inlet velocity (m/s) | 4.7 E-4 |
| Temperature (°C) | 25 |
| Outlet pressure (Pa) | 0 |
| Solid density (kg/m3) | 2,650 |
| Solid diameter (mm) | 0.5 |
| Number of grains | 20000 |
| Particle count | 5000 |
3.5. Characterization of the CaF2 Crystals
3.6. Analytical Methods
4. Conclusions
Funding
Acknowledgments
References
- Wan, K.; Huang, L.; Yan, J.; Ma, B.; Huang, X.; Luo, Z.; Zhang, H.; Xiao, T. Removal of fluoride from industrial wastewater by using different adsorbents: A review. Sci. Total Environ. 2021, 773, 145535. [Google Scholar] [CrossRef]
- Lacson, C.F.Z.; Lu, M.C.; Huang, Y.H. Fluoride-containing water: A global perspective and a pursuit to sustainable water defluoridation management-An overview. J. Clean. Prod. 2021, 280, 124236. [Google Scholar] [CrossRef]
- Qiu, Y.; Ren, L.F.; Xia, L.; Shao, J.; Zhao, Y.; Van der Bruggen, B. Investigation of fluoride and silica removal from semiconductor wastewaters with a clean coagulation-ultrafiltration process. Chem. Eng. J. 2022, 438, 135562. [Google Scholar] [CrossRef]
- Yu, Y.Q.; Cui, S.F.; Fan, R.J.; Fu, Y.Z.; Liao, Y.L.; Yang, J.Y. Distribution and superposed health risk assessment of fluorine co-effect in phosphorous chemical industrial and agricultural sources. Environ. Pollut. 2020, 262, 114249. [Google Scholar] [CrossRef]
- Li, Y.; Bi, Y.; Mi, W.; Xie, S.; Ji, L. Land-use change caused by anthropogenic activities increase fluoride and arsenic pollution in groundwater and human health risk. J. Hazard. Mater. 2021, 406, 124337. [Google Scholar] [CrossRef]
- Damtie, M.M.; Woo, Y.C.; Kim, B.; Hailemariam, R.H.; Park, K.D.; Shon, H.K.; Park, C.; Choi, J.S. Removal of fluoride in membrane-based water and wastewater treatment technologies: Performance review. J. Environ. Manage. 2019, 251, 109524. [Google Scholar] [CrossRef]
- Kim, J.; Hwang, Y.; Yoo, M.; Chen, S.; Lee, I.M. Hydrogen fluoride (HF) substance flow analysis for safe and sustainable chemical industry. Environ. Sci. Pollut. Res. 2017, 24, 25137–25145. [Google Scholar] [CrossRef]
- Ho, H.J.; Takahashi, M.; Iizuka, A. Simultaneous removal of fluoride and phosphate from semiconductor wastewater via chemical precipitation of calcium fluoride and hydroxyapatite using byproduct of recycled aggregate. Chemosphere 2023, 340, 139875. [Google Scholar] [CrossRef]
- Olejarczyk, M.; Rykowska, I.; Urbaniak, W. Management of Solid Waste Containing Fluoride—A Review. Materials 2022, 15, 3461. [Google Scholar] [CrossRef] [PubMed]
- Sim, J.; Lee, J.; Rho, H.; Park, K.D.; Choi, Y.; Kim, D.; Kim, H.; Woo, Y.C. A review of semiconductor wastewater treatment processes: Current status, challenges, and future trends. J. Clean Prod. 2023, 429, 139570. [Google Scholar] [CrossRef]
- Nath, S.K.; Dutta, R.K. Significance of calcium containing materials for defluoridation of water: a review. Desalin. Water Treat. 2015, 53, 2070–2085. [Google Scholar] [CrossRef]
- Aldaco, R.; Garea, A.; Irabien, A. Calcium fluoride recovery from fluoride wastewater in a fluidized bed reactor. Water Res. 2007, 41, 810–818. [Google Scholar] [CrossRef] [PubMed]
- Aldaco, R.; Garea, A.; Fernández, I.; Irabien, A. Resources reduction in the fluorine industry: fluoride removal and recovery in a fluidized bed crystallizer. Clean Technol. Environ. Policy 2008, 10, 203–210. [Google Scholar] [CrossRef]
- Deng, L.; Liu, Y.; Huang, T.; Sun, T. Fluoride removal by induced crystallization using fluorapatite/calcite seed crystals. Chem. Eng. J. 2016, 287, 83–91. [Google Scholar] [CrossRef]
- Khunur, M.M.; Risdianto, A.; Mutrofin, S.; Prananto, Y.P. Synthesis of fluorite (CaF2) crystal from gypsum waste of phosphoric acid factory in silica gel. Bull. Chem. React. Eng. Catal. 2012, 7, 71–77. [Google Scholar] [CrossRef]
- Zhou, L. Preparation of calcium fluoride using phosphogypsum by orthogonal experiment. Open Chem. 2018, 16, 864–868. [Google Scholar] [CrossRef]
- Deng, L.; Wang, Y.; Zhang, X.; Zhou, J.; Huang, T. Defluoridation by fluorapatite crystallization in a fluidized bed reactor under alkaline groundwater condition. J. Clean. Prod. 2020, 272, 122805. [Google Scholar] [CrossRef]
- Wang, Z.; Su, J.; Hu, X.; Ali, A.; Wu, Z. Isolation of biosynthetic crystals by microbially induced calcium carbonate precipitation and their utilization for fluoride removal from groundwater. J. Hazard. Mater. 2021, 406, 124748. [Google Scholar] [CrossRef] [PubMed]
- Azami, M.; Jalilifiroozinezhad, S.; Mozafari, M.; Rabiee, M. Synthesis and solubility of calcium fluoride/hydroxy-fluorapatite nanocrystals for dental applications. Ceram. Int. 2011, 37, 2007–2014. [Google Scholar] [CrossRef]
- Ellerbrock, R.; Stein, M.; Schaller, J. Comparing amorphous silica, short-range-ordered silicates and silicic acid species by FTIR. Sci. Rep. 2022, 12, 11708. [Google Scholar] [CrossRef]
- Gogoi, S.; Dutta, R.K. Fluoride removal by hydrothermally modified limestone powder using phosphoric acid. J. Environ. Chem. Eng. 2016, 4, 1040–1049. [Google Scholar] [CrossRef]
- Cao, J.; Yang, D.L.; Pu, Y.; Wang, D.; Wang, J.X. CaF2/SiO2 core–shell nanoparticles as novel fillers with reinforced mechanical properties and sustained fluoride ion release for dental resin composites. J. Mater. Sci. 2021, 56, 16648–16660. [Google Scholar] [CrossRef]
- Dubey, S.; Agrawal, M.; Gupta, A.B. Advances in coagulation technique for treatment of fluoride-contaminated water: a critical review. Rev. Chem. Eng. 2018, 35, 109–137. [Google Scholar] [CrossRef]
- You, S.; Cao, S.; Mo, C.; Zhang, Y.; Lu, J. Synthesis of high purity calcium fluoride from fluoride-containing wastewater. Chem. Eng. J. 2023, 453, 139733. [Google Scholar] [CrossRef]
- Xie, L.; Zhu, J.; Jiang, C. Quantitative study of mixing/segregation behaviors of binary-mixture particles in pilot-scale fluidized bed reactor. Powder Technol. 2021, 377, 103–114. [Google Scholar] [CrossRef]
- Zhang, C.; Li, S.; Wang, Z.; Shen, Y.; Wei, F. Model and experimental study of relationship between solid fraction and back-mixing in a fluidized bed. Powder Technol. 2020, 363, 146–151. [Google Scholar] [CrossRef]
- Xie, Z.; Wang, S.; Shen, Y. CFD-DEM study of segregation and mixing characteristics under a bi-disperse solid-liquid fluidised bed. Adv. Powder Technol. 2021, 32, 4078–4095. [Google Scholar] [CrossRef]
- Feng, D.; Li, H.; Zhu, M.; Han, L.; Zhou, Y. Insight into the interaction mechanism between liquid action and cone structure in liquid-containing gas-solid spouted fluidized bed reactors. Powder Technol. 2022, 408, 117693. [Google Scholar] [CrossRef]
- Crose, M.; Zhang, W.; Tran, A.; Christofides, P.D. Multiscale three-dimensional CFD modeling for PECVD of amorphous silicon thin films. Comput. Chem. Eng. 2018, 113, 184–195. [Google Scholar] [CrossRef]
Disclaimer/Publisher’s Note: The statements, opinions and data contained in all publications are solely those of the individual author(s) and contributor(s) and not of MDPI and/or the editor(s). MDPI and/or the editor(s) disclaim responsibility for any injury to people or property resulting from any ideas, methods, instructions or products referred to in the content. |
© 2024 by the authors. Licensee MDPI, Basel, Switzerland. This article is an open access article distributed under the terms and conditions of the Creative Commons Attribution (CC BY) license (http://creativecommons.org/licenses/by/4.0/).


