Submitted:
28 March 2024
Posted:
28 March 2024
You are already at the latest version
Abstract
Keywords:
1. Introduction
2. Operational Forecast System and Model
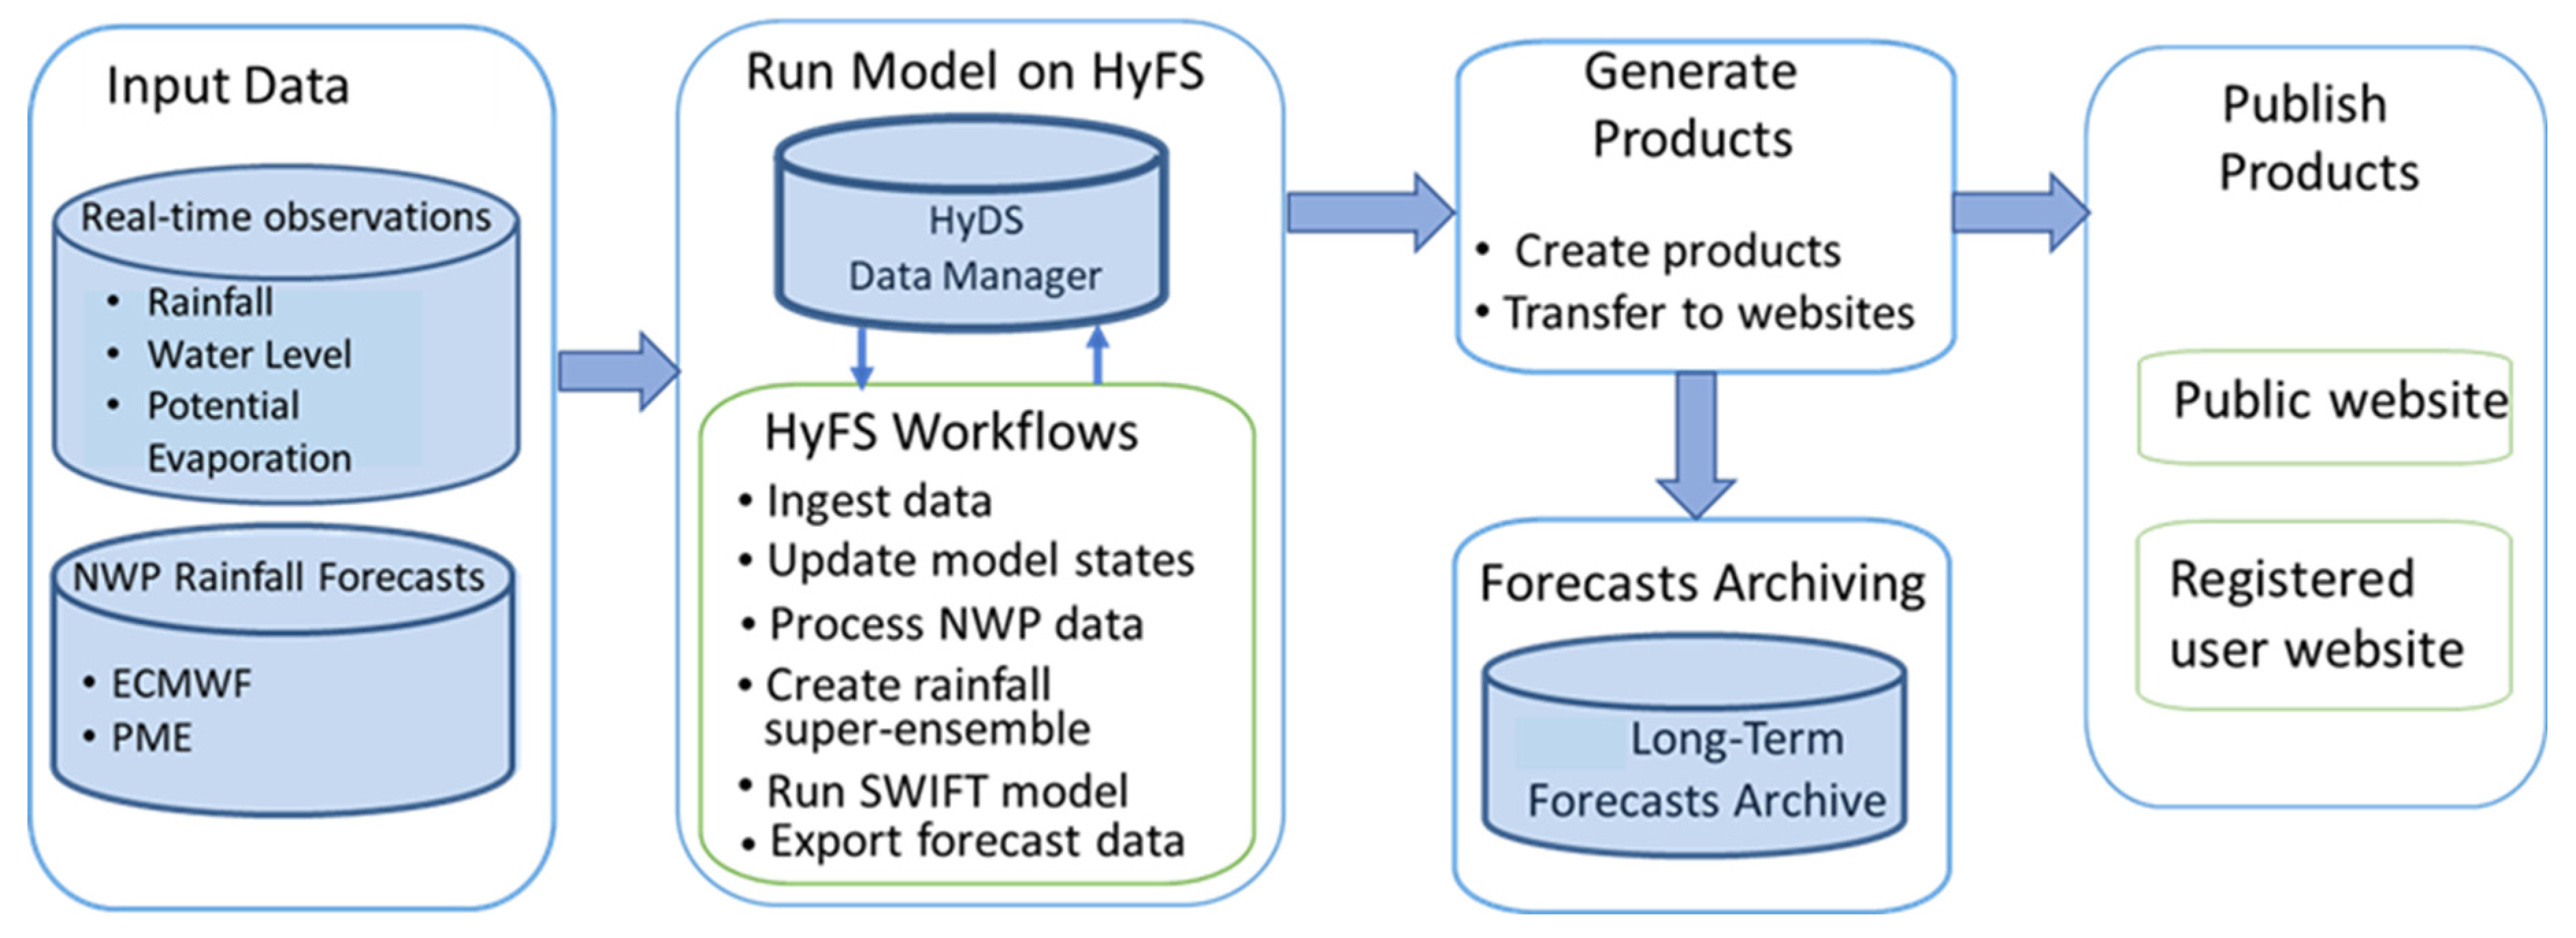
2.1. Description of the System Architecture
2.2. Input Data
2.3. Rainfall-Runoff and Routing Model
2.4. Operational Platform
3. Performance Evaluation Methodology
3.1. Performance Evaluation Metrics
- Deterministic: We considered median of the ensemble members and assessed the performance using the metrics – PBias, NSE, KGE, PCC, RMSE and MAE.
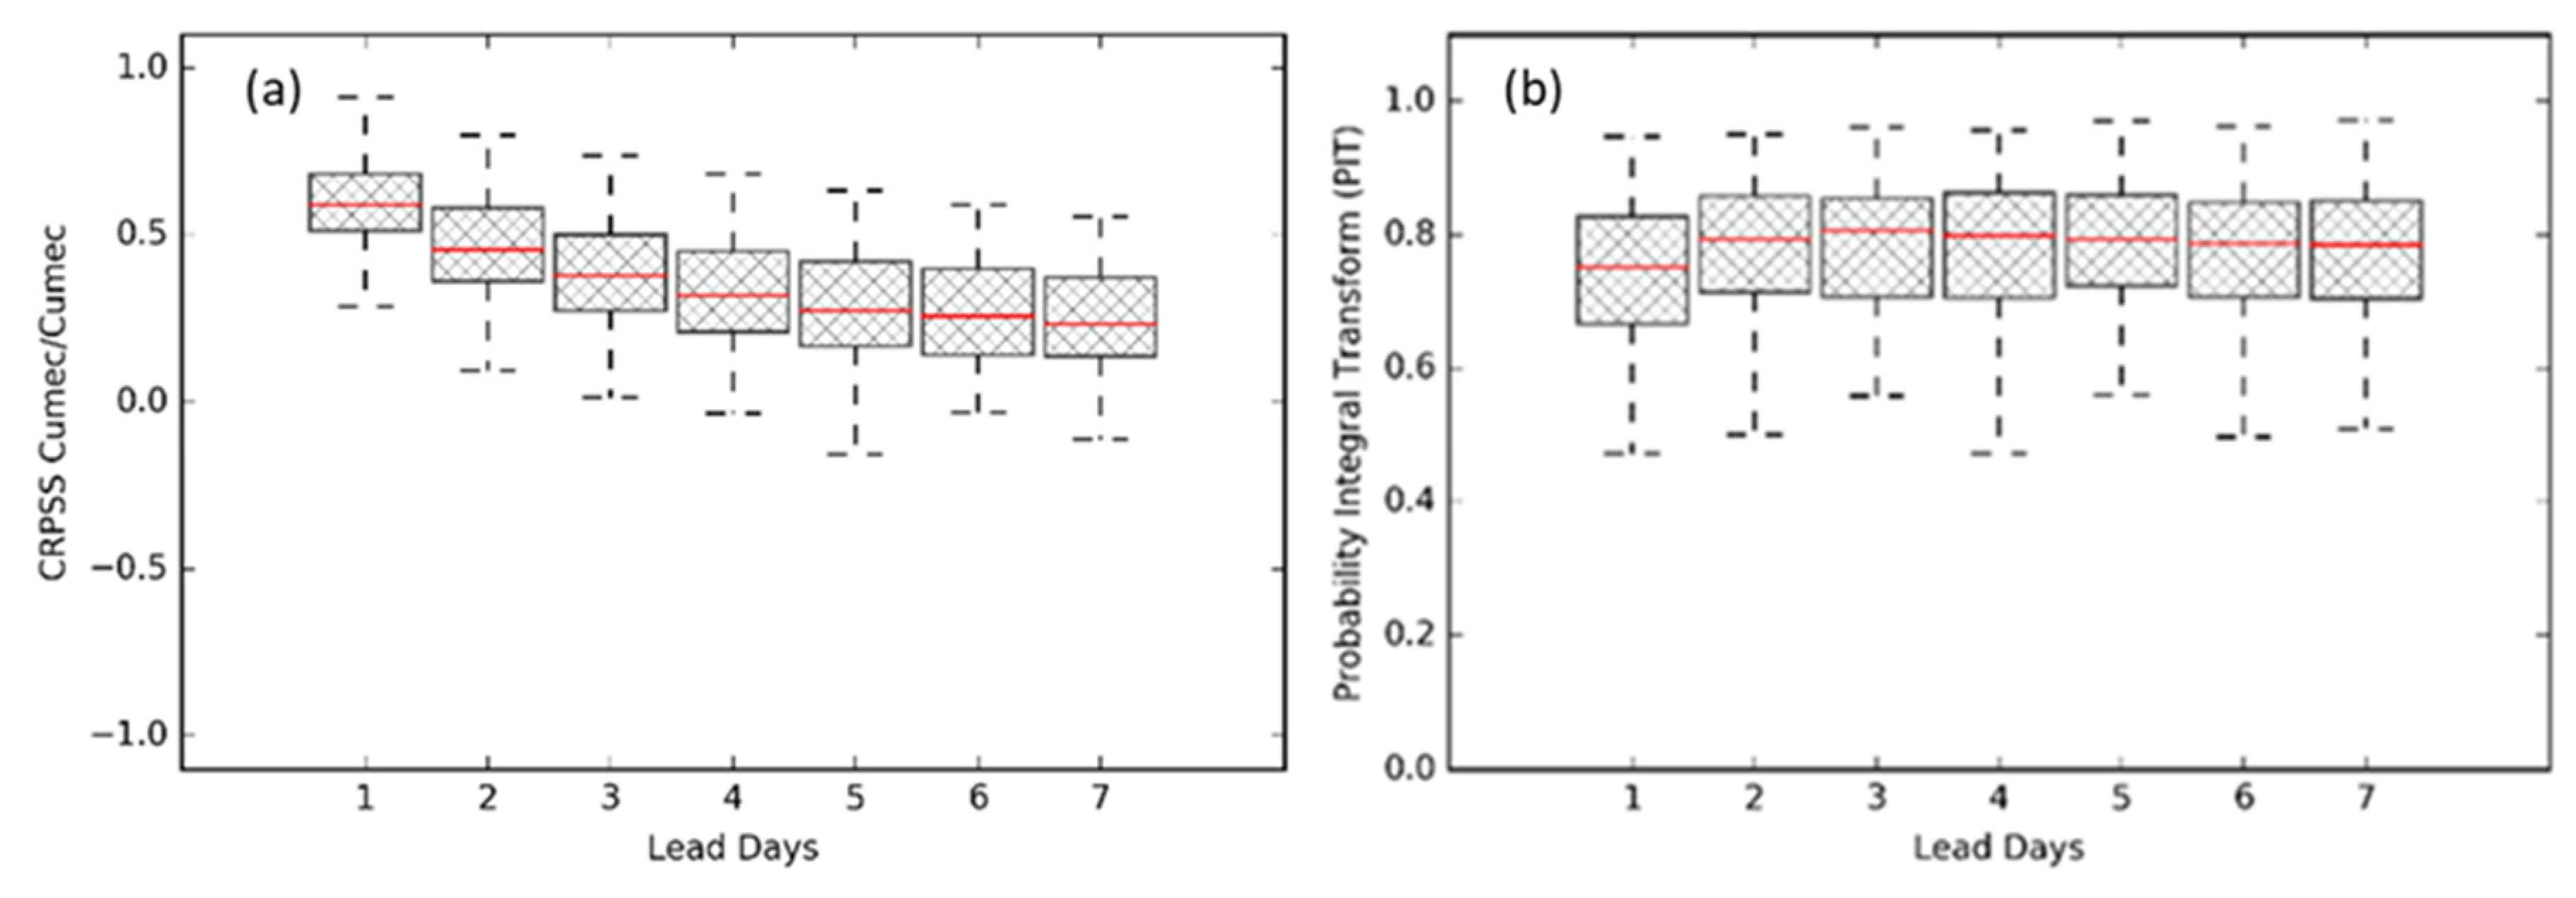
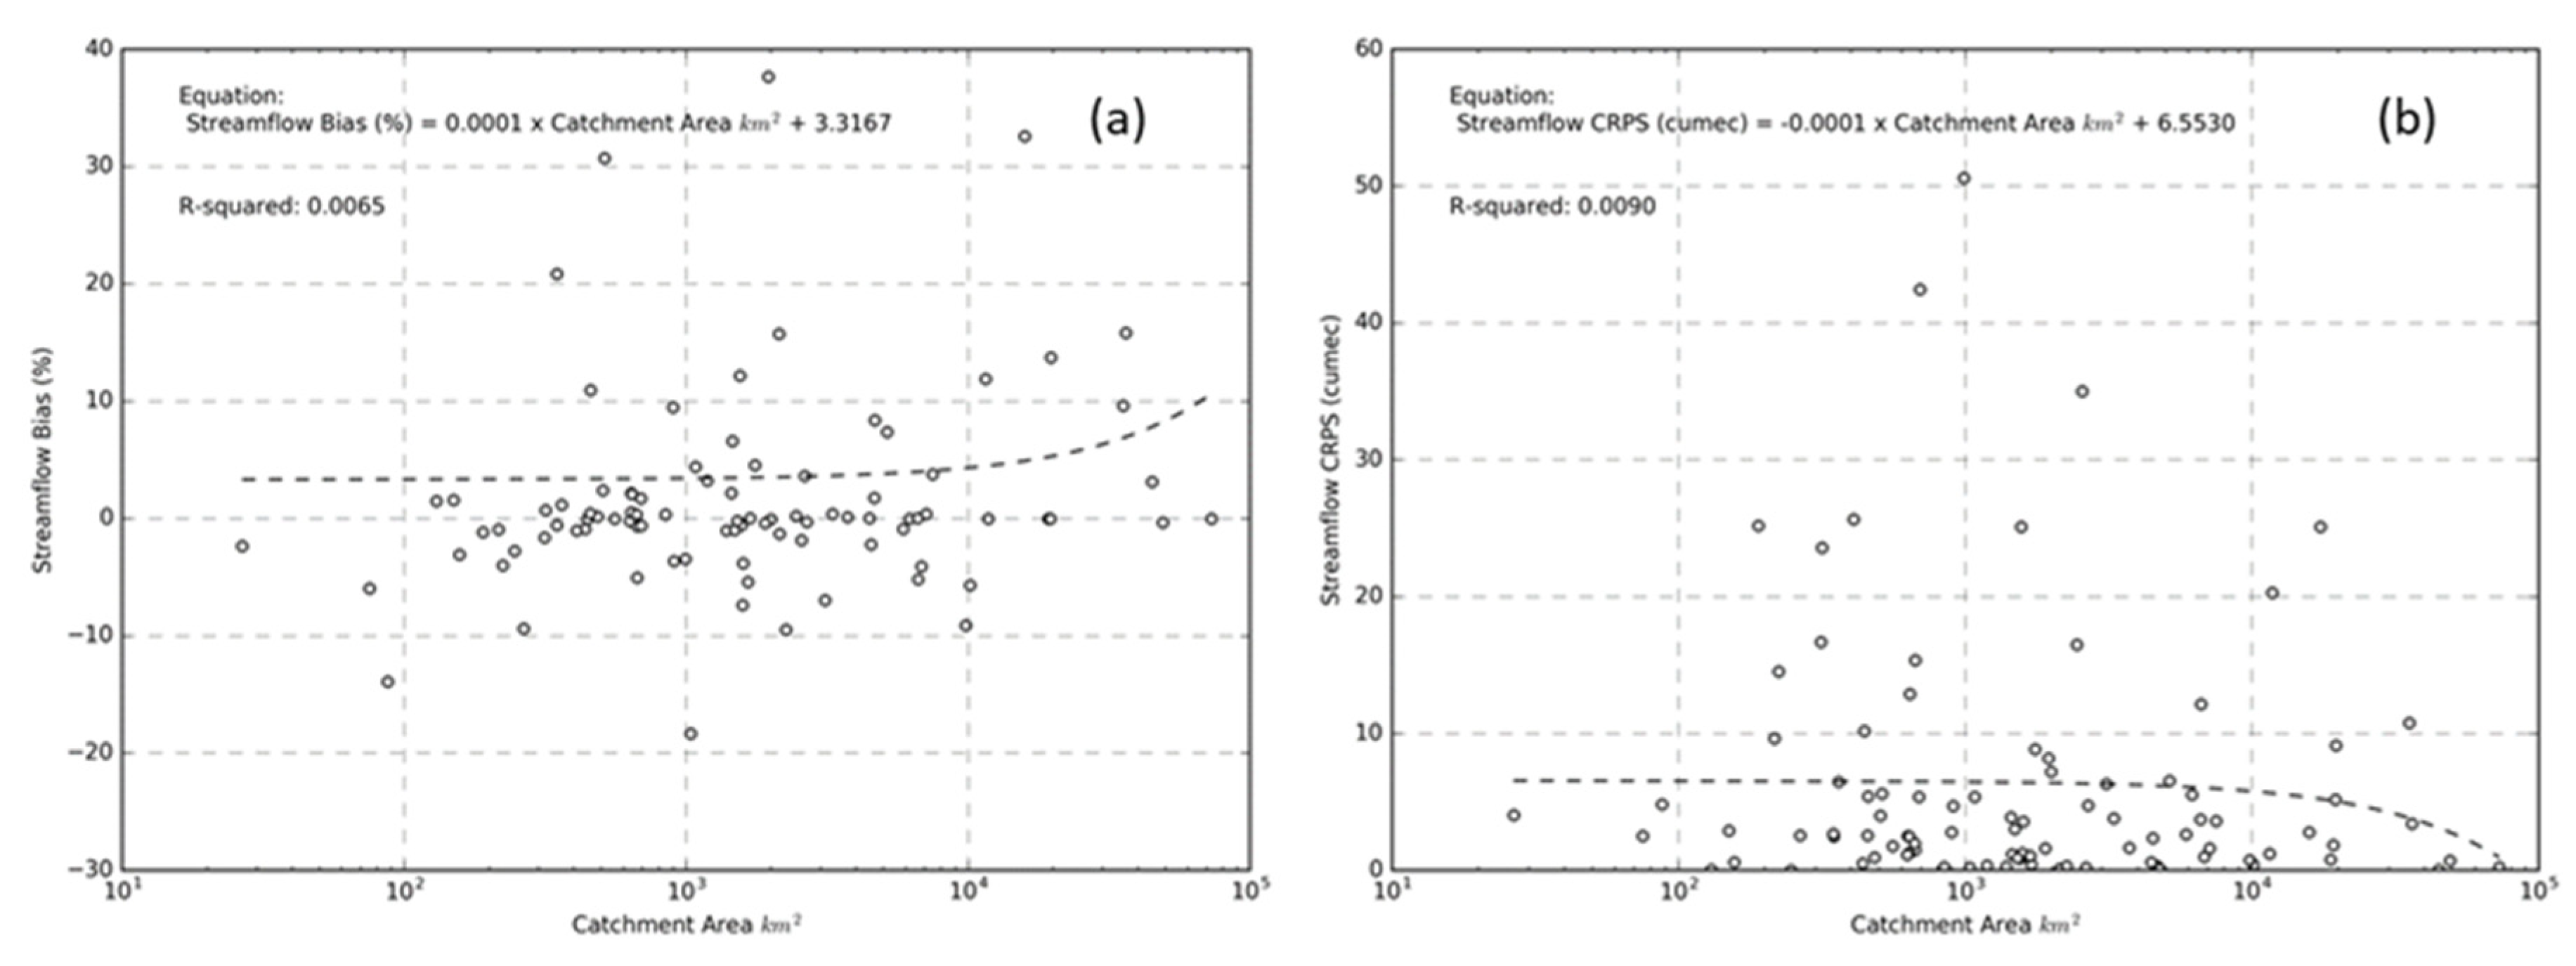
- Ensemble: The metrics included were CRPS, relative CRPS, CRPSS and PIT-Alpha.
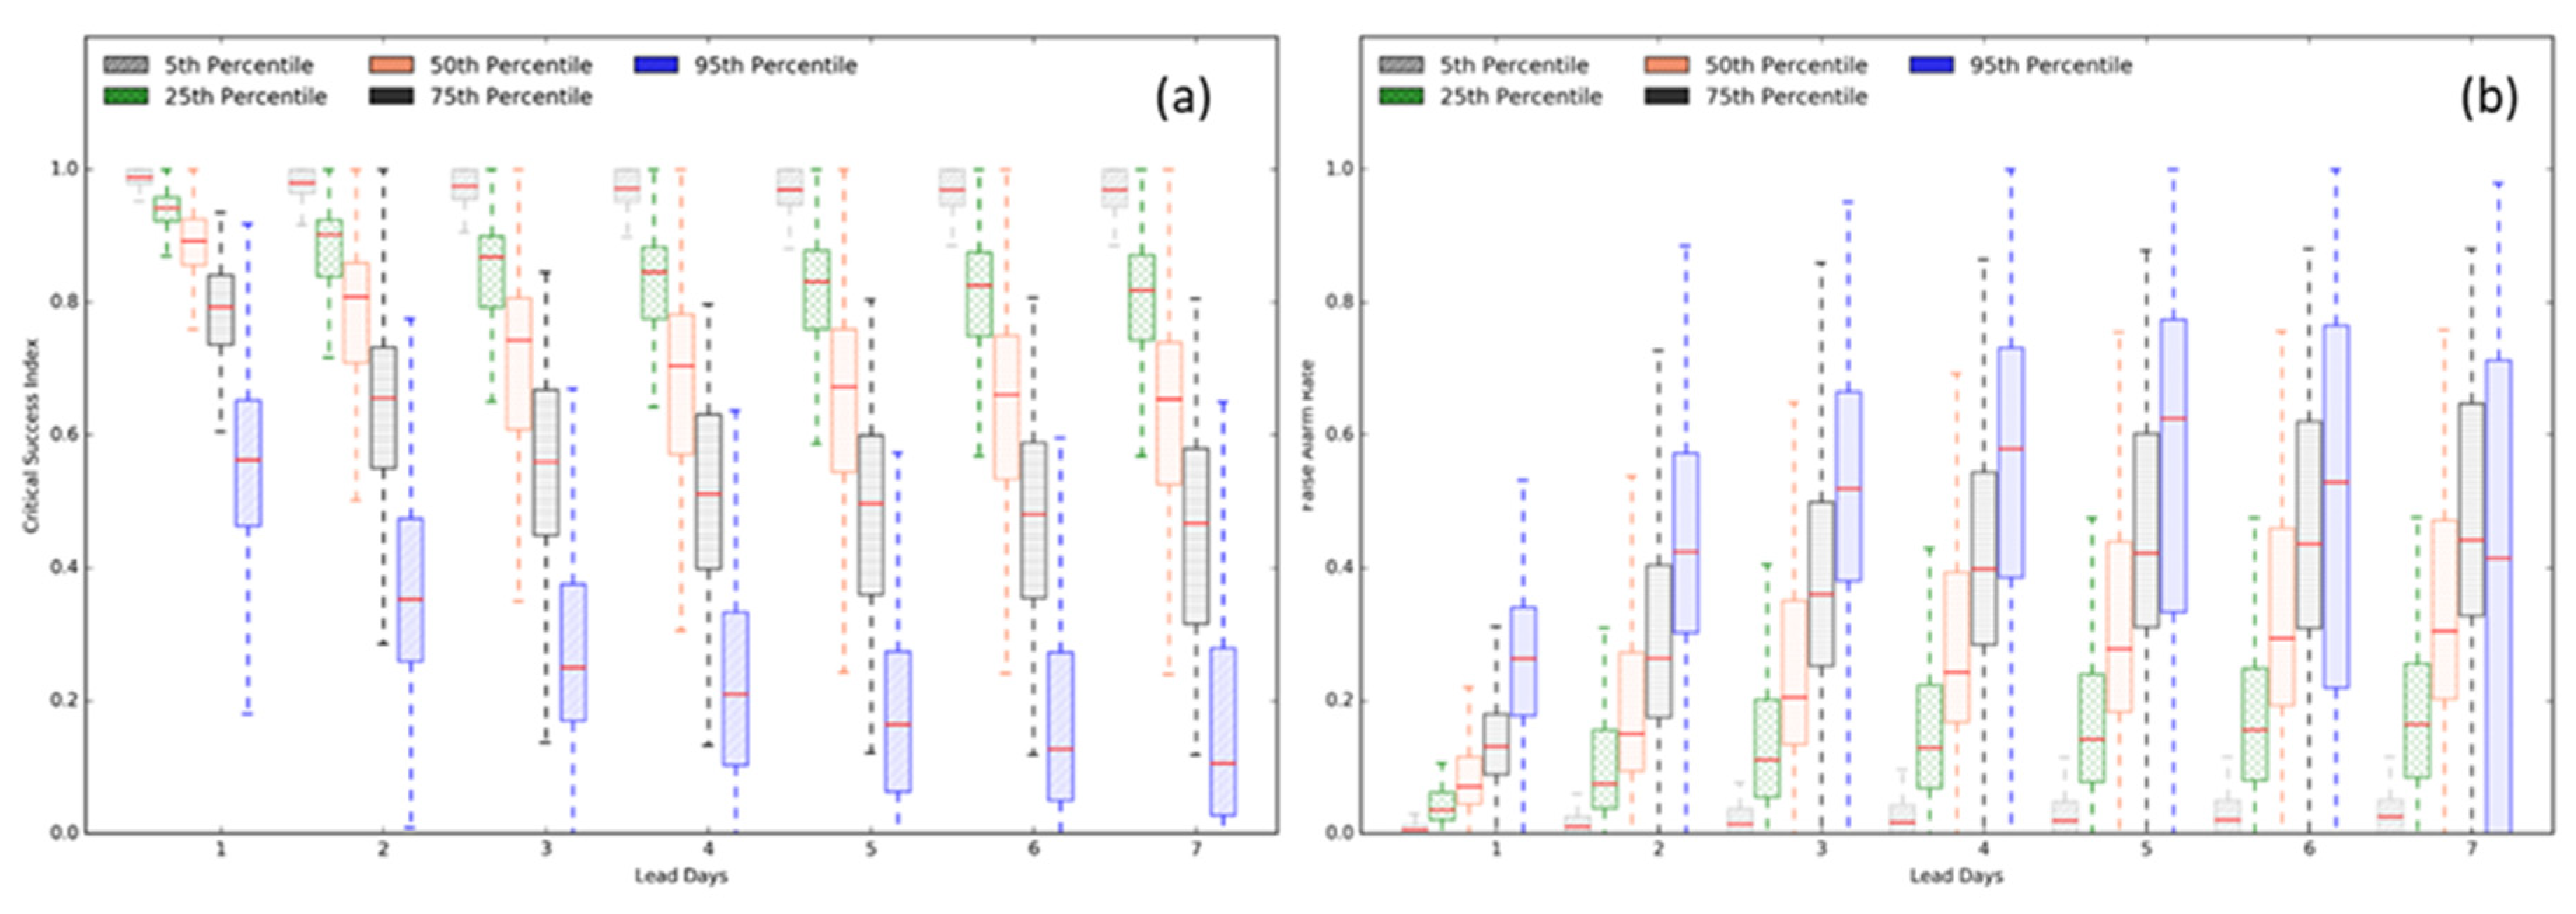
- Categorical: Three metrics were POD, FAR, and CSI.
3.2. Diagnostic Plots
3.3. Forecast Data and Observations
4. Results of Predictive Performance
4.1. Evaluation of Rainfall Forecasts
4.1.1. Performance of Ensemble Mean
4.1.2. Performance of Ensemble Forecasts
4.1.3. Skills and Catchment Areas
4.2. Evaluation of Streamflow Forecasts
4.2.1. Performance of Ensemble Mean
4.2.2. Performance of Ensemble Forecasts
4.2.3. Spatial and Temporal Performance
4.2.4. Performance and Catchment Area
4.2.5. Comparison of Forecast Rainfall and Streamflow Forecast Metrics
5. Discussion and Future Directions
5.1. Service Expansion
5.2. Benefits and Adoption of Forecasting
5.3. Understanding Forecast Skills and Uncertainties
5.4. Adoption for Flood Forecasting Guidance
6. Summary and Conclusions
Author Contributions
Funding
Data Availability Statement
Acknowledgments
Conflicts of Interest
Appendix A. Forecast Performance Evaluation Metrics
References
- Van Dijk, A.I.J.M.; Beck, H.E.; Crosbie, R.S.; De Jeu, R.A.M.; Liu, Y.Y.; Podger, G.M.; Timbal, B.; Viney, N.R. The Millennium Drought in Southeast Australia (2001-2009): Natural and Human Causes and Implications for Water Resources, Ecosystems, Economy, and Society. Water Resour. Res. 2013, 49, 1040–1057. [CrossRef]
- Low, K.G.; Grant, S.B.; Hamilton, A.J.; Gan, K.; Saphores, J.D.; Arora, M.; Feldman, D.L. Fighting Drought with Innovation: Melbourne’s Response to the Millennium Drought in Southeast Australia. Wiley Interdiscip. Rev. Water 2015, 2, 315–328. [CrossRef]
- Kirby, J.M.; Connor, J.; Ahmad, M.D.; Gao, L.; Mainuddin, M. Climate Change and Environmental Water Reallocation in the Murray-Darling Basin: Impacts on Flows, Diversions and Economic Returns to Irrigation. J. Hydrol. 2014, 518, 120–129. [CrossRef]
- Wang, J.; Horne, A.; Nathan, R.; Peel, M.; Neave, I. Vulnerability of Ecological Condition to the Sequencing of Wet and Dry Spells Prior to and during the Murray-Darling Basin Millennium Drought. J. Water Resour. Plan. Manag. 2018, 144. [CrossRef]
- Kabir, A.; Hasan, M.M.; Hapuarachchi, H.A.P.; Zhang, X.S.; Liyanage, J.; Gamage, N.; Laugesen, R.; Plastow, K.; MacDonald, A.; Bari, M.A.; et al. Evaluation of Multi-Model Rainfall Forecasts for the National 7-Day Ensemble Streamflow Forecasting Service. 2018 Hydrol. Water Resour. Symp. HWRS 2018 Water Communities 2018, 393–406.
- Hapuarachchi, H.A.P.; Kabir, A.; Zhang, X.S.; Kent, D.; Bari, M.A.; Tuteja, N.K.; Hasan, M.M.; Enever, D.; Shin, D.; Plastow, K.; et al. Performance Evaluation of the National 7-Day Water Forecast Service. Proc. - 22nd Int. Congr. Model. Simulation, MODSIM 2017 2017, 1815–1821. [CrossRef]
- Boucher, M.A.; Anctil, F.; Perreault, L.; Tremblay, D. A Comparison between Ensemble and Deterministic Hydrological Forecasts in an Operational Context. Adv. Geosci. 2011, 29, 85–94. [CrossRef]
- Hapuarachchi, H.A.P.; Bari, M.A.; Kabir, A.; Hasan, M.M.; Woldemeskel, F.M.; Gamage, N.; Sunter, P.D.; Zhang, X.S.; Robertson, D.E.; Bennett, J.C.; et al. Development of a National 7-Day Ensemble Streamflow Forecasting Service for Australia. Hydrol. Earth Syst. Sci. 2022, 26, 4801–4821. [CrossRef]
- Daley, J.; Wood, D.; Chivers, C. Regional Patterns of Australia’s Economy and Population; 2017; ISBN 9780987612151.
- Stern, H.; De Hoedt, G.; Ernst, J. Objective Classification of Australian Climates. Aust. Meteorol. Mag. 2000.
- Milly, P.C.D.; Dunne, K.A.; Vecchia, A. V. Global Pattern of Trends in Streamflow and Water Availability in a Changing Climate. Nature 2005, 438, 347–350. [CrossRef]
- Troin, M.; Arsenault, R.; Wood, A.W.; Brissette, F.; Martel, J.L. Generating Ensemble Streamflow Forecasts: A Review of Methods and Approaches Over the Past 40 Years. Water Resour. Res. 2021, 57, 1–48. [CrossRef]
- Kumar, V.; Sharma, K.V.; Caloiero, T.; Mehta, D.J. Comprehensive Overview of Flood Modeling Approaches: A Review of Recent Advances. 2023. [CrossRef]
- Pappenberger, F.; Ramos, M.H.; Cloke, H.L.; Wetterhall, F.; Alfieri, L.; Bogner, K.; Mueller, A.; Salamon, P. How Do I Know If My Forecasts Are Better? Using Benchmarks in Hydrological Ensemble Prediction. J. Hydrol. 2015, 522, 697–713. [CrossRef]
- Wu, W.; Emerton, R.; Duan, Q.; Wood, A.W.; Wetterhall, F.; Robertson, D.E. Ensemble Flood Forecasting: Current Status and Future Opportunities. Wiley Interdiscip. Rev. Water 2020, 7. [CrossRef]
- Emerton, R.E.; Stephens, E.M.; Pappenberger, F.; Pagano, T.C.; Weerts, A.H.; Wood, A.W.; Salamon, P.; Brown, J.D.; Hjerdt, N.; Donnelly, C.; et al. Continental and Global Scale Flood Forecasting Systems. Wiley Interdiscip. Rev. Water 2016, 3, 391–418. [CrossRef]
- Demargne, J.; Wu, L.; Regonda, S.K.; Brown, J.D.; Lee, H.; He, M.; Seo, D.J.; Hartman, R.; Herr, H.D.; Fresch, M.; et al. The Science of NOAA’s Operational Hydrologic Ensemble Forecast Service. Bull. Am. Meteorol. Soc. 2014, 95, 79–98. [CrossRef]
- Zahmatkesh, Z.; Jha, S.K.; Coulibaly, P.; Stadnyk, T. 17 CrossRef Citations to Date 1 Altmetric Articles An Overview of River Flood Forecasting Procedures in Canadian Watersheds. Can. Water Resour. Jouurnal 2019, 44, 219–229. [CrossRef]
- Siqueira, V.A.; Fan, F.M.; Paiva, R.C.D. de; Ramos, M.H.; Collischonn, W. Potential Skill of Continental-Scale, Medium-Range Ensemble Streamflow Forecasts for Flood Prediction in South America. J. Hydrol. 2020, 590, 125430. [CrossRef]
- Siddique, R.; Mejia, A. Ensemble Streamflow Forecasting across the U.S. Mid-Atlantic Region with a Distributed Hydrological Model Forced by GEFS Reforecasts. J. Hydrometeorol. 2017, 18, 1905–1928. [CrossRef]
- Mai, J.; Arsenault, R.; Tolson, B.A.; Latraverse, M.; Demeester, K. Application of Parameter Screening to Derive Optimal Initial State Adjustments for Streamflow Forecasting. Water Resour. Res. 2020, 56, 1–22. [CrossRef]
- Liu, L.; Ping Xu, Y.; Li Pan, S.; Xu Bai, Z. Potential Application of Hydrological Ensemble Prediction in Forecasting Floods and Its Components over the Yarlung Zangbo River Basin, China. Hydrol. Earth Syst. Sci. 2019, 23, 3335–3352. [CrossRef]
- Raupach, M.R.; Briggs, P.R.; Haverd, V.; King, E.A.; Paget, M.; Trudinger, C.M. The Centre for Australian Weather and Climate Research A Partnership between CSIRO and the Bureau of Meteorology Australian Water Availability Project (AWAP): CSIRO Marine and Atmospheric Research Component: Final Report for Phase 3; Canberra, 2009;
- Robertson, D.E.; Shrestha, D.L.; Wang, Q.J. Post-Processing Rainfall Forecasts from Numerical Weather Prediction Models for Short-Term Streamflow Forecasting. Hydrol. Earth Syst. Sci. 2013, 17, 3587–3603. [CrossRef]
- Perraud, J.M.; Bridgart, R.; Bennett, J.C.; Robertson, D. Swift2: High Performance Software for Short-Medium Term Ensemble Streamflow Forecasting Research and Operations. In Proceedings of the Proceedings - 21st International Congress on Modelling and Simulation, MODSIM 2015; 2015.
- Perrin, C.; Michel, C.; Andréassian, V. Improvement of a Parsimonious Model for Streamflow Simulation. J. Hydrol. 2003. [CrossRef]
- Coron, L.; Andréassian, V.; Perrin, C.; Lerat, J.; Vaze, J.; Bourqui, M.; Hendrickx, F. Crash Testing Hydrological Models in Contrasted Climate Conditions: An Experiment on 216 Australian Catchments. Water Resour. Res. 2012. [CrossRef]
- Li, M.; Wang, Q.J.; Bennett, J.C.; Robertson, D.E. Error Reduction and Representation in Stages (ERRIS) in Hydrological Modelling for Ensemble Streamflow Forecasting. Hydrol. Earth Syst. Sci. 2016. [CrossRef]
- Lucatero, D.; Madsen, H.; Refsgaard, J.C.; Kidmose, J.; Jensen, K.H. Seasonal Streamflow Forecasts in the Ahlergaarde Catchment, Denmark: The Effect of Preprocessing and Post-Processing on Skill and Statistical Consistency. Hydrol. Earth Syst. Sci. 2018, 22, 3601–3617. [CrossRef]
- Roy, T.; He, X.; Lin, P.; Beck, H.E.; Castro, C.; Wood, E.F. Global Evaluation of Seasonal Precipitation and Temperature Forecasts from Nmme. J. Hydrometeorol. 2020, 21, 2473–2486. [CrossRef]
- D. S. Wilks. Statistical Methods in the Atmospheric Sciences, Second Edition; 2007; Vol. 14; ISBN 0127519653.
- Manubens, N.; Caron, L.P.; Hunter, A.; Bellprat, O.; Exarchou, E.; Fučkar, N.S.; Garcia-Serrano, J.; Massonnet, F.; Ménégoz, M.; Sicardi, V.; et al. An R Package for Climate Forecast Verification. Environ. Model. Softw. 2018, 103, 29–42. [CrossRef]
- Jackson, E.K.; Roberts, W.; Nelsen, B.; Williams, G.P.; Nelson, E.J.; Ames, D.P. Introductory Overview: Error Metrics for Hydrologic Modelling – A Review of Common Practices and an Open Source Library to Facilitate Use and Adoption. Environ. Model. Softw. 2019, 119, 32–48. [CrossRef]
- Murphy, A.H. What Is a Good Forecast? An Essay on the Nature of Goodness in Weather Forecasting. Am. Meteorol. Soc. 1993, 8, 281–293. [CrossRef]
- Vitart, F.; Ardilouze, C.; Bonet, A.; Brookshaw, A.; Chen, M.; Codorean, C.; Déqué, M.; Ferranti, L.; Fucile, E.; Fuentes, M.; et al. The Subseasonal to Seasonal (S2S) Prediction Project Database. Bull. Am. Meteorol. Soc. 2017, 98, 163–173. [CrossRef]
- Becker, E.; van den Dool, H. Probabilistic Seasonal Forecasts in the North American Multimodel Ensemble: A Baseline Skill Assessment. J. Clim. 2016, 29, 3015–3026. [CrossRef]
- Bennett, J.C.; Robertson, D.E.; Wang, Q.J.; Li, M.; Perraud, J.M. Propagating Reliable Estimates of Hydrological Forecast Uncertainty to Many Lead Times. J. Hydrol. 2021. [CrossRef]
- Huang, Z.; Zhao, T. Predictive Performance of Ensemble Hydroclimatic Forecasts: Verification Metrics, Diagnostic Plots and Forecast Attributes. Wiley Interdiscip. Rev. Water 2022, 9, 1–30. [CrossRef]
- Krzysztofowicz, R. Bayesian Theory of Probabilistic Forecasting via Deterministic Hydrologic Model. 1999, 35, 2739–2750. [CrossRef]
- McMillan, H.K.; Booker, D.J.; Cattoën, C. Validation of a National Hydrological Model. J. Hydrol. 2016, 541, 800–815. [CrossRef]
- Hossain, M.M.; Faisal Anwar, A.H.M.; Garg, N.; Prakash, M.; Bari, M. Monthly Rainfall Prediction at Catchment Level with the Facebook Prophet Model Using Observed and CMIP5 Decadal Data. Hydrology 2022, 9. [CrossRef]
- Wu, H.; Adler, R.F.; Tian, Y.; Gu, G.; Huffman, G.J. Evaluation of Quantitative Precipitation Estimations through Hydrological Modeling in IFloods River Basins. J. Hydrometeorol. 2017, 18, 529–553. [CrossRef]
- Piadeh, F.; Behzadian, K.; Alani, A.M. A Critical Review of Real-Time Modelling of Flood Forecasting in Urban Drainage Systems. J. Hydrol. 2022, 607, 127476. [CrossRef]
- Xu, J.; Ye, A.; Duan, Q.; Ma, F.; Zhou, Z. Improvement of Rank Histograms for Verifying the Reliability of Extreme Event Ensemble Forecasts. Environ. Model. Softw. 2017, 92, 152–162. [CrossRef]
- Yang, C.; Yuan, H.; Su, X. Bias Correction of Ensemble Precipitation Forecasts in the Improvement of Summer Streamflow Prediction Skill. J. Hydrol. 2020, 588, 124955. [CrossRef]
- Feng, J.; Li, J.; Zhang, J.; Liu, D.; Ding, R. The Relationship between Deterministic and Ensemble Mean Forecast Errors Revealed by Global and Local Attractor Radii. Adv. Atmos. Sci. 2019, 36, 271–278. [CrossRef]
- Duan, W.; Huo, Z. An Approach to Generating Mutually Independent Initial Perturbations for Ensemble Forecasts: Orthogonal Conditional Nonlinear Optimal Perturbations. J. Atmos. Sci. 2016, 73, 997–1014. [CrossRef]
- Singh, A.; Mondal, S.; Samal, N.; Jha, S.K. Evaluation of Precipitation Forecasts for Five-Day Streamflow Forecasting in Narmada River Basin. Hydrol. Sci. J. 2022, 00, 1–19. [CrossRef]
- Cai, C.; Wang, J.; Li, Z.; Shen, X.; Wen, J.; Wang, H.; Wu, C. A New Hybrid Framework for Error Correction and Uncertainty Analysis of Precipitation Forecasts with Combined Postprocessors. Water (Switzerland) 2022, 14. [CrossRef]
- Acharya, S.C.; Nathan, R.; Wang, Q.J.; Su, C.H.; Eizenberg, N. An Evaluation of Daily Precipitation from a Regional Atmospheric Reanalysis over Australia. Hydrol. Earth Syst. Sci. 2019, 23, 3387–3403. [CrossRef]
- Liu, D. A Rational Performance Criterion for Hydrological Model. J. Hydrol. 2020, 590, 125488. [CrossRef]
- Cai, Y.; Jin, C.; Wang, A.; Guan, D.; Wu, J.; Yuan, F.; Xu, L. Spatio-Temporal Analysis of the Accuracy of Tropical Multisatellite Precipitation Analysis 3b42 Precipitation Data in Mid-High Latitudes of China. PLoS ONE 2015, 10, 1–22. [CrossRef]
- Ghajarnia, N.; Liaghat, A.; Daneshkar Arasteh, P. Comparison and Evaluation of High Resolution Precipitation Estimation Products in Urmia Basin-Iran. Atmos. Res. 2015, 158–159, 50–65. [CrossRef]
- Cattoën, C.; Conway, J.; Fedaeff, N.; Lagrava, D.; Blackett, P.; Montgomery, K.; Shankar, U.; Carey-Smith, T.; Moore, S.; Mari, A.; et al. A National Flood Awareness System for Ungauged Catchments in Complex Topography: The Case of Development, Communication and Evaluation in New Zealand. J. Flood Risk Manag. 2022, 1–28. [CrossRef]
- Tian, B.; Chen, H.; Wang, J.; Xu, C.Y. Accuracy Assessment and Error Cause Analysis of GPM (V06) in Xiangjiang River Catchment. Hydrol. Res. 2021, 52, 1048–1065. [CrossRef]
- Tedla, H.Z.; Taye, E.F.; Walker, D.W.; Haile, A.T. Evaluation of WRF Model Rainfall Forecast Using Citizen Science in a Data-Scarce Urban Catchment: Addis Ababa, Ethiopia. J. Hydrol. Reg. Stud. 2022, 44, 101273. [CrossRef]
- Hossain, S.; Cloke, H.L.; Ficchì, A.; Gupta, H.; Speight, L.; Hassan, A.; Stephens, E.M. A Decision-Led Evaluation Approach for Flood Forecasting System Developments: An Application to the Global Flood Awareness System in Bangladesh. J. Flood Risk Manag. 2023, 1–22. [CrossRef]
- McMahon, T.A.; Peel, M.C. Uncertainty in Stage–Discharge Rating Curves: Application to Australian Hydrologic Reference Stations Data. Hydrol. Sci. J. 2019, 64, 255–275. [CrossRef]
- Matthews, G.; Barnard, C.; Cloke, H.; Dance, S.L.; Jurlina, T.; Mazzetti, C.; Prudhomme, C. Evaluating the Impact of Post-Processing Medium-Range Ensemble Streamflow Forecasts from the European Flood Awareness System. Hydrol. Earth Syst. Sci. 2022, 26, 2939–2968. [CrossRef]
- Dion, P.; Martel, J.L.; Arsenault, R. Hydrological Ensemble Forecasting Using a Multi-Model Framework. J. Hydrol. 2021, 600, 126537. [CrossRef]
- Dey, R.; Lewis, S.C.; Arblaster, J.M.; Abram, N.J. A Review of Past and Projected Changes in Australia’s Rainfall. Wiley Interdiscip. Rev. Clim. Chang. 2019, 10. [CrossRef]
- Vivoni, E.R.; Entekhabi, D.; Bras, R.L.; Ivanov, V.Y.; Van Horne, M.P.; Grassotti, C.; Hoffman, R.N. Extending the Predictability of Hydrometeorological Flood Events Using Radar Rainfall Nowcasting. J. Hydrometeorol. 2006, 7, 660–677. [CrossRef]
- Oda, T.; Maksyutov, S.; Andres, R.J.; Office, A.; Technology, E.S.; Information, D.; Ridge, O.; Ridge, O. Scaling, Similarity, and the Fourth Paradigm for Hydrology. Hydrol. Earth Syst. Sci. 2019, 10, 87–107. [CrossRef]
- Robertson, D.E.; Bennett, J.C.; Shrestha, D.L. Assimilating Observations from Multiple Stream Gauges into Semi-Distributed Hydrological Models for Streamflow Forecasting. 2020, 1–55.
- Bruno Soares, M.; Dessai, S. Barriers and Enablers to the Use of Seasonal Climate Forecasts amongst Organisations in Europe. Clim. Change 2016, 137, 89–103. [CrossRef]
- Viel, C.; Beaulant, A.-L.; Soubeyroux, J.-M.; Céron, J.-P. How Seasonal Forecast Could Help a Decision Maker: An Example of Climate Service for Water Resource Management. Adv. Sci. Res. 2016, 13, 51–55. [CrossRef]
- Turner, S.W.D.; Bennett, J.C.; Robertson, D.E.; Galelli, S. Complex Relationship between Seasonal Streamflow Forecast Skill and Value in Reservoir Operations. Hydrol. Earth Syst. Sci. 2017, 21, 4841–4859. [CrossRef]
- Schepen, A.; Zhao, T.; Wang, Q.J.; Zhou, S.; Feikema, P. Optimising Seasonal Streamflow Forecast Lead Time for Operational Decision Making in Australia. Hydrol. Earth Syst. Sci. 2016, 20, 4117–4128. [CrossRef]
- Anghileri, D.; Voisin, N.; Castelletti, A.; Pianosi, F.; Nijssen, B.; Lettenmaier, D.P.; 1Institute Value of Long-Term Streamflow Forecasts to Reservoir Operations for Water Supply in Snow-Dominated River Catchments. Water Resour. Res. 2016, 52, 4209–4225. [CrossRef]
- Ahmad, S.K.; Hossain, F. A Web-Based Decision Support System for Smart Dam Operations Using Weather Forecasts. J. Hydroinformatics 2019, 21, 687–707. [CrossRef]
- Woldemeskel, F.; Kabir, A.; Hapuarachchi, P.; Bari, M. Adoption of 7-Day Streamflow Forecasting Service for Operational Decision Making in the Murray Darling Basin, Australia. Hydrol. Water Resour. Symp. (HWRS 2021), 24 August—1 Sept. 2021 2021.
- Lorenz, E.N. The Predictability of a Flow Which Possesses Many Scales of Motion. Tellus A Dyn. Meteorol. Oceanogr. 1969, 21, 289. [CrossRef]
- Cuo, L.; Pagano, T.C.; Wang, Q.J. A Review of Quantitative Precipitation Forecasts and Their Use in Short- to Medium-Range Streamflow Forecasting. J. Hydrometeorol. 2011, 12, 713–728. [CrossRef]
- Kalnay, E. Historical Perspective: Earlier Ensembles and Forecasting Forecast Skill. Q. J. R. Meteorol. Soc. 2019, 145, 25–34. [CrossRef]
- Specq, D.; Batté, L.; Déqué, M.; Ardilouze, C. Multimodel Forecasting of Precipitation at Subseasonal Timescales Over the Southwest Tropical Pacific. Earth Sp. Sci. 2020, 7. [CrossRef]
- Zappa, M.; Jaun, S.; Germann, U.; Walser, A.; Fundel, F. Superposition of Three Sources of Uncertainties in Operational Flood Forecasting Chains. Atmos. Res. 2011, 100, 246–262. [CrossRef]
- Ghimire, G.R.; Krajewski, W.F. Exploring Persistence in Streamflow Forecasting. J. Am. Water Resour. Assoc. 2020, 56, 542–550. [CrossRef]
- Harrigan, S.; Prudhomme, C.; Parry, S.; Smith, K.; Tanguy, M. Benchmarking Ensemble Streamflow Prediction Skill in the UK. Hydrol. Earth Syst. Sci. 2018, 22, 2023–2039. [CrossRef]
- Demargne, J.; Wu, L.; Regonda, S.K.; Brown, J.D.; Lee, H.; He, M.; Seo, D.J.; Hartman, R.K.; Herr, H.D.; Fresch, M.; et al. Design and Implementation of an Operational Multimodel Multiproduct Real-Time Probabilistic Streamflow Forecasting Platform. J. Hydrometeorol. 2017, 56, 91–101. [CrossRef]
- Nash, J.E.; Sutcliffe, J. V. River Flow Forecasting through Conceptual Models Part I - A Discussion of Principles. J. Hydrol. 1970, 10, 282–290. [CrossRef]
- Gupta, H.V.; Kling, H. On Typical Range, Sensitivity, and Normalization of Mean Squared Error and Nash-Sutcliffe Efficiency Type Metrics. Water Resour. Res. 2011, 47, 2–4. [CrossRef]
- Hersbach, H. Decomposition of the Continuous Ranked Probability Score for Ensemble Prediction Systems. Weather Forecast. 2000, 15, 559–570. [CrossRef]
- Laio, F.; Tamea, S. Verification Tools for Probabilistic Forecasts of Continuous Hydrological Variables. Hydrol. Earth Syst. Sci. 2007, 11, 1267–1277. [CrossRef]
- Renard, B.; Kavetski, D.; Kuczera, G.; Thyer, M.; Franks, S.W. Understanding Predictive Uncertainty in Hydrologic Modeling: The Challenge of Identifying Input and Structural Errors. Water Resour. Res. 2010, 46, 1–22. [CrossRef]
- Schaefer, J. The Critical Success Index as an Indicator of Warning Skill. Weather Forecast. 1990, 5, 570–575. [CrossRef]
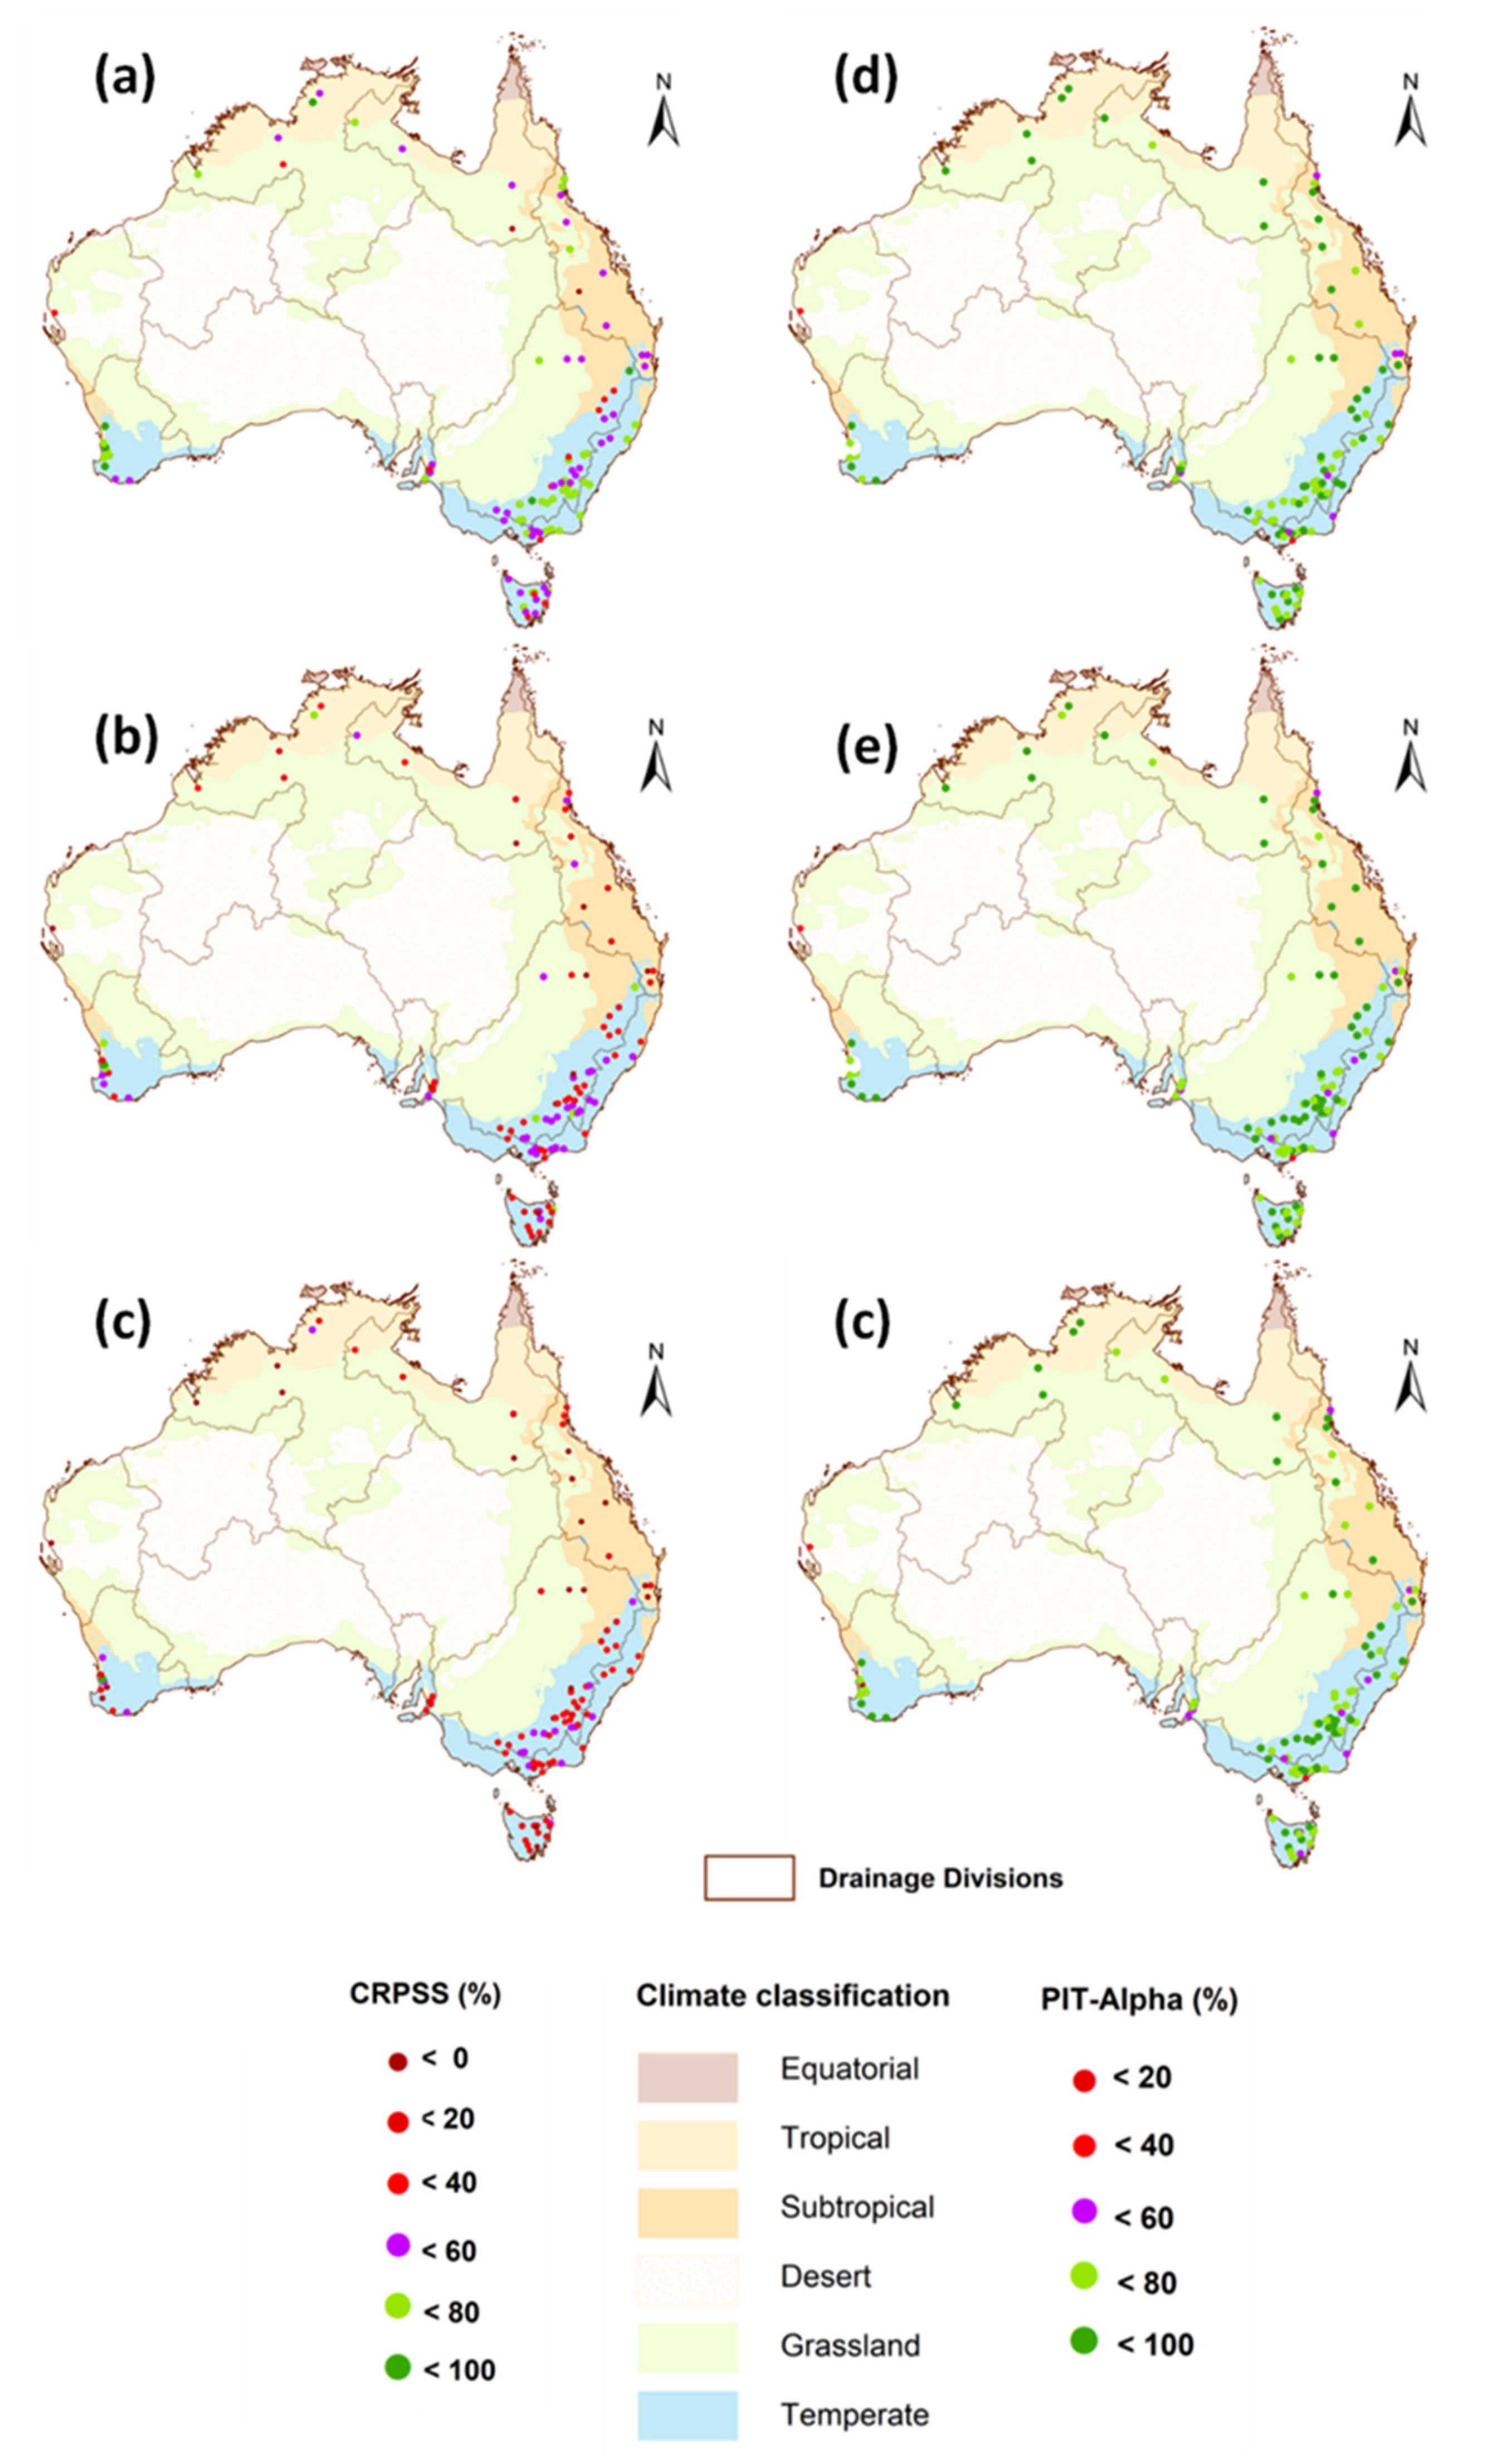
| Jurisdiction | Number of locations | NSE (%) | CRPSS (%) | PIT-Alpha (%) | |||||||||
| 5th | 50th | 95th | Max | 5th | 50th | 95th | Max | 5th | 50th | 95th | Max | ||
| New South Wales | 28 | <0 | 29 | 63 | 68 | 13 | 39 | 57 | 63 | 57 | 81 | 91 | 92 |
| Northern Territory | 4 | 43 | 59 | 88 | 91 | 29 | 41 | 65 | 67 | 70 | 81 | 85 | 85 |
| Queensland | 15 | <0 | 13 | 82 | 83 | <0 | 20 | 60 | 70 | 50 | 81 | 93 | 94 |
| South Australia | 4 | <0 | 22 | 62 | 68 | 6 | 24 | 50 | 54 | 51 | 71 | 78 | 78 |
| Tasmania | 14 | <0 | 43 | 71 | 71 | <0 | 33 | 57 | 63 | 63 | 78 | 91 | 91 |
| Victoria | 19 | <0 | 38 | 72 | 82 | 21 | 47 | 60 | 63 | 55 | 79 | 91 | 93 |
| Western Australia | 12 | <0 | 75 | 88 | 94 | 12 | 44 | 84 | 92 | 45 | 83 | 91 | 96 |
Disclaimer/Publisher’s Note: The statements, opinions and data contained in all publications are solely those of the individual author(s) and contributor(s) and not of MDPI and/or the editor(s). MDPI and/or the editor(s) disclaim responsibility for any injury to people or property resulting from any ideas, methods, instructions or products referred to in the content. |
© 2024 by the authors. Licensee MDPI, Basel, Switzerland. This article is an open access article distributed under the terms and conditions of the Creative Commons Attribution (CC BY) license (http://creativecommons.org/licenses/by/4.0/).


