1. Introduction
Chromium (Cr) metal has garnered considerable interest within alloy systems owing to its elevated melting point, reduced density, and enhanced resistance to oxidation when compared to nickel-based superalloys [
1,
2,
3]. Furthermore, its elevated hardness, diminished coefficient of friction, and notable corrosion resistance attributable to the formation of Cr oxide (Cr
2O
3) film render it applicable for hard chrome plating (HCP) across diverse sectors, including aerospace, oil and gas, automotive, and papermaking industries [
4,
5,
6,
7,
8,
9].
Nevertheless, Cr exhibits a ductile-brittle transition temperature (DBTT) significantly above ambient temperature, coupled with limited plastic formability even at temperatures surpassing the DBTT threshold [
10,
11]. This limitation not only constrains their processability but also presents a notable impediment to their utilization in engineering applications. Consequently, the material has been precluded from widespread application in structural material and related domains. Additionally, using toxic and carcinogenic hexavalent Cr (Cr
6+) in fabricating Cr alloys and coatings results in significant environmental contamination [
7,
12]. Consequently, the production of Cr metal and Cr alloys utilizing current methodologies is subject to limitations.
Recently, powder bed fusion-laser beam for metals (PBF-LB/M) has garnered considerable attention as a manufacturing technique that surpasses existing methodologies. PBF-LB/M offers the advantage of fabricating intricate components in near-net shapes [
13,
14,
15,
16]. Furthermore, it enables the attainment of distinctive microstructures characterized by high cooling rates (10
5-10
7 K/s) and steep temperature gradients, facilitating control over crystallographic textures [
17,
18,
19,
20,
21]. Specifically, texture control, encompassing crystal orientation manipulation, emerges as a pivotal determinant influencing material property, alongside mechanical attributes including strength [
22,
23], ductility [
22,
23], Young’s modulus [
19,
24], and other functional characteristics such as corrosion resistance [
25], and high-temperature oxidation behavior [
26]. Consequently, the manipulation of crystallographic texture emerges as a pivotal factor directly influencing material properties, prompting an expansion of research endeavors focused on crystallographic texture control via PBF-LB/M. Nevertheless, there is a dearth of research addressing the mechanism underlying crystallographic texture development concerning the process parameters of PBF-LB/M in pure chromium.
Hence, this study explores the influence of scan speed on the crystallographic texture of pure Cr fabricated using PBF-LB/M. The investigation delves into the interrelation between crystallographic texture, energy density, microstructure, and defects. In essence, the study proposes avenues for enhancing the density, mitigating defects, and refining the crystallographic texture of pure Cr through PBF-LB/M.
2. Materials and Methods
Pure Cr powder (>99% purity) was supplied by JFE Material (Japan) in irregular shape as shown in
Figure 1(a), which makes it more challenging for produceability. The particle size distribution of each powder was assessed utilizing a Mastersizer 3000E instrument (Malvern Panalytical, UK). The volume weighted percentiles of the Cr powder were D
10 = 29.6 µm, D
50 = 45.0 µm, and D
90 = 67.5 µm (
Figure 1(b)). In this study, pure Cr specimens with dimensions measuring 5 mm (depth) × 5 mm (length) × 5 mm (height) were fabricated utilizing a PBF-LB/M machine (EOS M290, EOS, Germany) while preheat condition was set to 80°C. The manufacturing process adopted an XY-scan strategy, wherein the scanning direction was rotated 90° between successive layers, as shown in
Figure 1(c). The scan speed (
) was applied at 400, 600, 800, and 1000 mm/s. Consistent laser power (
) of 300 W, hatch space (
) of 0.08 mm, and layer thickness (
) of 0.02 mm were maintained across all conditions (
Table 1). The volumetric energy density (VED) for the fabrication conditions is defined by Equation (1).
The VED calculated using Equation (1) was 468.8 J/mm
3 for the V400, 312.5 J/mm
3 for the V600, 234.4 J/mm
3 for the V800, and 187.5 J/mm
3 for the V1000, respectively.
The relative densities of the specimens produced via PBF-LB/M were assessed by an optical microscope (OM; BX-60, Olympus, Japan). The relative density of each sample was measured using ImageJ software. Microstructural features and crystallographic textures were investigated utilizing a field-emission scanning electron microscope (FE-SEM; JIB-4610F, JEOL, Japan) equipped with an electron backscatter diffraction system (EBSD; NordlysMax3, Oxford Instruments, UK). The microhardness of the pure Cr specimens in their as-built state was assessed along the y-z plane employing a micro Vickers tester (HMV-G, Shimadzu, Japan) with a 4.903 N load applied for 20 seconds. The resultant average value was derived from 10 measurements.
3. Results
Figure 2 shows the OM images depicting the y-z plane of specimens V400, V600, V800, and V1000. The V1000 sample exhibited the lowest relative density at 89.5%. Conversely, for V800 and V600, where the scan speed was reduced, the VED increased, resulting in a rise in relative density to 92.4% and 94.9%, respectively. V400 demonstrated the highest relative density at 98.1%, representing the pinnacle of relative density achieved in pure Cr fabricated via PBF-LB/M, as previously reported [
26,
27]. Defects, such as considerable cracks and lack of fusion, were observed in samples of V1000. This observation suggests that the VED employed was inadequate, thus unable to form a stable melt pool, for fabricating pure Cr with its high melting point. Therefore, increasing VED, or else increasing scan speed, promoted densification by eliminating the lack of fusion defects owing to increased remelting between the subsequent layers. Moreover, implementing the lowest scan speed in V400 significantly suppressed cracks and lack of fusion defects while ensuring sufficient VED for uniform and sufficient melting. Furthermore, the reduction in cracking observed in V400 can be attributed to the decrease in high-angle grain boundaries (HAGB) owing to epitaxial growth, a topic to be elaborated upon in subsequent sections.
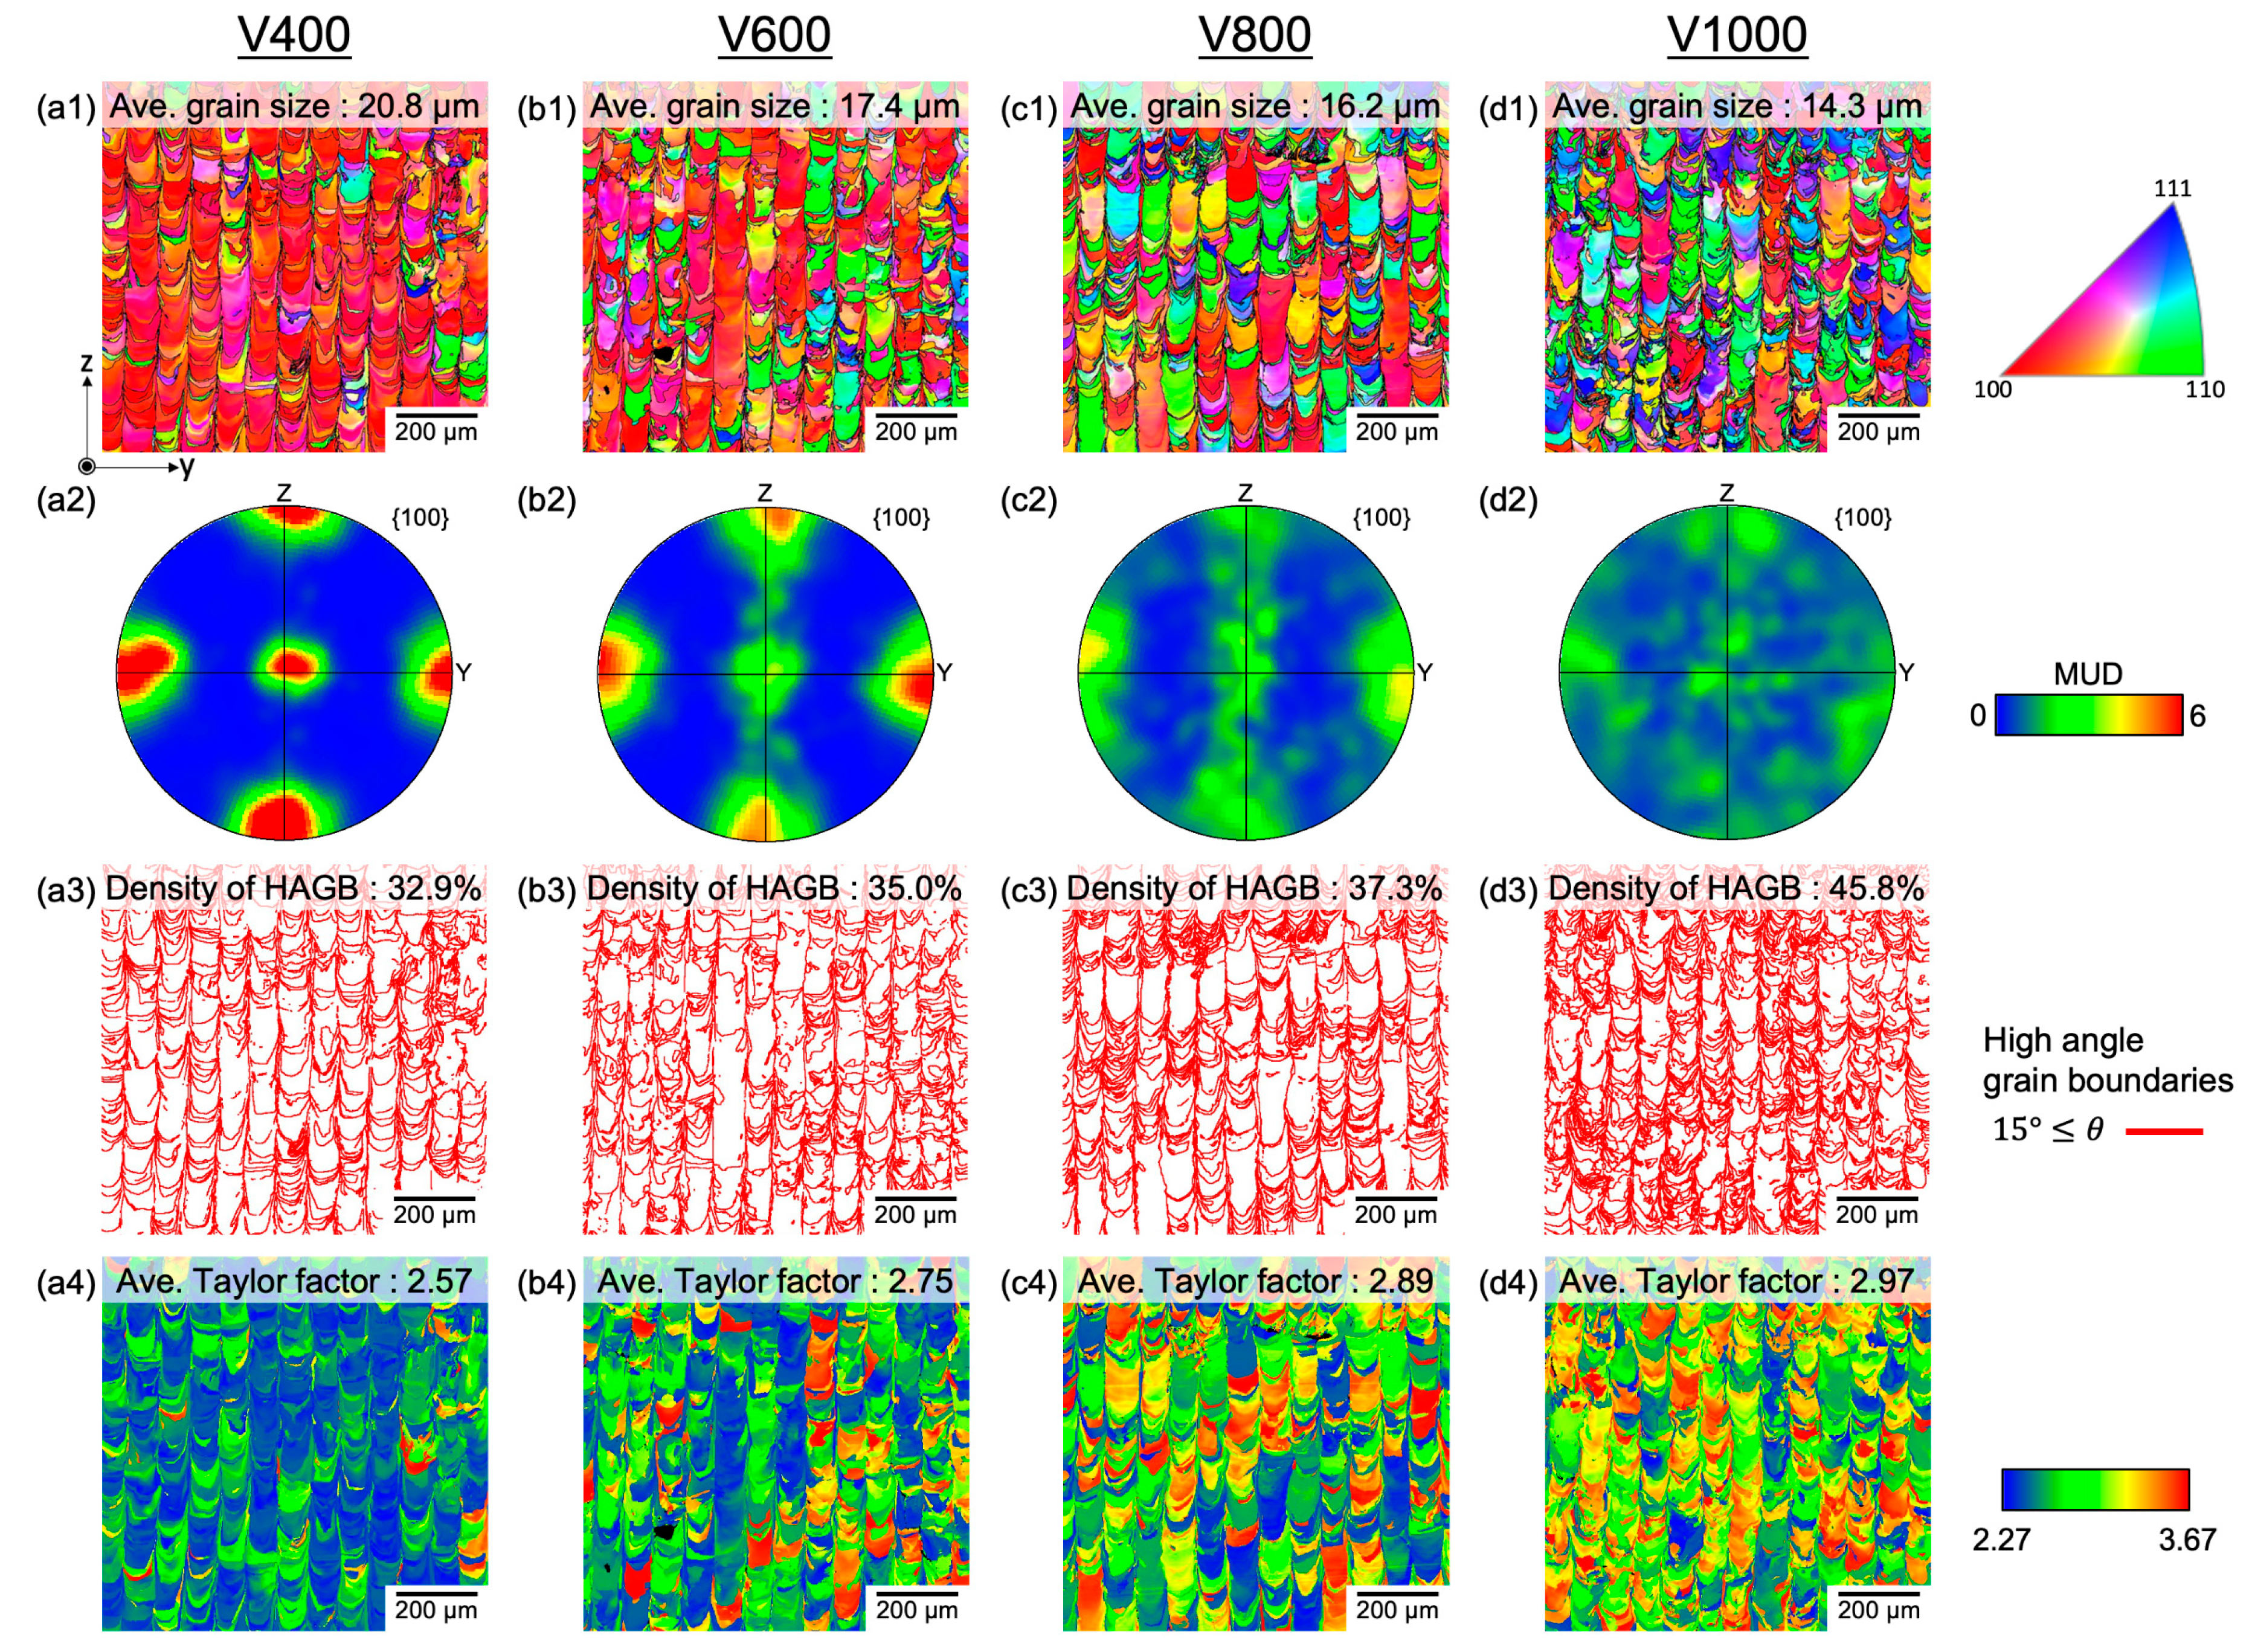
Figure 3 presents the EBSD results delineating the impact of scan speed on microstructure.
Figure 3 includes the Inverse Pole Figure (IPF) map along the z direction (
Figure 3(a1-d1)), and the corresponding {100} Pole Figure (
Figure 3(a2-d2)), HAGB map (
Figure 3(a3-d3)), and Taylor factor maps (
Figure 3(a4-d4)). Notably, the specimen subjected to V1000 exhibited the smallest average grain size and displayed a randomized crystallographic texture due to insufficient remelting and unstable melt pool formation. Conversely, with decreasing scan speed, there was an observed increase in average grain size accompanied by a strong crystallographic texture (
Figure 3(a1-d1),(a2-d2)). This phenomenon can be attributed to epitaxial growth across the melt pool, thus leading to less misorientation between neighboring grains. Accordingly, the density of HAGB which is susceptible to crack initiation and propagation also decreased, showing the lowest HAGB density in V400 (
Figure 3(a3-d3)). The Taylor factor depicted in
Figure 5(a4-c4) is a geometric indicator of the efficiency of crystallographic shear in accommodating macroscopic deformations [
28,
29]. As the Taylor factor of high-speed fabrications exhibited high value with the grains observing the high residual stress (red colored), it created potential crack initiation and propagation sites in the component. Remarkably, a decrease in scan speed (increase in VED) corresponded with a reduction in the Taylor factor, indicative of less remaining stress in the grains and enhanced capacity to accommodate deformation.
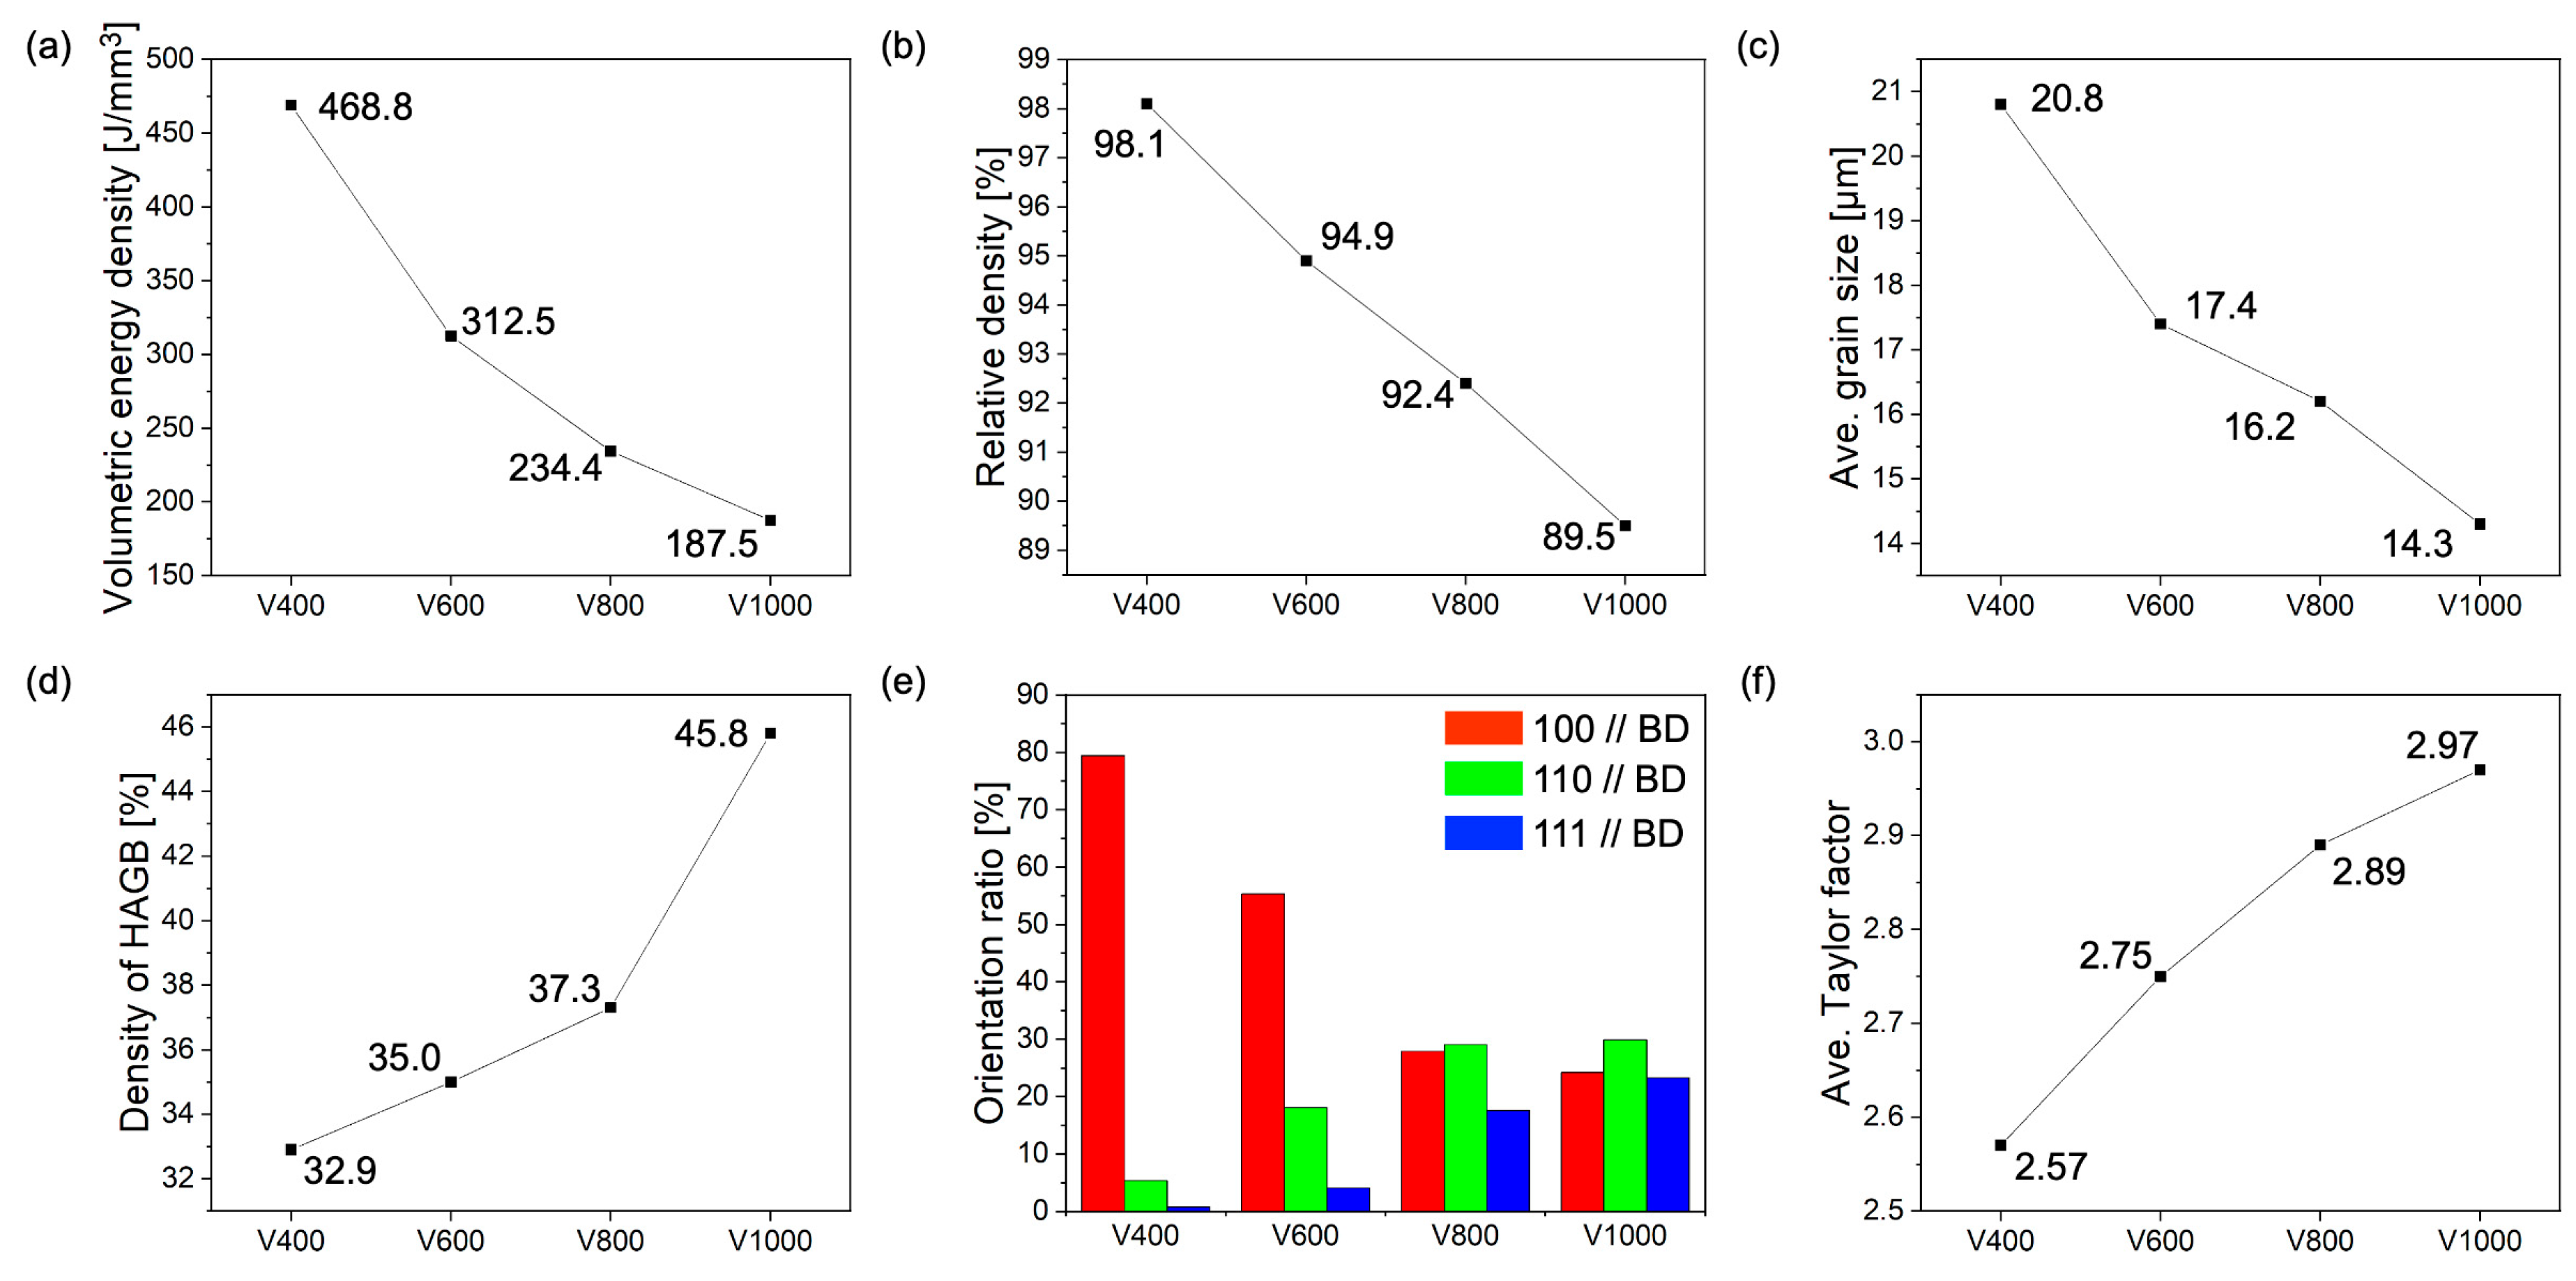
Figure 4 shows various parameters, including (a) VED, (b) relative density, and (c) average grain size obtained from EBSD analysis, as well as (d) density of HAGB, (e) orientation ratio, and (f) average Taylor factor, elucidating their correlations. Notably, VED exhibited an increase as scan speed decreased, resulting in reduced cracks and lack of fusion, leading to an augmentation in relative density. This increase in relative density can be attributed to the decrease in HAGB density, which serves as the primary cause of cracks in PBF-LB/M [
26,
30,
31], facilitated by the enlargement of average grain size. This phenomenon suggests the occurrence of epitaxial growth with escalating VED, as corroborated by the orientation ratio depicted in
Figure 4(e). Specifically, in the V1000 test specimen, the <100>, <110>, and <111> orientations were distributed in similar proportions, indicative of a random crystallographic texture. Conversely, in the V400 test specimen, a predominant orientation along the <100> orientation was observed, resulting in a reduction in HAGB density and, consequently, a decrease in cracks. Further elucidation of the detailed crystallographic texture formation mechanism is deferred to subsequent sections. The Taylor factor indicates grains' susceptibility to deformation during plastic deformation; a higher Taylor factor denotes increased resistance to plastic deformation [
32]. Remarkably, the V400 test specimen exhibited the lowest average Taylor factor, attributed to diminished initial plastic deformation owing to higher laser energy decreasing the residual stress. Thus, a reduction in scan speed, facilitating an increase in VED, thereby decreasing the stress while promoting epitaxial growth between the build layers, ultimately leading to a decrease in HAGB density, a reduction in cracks, and an increase in relative density.
Figure 4.
Plot of (a) volumetric energy density, (b) relative density, (c) average grain size, (d) density of HAGB, (e) orientation ratio and (f) average Taylor factor from V400, V600, V800, and V1000 samples.
Figure 4.
Plot of (a) volumetric energy density, (b) relative density, (c) average grain size, (d) density of HAGB, (e) orientation ratio and (f) average Taylor factor from V400, V600, V800, and V1000 samples.
4. Discussion
4.1. Texture Formation Mechanism
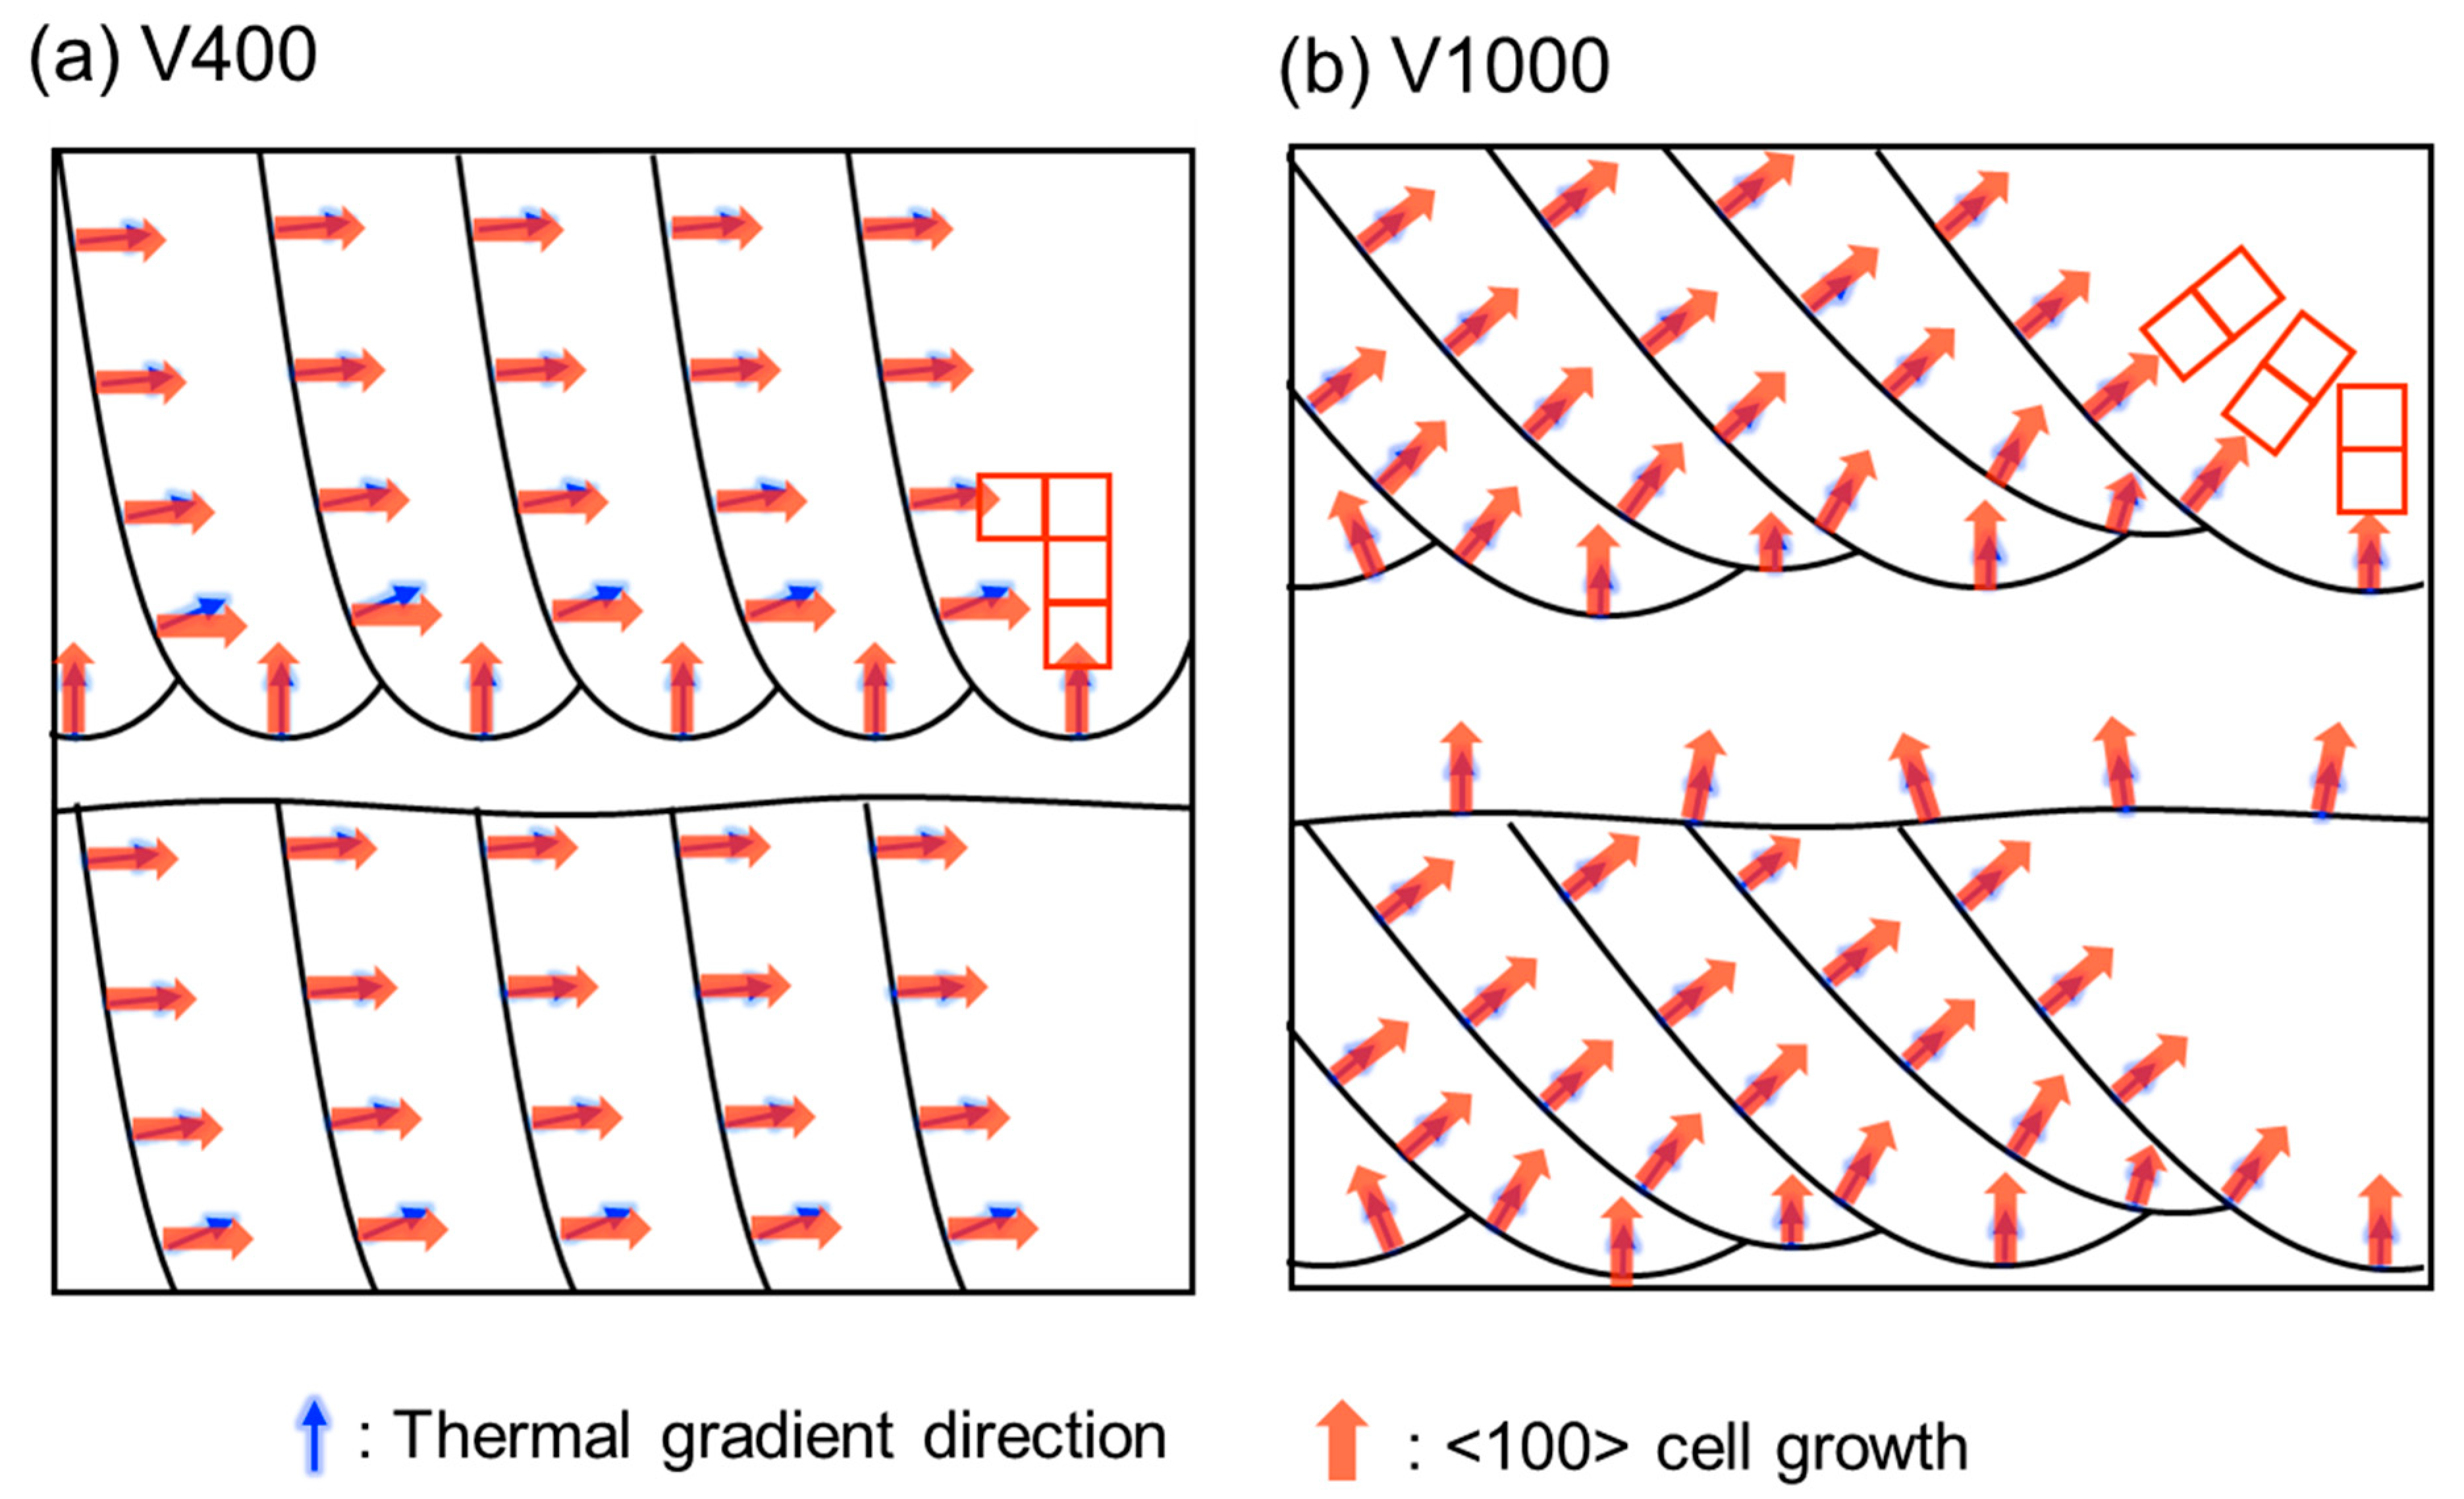
Figure 5 illustrates a schematic diagram of the melt pool shapes in the y-z plane elucidating the texture formation mechanism of pure chromium via PBF-LB/M corresponding to the difference in laser scan speed as well as VED. Depending on the scan speed, a transition from a random texture to a <100> cubic texture is observed for additively manufactured pure Cr. This phenomenon arises from the interplay between the melt pool shape and the direction of the thermal gradient (blue arrow). Specifically, the V1000 specimen, characterized by a rapid scan speed and low VED, was anticipated to form a wide, shallow, and unstable melt pool, therefore resulting in random texture formation. Although pure chromium in the BCC structure exhibits a preference for grain growth along the <100> direction being the less atomically dense lattice plane which requires less energy to grow [
33], oriented in alignment with the thermal gradient direction perpendicular to the melt pool [
34], under conditions of low VED, the growth into columnar grains becomes complicated due to the reduced thermal gradient with varied direction compared to high VED conditions [
17]. Furthermore, the application of the XY-scan strategy, involving a 90° rotation in scanning direction for the subsequent layer, leads to a mismatch in the grain growth direction between layers, precluding epitaxial growth across the melt pool and resulting in a random crystallographic texture (
Figure 3(d2) and
Figure 4(e)).
Conversely, in the case of the V400 specimen with a slower scan speed, a deep and stable melt pool is formed owing to increased VED. Additionally, the heightened VED results in an increased thermal gradient, facilitating growth into columnar grains. Along the center of the melt pool, the thermal gradient aligns with the z-axis direction (BD), encouraging grains oriented <100> to grow along this direction. Despite discrepancies between the thermal gradient direction and the <100> axis of the substrate caused by curvature along the side of the melt pool, growth in the <100> direction prevails, as it requires less energy than initiating new grain growth [
21,
35]. In subsequent layers where the scanning direction rotates by 90°, grains continue to grow in the <100> direction, enabling epitaxial growth across the melt pool and resulting in a <100> cubic texture (
Figure 3(a2) and
Figure 4(e)). Consequently, V400 exhibited bigger grain size, less HAGB, and more prone microstructure to crack initiation and propagation as well owing to reduced residual stress.
Figure 5.
Schematics of the mechanism for the texture evolution depending on scan speed.
Figure 5.
Schematics of the mechanism for the texture evolution depending on scan speed.
4.2. Hardness Response to Defects and Texture
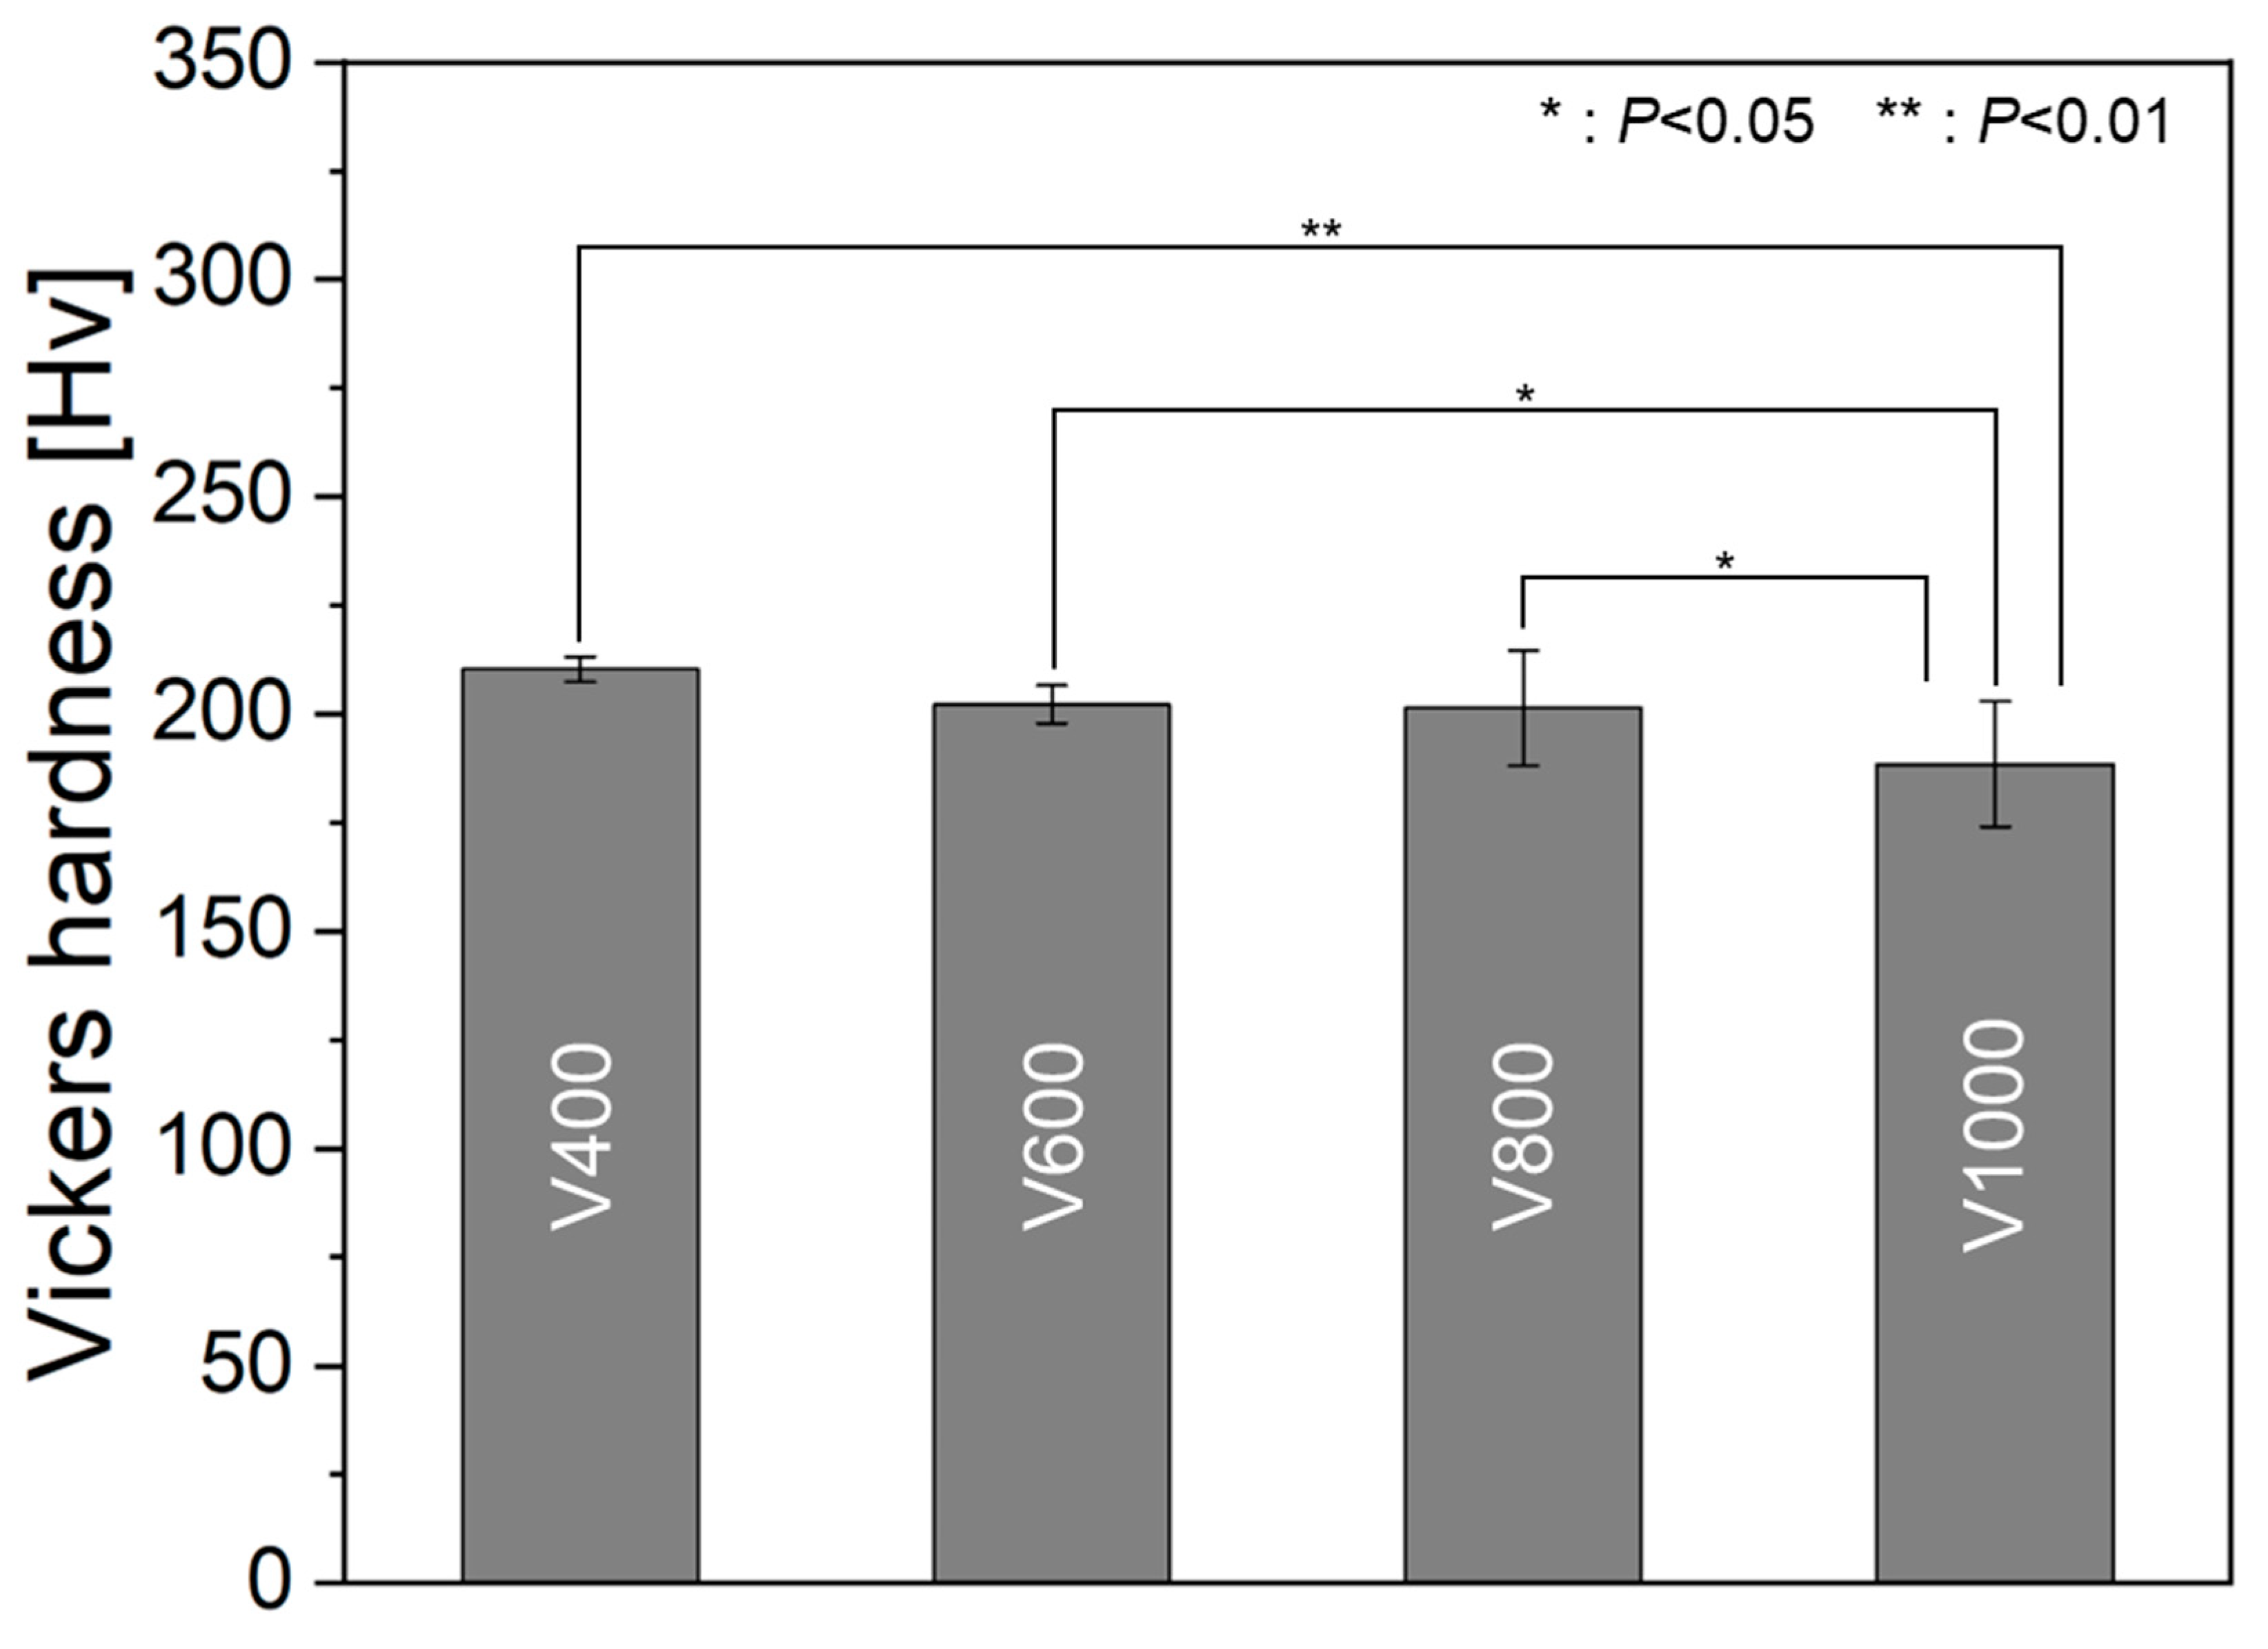
Figure 6 depicts the influence of scan speed on Vickers hardness. As scan speed decreased and energy density increased, hardness exhibited a corresponding increase, with the V400 test specimen demonstrating the highest hardness value and the slightest error bar (
Table 2). This observed trend aligns with the trend observed in relative density, thus indicating a decrease in defects [
36,
37,
38]. Notably, the V1000 specimen, characterized by the lowest relative density, exhibited the lowest hardness and displayed the most extensive error bar, attributable to limited reproducibility and the existence of excessive defects such as cracks and lack of fusion. Conventionally, smaller grain sizes, represented by high scan speed (V1000) in this study, correlate with higher strength and hardness, per the Hall-Petch Equation. However, contrary to this expectation, the V1000 sample, possessing the smallest grain size due to lack of epitaxial growth resulting random texture, exhibited the lowest hardness, suggesting a heightened susceptibility to defects. Conversely, a significant increase in hardness was noted in the V400 specimen, wherein a reduction in HAGB and reduced defects was achieved through epitaxial growth, underscoring the efficacy of crystallographic texture development, thus presenting promising results for the producibility and applicability of textured pure Cr by PBF-LB/M process.
5. Conclusions
This study investigated the influence of scan speed on the density and crystallographic texture of pure Cr produced via PBF-LB/M. In the V400 specimen, fabricated with slower scan speed and XY-scan strategy by PBF-LB/M, an enlargement in average grain size, and a reduction in the proportion of crack-prone HAGB were observed, attributed to the prominent <100> cubic texture and simultaneously reduced residual stress. Consequently, a heightened relative density was achieved. These findings underscore the potential of crystallographic texture control as a strategy to mitigate defects in metals and alloys with high DBTT, such as Cr. Moreover, achieving a higher relative density to satisfy commercial needs is imperative for industrial applications, necessitating further research in this domain.
Author Contributions
Conceptualization, Y.S.K., O.G., and T.N.; methodology, Y.S.K., and O.G.; validation, O.G., A.M., and T.N.; formal analysis, Y.S.K., and O.G.; investigation, Y.S.K. O.G., and A.M.; data curation, O.G., and A.M.; writing—original draft preparation, Y.S.K.; writing—review and editing, O.G. and T.N; visualization, Y.S.K. and O.G.; supervision, O.G. and T.N.; project administration, T.N.; funding acquisition; T.N. All authors have read and agreed to the published version of the manuscript.
Funding
Please add: This work was supported by a Grant-in-Aid for Scientific Research (JP23H00235) from the Japan Society for the Promotion of Science (JSPS) and CREST-Nanomechanics: Elucidation of macroscale mechanical properties based on understanding the nanoscale dynamics of innovative mechanical materials (Grant Number: JPMJCR2194) from the Japan Science and Technology Agency (JST).
Data Availability Statement
The data supporting the findings of this study are available from the corresponding author upon reasonable request.
Conflicts of Interest
The authors declare no conflict of interest.
References
- Klopp, W.D. Recent developments in chromium and chromium alloys. JOM 1969, 21, 23–32. [Google Scholar] [CrossRef]
- Medvedeva, N.; Gornostyrev, Y.N.; Freeman, A. Carbon stabilized A15 Cr3Re precipitates and ductility enhancement of Cr-based alloys. Acta Mater. 2002, 50, 2471–2476. [Google Scholar] [CrossRef]
- Gu, Y.; Ro, Y.; Harada, H. Tensile properties of chromium alloyed with silver. Metall. Mater. Trans. A 2004, 35, 3329–3331. [Google Scholar] [CrossRef]
- Tuominen, J.; Näkki, J.; Pajukoski, H.; Miettinen, J.; Peltola, T.; Vuoristo, P. Wear and corrosion resistant laser coatings for hydraulic piston rods. J. Laser Appl. 2015, 27. [Google Scholar] [CrossRef]
- Ding, X.-Z.; Zeng, X. Structural, mechanical and tribological properties of CrAlN coatings deposited by reactive unbalanced magnetron sputtering. Surf. Coat. Technol. 2005, 200, 1372–1376. [Google Scholar] [CrossRef]
- Lousa, A.; Romero, J.; Martınez, E.; Esteve, J.; Montala, F.; Carreras, L. Multilayered chromium/chromium nitride coatings for use in pressure die-casting. Surf. Coat. Technol. 2001, 146, 268–273. [Google Scholar] [CrossRef]
- Schopphoven, T.; Gasser, A.; Wissenbach, K.; Poprawe, R. Investigations on ultra-high-speed laser material deposition as alternative for hard chrome plating and thermal spraying. J. Laser Appl. 2016, 28. [Google Scholar] [CrossRef]
- Imaz, N.; Ostra, M.; Vidal, M.; Díez, J.; Sarret, M.; García-Lecina, E. Corrosion behaviour of chromium coatings obtained by direct and reverse pulse plating electrodeposition in NaCl aqueous solution. Corrosion Sci. 2014, 78, 251–259. [Google Scholar] [CrossRef]
- Martinuzzi, S.M.; Donati, L.; Giurlani, W.; Pizzetti, F.; Galvanetto, E.; Calisi, N.; Innocenti, M.; Caporali, S. A comparative research on corrosion behavior of electroplated and magnetron sputtered chromium coatings. Coatings 2022, 12, 257. [Google Scholar] [CrossRef]
- Harada, Y.; Ohmori, M. Ductile–brittle transition behavior of rolled chromium. J. Mater. Process. Technol. 2004, 153, 93–99. [Google Scholar] [CrossRef]
- Wadsack, R.; Pippan, R.; Schedler, B. The effect of pre-deformation on the ductility of chromium. J. Nucl. Mater. 2002, 307, 701–704. [Google Scholar] [CrossRef]
- Walawska, B.; Kowalski, Z. Environmental evaluation of the effects of using chromic waste in the production of chromium compounds. J. Clean Prod. 2001, 9, 219–226. [Google Scholar] [CrossRef]
- Plocher, J.; Panesar, A. Review on design and structural optimisation in additive manufacturing: Towards next-generation lightweight structures. Mater. Des. 2019, 183, 108164. [Google Scholar] [CrossRef]
- Wang, P.; Li, X.; Jiang, Y.; Nai, M.L.S.; Ding, J.; Wei, J. Electron beam melted heterogeneously porous microlattices for metallic bone applications: Design and investigations of boundary and edge effects. Addit. Manuf. 2020, 36, 101566. [Google Scholar] [CrossRef]
- Shirazi, S.F.S.; Gharehkhani, S.; Mehrali, M.; Yarmand, H.; Metselaar, H.S.C.; Kadri, N.A.; Osman, N.A.A. A review on powder-based additive manufacturing for tissue engineering: selective laser sintering and inkjet 3D printing. Sci. Technol. Adv. Mater. 2015, 16, 033502. [Google Scholar] [CrossRef] [PubMed]
- Bai, L.; Gong, C.; Chen, X.; Sun, Y.; Zhang, J.; Cai, L.; Zhu, S.; Xie, S.Q. Additive manufacturing of customized metallic orthopedic implants: Materials, structures, and surface modifications. Metals 2019, 9, 1004. [Google Scholar] [CrossRef]
- Gokcekaya, O.; Ishimoto, T.; Hibino, S.; Yasutomi, J.; Narushima, T.; Nakano, T. Unique crystallographic texture formation in Inconel 718 by laser powder bed fusion and its effect on mechanical anisotropy. Acta Mater. 2021, 212, 116876. [Google Scholar] [CrossRef]
- Ekubaru, Y.; Gokcekaya, O.; Ishimoto, T.; Sato, K.; Manabe, K.; Wang, P.; Nakano, T. Excellent strength–ductility balance of Sc-Zr-modified Al–Mg alloy by tuning bimodal microstructure via hatch spacing in laser powder bed fusion. Mater. Des. 2022, 221, 110976. [Google Scholar] [CrossRef]
- Gokcekaya, O.; Ishimoto, T.; Nishikawa, Y.; Kim, Y.S.; Matsugaki, A.; Ozasa, R.; Weinmann, M.; Schnitter, C.; Stenzel, M.; Kim, H.S. Novel single crystalline-like non-equiatomic TiZrHfNbTaMo bio-high entropy alloy (BioHEA) developed by laser powder bed fusion. Mater. Res. Lett. 2023, 11, 274–280. [Google Scholar] [CrossRef]
- Tsutsumi, Y.; Ishimoto, T.; Oishi, T.; Manaka, T.; Chen, P.; Ashida, M.; Doi, K.; Katayama, H.; Hanawa, T.; Nakano, T. Crystallographic texture-and grain boundary density-independent improvement of corrosion resistance in austenitic 316L stainless steel fabricated via laser powder bed fusion. Addit. Manuf. 2021, 45, 102066. [Google Scholar] [CrossRef]
- Ishimoto, T.; Hagihara, K.; Hisamoto, K.; Sun, S.-H.; Nakano, T. Crystallographic texture control of beta-type Ti–15Mo–5Zr–3Al alloy by selective laser melting for the development of novel implants with a biocompatible low Young's modulus. Scr. Mater. 2017, 132, 34–38. [Google Scholar] [CrossRef]
- Hagihara, K.; Nakano, T.; Maki, H.; Umakoshi, Y.; Niinomi, M. Isotropic plasticity of β-type Ti-29Nb-13Ta-4.6 Zr alloy single crystals for the development of single crystalline β-Ti implants. Sci Rep 2016, 6, 29779. [Google Scholar] [CrossRef] [PubMed]
- Hagihara, K.; Nakano, T.; Sasaki, K. Anomalous strengthening behavior of Co–Cr–Mo alloy single crystals for biomedical applications. Scr. Mater. 2016, 123, 149–153. [Google Scholar] [CrossRef]
- Lee, S.-H.; Todai, M.; Tane, M.; Hagihara, K.; Nakajima, H.; Nakano, T. Biocompatible low Young's modulus achieved by strong crystallographic elastic anisotropy in Ti–15Mo–5Zr–3Al alloy single crystal. J. Mech. Behav. Biomed. Mater. 2012, 14, 48–54. [Google Scholar] [CrossRef] [PubMed]
- Gerashi, E.; Alizadeh, R.; Langdon, T.G. Effect of crystallographic texture and twinning on the corrosion behavior of Mg alloys: A review. J. Magnes. Alloy. 2022, 10, 313–325. [Google Scholar] [CrossRef]
- Gokcekaya, O.; Hayashi, N.; Ishimoto, T.; Ueda, K.; Narushima, T.; Nakano, T. Crystallographic orientation control of pure chromium via laser powder bed fusion and improved high temperature oxidation resistance. Addit. Manuf. 2020, 36, 101624. [Google Scholar] [CrossRef]
- Gokcekaya, O.; Ishimoto, T.; Todo, T.; Suganuma, R.; Fukushima, R.; Narushima, T.; Nakano, T. Effect of scan length on densification and crystallographic texture formation of pure chromium fabricated by laser powder bed fusion. Crystals 2020, 11, 9. [Google Scholar] [CrossRef]
- Tomé, C.N.; Lebensohn, R.A. Material Modeling With the Viscoplastic Self-Consis-tent (VPSC) Approach. 2021. [CrossRef]
- Keshavarzkermani, A.; Esmaeilizadeh, R.; Ali, U.; Enrique, P.D.; Mahmoodkhani, Y.; Zhou, N.Y.; Bonakdar, A.; Toyserkani, E. Controlling mechanical properties of additively manufactured hastelloy X by altering solidification pattern during laser powder-bed fusion. Mater. Sci. Eng. A 2019, 762, 138081. [Google Scholar] [CrossRef]
- Wang, D.; Wang, Z.; Li, K.; Ma, J.; Liu, W.; Shen, Z. Cracking in laser additively manufactured W: Initiation mechanism and a suppression approach by alloying. Mater. Des. 2019, 162, 384–393. [Google Scholar] [CrossRef]
- Gokcekaya, O.; Ishimoto, T.; Todo, T.; Wang, P.; Nakano, T. Influence of powder characteristics on densification via crystallographic texture formation: Pure tungsten prepared by laser powder bed fusion. Addit. Manuf. Lett. 2021, 1, 100016. [Google Scholar] [CrossRef]
- Liu, S.; Li, H.; Qin, C.; Zong, R.; Fang, X. The effect of energy density on texture and mechanical anisotropy in selective laser melted Inconel 718. Mater. Des. 2020, 191, 108642. [Google Scholar] [CrossRef]
- Glicksman, M.E. Principles of solidification: an introduction to modern casting and crystal growth concepts; Springer: New York, NY, 2010. [Google Scholar] [CrossRef]
- de Formanoir, C.; Michotte, S.; Rigo, O.; Germain, L.; Godet, S. Electron beam melted Ti–6Al–4V: Microstructure, texture and mechanical behavior of the as-built and heat-treated material. Mater. Sci. Eng. A 2016, 652, 105–119. [Google Scholar] [CrossRef]
- Sun, S.-H.; Hagihara, K.; Nakano, T. Effect of scanning strategy on texture formation in Ni-25 at.% Mo alloys fabricated by selective laser melting. Mater. Des. 2018, 140, 307–316. [Google Scholar] [CrossRef]
- Liu, K.; Gu, D.; Guo, M.; Sun, J. Effects of processing parameters on densification behavior, microstructure evolution and mechanical properties of W–Ti alloy fabricated by laser powder bed fusion. Mater. Sci. Eng. A 2022, 829, 142177. [Google Scholar] [CrossRef]
- Cepeda-Jiménez, C.; Potenza, F.; Magalini, E.; Luchin, V.; Molinari, A.; Pérez-Prado, M. Effect of energy density on the microstructure and texture evolution of Ti-6Al-4V manufactured by laser powder bed fusion. Mater. Charact. 2020, 163, 110238. [Google Scholar] [CrossRef]
- Xue, G.; Ke, L.; Liao, H.; Chen, C.; Zhu, H. Effect of SiC particle size on densification behavior and mechanical properties of SiCp/AlSi10Mg composites fabricated by laser powder bed fusion. J. Alloy. Compd. 2020, 845, 156260. [Google Scholar] [CrossRef]
|
Disclaimer/Publisher’s Note: The statements, opinions and data contained in all publications are solely those of the individual author(s) and contributor(s) and not of MDPI and/or the editor(s). MDPI and/or the editor(s) disclaim responsibility for any injury to people or property resulting from any ideas, methods, instructions or products referred to in the content. |
© 2024 by the authors. Licensee MDPI, Basel, Switzerland. This article is an open access article distributed under the terms and conditions of the Creative Commons Attribution (CC BY) license (http://creativecommons.org/licenses/by/4.0/).


