1. Introduction
Gastrointestinal tract cancer remains a formidable global health challenge, impacting an estimated 5 million individuals in 2019 [
7], as reported by the World Health Organization. Among the array of treatment options, radiation therapy emerges as a pivotal intervention, accessible to approximately half of diagnosed patients. Traditional radiation therapy, spanning 1-6 weeks of daily sessions [
34], demands precision in delivering high radiation doses to tumors while sparing adjacent healthy tissues, particularly the stomach and intestines. Recent technological advancements, such as integrated magnetic resonance imaging and linear accelerator systems (MR-Linacs), present an opportunity to enhance the precision of radiation therapy by allowing daily visualization of tumor and organ positions. Despite these advancements, the manual segmentation of stomach and intestines in MR images remains a time-consuming hurdle, prompting the exploration of deep learning solutions to automate this process and streamline radiation therapy.
This research initiative, generously supported by the UW-Madison Carbone Cancer Center, pioneers developing a deep-learning model utilizing a dataset of anonymized MRIs from cancer patients. The primary objective is to create a model capable of automating the segmentation of the stomach and intestines in MRI scans, ultimately revolutionizing cancer treatment by significantly reducing session times and enhancing overall care quality [
35].
In recent years, deep learning has proven transformative in various domains, particularly in computer vision. The success of convolutional neural networks (CNNs) in extracting intricate features from images has led to unprecedented accuracy in tasks like object recognition and image segmentation. This paradigm shift has impacted diverse applications, including medical image analysis [36]. This paper focuses on applying deep learning to medical image analysis for stomach and tract segmentation, exploring the methodology, model architectures, dataset introduction, data analysis, preprocessing, loss function choice, and evaluation metrics. The paper introduces the ResECA-U-Net model and evaluates its effectiveness through experimental results. Furthermore, it addresses the computational challenges inherent in traditional U-Net architectures, designed to balance computing power with accurate image segmentation. The research aims to analyze the ResECA-U-Net model’s effectiveness for GI tract image segmentation, comparing its performance against various U-Net models.
As collateral damage to healthy cells remains a concern in radiation therapy, introducing Artificial Intelligence techniques, such as convolutional neural networks, has shown promise in auto-segmentation for various cancer types. However, segmenting gastrointestinal (GI) tract organs poses unique challenges due to the surrounding soft tissues and the dynamic nature of organ positions [37].
With the increasing prevalence of GI-related illnesses, the demand for reliable and automated segmentation methods has grown exponentially. This research contributes to the field by proposing advanced computational techniques that accurately and efficiently delineate GI organ boundaries. Deep learning, specifically the ResECA-U-Net model, is presented as a solution to automate the segmentation of healthy organs, offering potential improvements in treatment efficiency and patient outcomes [38]. The study involves experimenting with different pre-trained models to gain insights into feature extraction and segmentation performance, guiding future advancements in the field.
Our research work has contributed to the following:
We employed the U-Net model as the backbone for our performance analysis, incorporating various transfer learning models for comparison. The top five transfer learning models we explored are ResECA-U-Net, ResNet34, Efficient-NetB0, EfficientNetB1, and EfficientNetB2—all exhibiting commendable performance and leveraging the ECA-Net architecture.
Our research introduced a U-Net model in computer vision, specifically designed to enhance local features for segmentation tasks. The ResECA-U-Net model proposed in this work was applied to the UW-Madison GI tract image segmentation dataset.
To evaluate the performance of the models, we employed metrics such as dice coefficient, Intersection over Union (IoU), and model loss. These metrics offered a comprehensive assessment of the proposed models’ effectiveness in image segmentation.
2. Related Work
Alina Chou and colleagues [
6] presented their approaches to the Kaggle UW-Madison GI Tract Image Segmentation challenge to improve cancer treatment planning for radiation oncology. The difficulty was in accurately segmenting the stomach and intestines in MRI images such that strong radiation doses could be delivered to malignancies while sparing vital organs. For organ segmentation, the scientists used U-Net and Mask R-CNN techniques. Their top U-Net and Mask R-CNN models on the validation set had a Dice score of 0.51 and 0.73, respectively. This is not encouraging for the advancement of medicine. The reported Dice scores of 0.51 and 0.73 indicate potential improvement in attaining precise organ segmentation, highlighting the need for more developments in the area. In a groundbreaking study by Bryan Chia et al. [
8], significant advancements were made in semantic segmentation for medical imaging. Their research focused on improving the U-Net architecture by implementing two baseline methods and exploring multi-task learning approaches. They found that contrastive learning proved especially beneficial when the test distribution differed greatly from the training distribution, particularly when encountering new patients. Additionally, integrating Feature-wise Linear Modulation (FiLM) into the U-Net model enhanced performance, especially when there was a slight overlap between the training and test distributions involving future scans of previously trained patients. These findings highlight the potential for more accurate and robust medical image segmentation techniques. To evaluate the performance of these approaches, the researchers employed validation and tested Dice coefficient results. The Small U-Net (FiLM) model achieved promising results, with a validation Dice coefficient of 0.8345 for overall segmentation, 0.7985 for large bowel segmentation, 0.8114 for small bowel segmentation, and 0.8941 for stomach segmentation. Further evaluations were conducted on the test set, and the impact of auxiliary tasks was also explored, highlighting the potential of these methods to improve semantic segmentation performance in medical imaging. In his 2022 study, Manhar Sharma [
7] proposed a novel approach to automate the segmentation process for GI Tract scans in radiation treatment. They aimed to outline the stomach and intestines accurately using deep learning techniques. By comparing various encoder architectures, they found that EfficientNet encoders outperformed others, achieving high levels of accuracy. The models were trained for 80 epochs with minimal data augmentation. The (BCE + Tversky) Loss function was identified as the optimal choice for the task. Evaluation of different encoders revealed that Efficientnet-B3 achieved an IoU Loss of 84.9%, a BCE + Tversky Loss of 85.3%, 84, and an IoU + Tversky Loss of 84.8%. Other encoders, including Efficientnet-B1, Resnet34, Resnet50, Mobilenet V2, and VGG16, did not yield good results. By considering these results, we can achieve better results from our model. In medical advancements, a groundbreaking study emerged in 2020 when Mehshan Ahmed Khan and his esteemed colleagues [
9] introduced a pioneering deep learning-based methodology. Their proposed approach employed a modified mask RCNN for ulcer segmentation and fine-tuned the ResNet101 pre-trained CNN model for feature extraction. The acquired features underwent optimization using grasshopper optimization techniques, and a multi-class SVM with a cubic kernel function was utilized for the final disease classification. The results showcased exceptional performance in ulcer segmentation and disease classification through extensive experiments, surpassing existing methods with an MOC of 0.8807, an average precision of 1.0, and a classification accuracy of 99.13%. This method holds significant promise in advancing the diagnosis of gastrointestinal diseases using wireless capsule endoscopy. The stomach, small bowel, and large bowel organs are divided in this study using the ResNet34-U-Net (RU-Net) model [
10]. The validation set of the UW-Madison GI Tract Image Segmentation dataset yielded the best dice score for our model of 0.9049. Various methods, including Mask R-CNN, LeViT128-U-Net, and LeViT384-U-Net++, are also compared to the model in this study. Shuai Wang and colleagues [
11] have made significant advancements in accurately segmenting lesions in endoscopy images for automated GI Tract disease diagnosis. They identified the limitations of previous methods that relied on hand-crafted features and treated feature definition and segmentation as separate tasks, which often led to sub-optimal performance due to heterogeneity. In response, they proposed the multi-scale context-guided deep network (MCNet) as a groundbreaking solution. MCNet introduces the novel capability of capturing global and local contexts during model training. By incorporating a global subnetwork for high-level semantic context extraction and two cascaded local subnetworks for multi-scale appearance and semantic information, MCNet demonstrated remarkable performance in experimental evaluations conducted on a data set of 1,310 endoscopy images. Notably, it outperformed state-of-the-art techniques for automated lesion segmentation in GI Tract endoscopic pictures with mean intersection over union (mIoU) scores of 74% and 85% for aberrant and polyp segmentation, respectively. In 2023, a research team [
12] led by Neha Sharma introduced a U-Net model specifically tailored to segment GI tract organs, such as the small bowel, large intestine, and stomach. The concept was designed to help radiation doctors treat cancer more precisely and effectively. The U-Net topology effectively recovered local features from small pictures using six transfer learning models, including Inception V3, ResNet50, VGG19, DenseNet121, InceptionResNetV2, and EfficientNet B0. Model loss, dice coefficient, and IoU metrics were used to assess the proposed model’s performance compared to previous transfer learning models. Notable results for these metrics were 0.122 for model loss, 0.8854 for the dice coefficient, and 0.8819 for the IoU. Although the suggested U-Net model for GI tract organ segmentation seems promising, the study is short on information on the technique, dataset, and comparison with other strategies. The provided performance figures also lack context and do not give a complete picture of how well the model performs in actual-world situations.
3. Methodology
The fundamental model structure for this investigation is the U-Net architecture put forth by Ronneberger et al. in 2015 [
14]. The encoder-decoder design is utilized by the U-Net network. During the encoding stage, the input image is subjected to successive convolutions and downsampling, producing a smaller-scale feature map with high-dimensional semantic feature information. In the decoding stage, the network performs convolution and up-sampling operations to return the feature map to its original size, finally producing the segmentation results for the image. The concat layer, which combines context information, links the feature maps from the encoding and decoding phases in the network’s center region. The final prediction results are produced through feature fusion and continual upsampling. In this study, a residual network, called ResNet architecture, is the U-Net network down-sampling component. We additionally include Efficient Channel Attention modules in the intermediate connection layer. An improved network model called ResECA-U-Net is the consequence of this change.
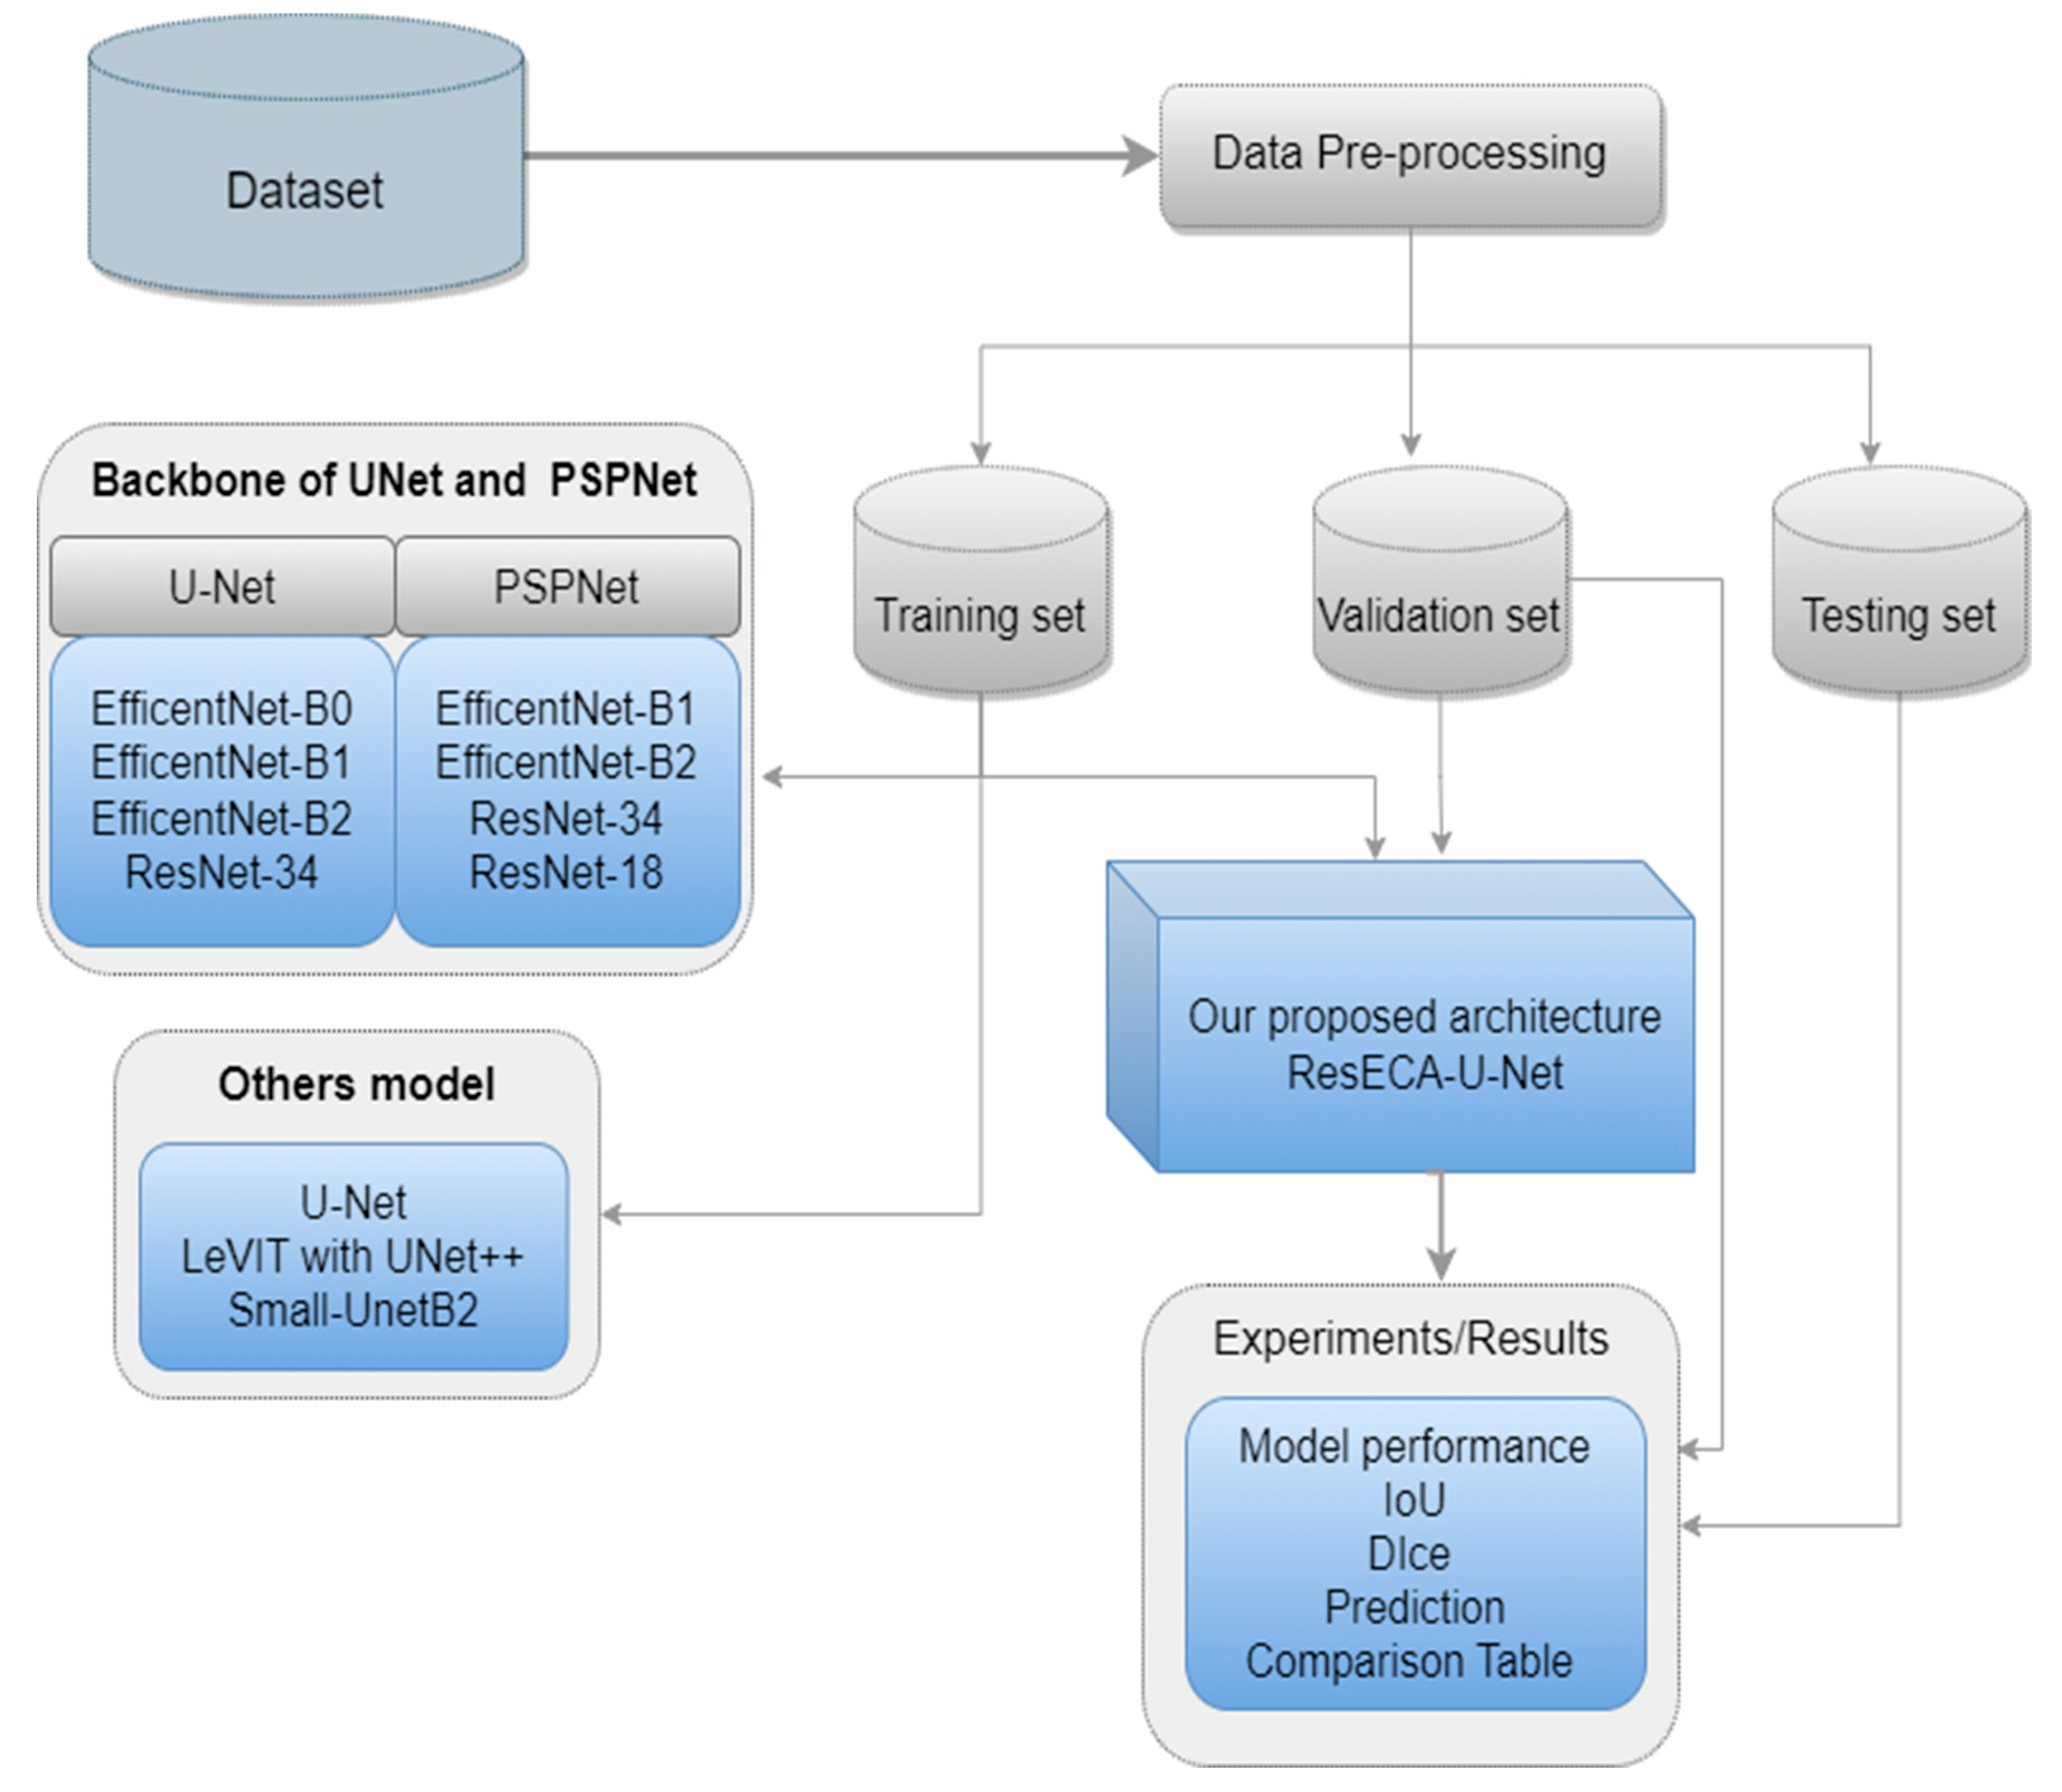
Figure 1 shows the phases that comprise our approach for segmenting images of the gastrointestinal (GI) tract in sequential order. The figure highlights the methodical methodology used for precise and effective medical image analysis by outlining essential steps such as pre-processing, feature extraction, segmentation, and post-processing.
3.1. Data Set
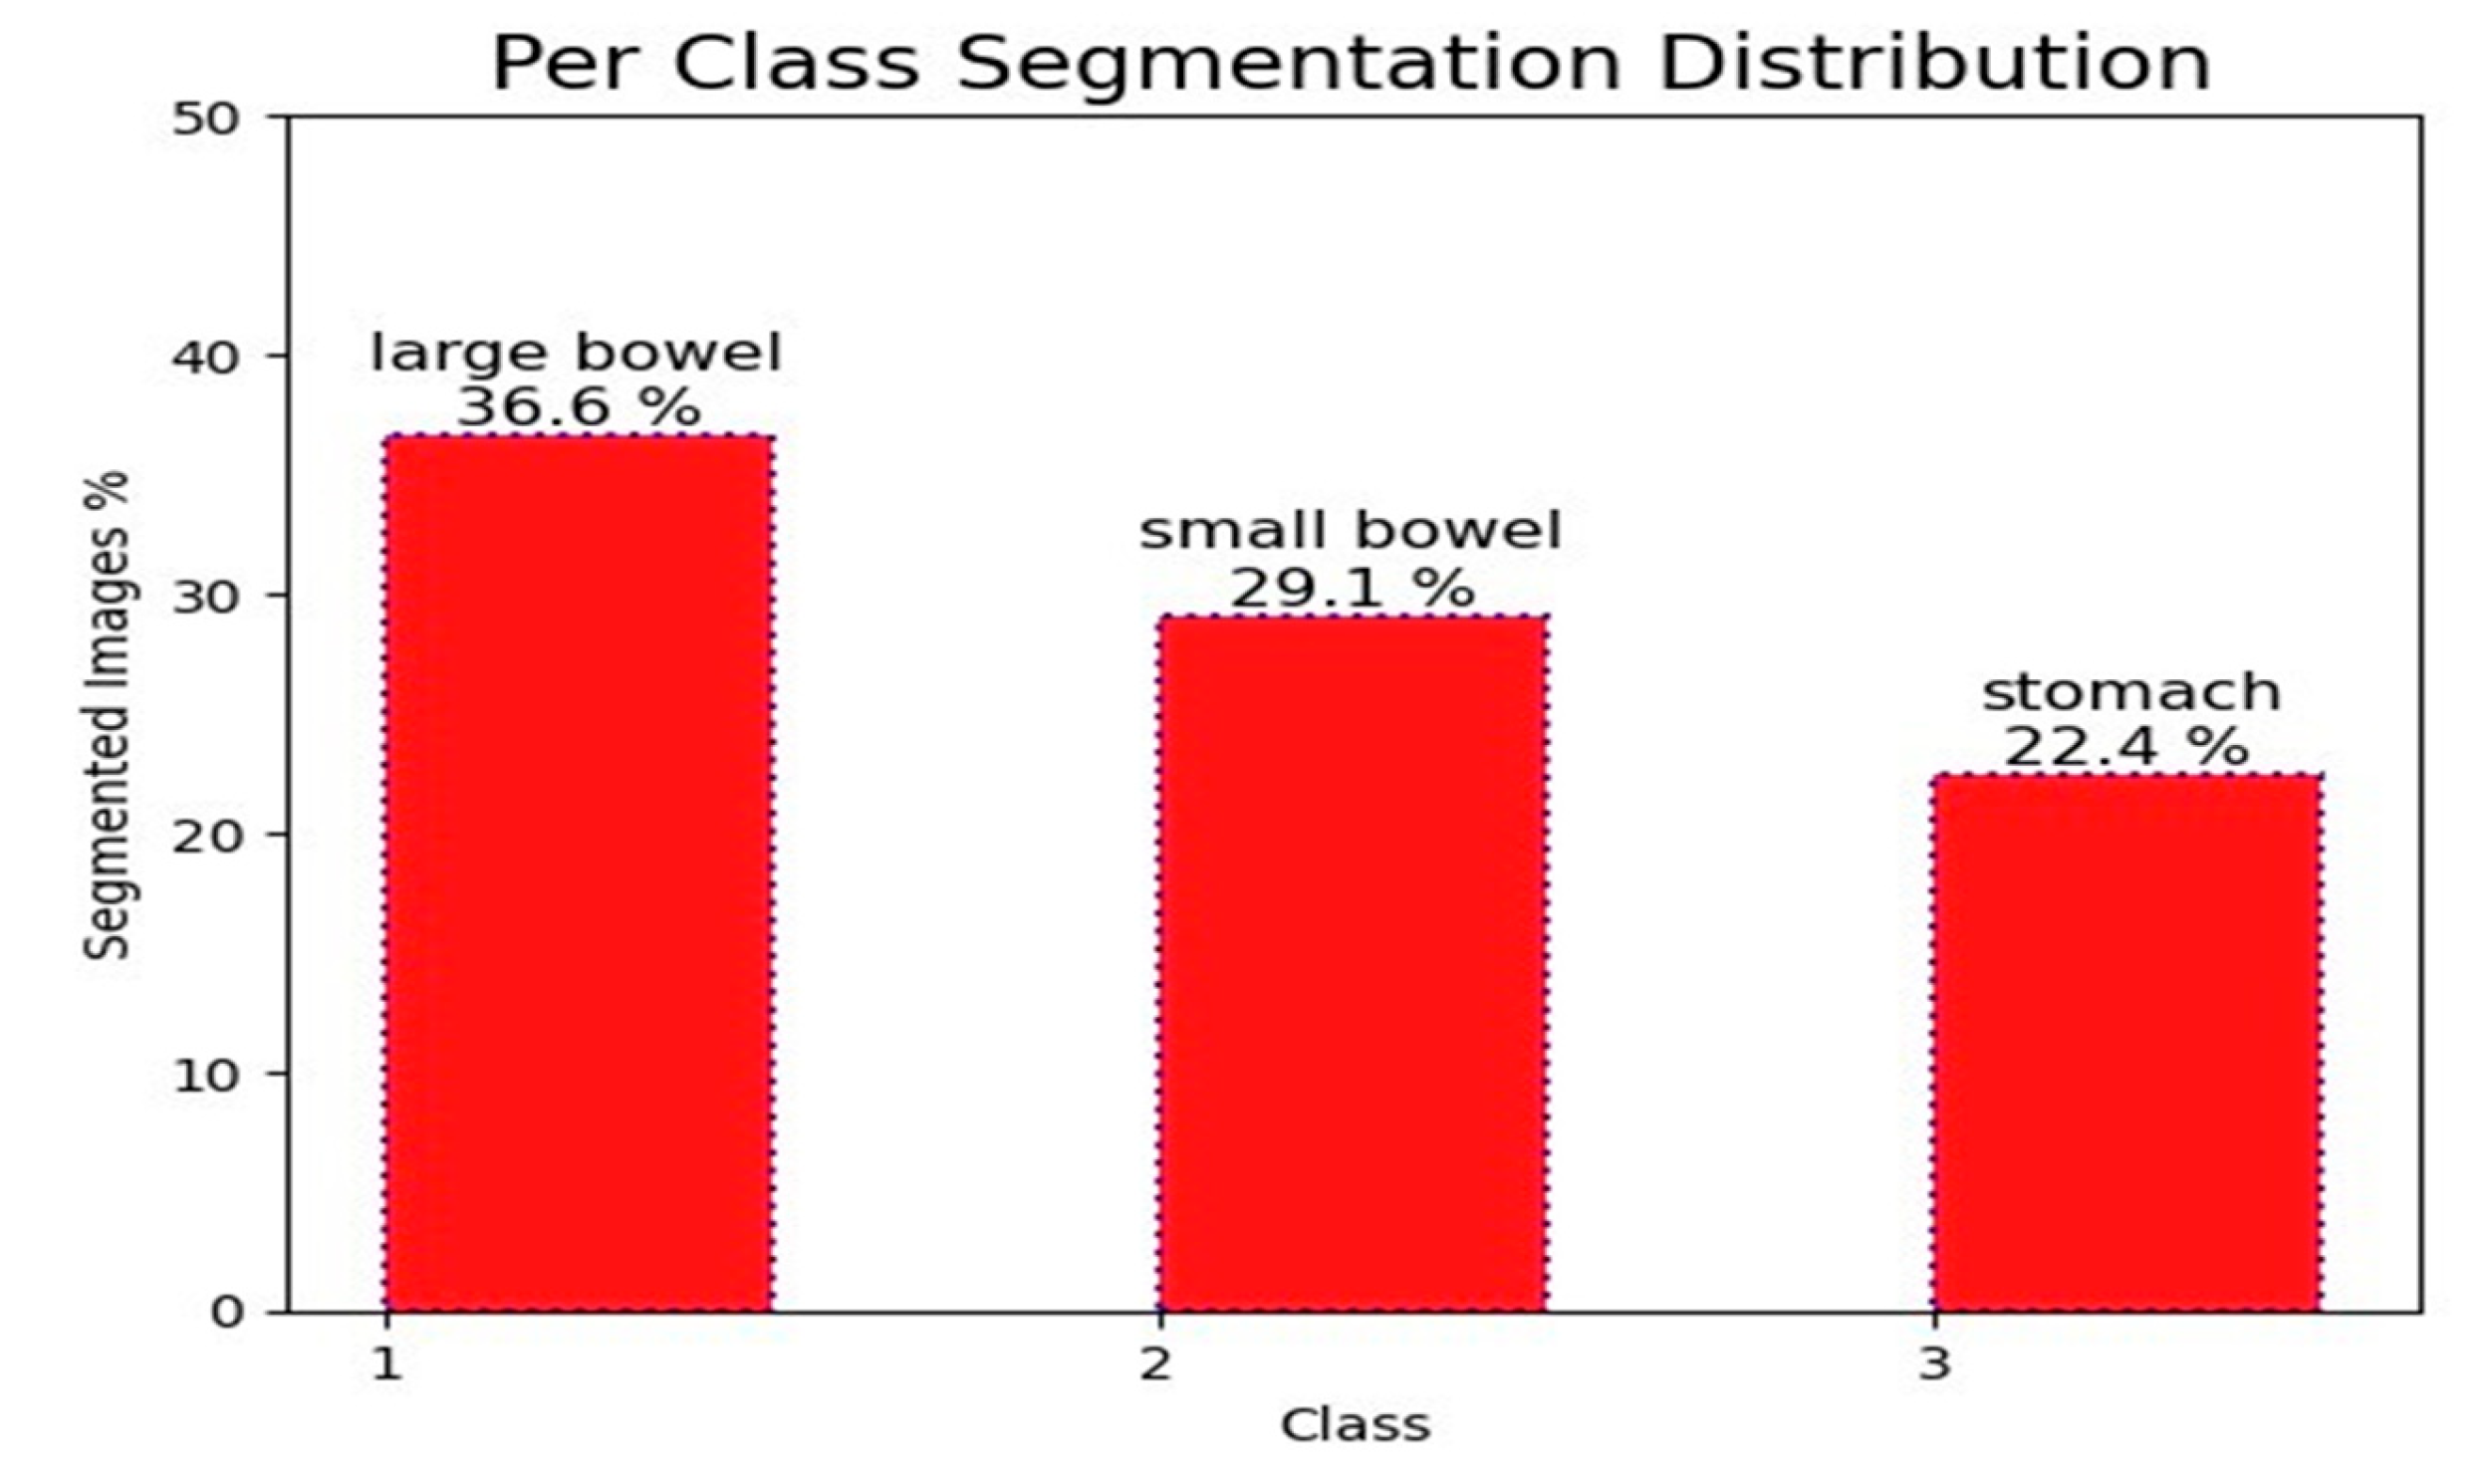
We used a large dataset with 115,488 cases for our research. Each segment in the dataset had three distinct annotations for the stomach, small bowel, and large colon. There were a total of 38,496 segments in the dataset. Nevertheless, only 21,906 segments contained annotations for these organs. The large intestine received 36.6% of the annotated segments, followed by the small intestine with 29.1% and the stomach with 22.4%.
Figure 2 depicts these segments graphically, while the background is completely labeled. The remaining sections show the abdominal regions where the specified organs are not visible. With variable 224x224 pixel dimensions, each segment in the dataset was a different size. Two sets, dubbed training and testing, were created from the data set. Data was split into three sets: training, validation, and testing, with training making up 80%, validation 10%, and testing 10% of the total. Twenty percent of the data from the training set was also set aside for validation.
3.2. 1D Array
In this study, we preprocess the data set by utilizing the relay encode and relay decode functions to encode and decode binary image masks. These functions enable us to compress the masks into strings and convert them into numeric arrays. We employ the encode and decode functions, which require binary numpy arrays with 1 representing the object mask and 0 representing the background. To encode the array, we flatten it into a 1D array, add 0 at the beginning and end, identify the start and end indices of consecutive values, and compute the length of each run. The encoded image is then returned as a string of space-separated integers [
13]. On the other hand, the decode function splits the input string into two numpy arrays [
13], subtracts one from each start index, computes the end indices, initializes a numpy array of zeros with the original image’s shape, and reshapes the 1D array back into the original image shape. These preprocessing steps ensure our dataset is prepared for image segmentation tasks with TensorFlow.
3.3. 2D Array
In this study, we present a custom implementation of a data generator for image segmentation tasks using TensorFlow. Our proposed approach is based on inheriting from the base class tf.keras.utils.The sequence is used for implementing data generators in TensorFlow. The constructor of our data generator takes a data frame containing information about the images and masks, the batch size to determine the number of samples in each batch and the mode of the generator, specifying whether it is for training or validation. Our data generator utilizes the get-item method to load images and masks for each batch. This method loads grayscale images using the tf.keras.preprocessing.image.load img function and resize them using the tf.image.resize function. We normalize the pixel values by dividing them by 255. In the case of the generator mode being trained, the method also loads the corresponding mask for each image and resizes it using tf.image.resize. Using the decode function, we convert the mask from the run-length encoding format to a 2D array. Our data generator returns a tuple containing a batch of images and masks if the mode is trained. Otherwise, it only returns a batch of images. We determine the number of batches in the generator using the len method. We implement it with the floor division operator to ensure all samples are included, even if the batch size does not divide them evenly.
3.4. Data Visualization
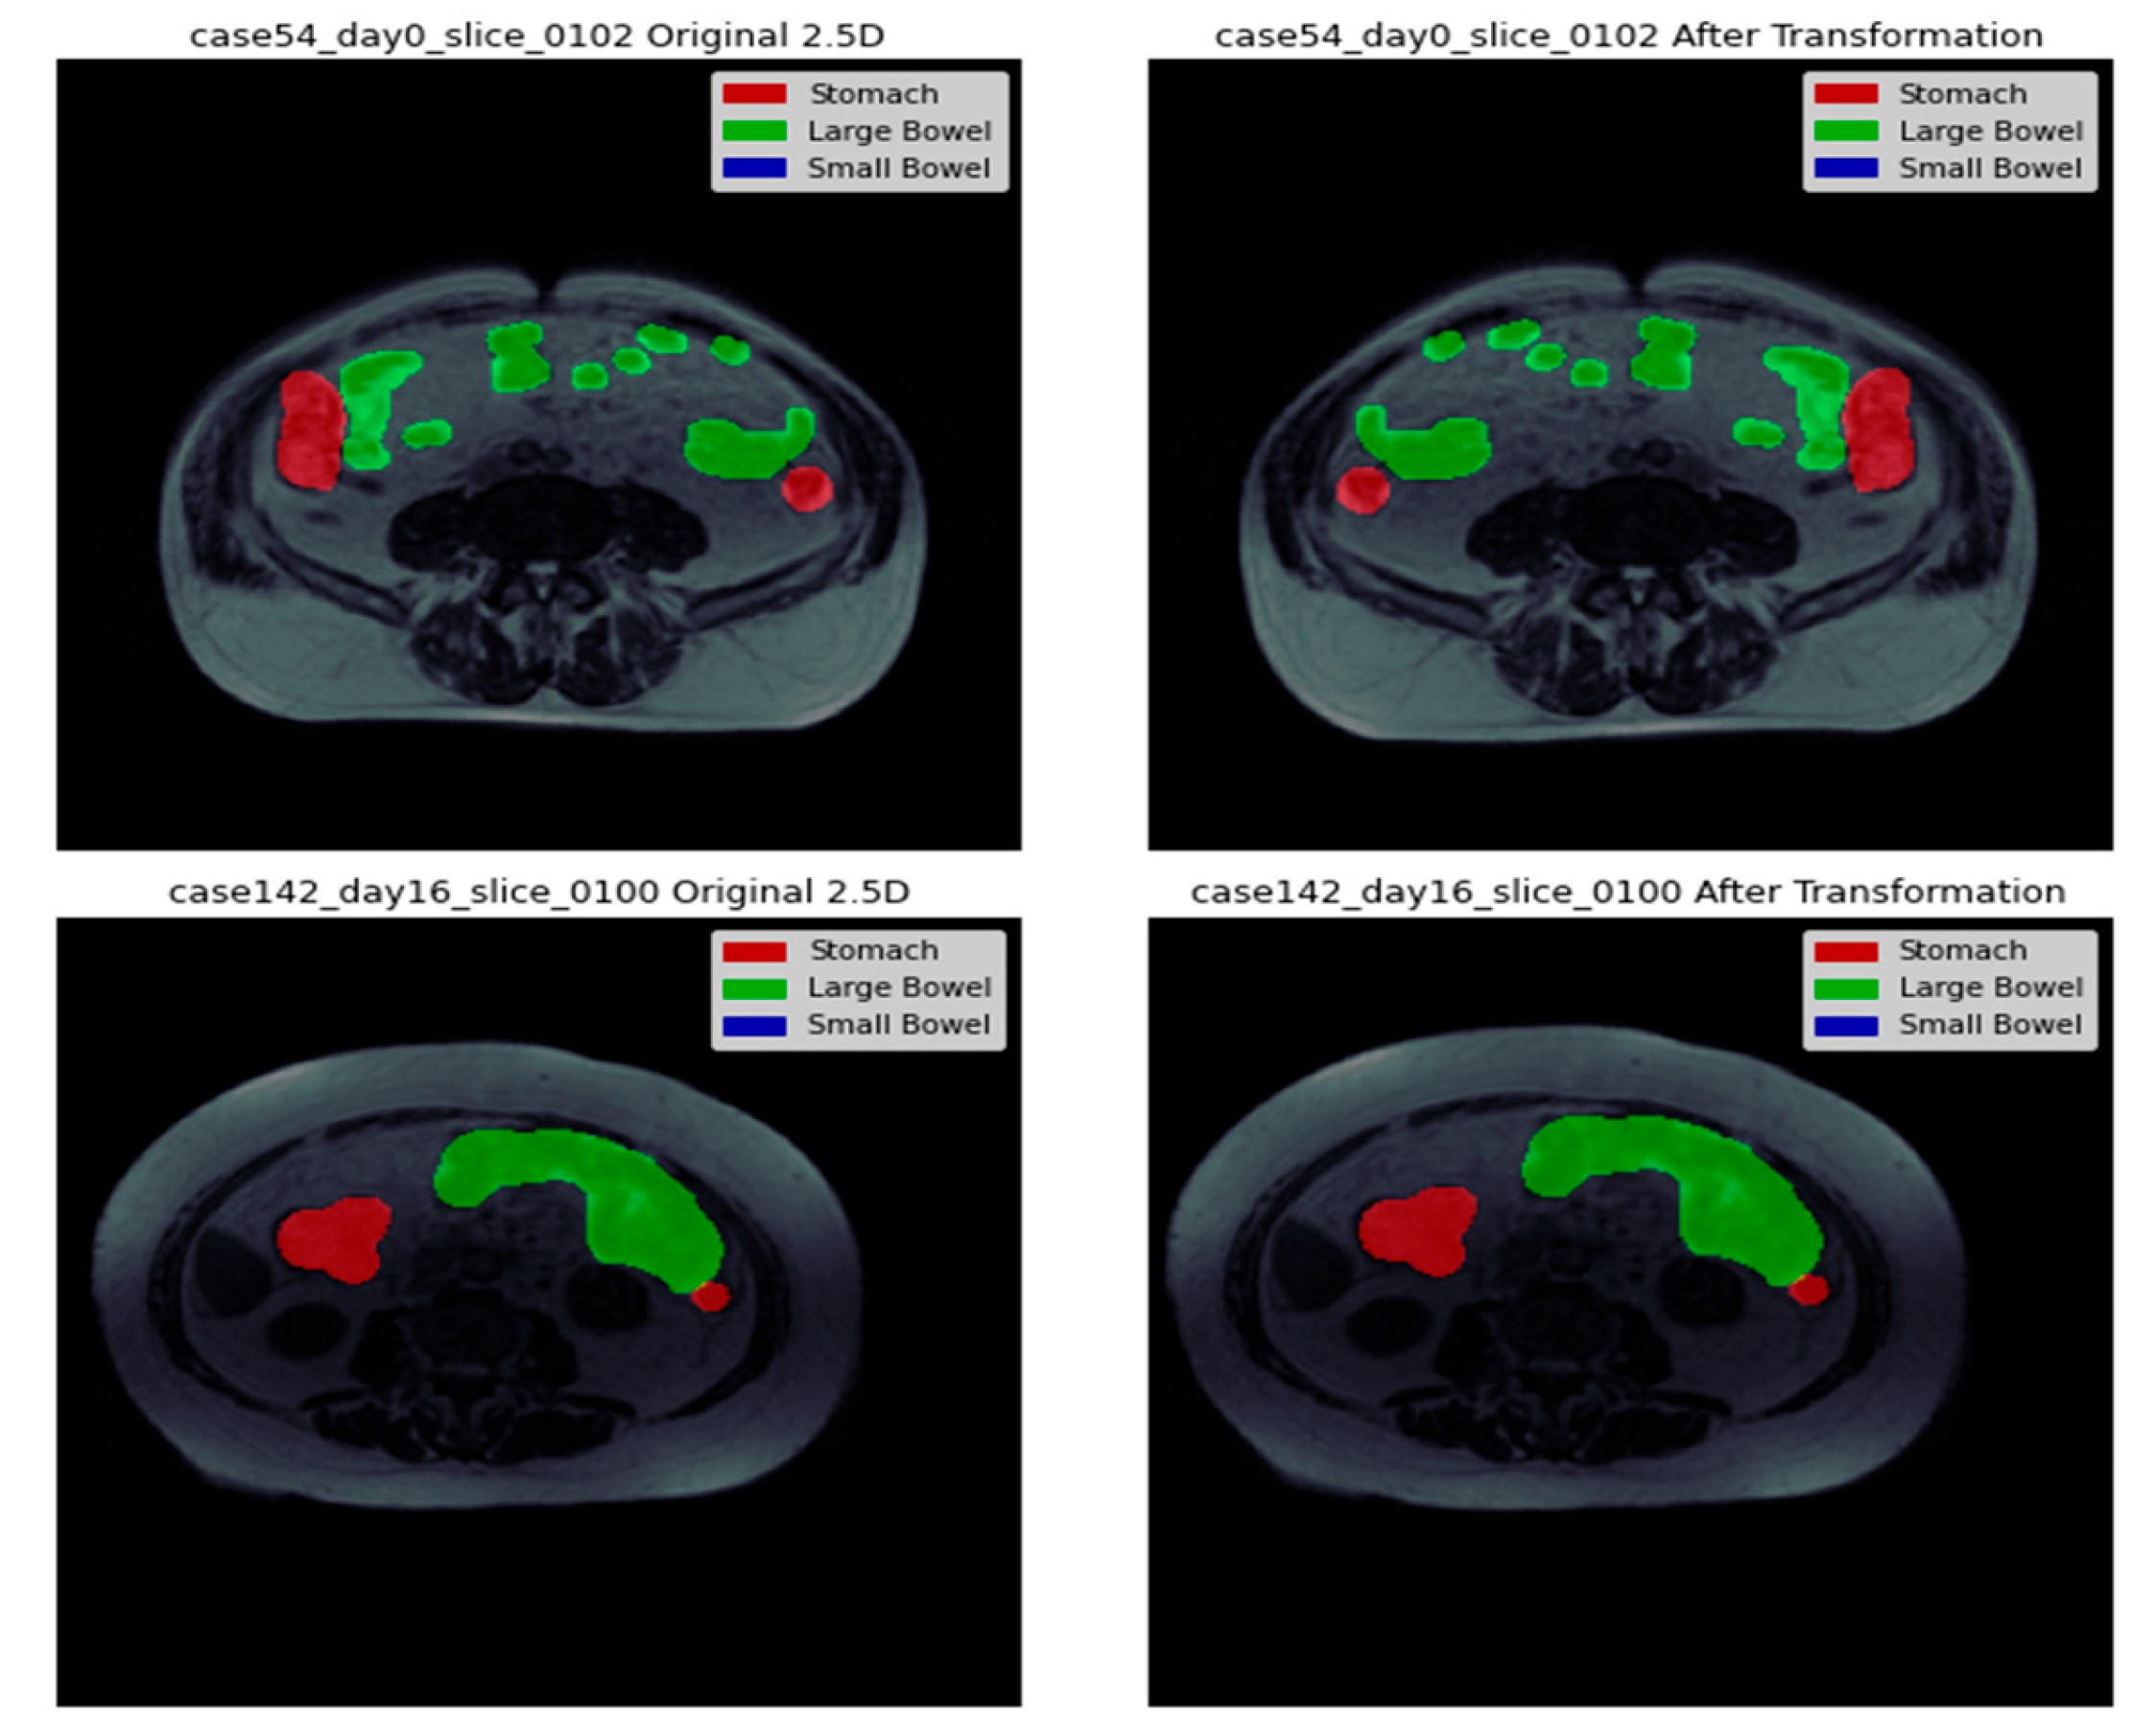
In our image processing pipeline, the next step in image preprocessing is embedding the mask information obtained from the metadata. The metadata contains details of organ segmentation based on pixel position and length. For each case ID, there can be three possibilities: no mask, all organs masked, or only some organs masked.
Figure 3 presents a side-by-side representation of the images with their corresponding masks to provide a clear visualization of the segmentation process. The visual depiction shows that the separation between the stomach and large intestine decreases with each successive slice. This suggests a gradual decrease or less prominence of the stomach and large intestine regions in the images as we move through the slices. On the other hand, the segmentation of the small intestine shows a progressive increment with each consecutive slice. This indicates a growing prominence or clearer appearance of the small intestine region in the images as we progress through the slices.
3.5. ResECA-U-Net
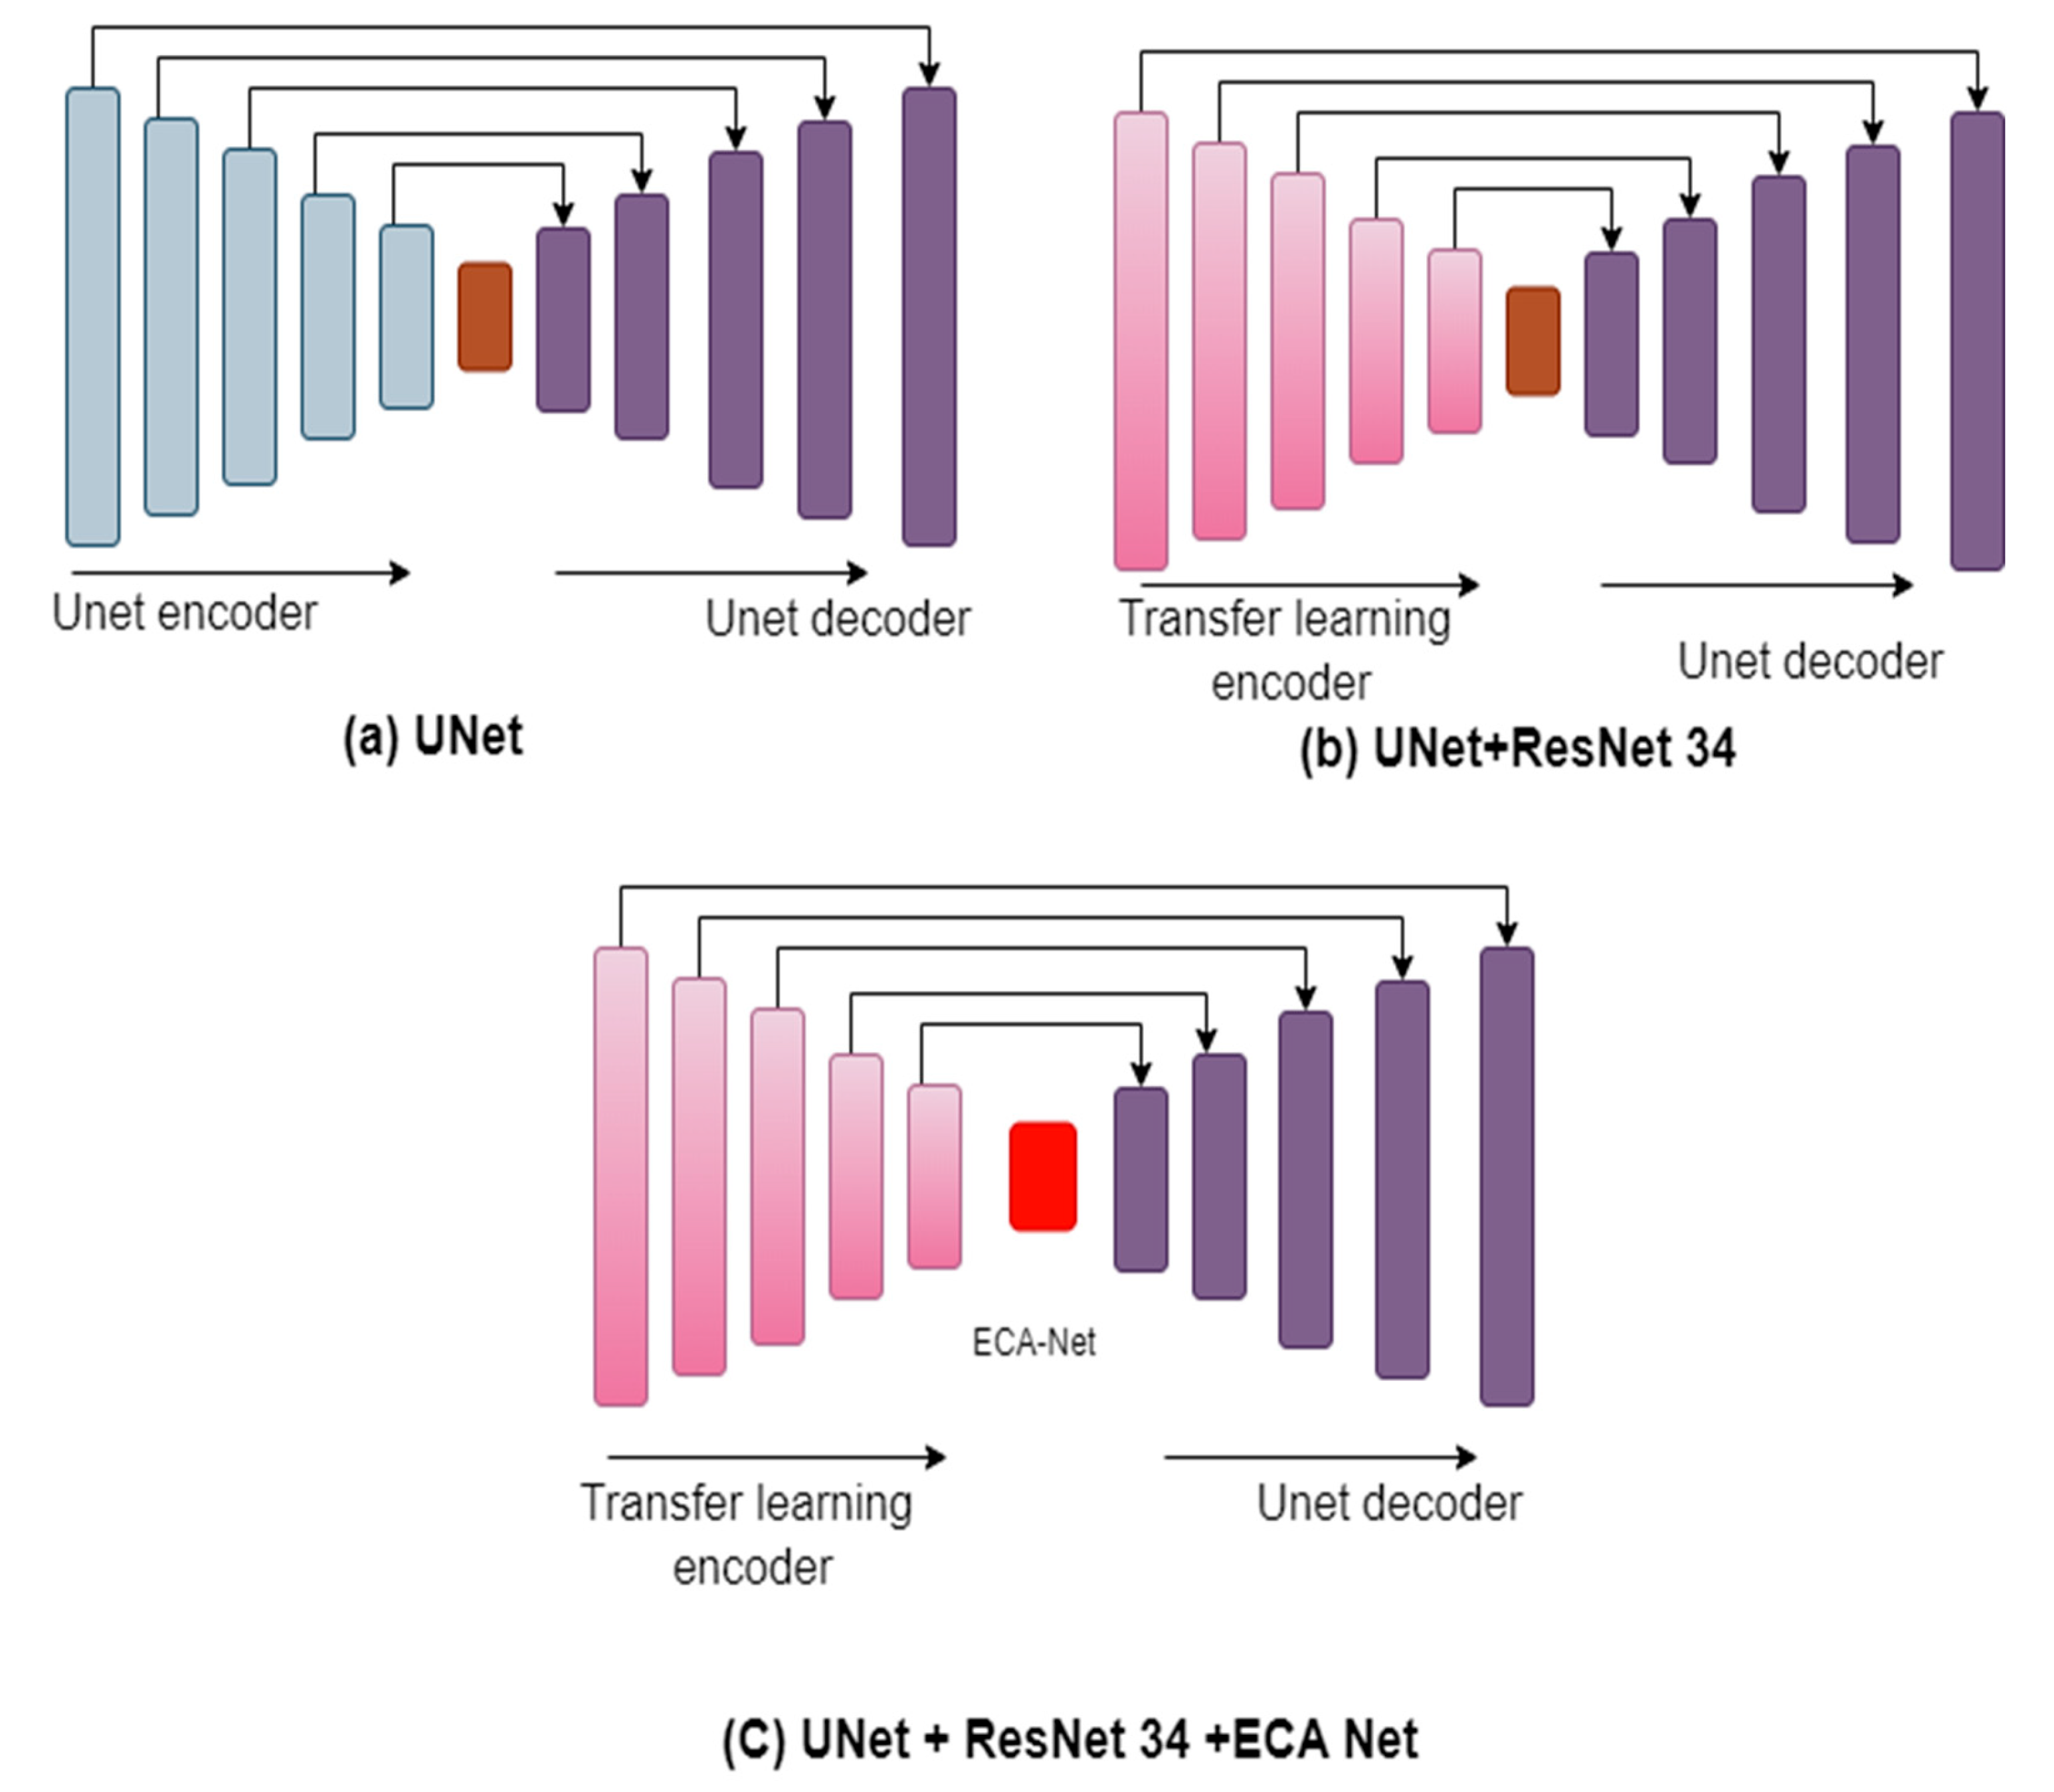
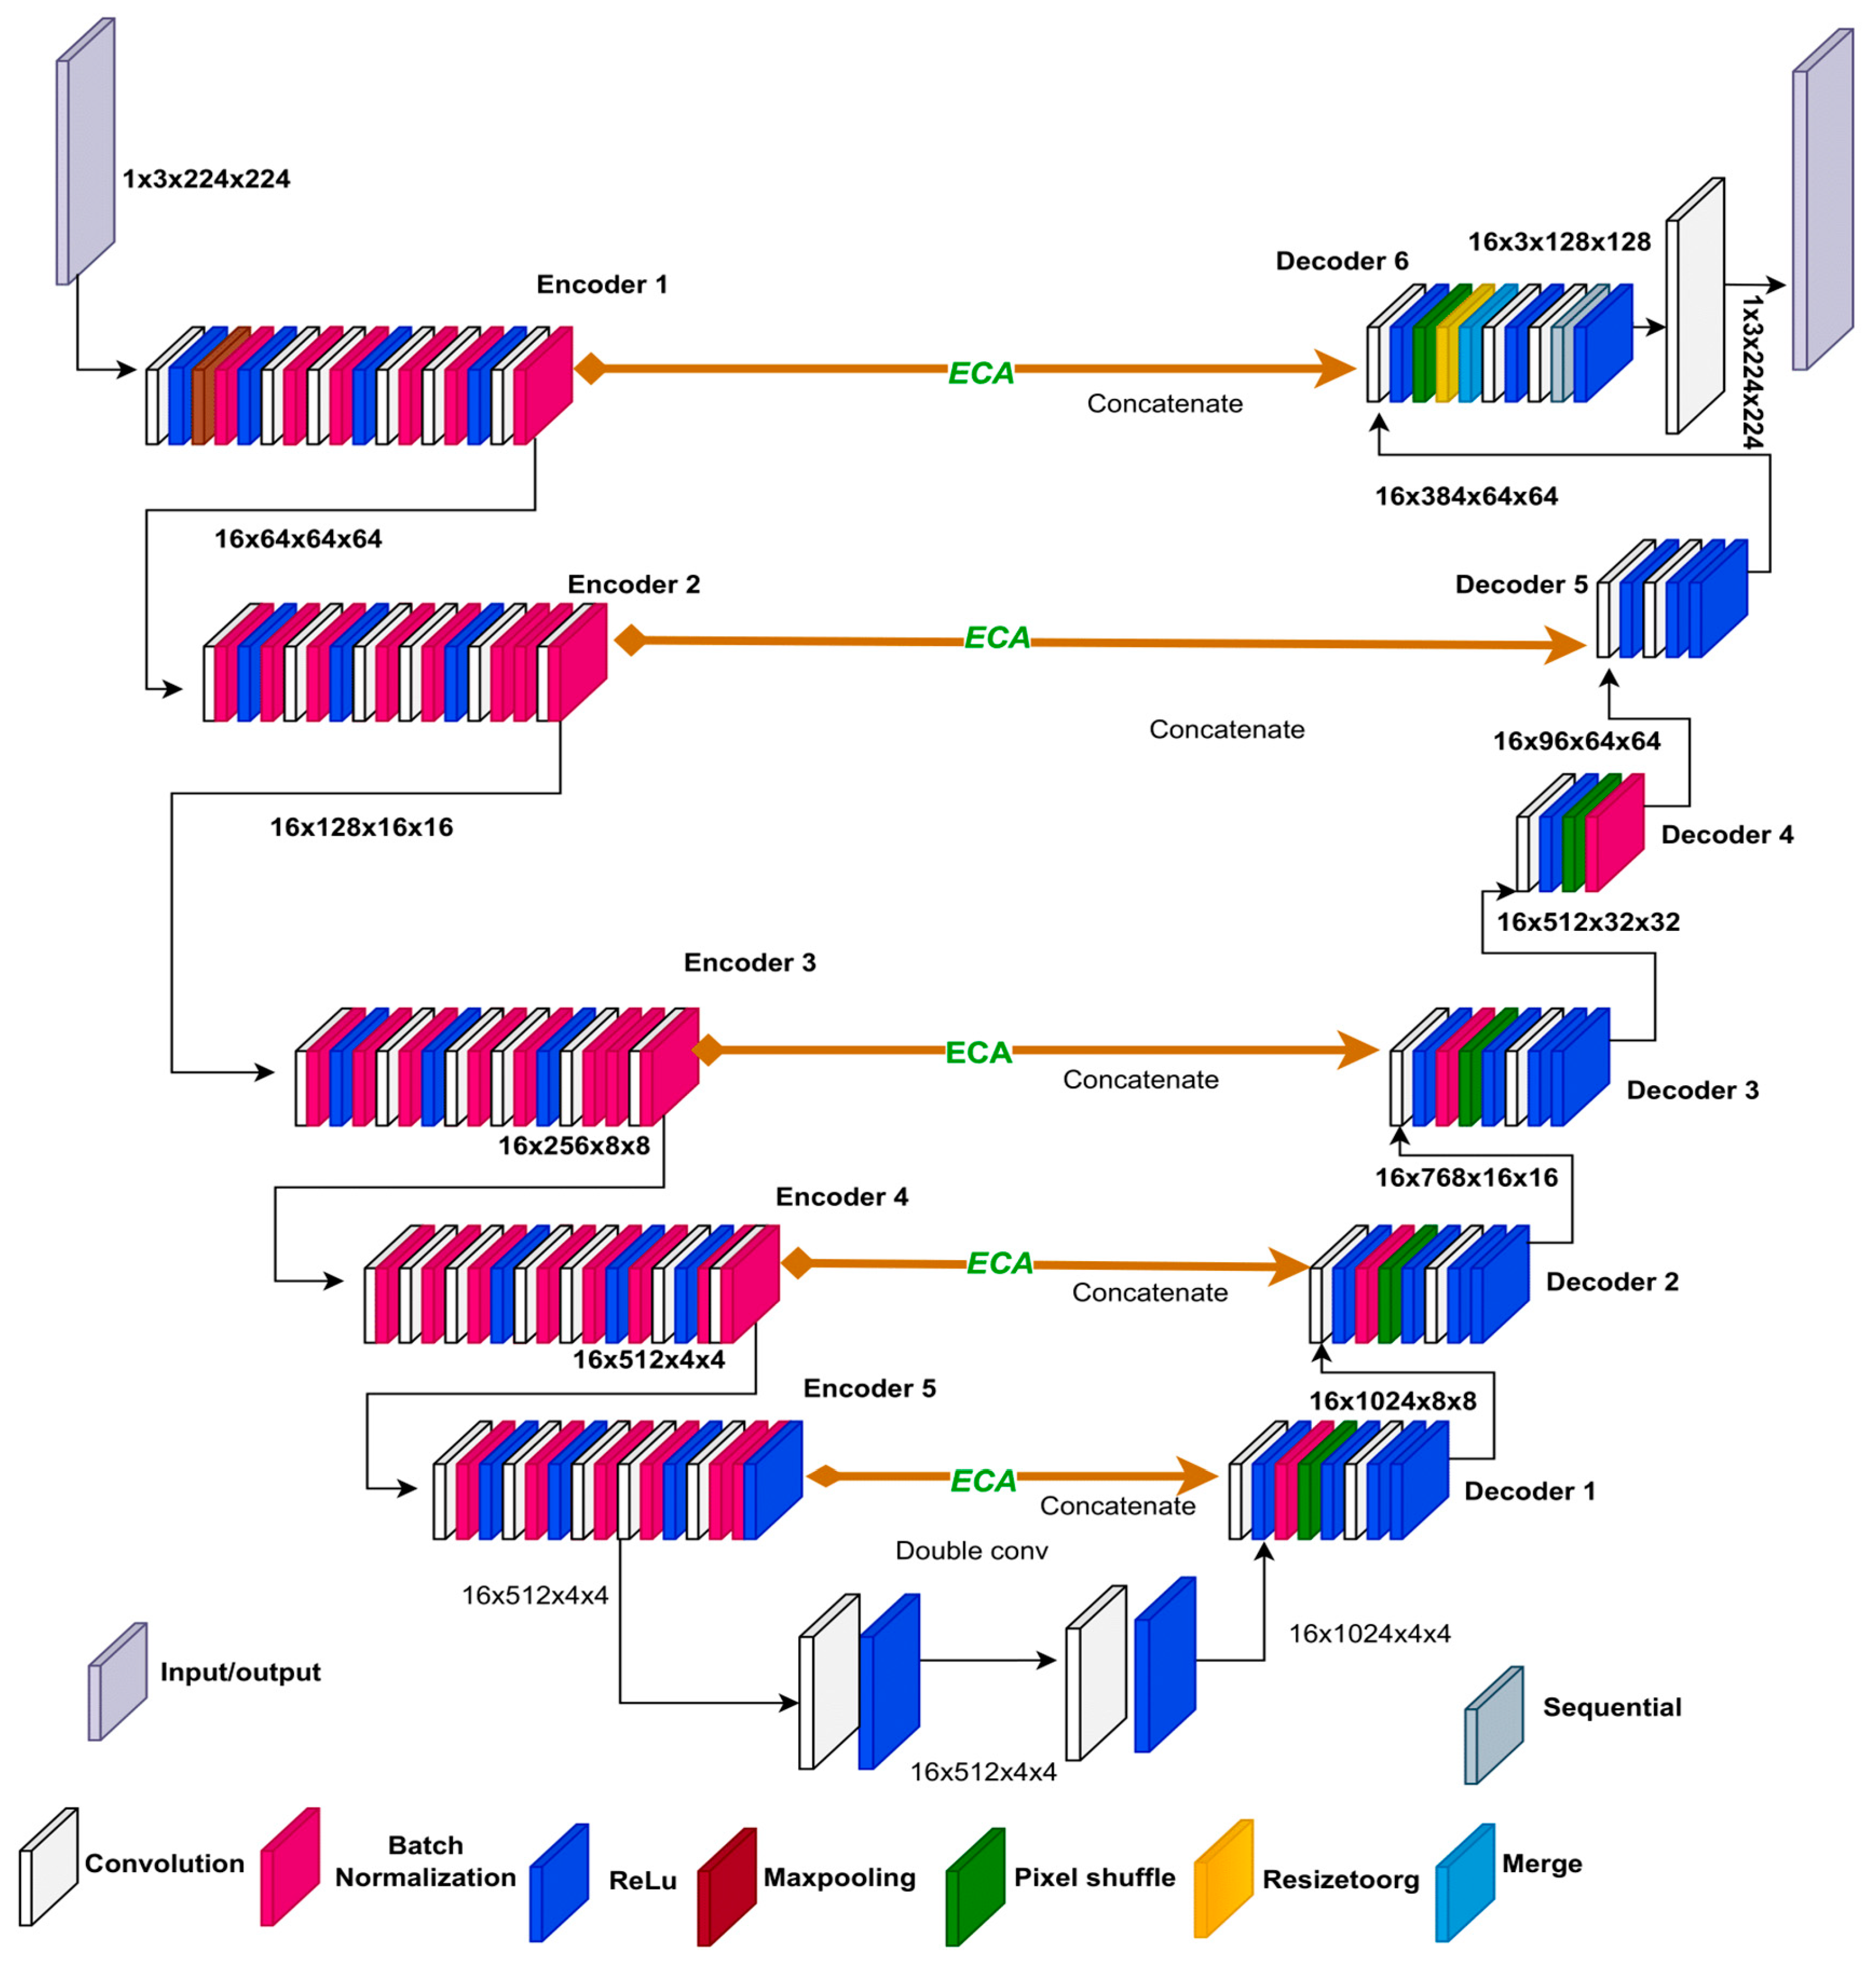
In our ResECA-U-Net architecture, we incorporate the Efficient Channel Attention (ECA) mechanism into the middle Concat layer, which is based on the original U-Net structure. To enhance the down-sampling component of U-Net, we focus on the first five elements of ResNet34 and replace maximum pooling with 3x3 convolutions, reducing information loss.
We improve the spatial and channel dimensions of the last three down-sampling output feature maps by maintaining the U-Net’s skip connection and introducing the ECA module in the intermediate connection layer. For complete information fusion, we combine the corresponding up-sampling components.
Figure 4 visually illustrates the structure of the ResECA-U-Net network, showcasing the operations and network modules with various colors. During the feature extraction process of ResECA-U-Net, we utilize four groups of 1x1 convolutions, maximum pooling, and residual convolutions. The convolution kernels have a size of 3x3, and the maximum pooling operations are 3x3 as well. We employ five sets of 2x2 upsampling and 3x3 convolution operations to restore the feature map size during decoding. In the first three upsamplings, the feature map in the middle layer undergoes information fusion, and the ECA attention module improves the matching down-sampled feature map. By combining upsampling and 1x1 convolution, our network generates a prediction image of the same size as the input image, completing the image segmentation process. Precise network parameters include layer names, output feature map sizes, and operations (stride, convolution, maximum pooling, and up-sampling). Overall, our ResECA-U-Net architecture leverages the strengths of both U-Net and ResNet while incorporating attention methods to enhance feature representation and accelerate segmentation speed.
3.6. Residual Module Basic Block
In our study, we delve into the concept of the Deep Residual Network (ResNet), which was introduced by He et al. in 2015. We adopt the term”residual” to describe the discrepancy between the observed value and the estimated value in the network mapping. By considering the network input as x and the expected mapping as H(x), we can express the relationship as follows:
In ResNet, the inclusion of residual blocks alleviates the problem of network degradation, which often arises in deeper networks. These residual blocks enable smoother optimization compared to explicitly optimizing H(x).
We can express the relationships between multiple layers in the context of layer L as follows:
Where X(L+1) = X(L) + F(X(L))
Equations (2) denote the output and input of layer L as XL+1 and XL, respectively. By adding the residual F(X(i)) to the input X(i), this relationship exemplifies the 246 additive nature of residual connections. Such a relationship can be recursively employed, enabling the network to learn the residual mapping and improve its performance effectively.
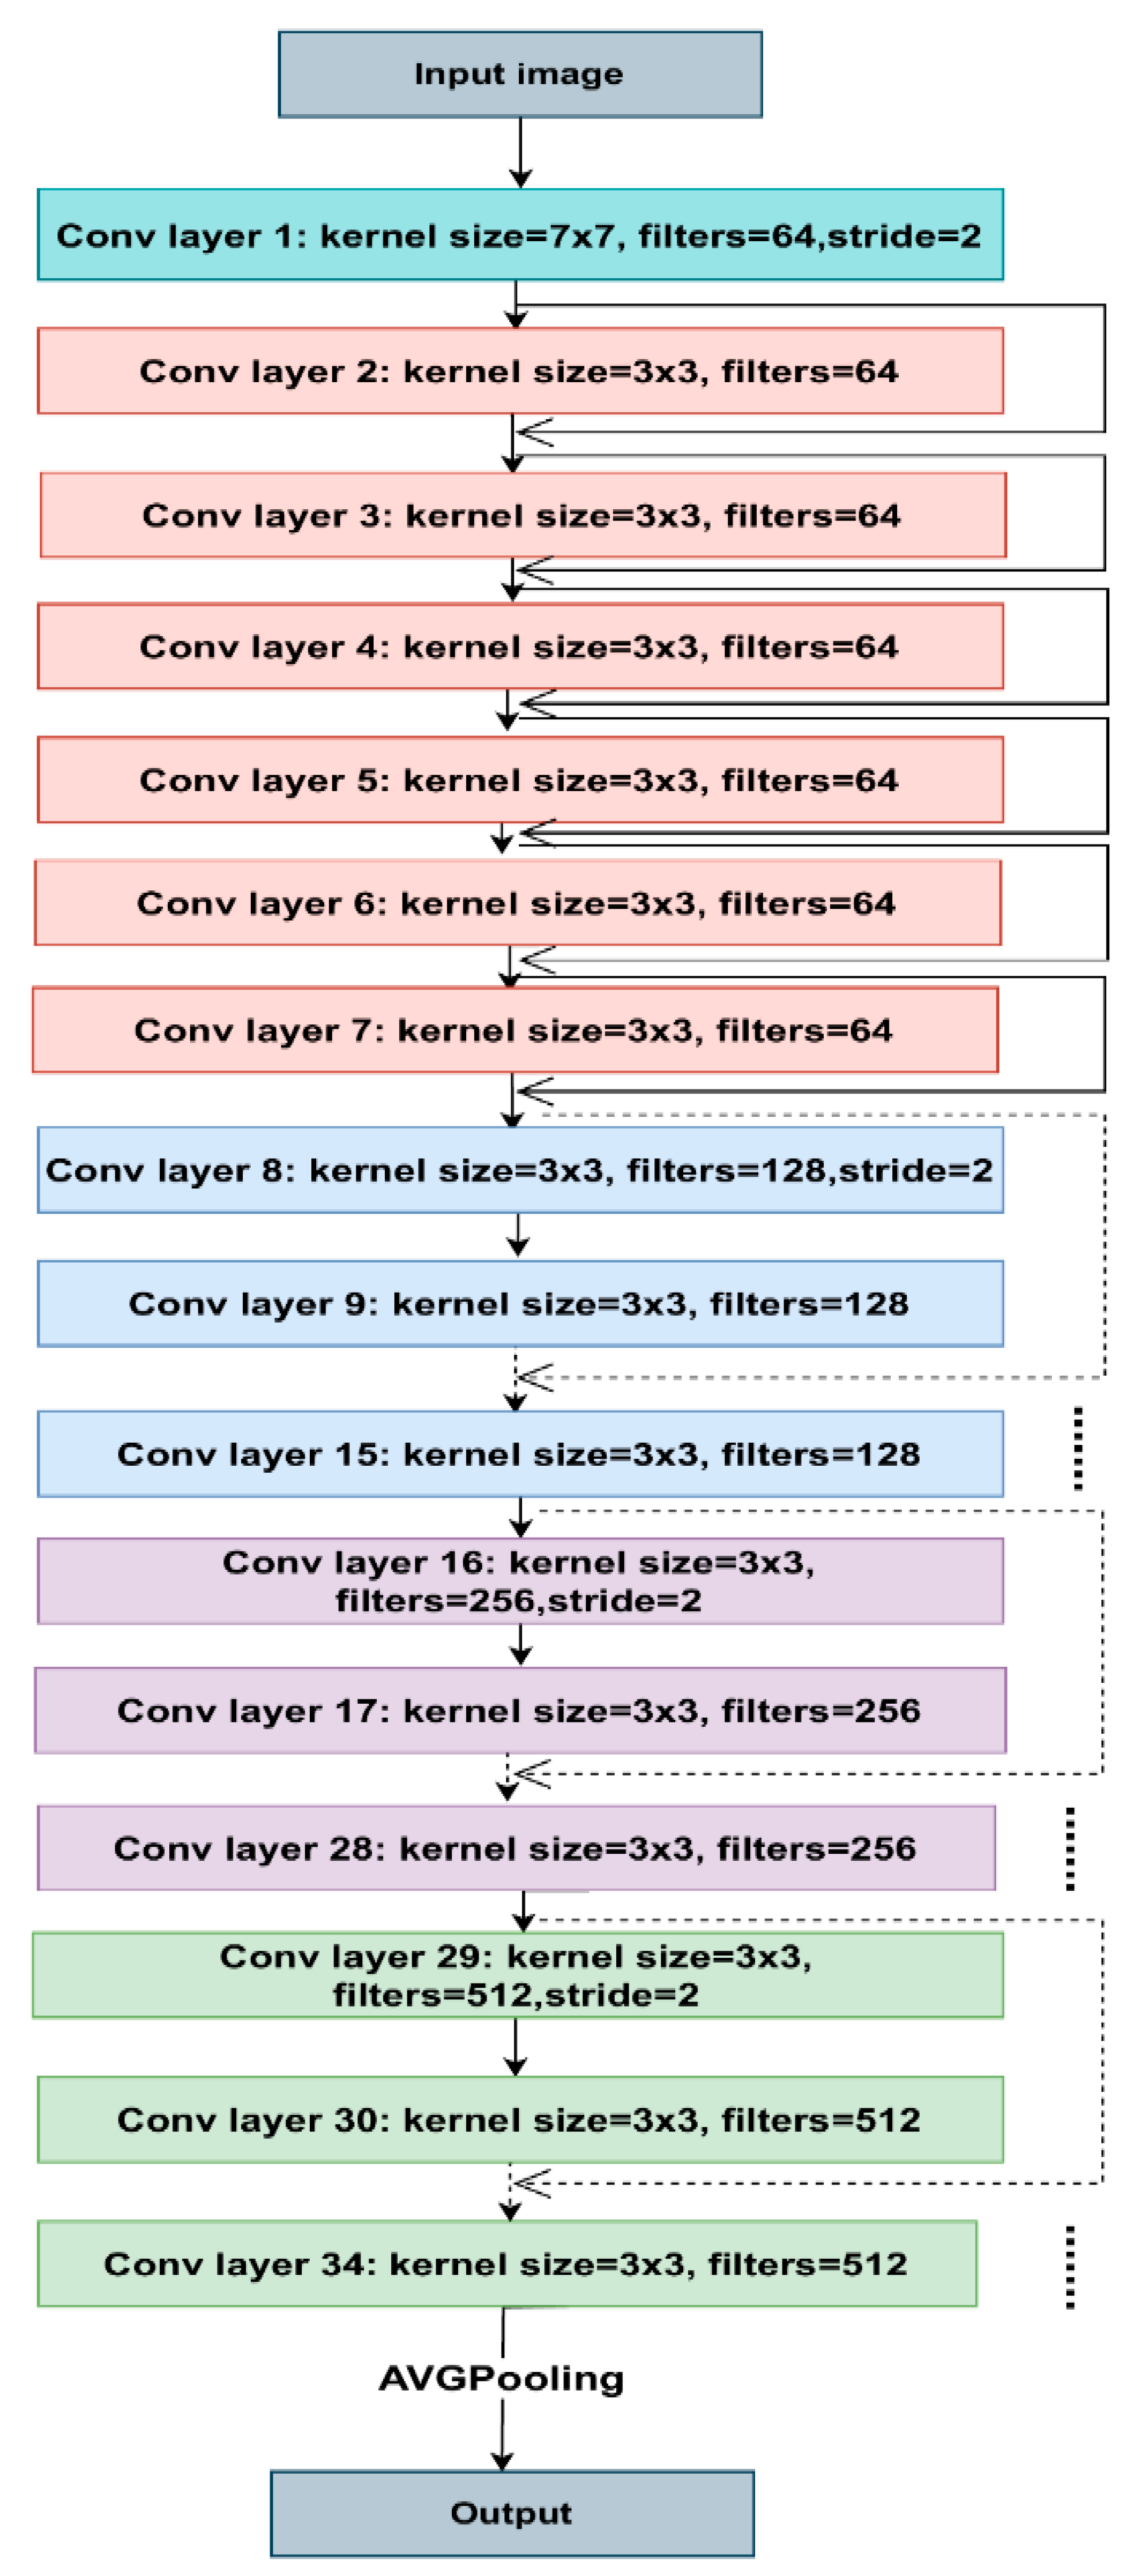
Figure 5 shows the architecture of ResNet34. Each colored block in the model represents a group of convolutions with comparable dimensions. The 3x3 convolutions used in each layer, with fixed feature map dimensions of 64, 128, 256, and 512, respectively, follow the same pattern. As the solid lines show, the input travels through every two convolution layers, maintaining the exact dimensions.
Contrarily, the dotted lines signify modifications to the input volume dimensions. We noticed that the convolution procedure, when the initial convolution of each layer’s stride size changes from 1 to 2, causes the dimension reduction. Each layer of ResNet’s architecture contains several blocks. ResNet maintains the total number of layers while increasing the number of tasks within a block as it learns deeper. As a result, the model can better handle deep representations and learn more sophisticated characteristics.
3.7. Efficient Channel Attention (ECA-Net)
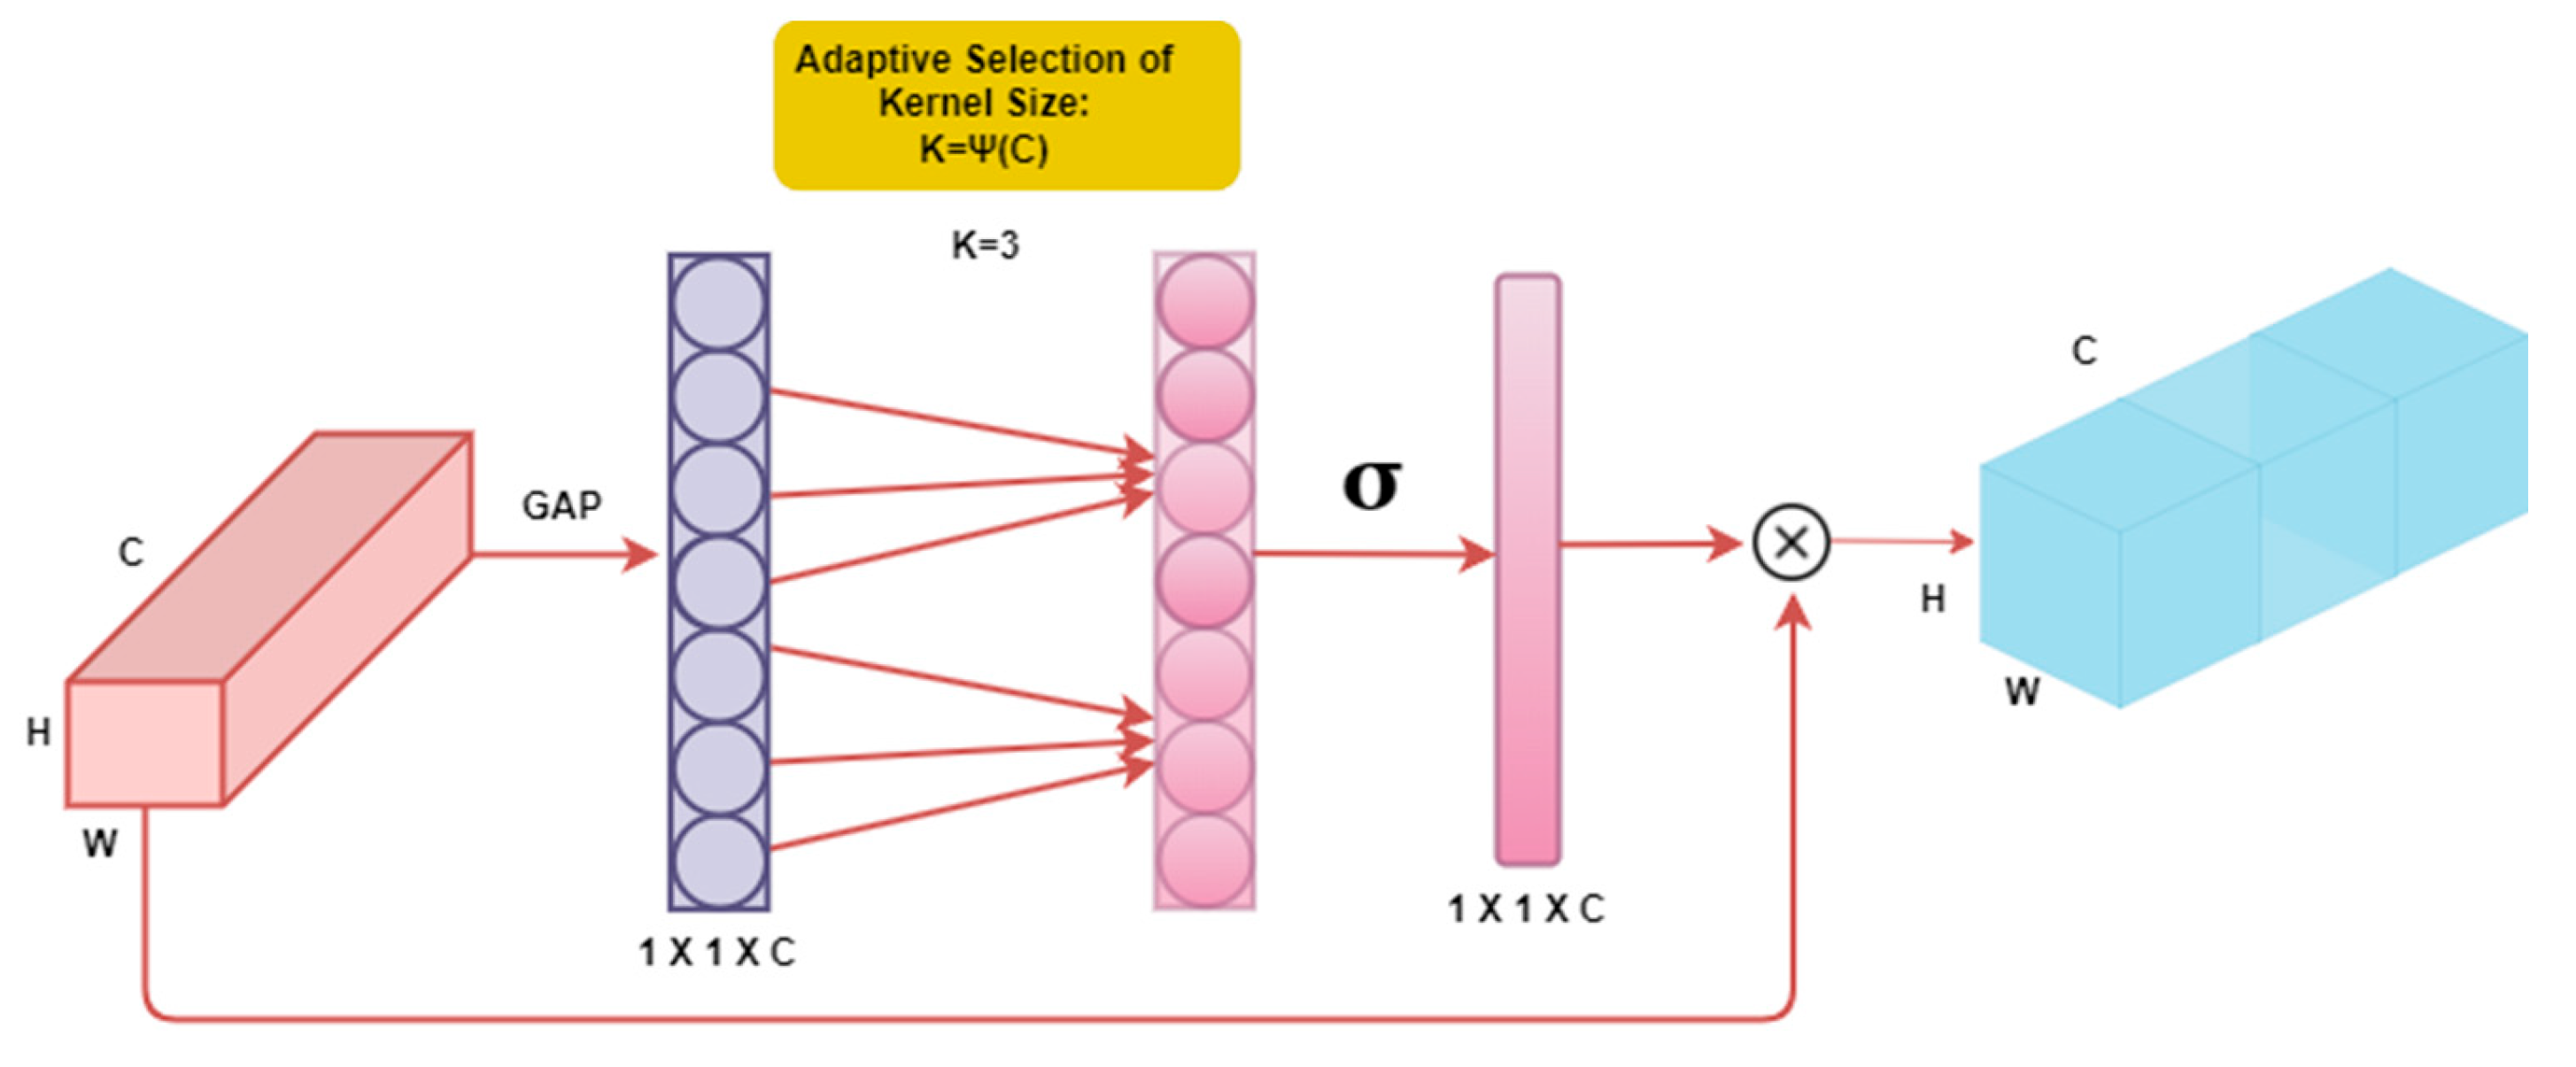
We implemented the Efficient Channel Attention (ECA) mechanism to increase the variety and heterogeneity of the tested models, as shown in
Figure 6. In our approach, we propose a channel attention module with significant performance advantages with minimal parameter usage, unlike previous methods that often rely on complex module construction for improved performance [
15]. The channel attention method has demonstrated promise in enhancing the performance of deep convolutional neural networks (CNNs). It enables the model to focus on essential features while suppressing irrelevant ones by selectively attending to different channels within the network. This attention process enables CNN to extract more meaningful and discriminative representations from the input data. Incorporating channel attention in the CNN design increases accuracy and improves generalization power. ECA-Net captures local cross-channel interactions using 1-D convolution, with the extent of cross-channel interaction determined by the convolution kernel size. The selection of the convolution kernel is based on conventional exponential function formulas that correspond to the number of channels [
16]. Overall, the channel attention mechanism has proven to be a successful approach for enhancing the performance of deep CNNs. It improves the model’s ability to generalize and achieve higher accuracy and provides a means to focus on relevant information selectively. In this work, we employ the Efficient Channel Attention (ECA) technique to ensure improved performance while maintaining simplicity and utilizing sparse parameters.
3.8. Transfer Learning
Transfer learning is a valuable method to shorten training times because segmentation depends on the capacity to acquire and transfer knowledge. Different visual identification tasks, such as detection and semantic segmentation, have succeeded with transfer learning [
17]. Valuable parameters are enhanced, and unnecessary factors are removed when employing transfer learning. In [
18], transfer learning is not a general norm, and the task-specific nature of the learning will determine how effective it is.
In the U-Net design, we experimented with many types of transfer learning, such as EfficientNet-B0, EfficientNet-B1, ResNet-18, ResNet-34, ResNet-50, and ResNet-101, taking inspiration from transfer learning methodologies. These tests showed that employing transfer learning with ResNet-34 in conjunction with U-Net led to successful segmentation outcomes. With the addition of ECA Net to our design, we increased efficiency and improved segmentation performance significantly. As a result, we created a brand-new architecture called ResECA-U-Net.
3.9. Loss Variations
During semantic segmentation in medical imaging, the class imbalance can be a significant issue, as the background class tends to dominate the dataset. To address this issue, we propose modifying the loss function to assign greater weight to the positive classes. The overall loss function used to optimize the models is defined as:
Here, Y represents the ground-truth label, and Yˆ represents the predicted value. 303 The binary cross-entropy (BCE) loss function, given by Equation (2), is defined as:
Where λ = 1, σ(·) denotes the sigmoid function, Y is the ground-truth label, and Yˆ is the predicted value. The Tversky loss function, defined in Equation (3), is also used:
Here, Yˆ 0,i represents the predicted background voxel, Yˆ 1,i represents the predicted organ voxel, Y0,i represents the ground-truth background voxel, Y1,i represents the ground-truth organ voxel, and α and β are weighting factors for false positives and false negatives, respectively. Here α and β are both set to 0.5, and the sum is taken over all voxels i. In our research, we explore two different configurations for the loss function as defined in Equation (2). The first configuration sets λ = 1, which represents the standard BCE loss, where both positive and negative examples have an equal impact on the loss function. In contrast, the second configuration, where λ = 10, introduces a positively skewed BCE loss that places a higher weight on the positive classes. Consequently, incorrect classification of non-background pixels as background incurs a higher penalty [
19]. By adopting this loss function, our approach aims to minimize the number of false negative pixels, which refers to those that are erroneously classified as background.
3.10. Diversity-Promoting Ensemble
By employing a typical technique of restricting the number of models included in the ensemble to address limited processing resources [
20], our study focuses on ensuring a more accurate ensemble by minimizing the correlation among the models, as the presence of a high correlation may lead to aggregated results resembling those of a single model. To promote diversity among the models and consider the relationship between their outputs, we propose a novel approach for ensemble generation [
21]. Initially, a wide range of U-Net models is trained to establish a robust ensemble, with particular emphasis on minimizing the correlation between the outputs of different networks, as empirical evidence suggests that encouraging decorrelation can result in more accurate ensembles. To establish an upper bound for ensembles without budget constraints, we consider an ensemble that includes all available models while eliminating restrictions. It is important to note that our suggested ensembles and other ensembles rely on soft plurality voting, involving the averaging of softmax activations from multiple models [
17]. Moreover, we introduce our diversity-promoting ensemble (DiPE) construction technique, which utilizes a correlation matrix between pairwise combinations of models [
22]. In contrast to conventional approaches that primarily focus on selecting the best-performing models, our method aims to choose highly diversified models that mutually enhance each other’s performance, thus contributing to the overall effectiveness of the ensemble [
23].
1.11. Diversity-Promoting Ensemble Creation Algorithm
Diversity-Promoting Ensemble Creation Algorithm:
Input: Trained models {M1, M2, ..., Mn}, validation set X = {X1, X2, ..., Xt}, diversity-promoting parameter λ. Output: Ensemble model ME.
1: Initialize empty set E = ∅
2: for i = 1 to n do
3: Si ← ∅ 4: for r = 1 to t do
5: Yˆ i,r ← Mi(Xr)
6: Si ← Si ∪ {Yˆ i,r} 7: end for
8: for j = 1 to n do
9: if i ̸= j then
10: Di,j ← 1 t Pt r=1 Dice(Yˆ i,r, Yˆ j,r)
11: end if 12: end for
13: wi ← 1 n−1 P j̸=i Di,j
14: E ← E ∪ {(Mi, wi)}
15: end for
16: Sort E in descending order of wi
17: ME ← Weighted combination of the top λn models in E
18: Return ME
In this algorithm [
24], we first initialize an empty set E, which will contain the ensemble models. Then, for each of the trained models, we compute the Dice coefficient between its segmentations and those of the other models. We use these coefficients to compute a weight wi for each model, which reflects its diversity with respect to the other models. We add each model and its weight to the set E. After all the models have been processed, we sort the set E in descending order of weights. Finally, we combine the top λn models in E with weights proportional to their weights in E to obtain the ensemble model ME.
4. Experiments/Results
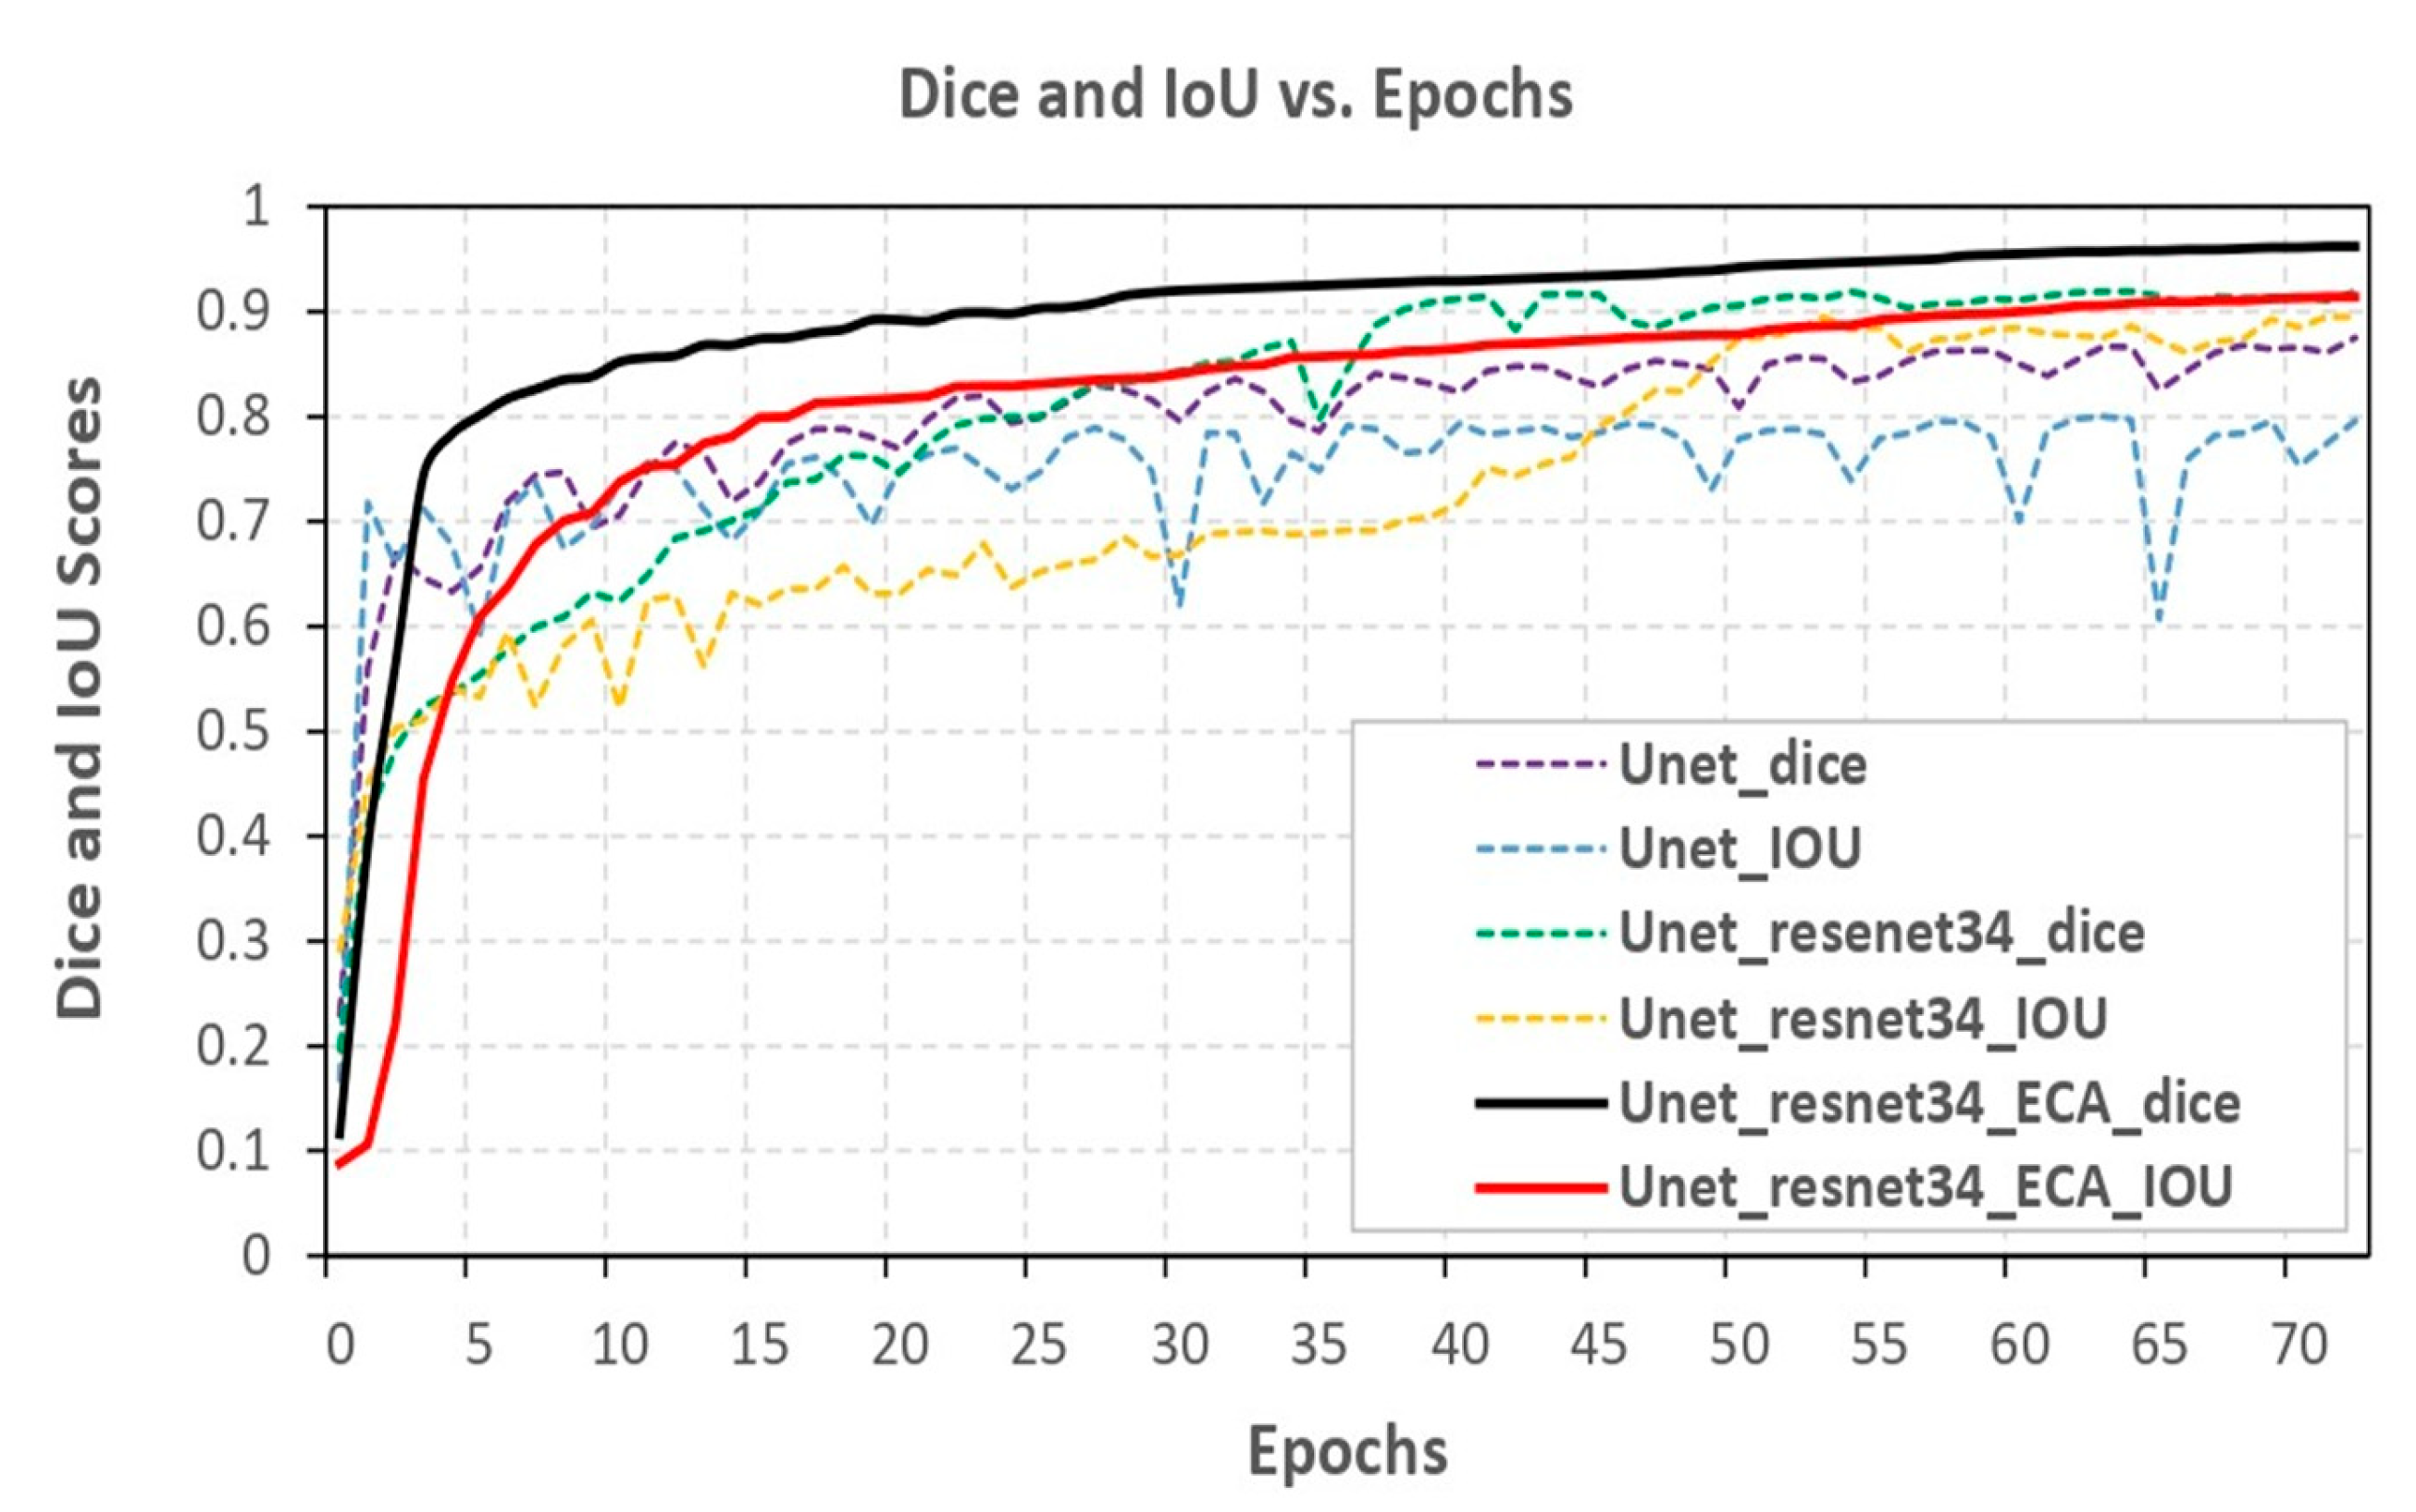
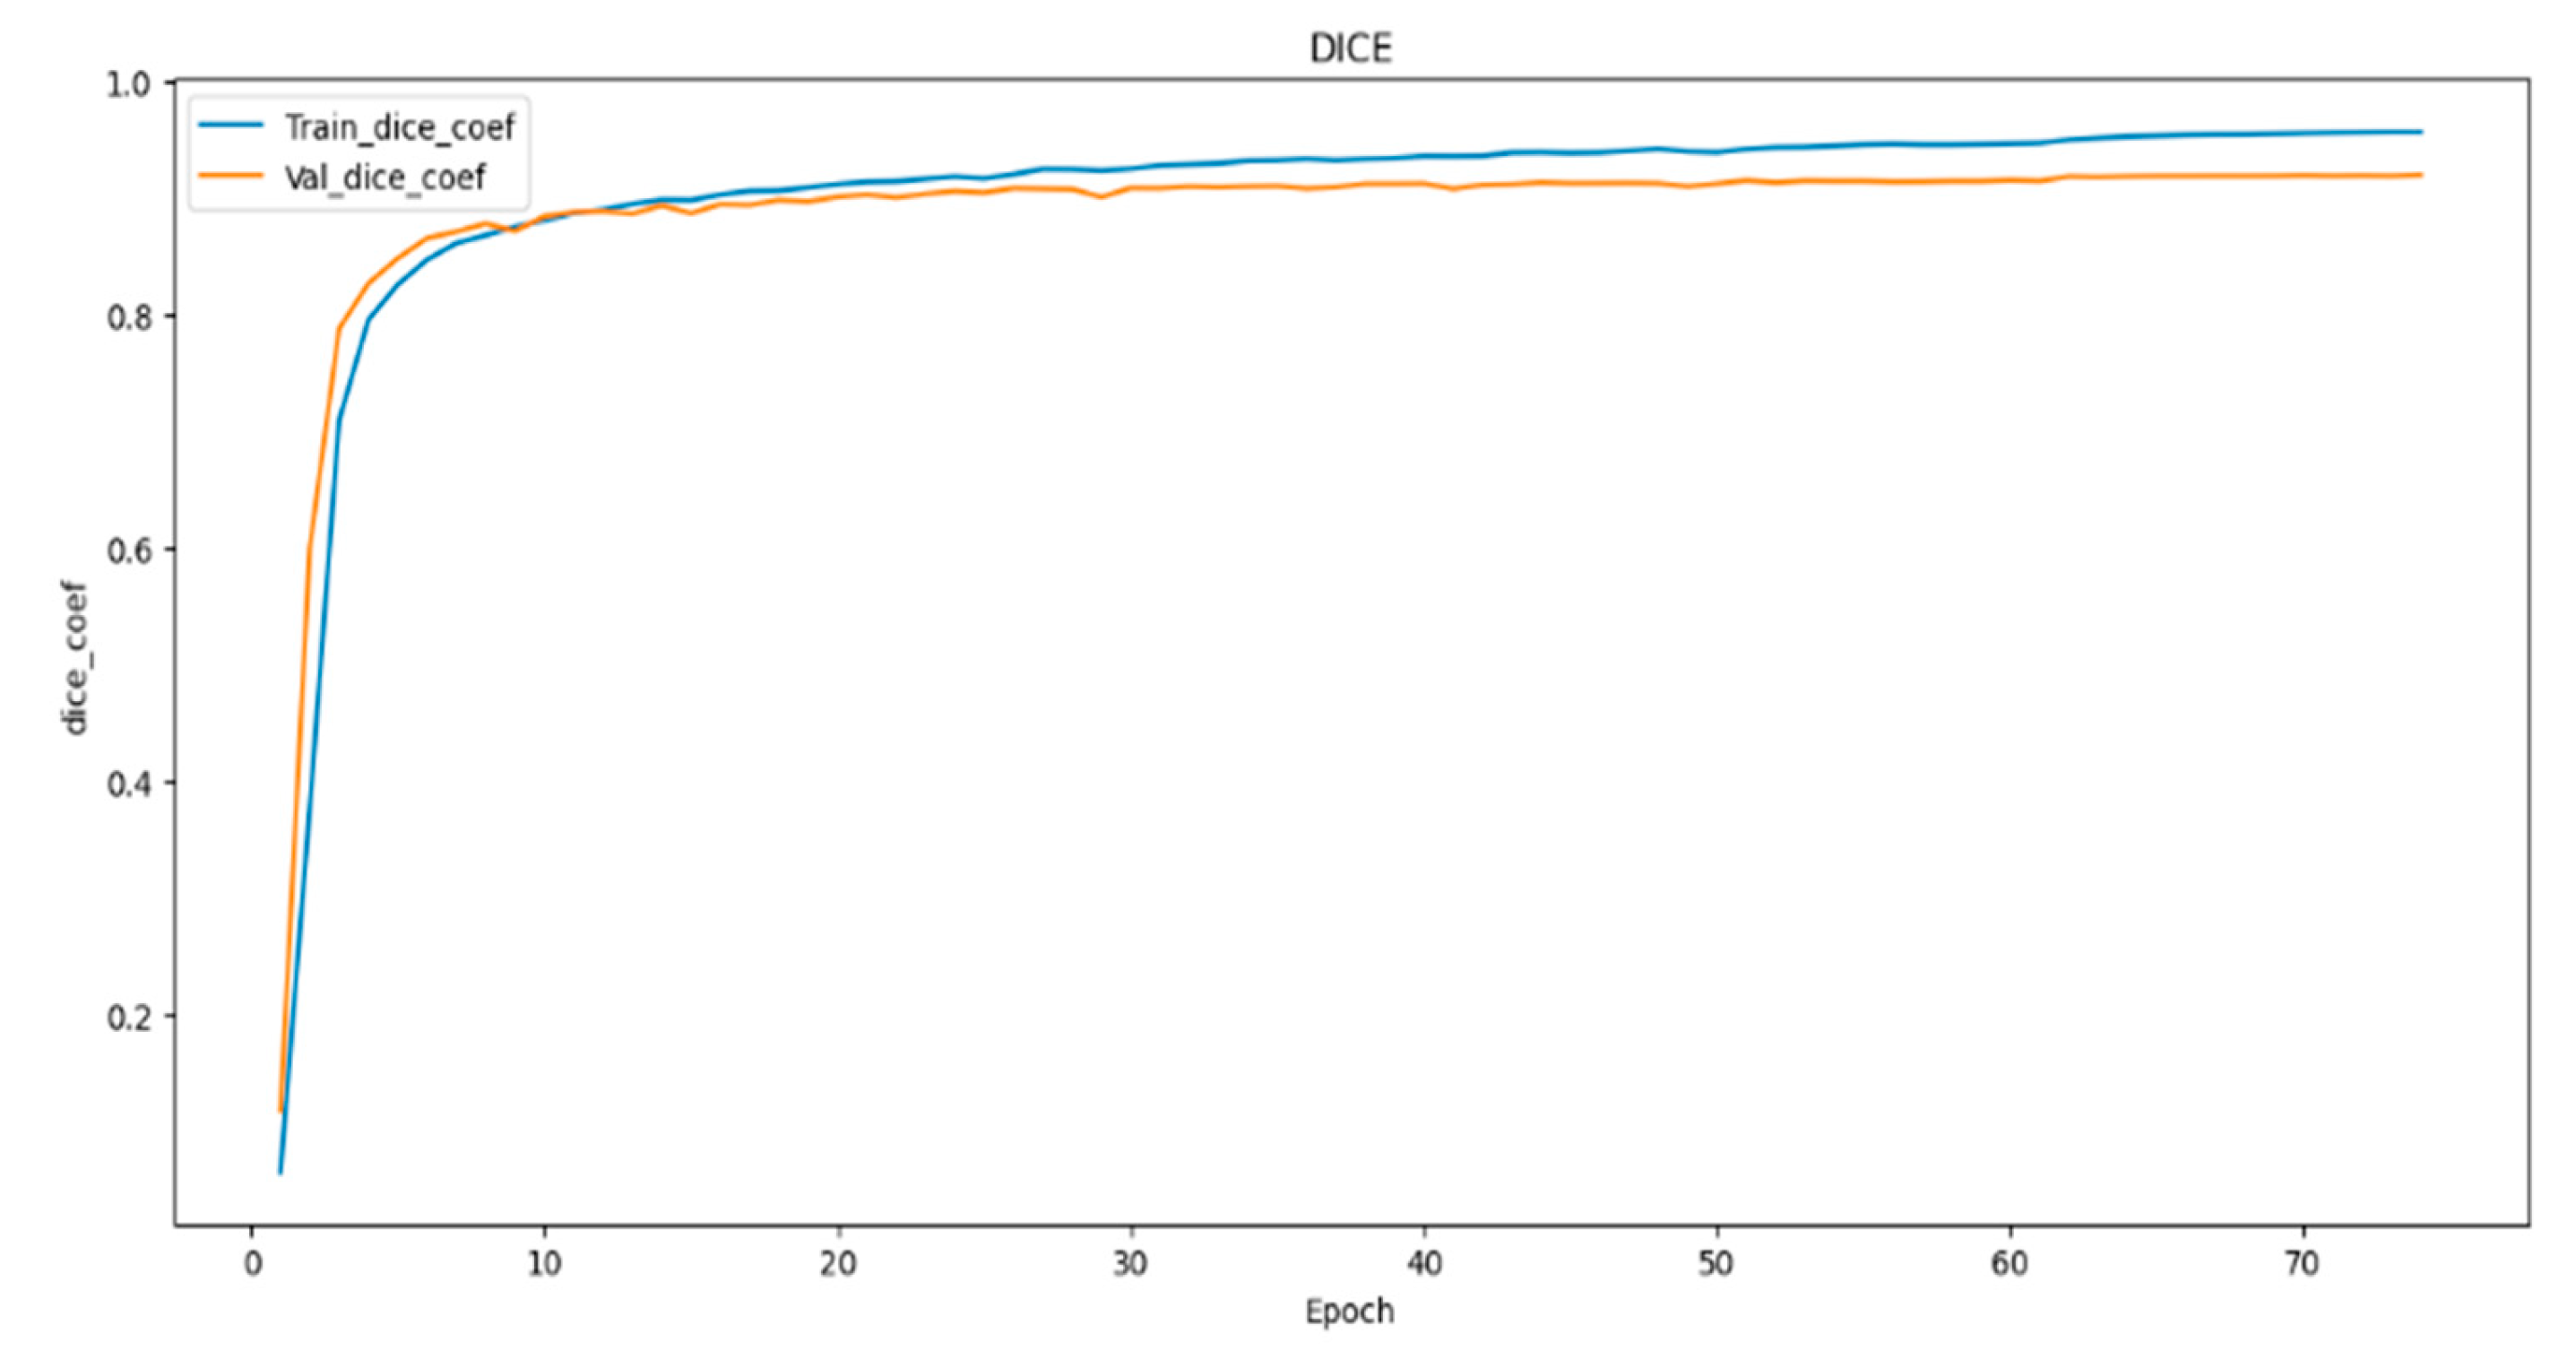
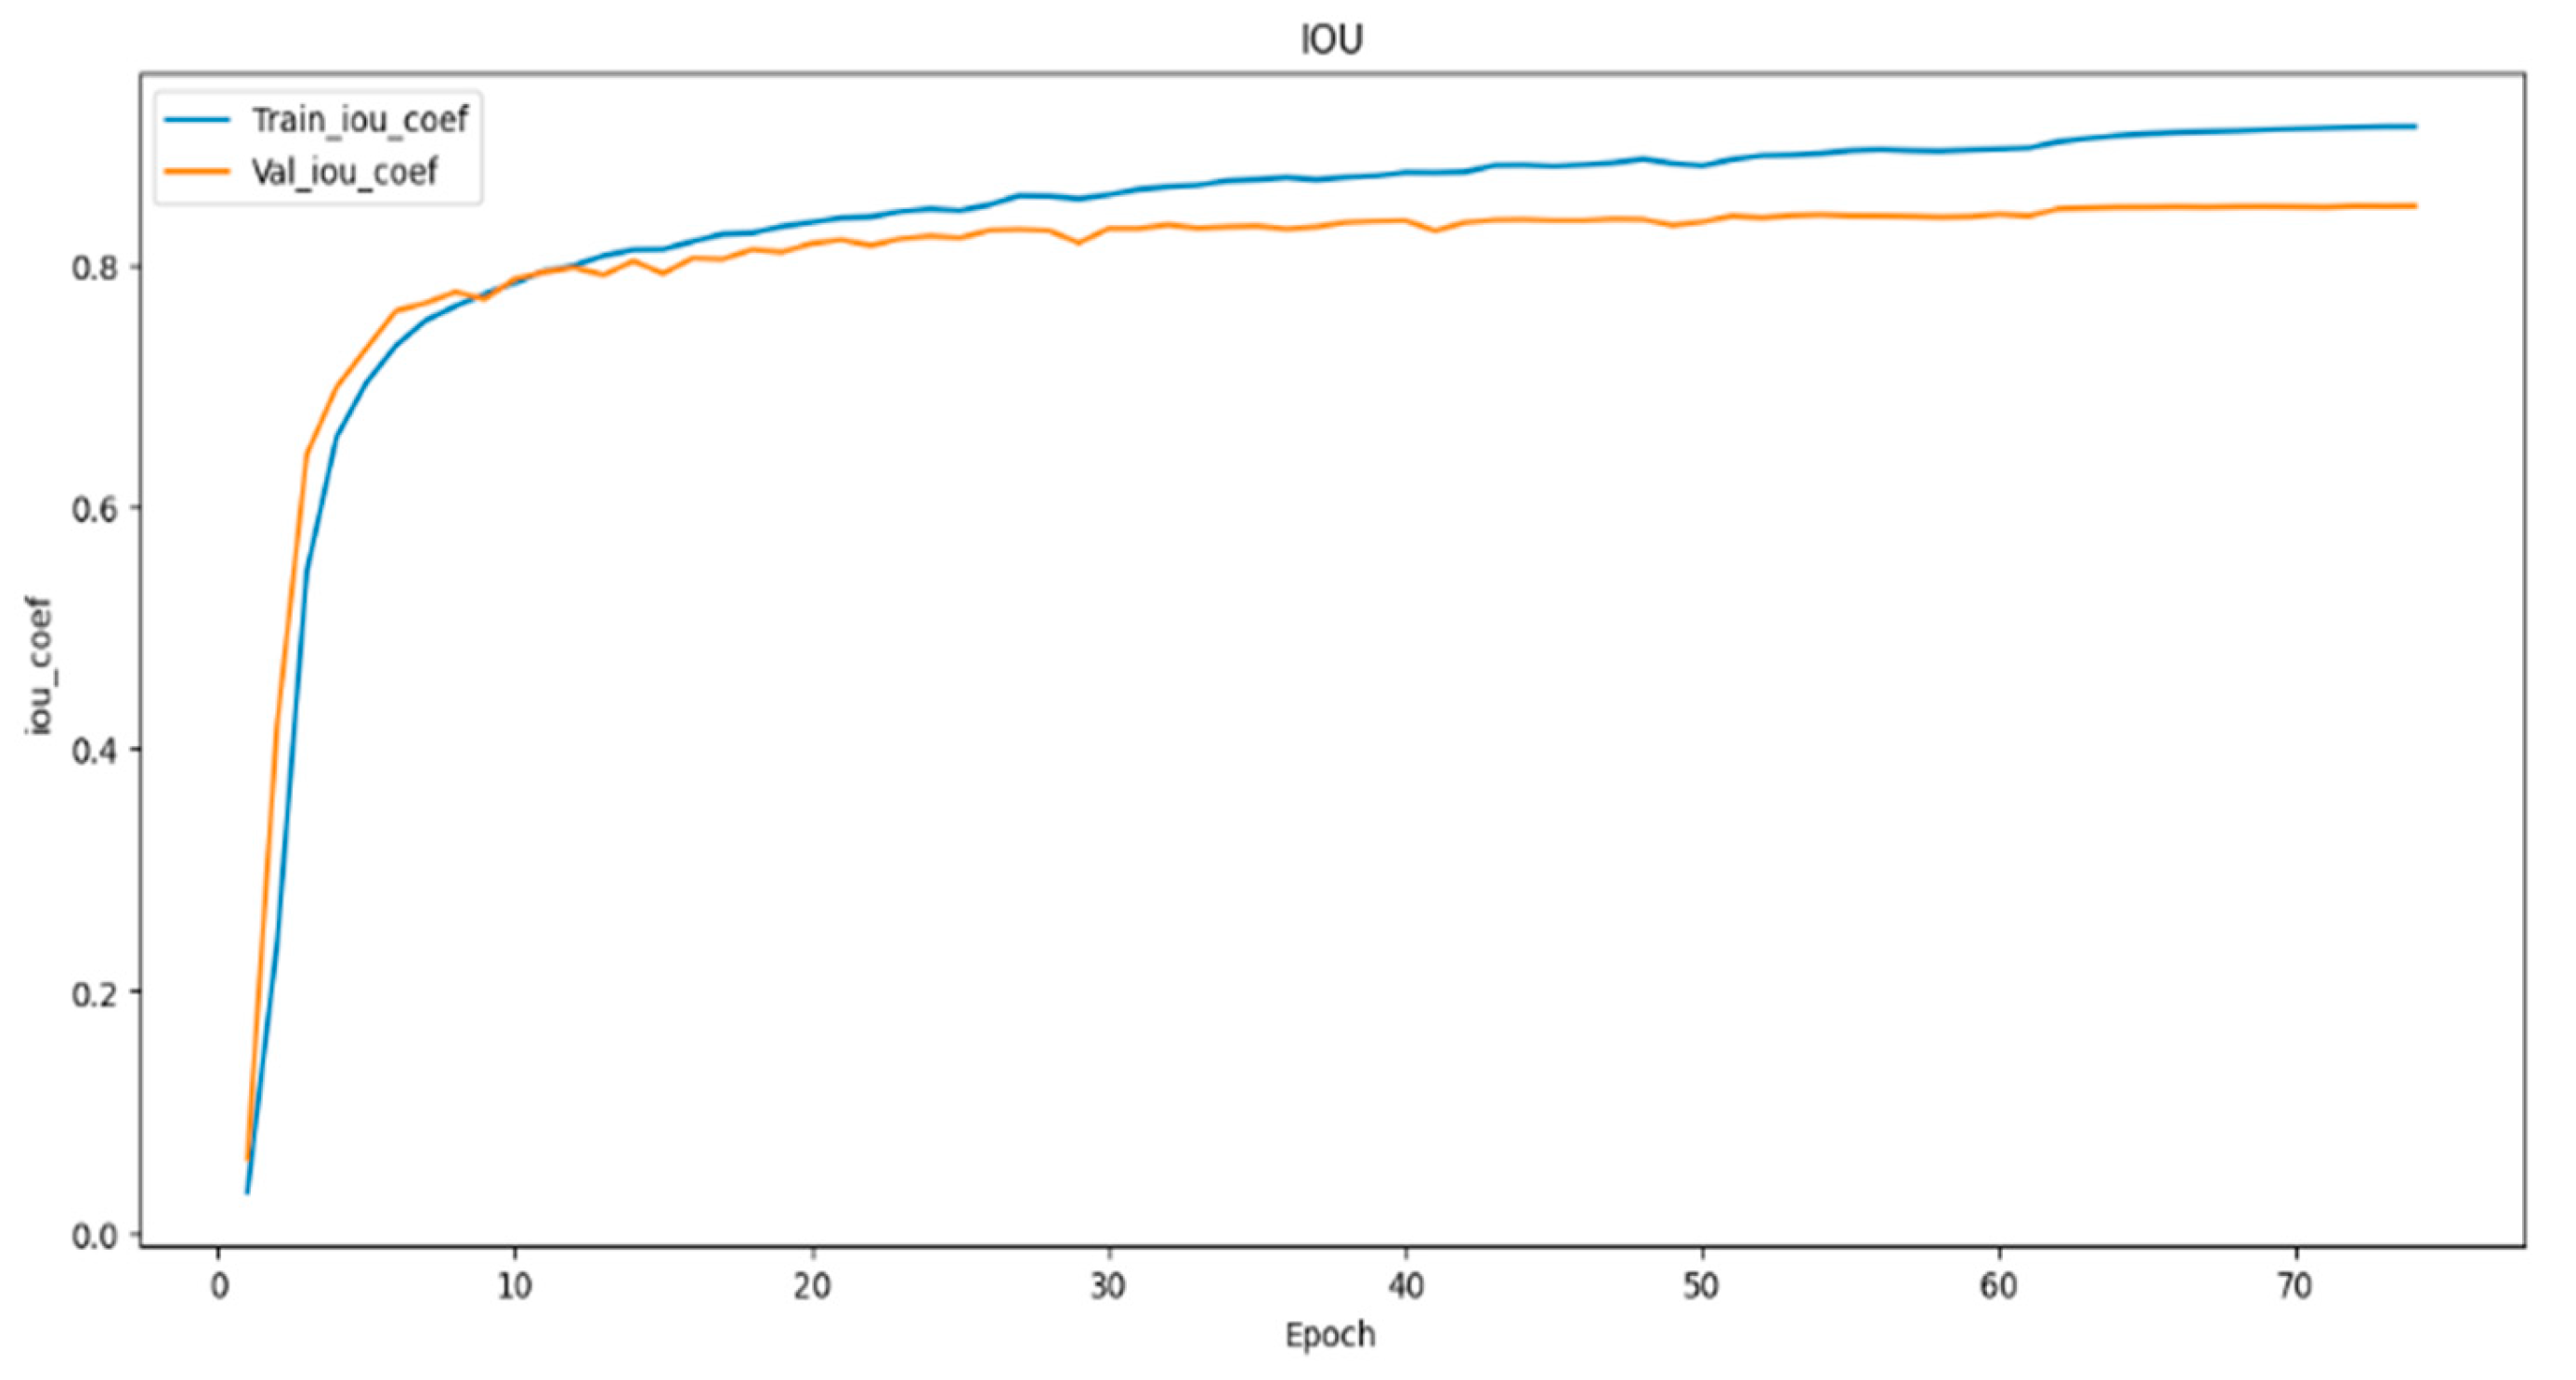
Metrics like the Dice coefficient and Intersection over Union (IOU) were used to assess the segmentation model. Three distinct models were compared, namely U-Net, ResNet-34, and ECA-Net. The U-Net model achieved a Dice coefficient of 87.55% and an IOU of 79.61%. Researchers incorporated ResNet-34 into the U-Net model to improve its performance. This resulted in a Dice coefficient of 91.92% and an IOU of 89.57%. This enabled the model to capture and represent more intricate features, producing superior segmentation outcomes. Maximum optimal performance was achieved by ResNet-34, ECA-Net (c), and the U-Net model with optimizer Adam with batch size eight and a learning rate of 0.0001. This model had an impressive Dice coefficient of 96.27% and an IOU of 91.48%, resulting in the highest accuracy among the three compared models.
Figure 7 visually illustrates the comparison of the three models, effectively showcasing the performance enhancement achieved through the incorporation of ResNet-34 and ECA-Net. The graph or visualization presented in
Figure 7 serves to demonstrate the gradual increment in model performance with each modification, ultimately resulting in the most outstanding performance with the combination of U-Net, ResNet-34 and ECA-Net.
4.1. Result
From
Table 1, we can observe the performance of four different models, i.e., EfficientNet-B0, EfficientNet-B1, ResNet-34, and EfficientNet-B2, evaluated on the basis of four different metrics - Dice, IoU, Valid dice and Valid IoU. The accuracy of the model’s picture segmentation is shown by the Dice and IoU scores. The Valid dice and Valid IoU scores show how well the model performed on the validation set, or the data that it was not exposed to during training. Looking at the Dice and IoU scores, we can see that ResNet-34 with ECA-Net outperforms all the other models with the highest scores of 96.27% and 91.48% respectively. ResNet-34 comes second with 91.92% and 89.57% Dice and IoU scores, respectively. EfficientNet-B1 comes second with 91.86% and 88.60% Dice and IoU scores, respectively. EfficientNet-B2 and EfficientNet-B0 have comparable scores, with EfficientNet-B2 performing slightly better than EfficientNet-B0.
Table 2: Evaluation metrics of PSP-Net model variants with different backbones based on Dice and IoU scores for segmentation accuracy assessment. The segmentation accuracy of PSP-Net models with different backbones is evaluated using Dice and IoU scores, which are presented in
Table 2. The results indicate that ResNet-18 achieves the highest Dice and IoU scores with 92.25% and 93.15%, respectively, followed by ResNet-34 with 89.75% and 90.78%. EfficientNet- B1 and EfficientNet-B2 exhibit lower Dice and IoU scores with 88.57% and 87.12%, and 89.84% and 89.96%, respectively. These findings suggest that the choice of backbone architecture can significantly impact the segmentation accu- racy of PSP-Net models.
Upon consideration of the evaluation metrics, ResNet-34 emerges as the superior model for the image segmentation task at hand [
25]. Nevertheless, it is important to take into account additional factors, such as computational resources and model complexity, before making a final decision. Overall, our study emphasizes the significance of carefully selecting CNN architectures that are most suitable for particular image segmentation tasks in order to attain optimal performance.
In
Table 3 presents a comprehensive comparative analysis of segmentation models, including U-Net+EfficientNet-B1, LeViT with U-Net++, Small U-Net-B2, and U-Net, along with our proposed model, ResECA-U-Net. The evaluation of these models’ performance relies on the adoption of widely accepted metrics, namely the Dice coefficient and Intersection over Union (IoU) score, which are extensively recognized for their effectiveness in quantifying segmentation accuracy. Our proposed model, ResECA-U-Net, demonstrates superior performance in terms of both the Dice coefficient and IoU score. It achieves a Dice coefficient of 96.27% and an IoU score of 91.47%, outperforming U-Net with EfficientNet-B1 (Dice: 91.30%, IoU: 88.60%) LeViT+U-Net++ (Dice: 79.50%, IoU: 72.80%), Small U-Net-B2 (Dice: 83.14%, IoU: 79.61%), and U-Net (Dice: 88.54%, IoU: 88.19%).
Table 4 presented segmentation models, including R-CNN, U-Net, ResNet34 - U-Net, Light Weight U-Net, Unet2.5D, PSPNet with ResNet34, and a standalone U-Net, were applied to diverse medical imaging datasets, such as UW-Madison GI Tract Image Segmentation and UW-Madison Carbone Cancer Center. Results indicate a progression in segmentation accuracy from basic models to more sophisticated architectures. Notably, ResECA-U-Net, a proposed model for UW-Madison GI Tract Image Segmentation, outperformed all counterparts with an exceptional Dice score of 96.27% and an IoU score of 91.47%, showcasing the efficacy of incorporating Efficient Channel Attention. This highlights the continuous refinement and innovation in segmentation models, with the ResECA-U-Net emerging as a state-of-the-art solution for accurate medical image segmentation.
4.2. Discussion
The improved performance of our proposed model is attributed to several key factors. Combining U-Net, ResNet-34, and ECA-Net architectures enhances the overall segmentation accuracy. U-Net, renowned for its effectiveness in segmentation tasks, is further empowered by the deep feature extraction capabilities of ResNet-34. This fusion allows our model to leverage the features of ECA-Net, U-Net, and ResNet-34, resulting in improved and effective segmentation accuracy. In terms of both the Dice coefficient and IoU score, our proposed model, U-Net with ResNet-34 and ECA-Net, exhibits superior performance compared to the current state-of-the-art segmentation models. The fusion of U-Net, ResNet-34, and ECA-Net architectures, along with the utilization of residual connections and deep feature extraction capabilities, significantly improves the accuracy of our model. These findings highlight the potential of our proposed model in advancing medical image segmentation, providing valuable insights and support for clinical decision-making.
In (
Figure 8,
Figure 9 and
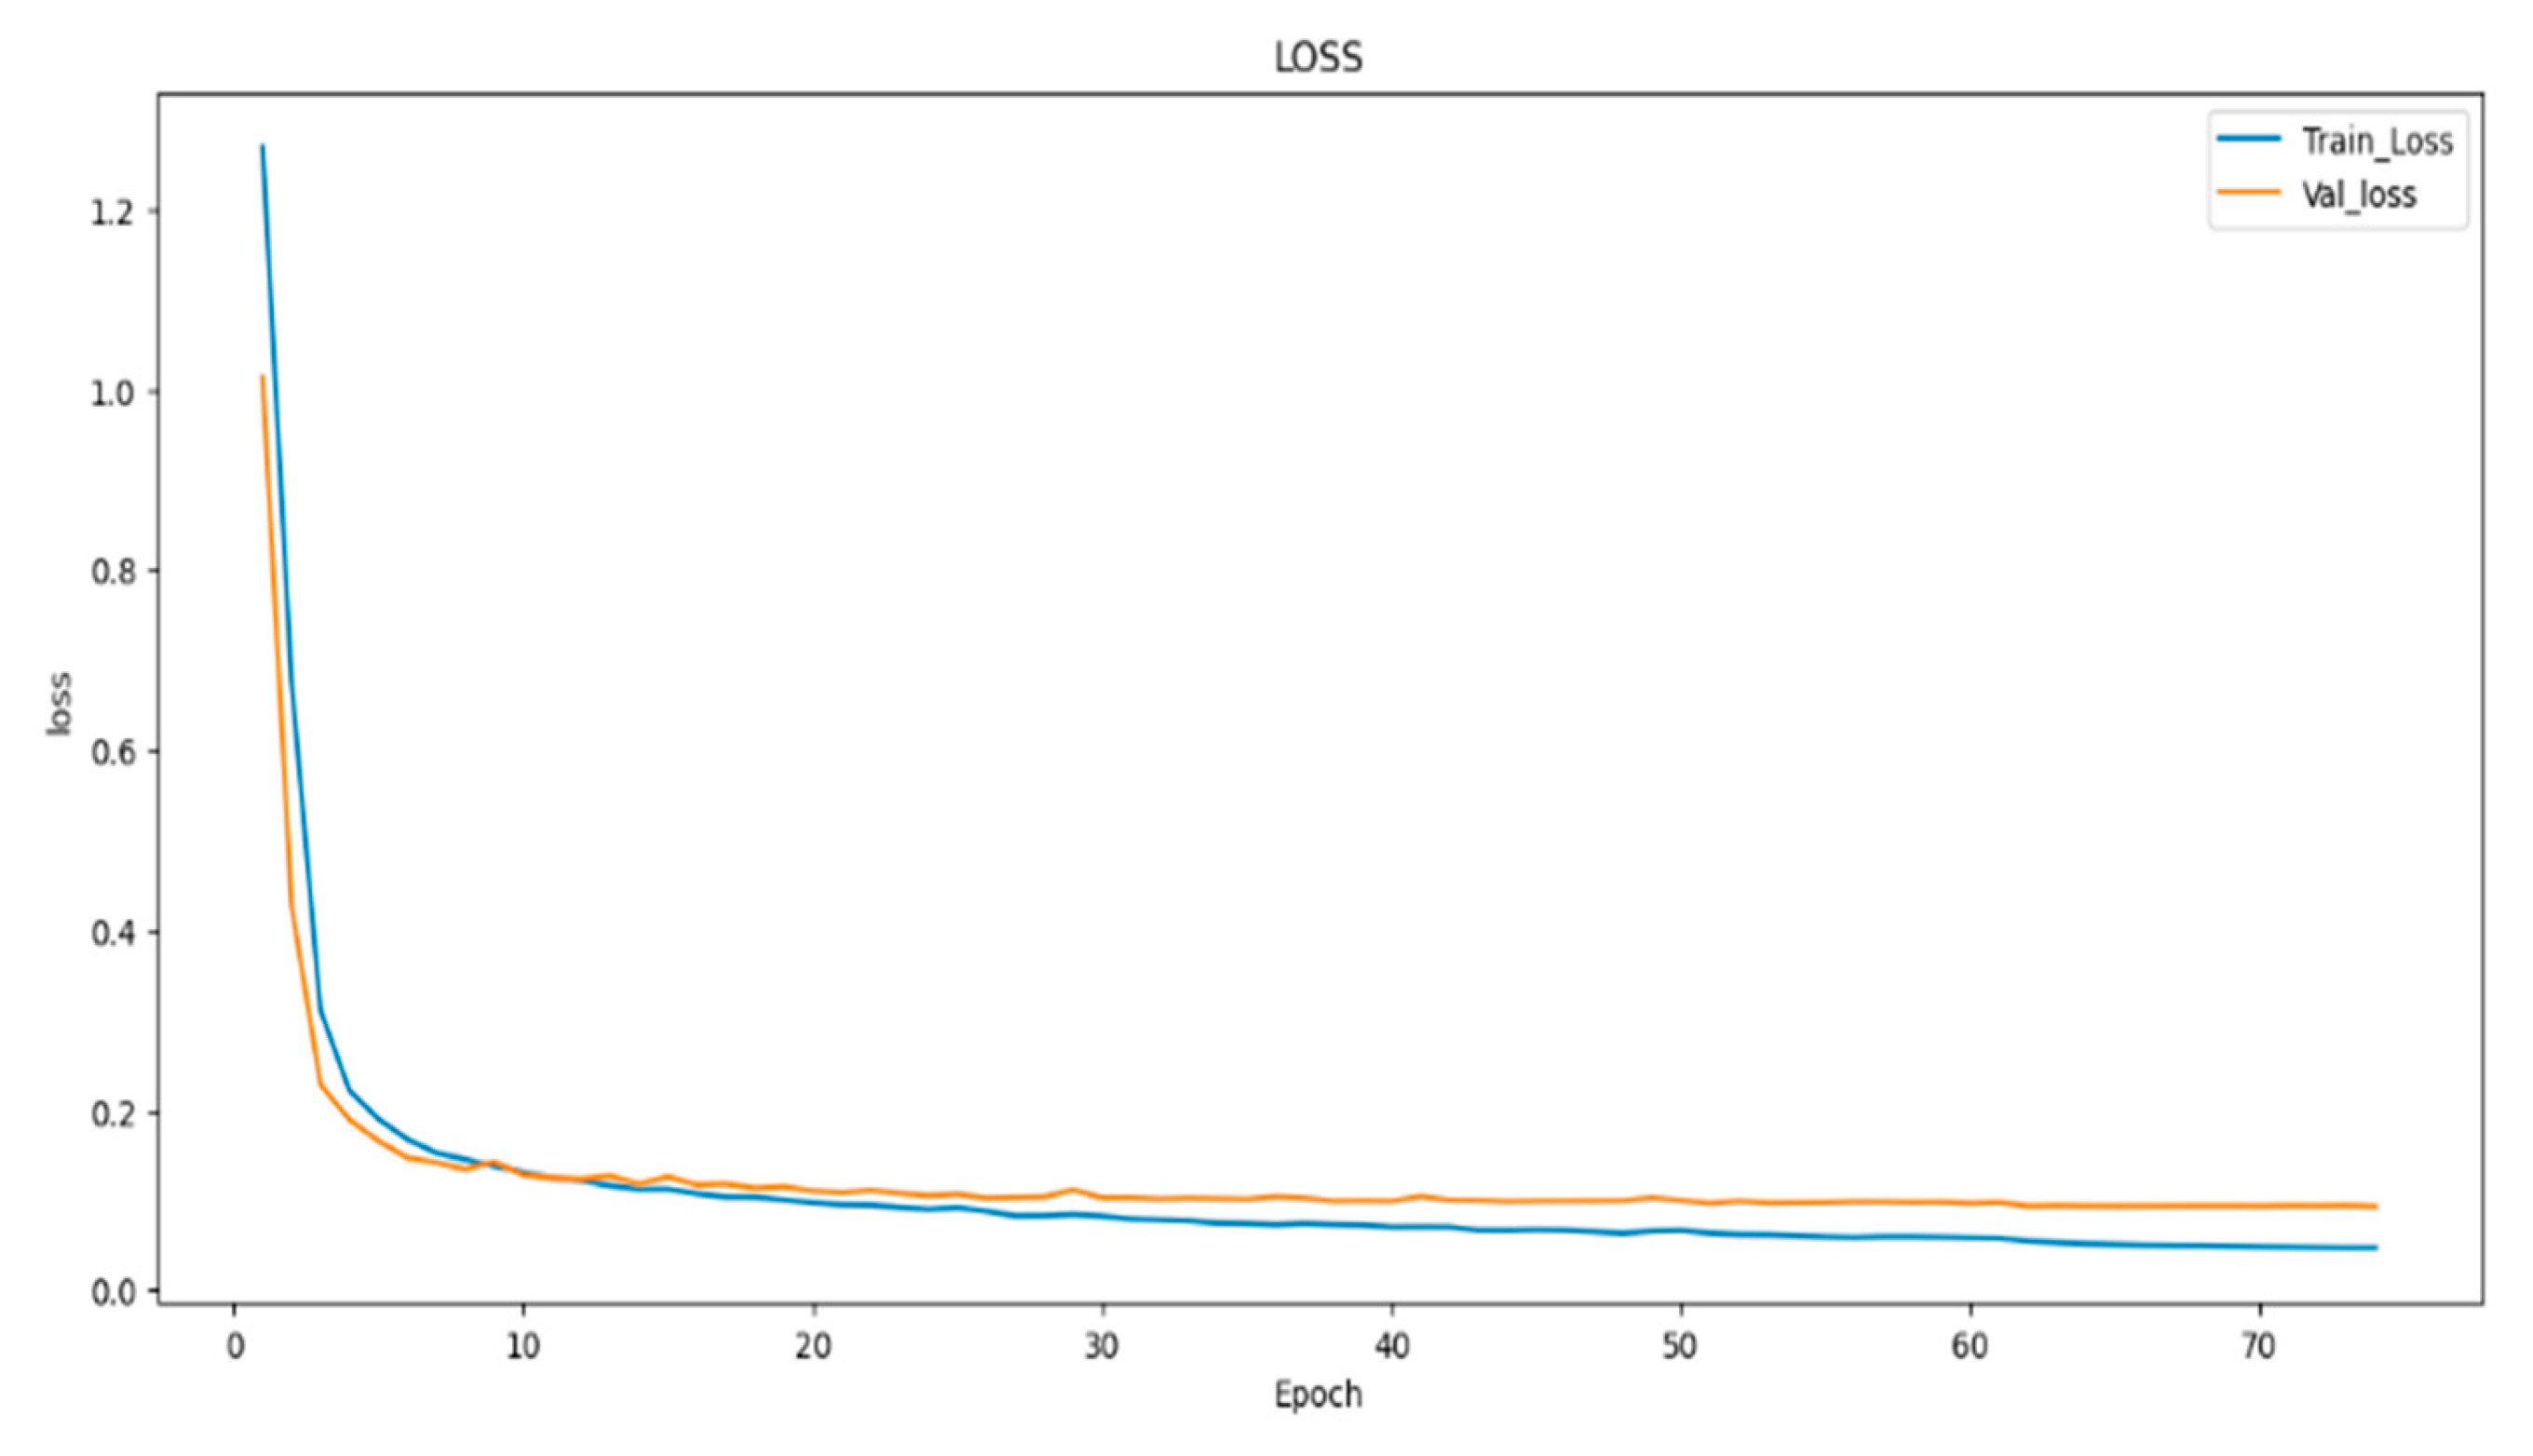
Figure 10) visualizes the training and validation loss, as well as the IoU and Dice coefficients, during the training of our model. The goal of this visualization is to provide insight into the performance of the model during training, which can help researchers diagnose any problems with the model architecture or training process. The history object contains the training and validation loss, as well as the IoU and Dice coefficients, for each epoch of the training process. These metrics are plotted using the matplotlib function, with the training metrics represented as blue dots and the validation metrics represented as a red line. This code generates a figure with three subplots, each of which represents one of the metrics being plotted. The first subplot displays the training and validation loss, with the epoch number on the X-axis and the loss value on the Y-axis. The training and validation IoU coefficients are shown in the second subplot, while the training and validation Dice coefficients are displayed in the third subplot. In (
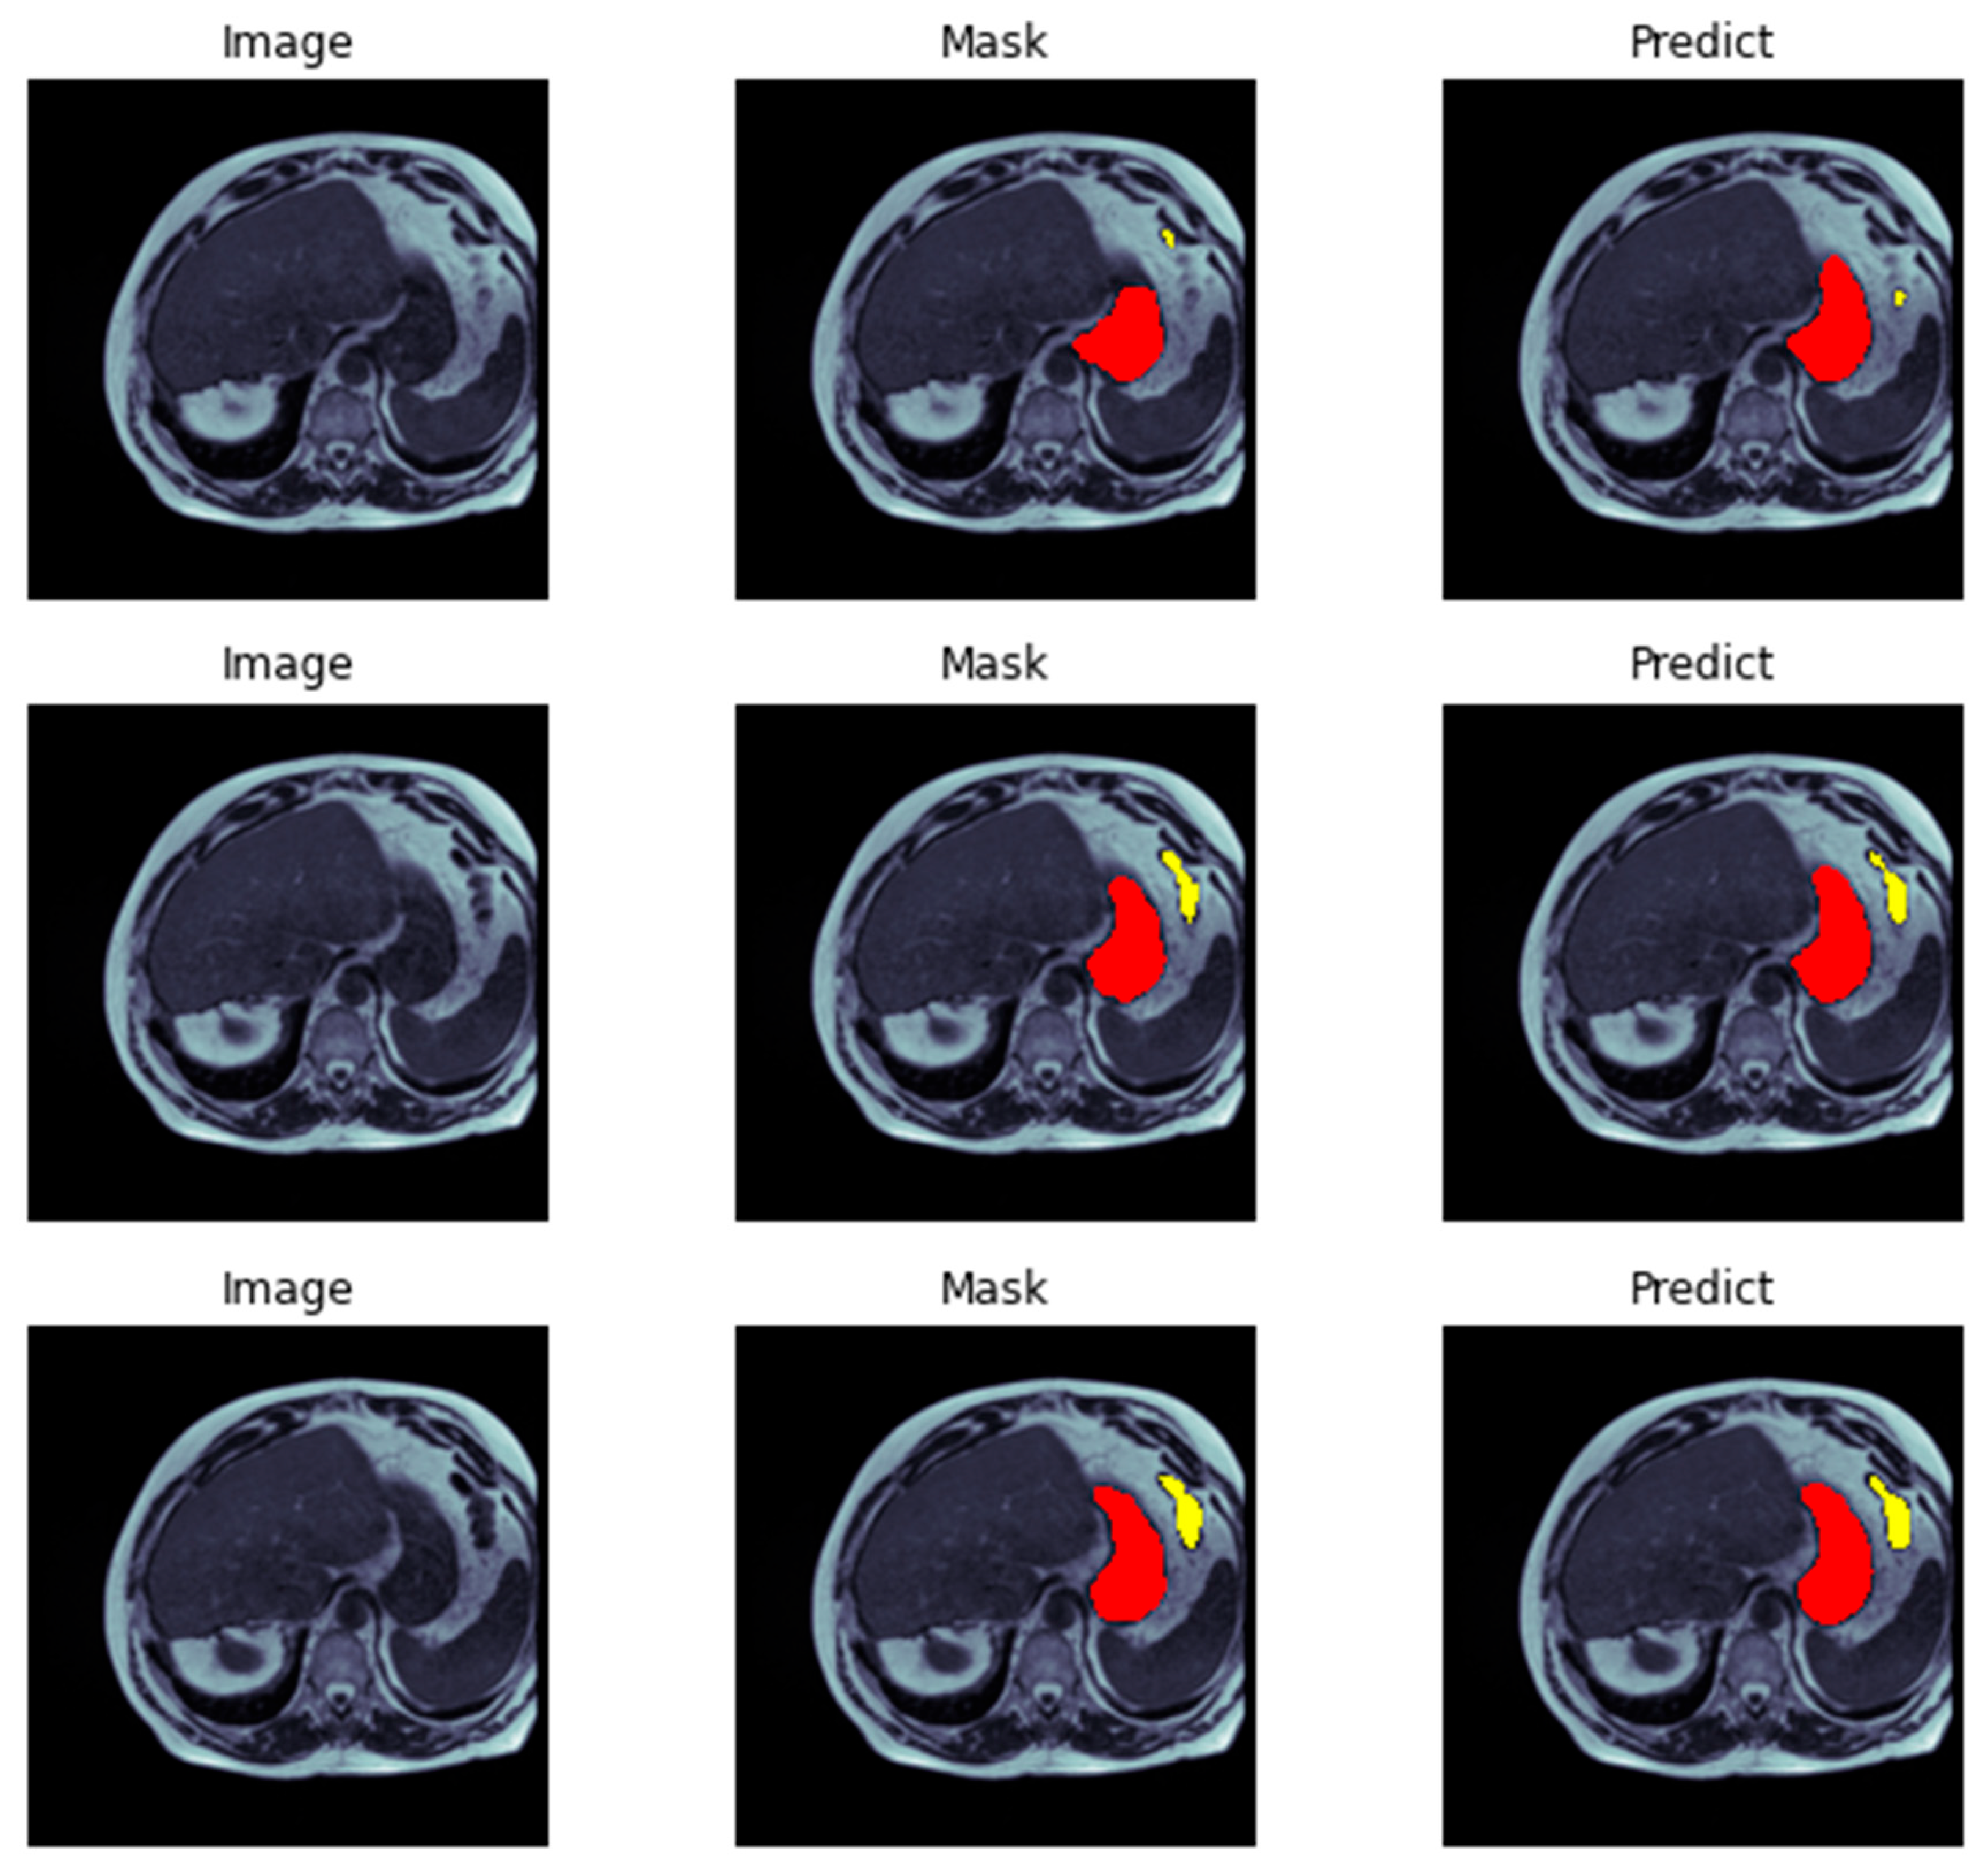
Figure 11) we demonstrate the evaluation of a neural network model on a test dataset consisting of image-mask pairs. Specifically, we evaluate the performance of a segmentation model that produces a binary mask indicating the presence or absence of an object in the image. First, we load a batch of image-mask pairs using a DataLoader object. Next, we pass the images through the segmentation model to obtain a set of logits, which are then converted to binary predictions using a threshold of 0.5. We then visualize the results of the segmentation on a sample of three images, showing the original image and the predicted mask side by side.
Finally, we display the images using Matplotlib, demonstrating the efficacy of the segmentation model in accurately identifying object presence in the test dataset. Presenting segmentation masks of ensembles consisting of models (
Figure 8 and
Figure 9) showcases qualitative results that compare the standard ensemble approach with our DiPE strategy, which is found to yield superior segmentation masks compared to the baseline approach. A medical evaluation of our method against the ground-truth segmentation produced by radiology specialists reveals only minimal variations, including a notable alignment of our method’s segmentation of the stomach with the ground-truth segmentation, surpassing the baseline method. Demonstrating DiPE’s proficiency, the first two rows exhibit greater accuracy in identifying and distinguishing between the stomach and the transverse colon than the baseline strategy, resulting in a result closely resembling the radiologists’ annotations. While both techniques effectively detect the stomach region, our technique has a slight advantage. With exceptional proficiency, our DiPE strategy identifies tissues surrounded by substantial amounts of fat, as observed in the lower images, particularly the small bowel and mesentery. Our ability to differentiate between the small bowel and colon is almost flawless, nearly achieving a one-to-one match with the ground truth. Furthermore, the fourth row of images exemplifies the technique’s capability to correctly identify the loop of the small bowel on the patient’s right (or left) without mistaking it for gastric structures. Ultimately, while our new method delivers markedly superior results than the baseline approach, we recognize that additional improvements are necessary to match the precision of a human observer.
5. Conclusion
In conclusion, our research leveraged deep learning techniques to autonomously delineate the stomach and intestines within gastrointestinal (GI) tract images, employing the U-Net model complemented by ResNet-34 and ECA procedures. The proposed methodology exhibited a commendable segmentation accuracy of 96.27%. The significance of this achievement is particularly pronounced in the context of radiation therapy, where precise organ segmentation is pivotal for ensuring the protection of vital structures, facilitating beam direction adjustments, reducing treatment durations, and enhancing overall patient comfort. Throughout the study, we diligently considered the intricacies of the U-Net model, contemplating current designs and making pertinent adjustments to optimize its performance. Our approach involved meticulous data pre-processing on the extensive annotated dataset comprising 115,488 samples. Techniques such as encoding, decoding, scaling, and normalization were systematically applied to enhance the model’s capacity for accurate segmentation. The techniques section provides a comprehensive overview of the U-Net architecture, delving into intricate details such as backbone modifications involving ResNet-34, EfficientNet-B0, and EfficientNet-B1. Incorporating downsampling and upsampling blocks, alongside the careful orchestration of narrowing and expanding routes, further contributed to the robustness of our model. Additionally, integrating the Efficient Channel Attention (ECA-Net) mechanism was pivotal in augmenting overall model performance.
6. Future Work
The segmentation of the stomach and intestines on GI tract images using deep learning has significantly improved since our study’s initial results. There are a few areas, nevertheless, that call for more study and advancement. These include incorporating multi-modal data, investigating transfer learning and pre-training techniques, utilizing clinical data to predict outcomes, enhancing robustness to changes in picture quality, validating the technique on larger and more varied datasets, concentrating on clinical implementation, and developing user interfaces. To further improve treatment planning for GI tract cancer, real-time segmentation, and adaptive radiation therapy should be researched. The outcomes and quality of life of patients will ultimately be enhanced by continued study in these fields, which will also advance the treatment of GI tract cancer and automate medical image segmentation.
Funding
The authors received no specific funding for this work.
Data Availability Statement
The data presented in this study are available in the article.
Conflicts of Interest
The authors declare that there is no conflict of interests regarding the publication of this manuscript. In addition, the ethical issues, including plagiarism, informed consent, misconduct, data fabrication and/or falsification, double publication and/or submission, and redundancies have been completely observed by the authors.
References
- Rawla, P.; Barsouk, A. Epidemiology of gastric cancer: global trends, risk factors and prevention. Gastroenterology Review/Przeglad Gastroenterologiczny 2019, 14(1), 26–38. [Google Scholar] [CrossRef] [PubMed]
- Alam MJ, Zaman S, Shill PC, Kar S, Hakim MA. Automated Gastrointestinal Tract Image Segmentation Of Cancer Patient Using LeVit-UNet To Automate Radiotherapy. In: 2023 International Conference on Electrical, Computer and Communication Engineering (ECCE). IEEE; 2023. p. 1–5.
- Jaffray DA, Gospodarowicz MK. Radiation therapy for cancer. Cancer: disease control priorities. 2015;3:239–248.
- Heavey PM, Rowland IR. Gastrointestinal cancer. Best Practice & Research Clinical Gastroenterology. 2004;18(2):323–336.
- Lagendijk JJ, Raaymakers BW, Van Vulpen M. The magnetic resonance imaging–linac system. In: Seminars in radiation oncology. vol. 24. Elsevier; 2014. p. 207–209.
- Chou A, Li W, Roman E. GI Tract Image Segmentation with U-Net and Mask R-CNN.
- Sharma M. Automated GI tract segmentation using deep learning. arXiv preprint arXiv:220611048. 2022.
- Chia B, Gu H, Lui N. Gastro-Intestinal Tract Segmentation Using Multi-Task Learning;
- Khan MA, Khan MA, Ahmed F, Mittal M, Goyal LM, Hemanth DJ, et al. Gastrointestinal diseases segmentation and classification based on duo-deep architectures. Pattern Recognition Letters. 2020;131:193–204.
- Guggari S, Srivastava BC, Kumar V, Harshita H, Farande V, Kulkarni U, et al. RU-Net: A Novel Approach for Gastro-Intestinal Tract Image Segmentation Using Convolutional Neural Network. In: International Conference on Applied Machine Learning and Data Analytics. Springer; 2022. p. 131–141.
- Wang S, Cong Y, Zhu H, Chen X, Qu L, Fan H, et al. Multi-scale context-guided deep network for automated lesion segmentation with endoscopy images of gastrointestinal tract. IEEE Journal of Biomedical and Health Informatics. 2020;25(2):514–525.
- Sharma N, Gupta S, Koundal D, Alyami S, Alshahrani H, Asiri Y, et al. U-Net model with transfer learning model as a backbone for segmentation of gastrointestinal tract. Bioengineering. 2023;10(1):119.
- Holzmann GJ. State compression in SPIN: Recursive indexing and compression training runs. In: Proceedings of third international Spin workshop; 1997.
- Olaf Ronneberger TB Philipp Fischer. U-Net: Convolutional Networks for Biomedical Image Segmentation; 2015. https://arxiv.org/abs/1505.04597.
- Wang Q, Wu B, Zhu P, Li P, Zuo W, Hu Q. ECA-Net: Efficient channel attention for deep convolutional neural networks. In: Proceedings of the IEEE/CVF conference on computer vision and pattern recognition; 2020. p. 11534–11542.
- Bian J, Liu Y. Dual Channel Attention Networks. In: Journal of Physics: Conference Series. vol. 1642. IOP Publishing; 2020. p. 012004.
- Garc’ıa-Pedrajas N, Herv´as-Mart´ınez C, Ortiz-Boyer D. Cooperative coevolution of artificial neural network ensembles for pattern classification. IEEE transactions on evolutionary computation. 2005;9(3):271–302.
- Rusu AA, Rabinowitz NC, Desjardins G, Soyer H, Kirkpatrick J, Kavukcuoglu K, et al. Progressive neural networks. arXiv preprint arXiv:160604671. 2016.
- Kirst C, Skriabine S, Vieites-Prado A, Topilko T, Bertin P, Gerschenfeld G, et al. Mapping the fine-scale organization and plasticity of the brain vasculature. Cell. 2020;180(4):780–795.
- Pacheco M, Oliva GA, Rajbahadur GK, Hassan AE. Is my transaction done yet? An empirical study of transaction processing times in the Ethereum Blockchain Platform. ACM Transactions on Software Engineering and Methodology. 2022.
- Mashhadi PS, Nowaczyk S, Pashami S. Parallel orthogonal deep neural network. Neural Networks. 2021;140:167–183.
- Hu L, Cao J, Xu G, Cao L, Gu Z, Zhu C. Personalized recommendation via cross-domain triadic factorization. In: Proceedings of the 22nd international conference on World Wide Web; 2013. p. 595–606.
- Fern´andez-Mart´ınez F, Luna-Jim´enez C, Kleinlein R, Griol D, Callejas Z, Montero JM. Fine-tuning BERT models for intent recognition using a frequency cut-off strategy for domain-specific vocabulary extension. Applied Sciences. 2022;12(3):1610.
- Georgescu MI, Ionescu RT, Miron AI. Diversity-Promoting Ensemble for Medical Image Segmentation. In: Proceedings of the 38th ACM/SIGAPP Symposium on Applied Computing; 2023. p. 599–606.
- Jiang W, Chen Y, Wen S, Zheng L, Jin H. PDAS: Improving network pruning based on Progressive Differentiable Architecture Search for DNNs. Future Generation Computer Systems. 2023;146:98–113.
- Chou, A., Li, W. and Roman, E., 2022. GI tract image segmentation with U-Net and mask R-CNN. Image Segmentation with U-Net and Mask R-CNN. Available online: http://cs231n. stanford. edu/reports/2022/pdfs/164. pdf (accessed on 4 June 2023).
- Sai, M.J. and Punn, N.S., 2023. LWU-Net approach for Efficient Gastro-Intestinal Tract Image Segmentation in Resource-Constrained Environments. medRxiv, pp.2023-12.
- Guggari, S., Srivastava, B.C., Kumar, V., Harshita, H., Farande, V., Kulkarni, U. and Meena, S.M., 2022, December. RU-Net: A Novel Approach for Gastro-Intestinal Tract Image Segmentation Using Convolutional Neural Network. In International Conference on Applied Machine Learning and Data Analytics (pp. 131-141). Cham: Springer Nature Switzerland.
- Zhou, H., Lou, Y., Xiong, J., Wang, Y. and Liu, Y., 2023. Improvement of Deep Learning Model for Gastrointestinal Tract Segmentation Surgery. Frontiers in Computing and Intelligent Systems, 6(1), pp.103-106.
- Sharma, N., Gupta, S., Rajab, A., Elmagzoub, M.A., Rajab, K. and Shaikh, A., 2023. Semantic Segmentation of Gastrointestinal Tract in MRI Scans Using PSPNet Model With ResNet34 Feature Encoding Network. IEEE Access, 11, pp.132532-132543.
- Sharma, N., Gupta, S., Koundal, D., Alyami, S., Alshahrani, H., Asiri, Y. and Shaikh, A., 2023. U-Net model with transfer learning model as a backbone for segmentation of gastrointestinal tract. Bioengineering, 10(1), p.119.
- Zhou, H., Lou, Y., Xiong, J., Wang, Y. and Liu, Y., 2023. Improvement of Deep Learning Model for Gastrointestinal Tract Segmentation Surgery. Frontiers in Computing and Intelligent Systems, 6(1), pp.103-106.
- Zhou, H., Lou, Y., Xiong, J., Wang, Y. and Liu, Y., 2023. Improvement of Deep Learning Model for Gastrointestinal Tract Segmentation Surgery. Frontiers in Computing and Intelligent Systems, 6(1), pp.103-106.
- Elgayar, S.M., Hamad, S. and El-Horbaty, E.S.M., 2023. Revolutionizing Medical Imaging through Deep Learning Techniques: An Overview. International Journal of Intelligent Computing and Information Sciences, 23(3), pp.59-72.
- Zhang, C., Xu, J., Tang, R., Yang, J., Wang, W., Yu, X. and Shi, S., 2023. Novel research and future prospects of artificial intelligence in cancer diagnosis and treatment. Journal of Hematology & Oncology, 16(1), p.114.
|
Disclaimer/Publisher’s Note: The statements, opinions and data contained in all publications are solely those of the individual author(s) and contributor(s) and not of MDPI and/or the editor(s). MDPI and/or the editor(s) disclaim responsibility for any injury to people or property resulting from any ideas, methods, instructions or products referred to in the content. |
© 2024 by the authors. Licensee MDPI, Basel, Switzerland. This article is an open access article distributed under the terms and conditions of the Creative Commons Attribution (CC BY) license (http://creativecommons.org/licenses/by/4.0/).

