Submitted:
29 March 2024
Posted:
29 March 2024
You are already at the latest version
Abstract
Keywords:
1. Introduction
2. Materials and Methods
3. Relevant Literature and Provisional Conceptual Framework
3.1. Digitalisation and Data Analytics
3.2. Procurement
3.3. Relevant Models and Frameworks
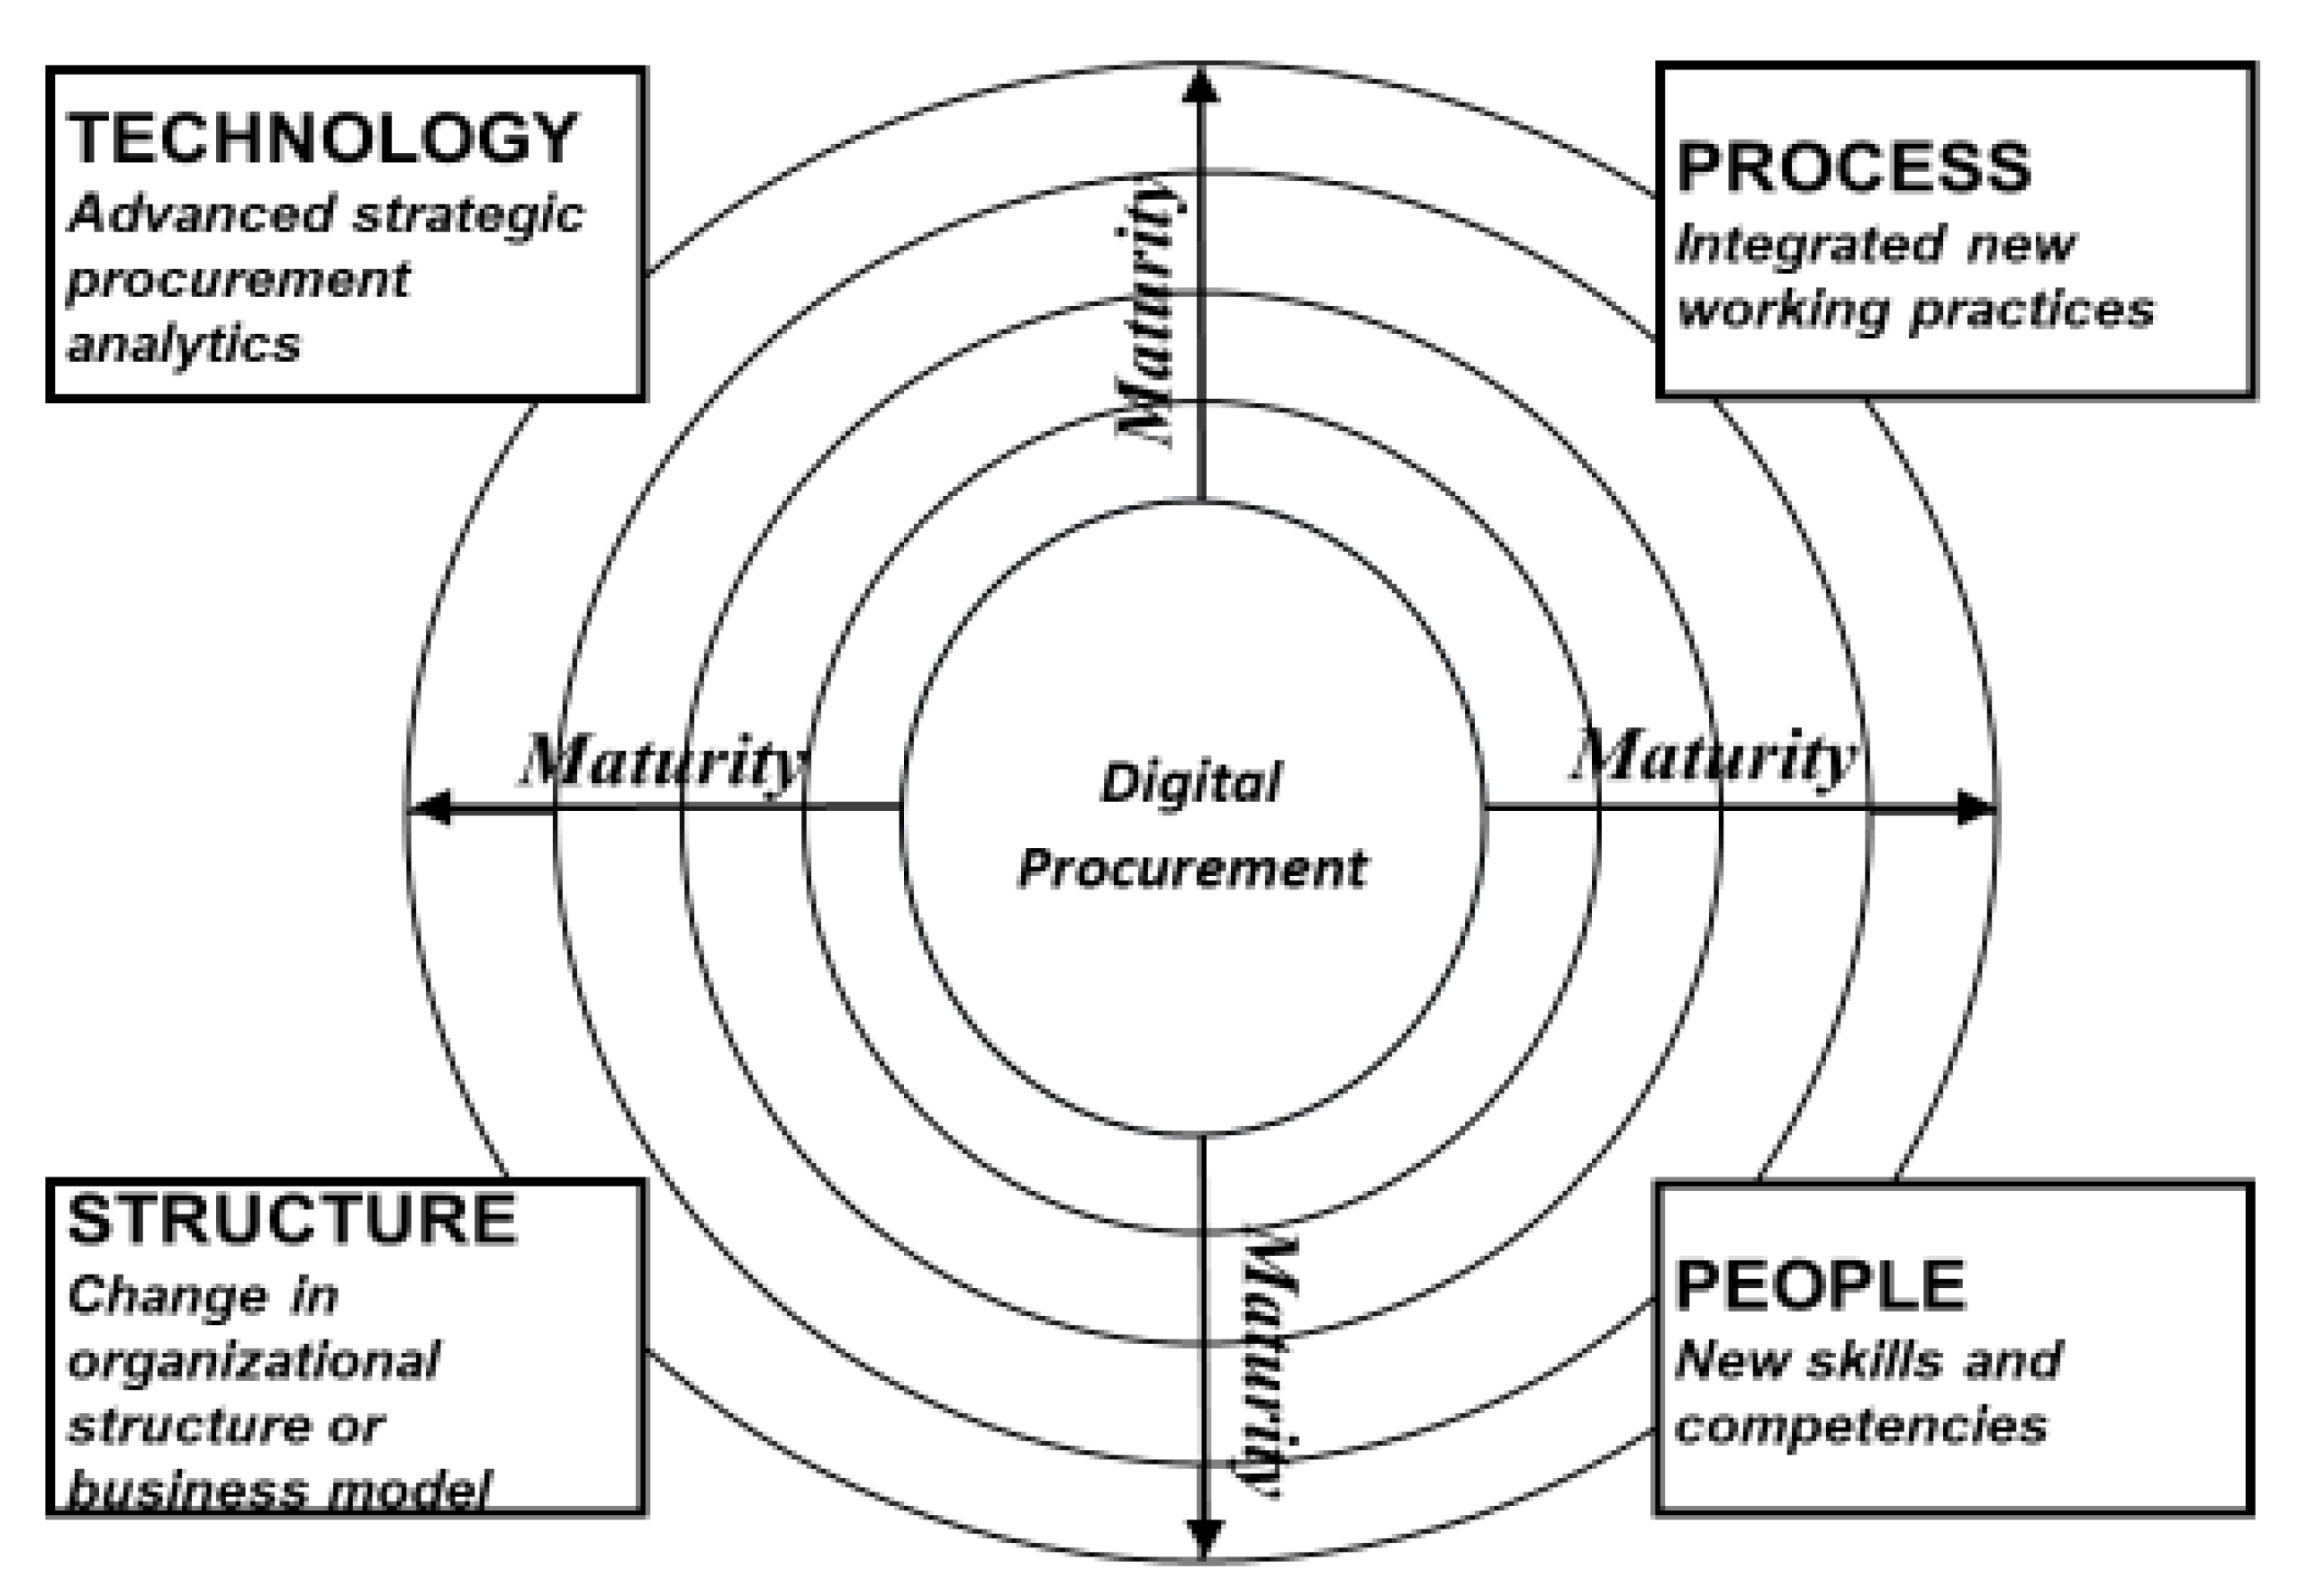
3.4. Provisional Conceptual Framework
4. Results and Discussion
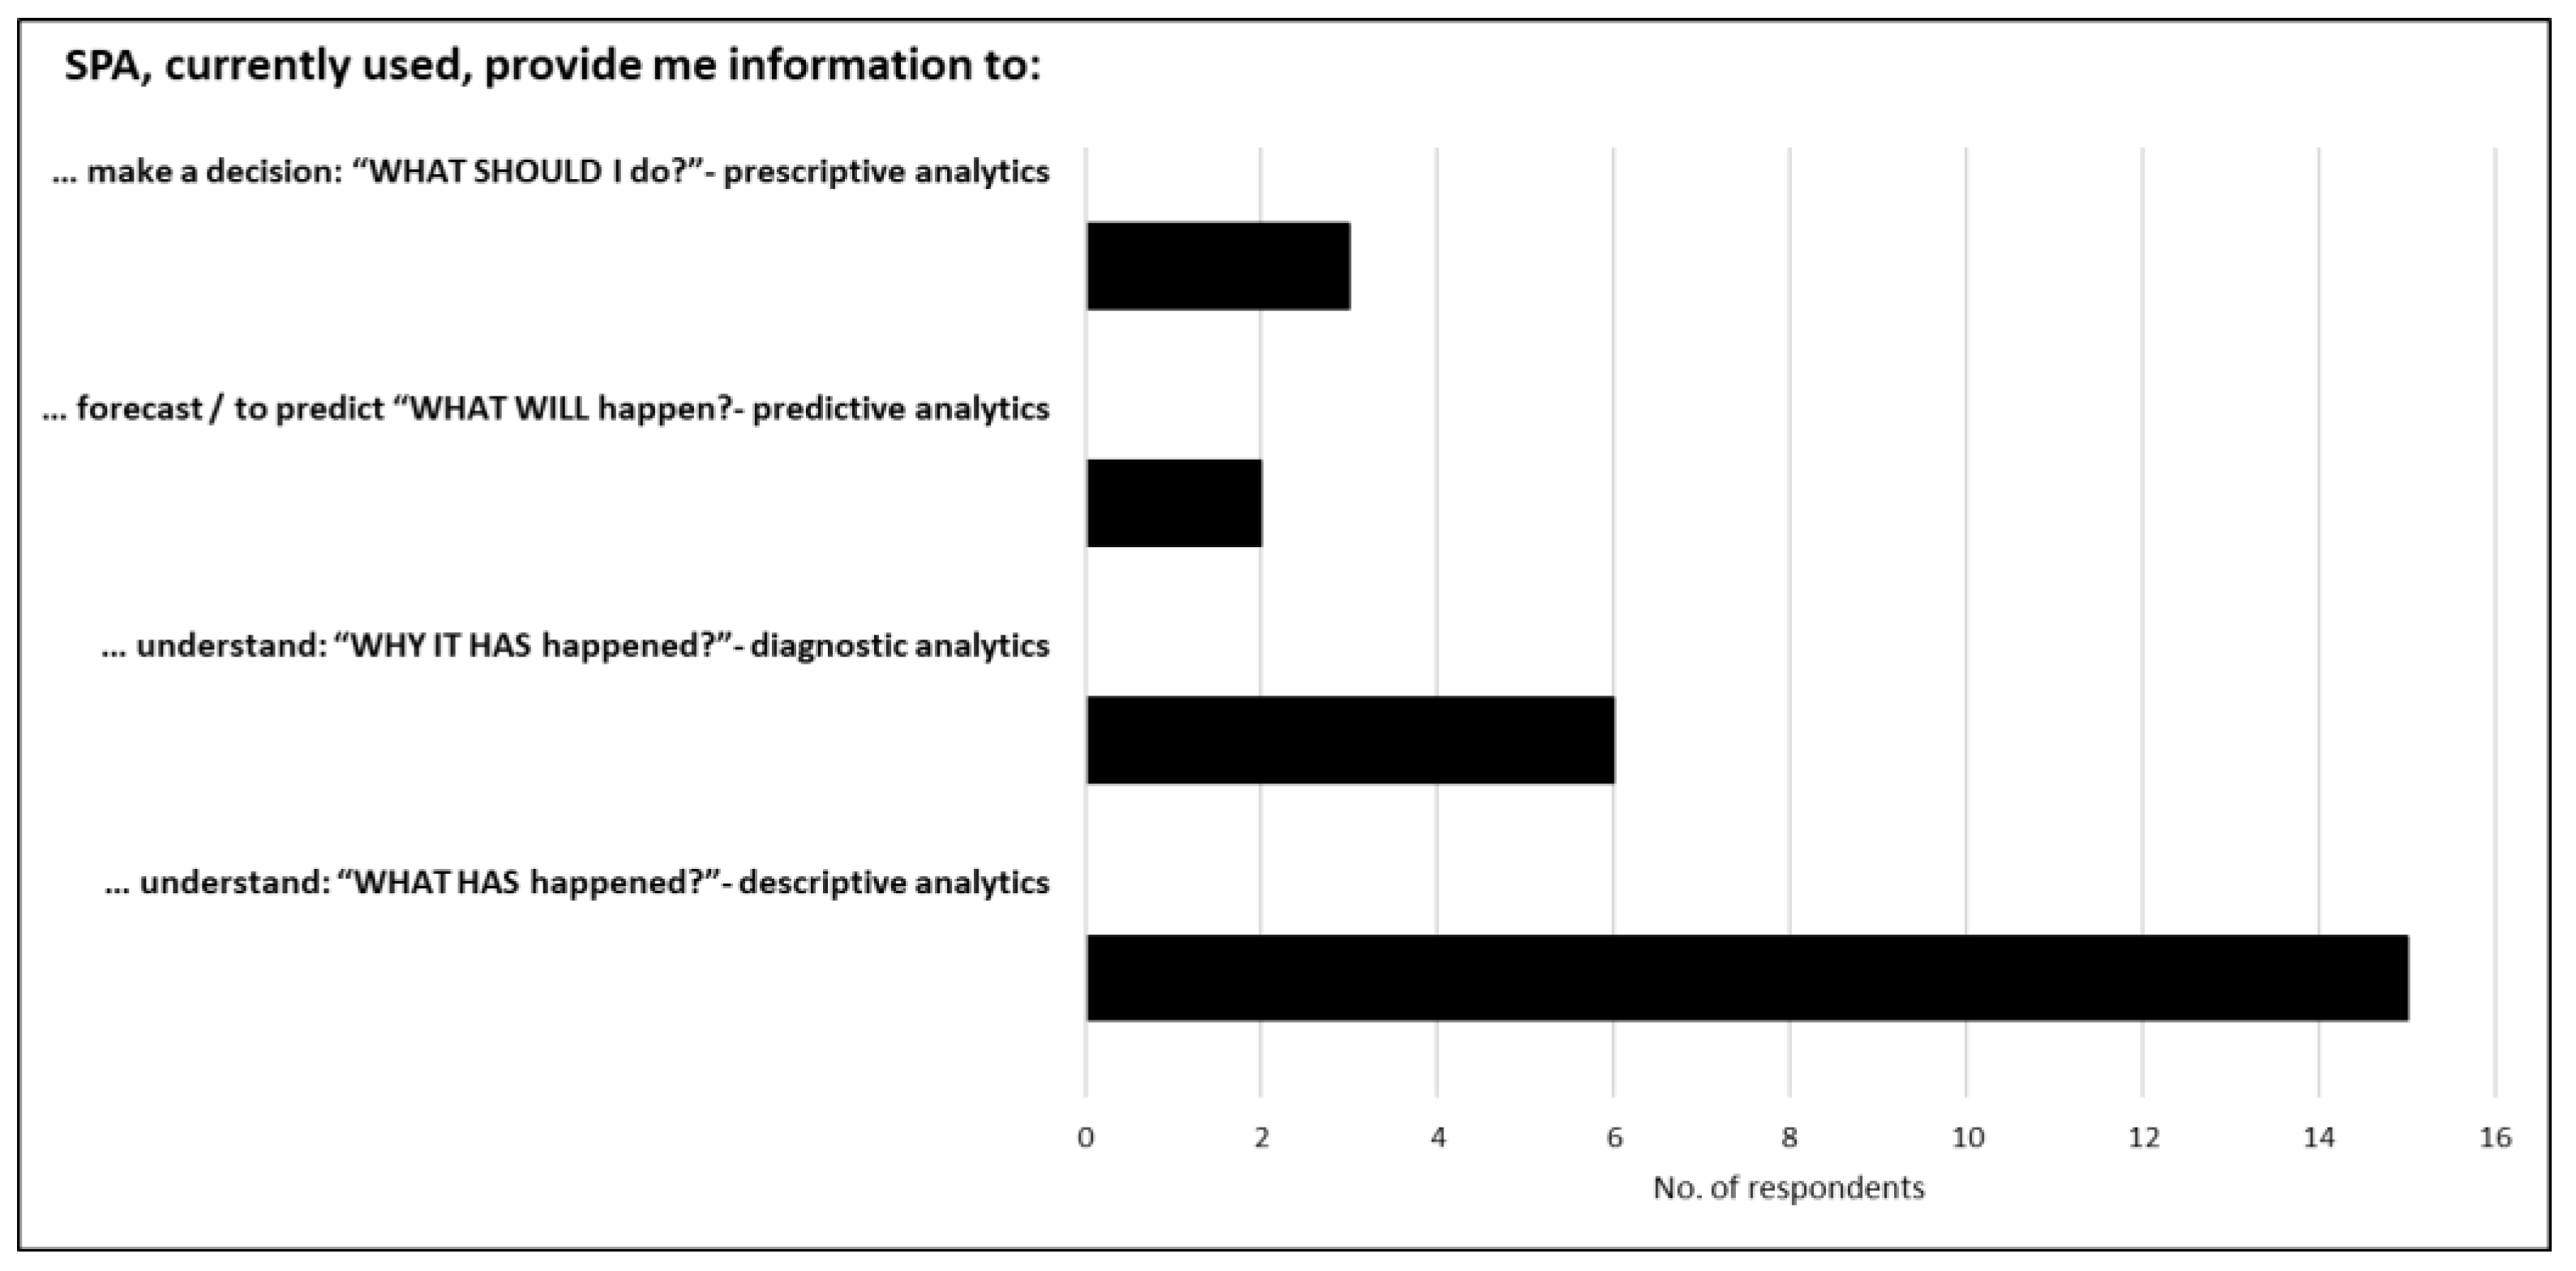
4.1. RQ1. How Are SPA Being Used, Focusing on the Type of Applications Deployed and Their Op-Erational Implications?
4.2. RQ2. Can a New Maturity Model Be Developed and Validated to Assess the Deployment of SPA in the Aviation Industry?
5. Conclusions
Author Contributions
Funding
Data Availability Statement
Conflicts of Interest
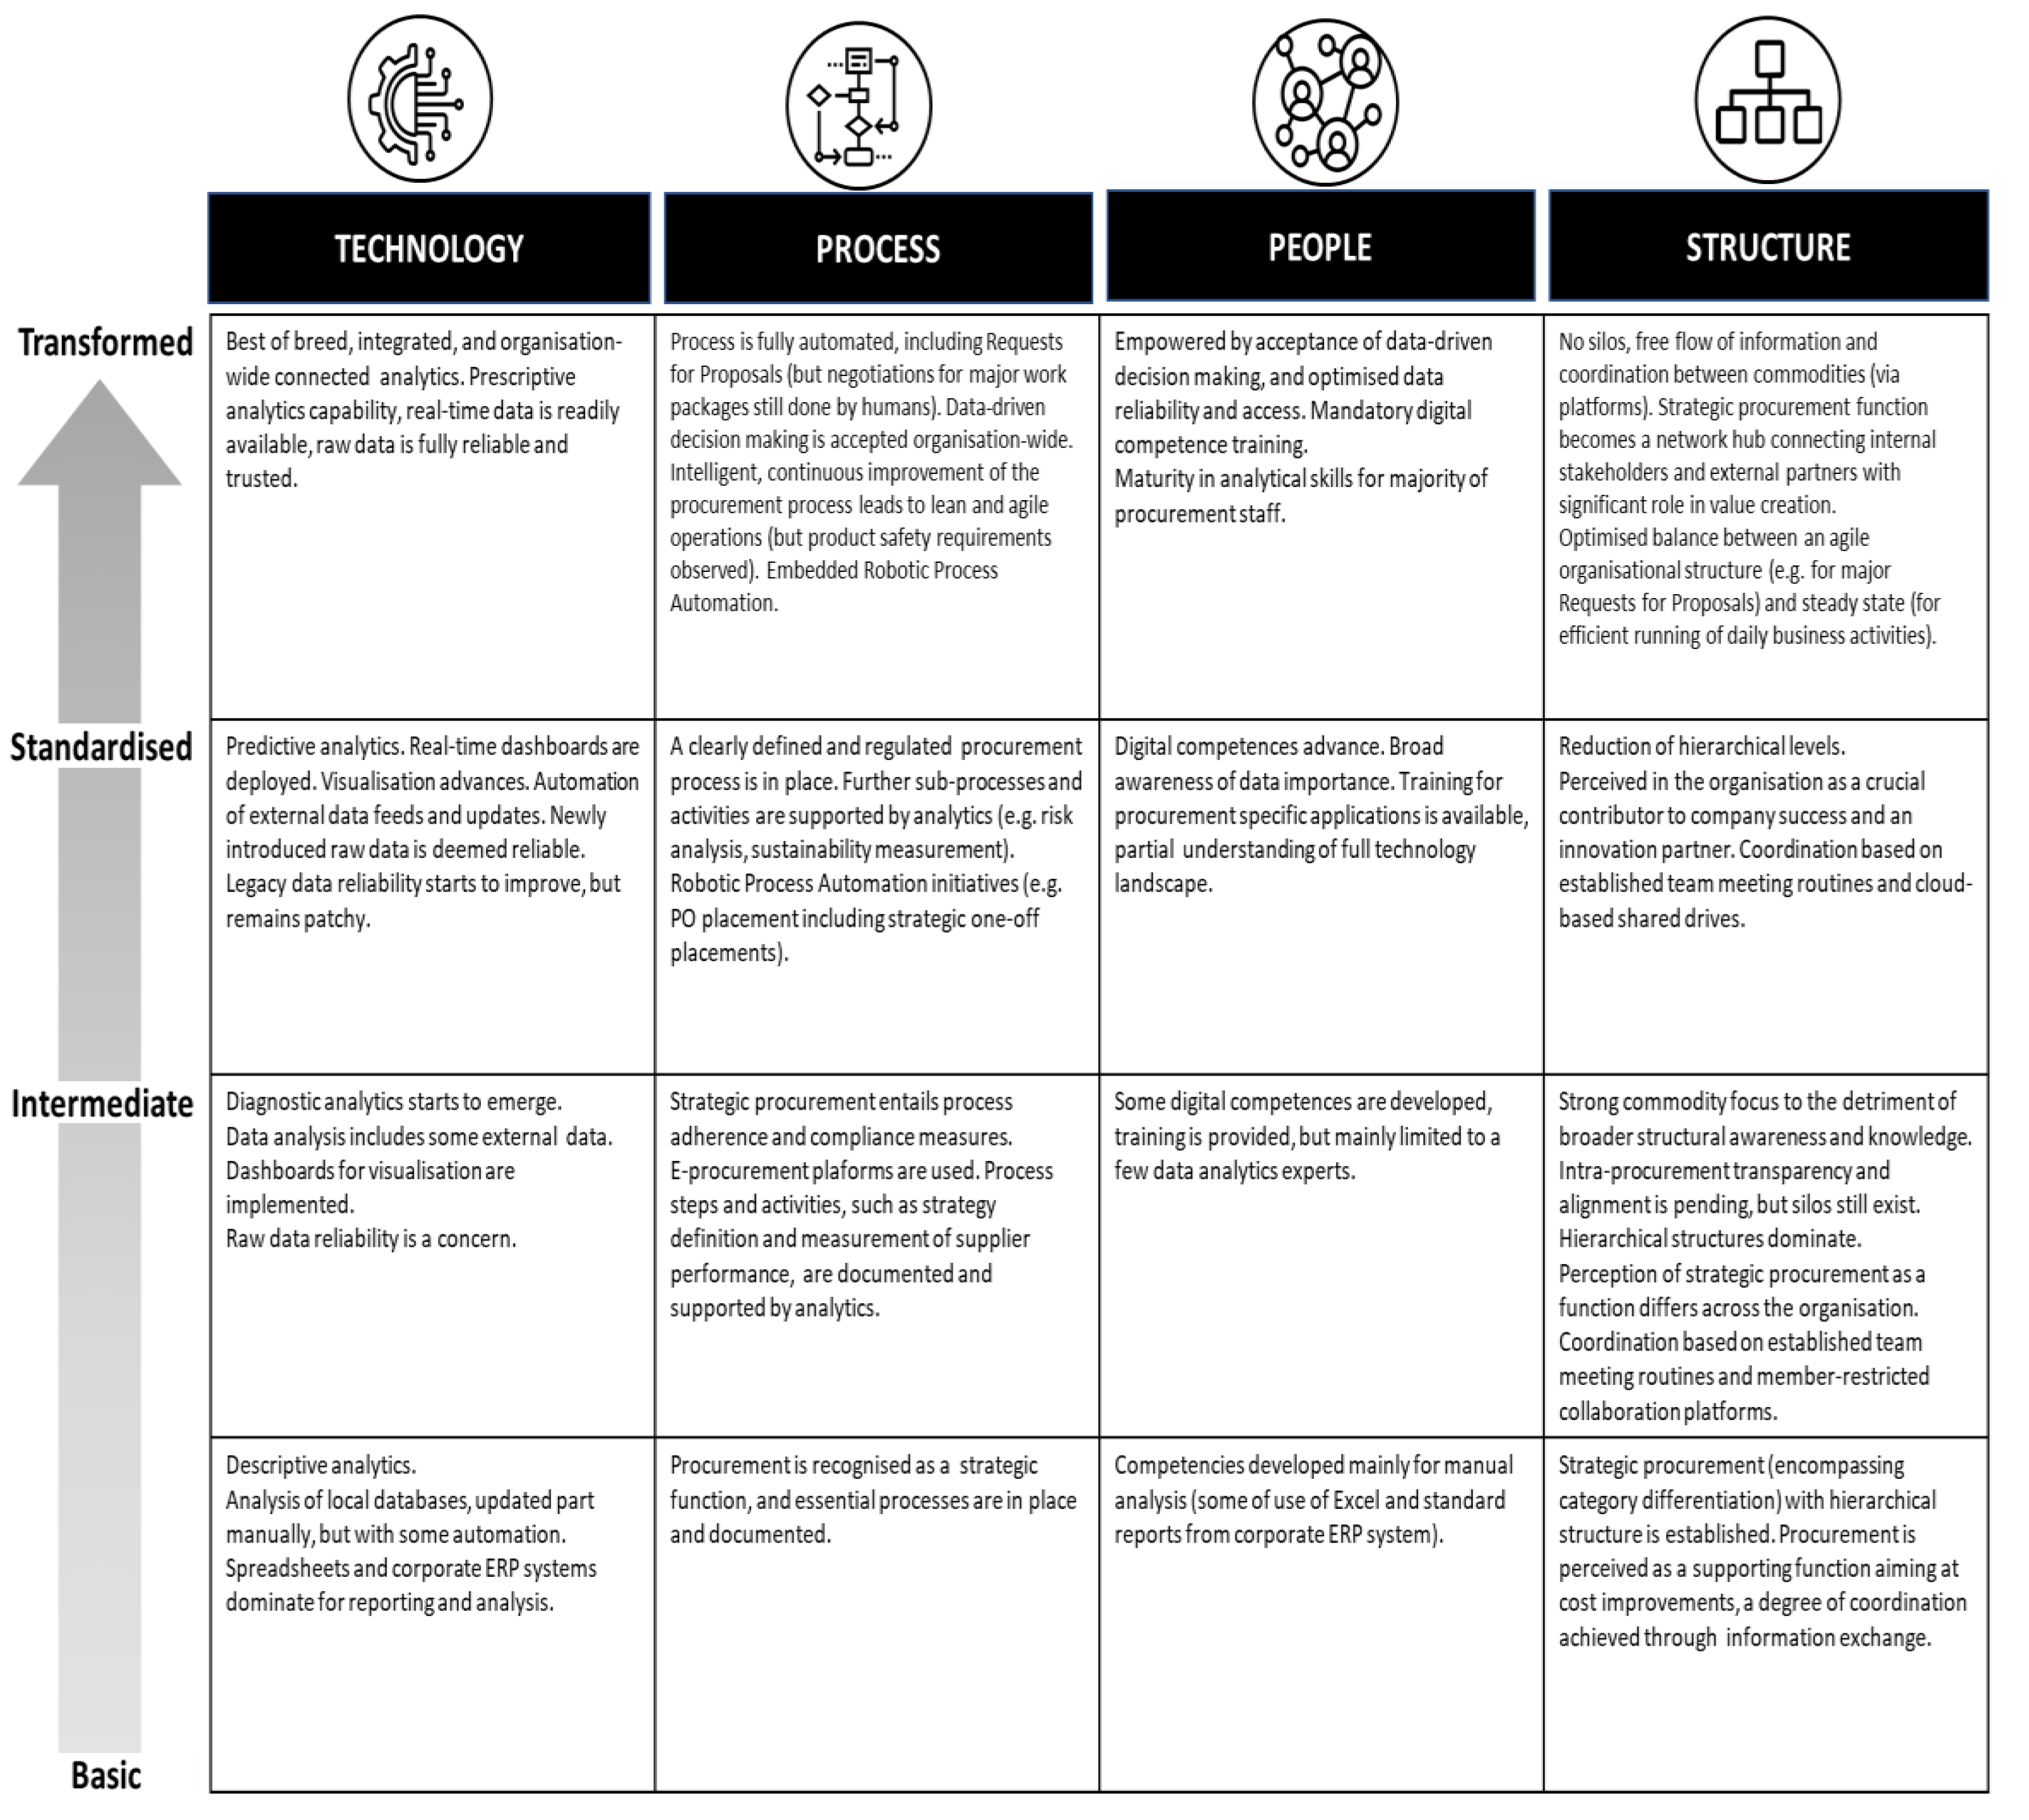
Appendix A. Maturity Model Stage Descriptions by Technology Dimension
Technology Dimension

Process Dimension

People Dimension

Structure Dimension

References
- Accenture (2017). Next Generation Digital Procurement Upgrade your thinking. Retrieved October 28, 2020, from https://www.accenture.com/_acnmedia/PDF-129/Accenture-Next-Generation-Digital-Procurement.pdf. /.
- Adom, D.; Hussein, E.K. Theoretical and conceptual framework: mandatory ingredients of a quality research. International Journal of Scientific Research 2018, 7, 438–441. [Google Scholar]
- Air Transport Action Group (ATAG). (2020). Aviation beyond borders. Retrieved November 18, 2020, from https://aviationbenefits.org/media/167186/abbb2020_full.pdf.
- Alsufyani, N.; Gill, A.Q. Digitalisation performance assessment: A systematic review. Technology in Society 2022, 68. [Google Scholar] [CrossRef]
- Altundag, A. A New Model for the Digital Transformation of the Strategic Procurement Function: A Case Study from the Aviation Industry. In Handbook of Research on Digital Transformation, Industry Use Cases, and the Impact of Disruptive Technologies; Wynn, M., Ed.; IGI-Global: Hershey, PA, USA, 2021; pp. 92–116. [Google Scholar] [CrossRef]
- Ancarani, A.; Di Mauro, C. (2018). Successful digital transformations need a focus on the individual. In Digitalisierung im Einkauf (pp. 11-26). Springer Gabler.
- Anitha, P.; Malini, M.P. A Review on Data Analytics for Supply Chain Management: A Case study, International Journal of Information Engineering and Electronic Business (IJIEEB) 2018, 10, 30–39. [CrossRef]
- Arya. V., Sharma, P., Singh, A., & De Silva, P.T.M. An exploratory study on supply chain analytics applied to spare parts supply chain. Benchmarking: An International Journal 2017, 24, 1571–1580. [Google Scholar] [CrossRef]
- Azhari, P.; Faraby, N.; Rossmann, A.; Steimel, B.; Wichmann, K.S. Digital transformation report. Retrieved November 2014, 15, 2020, from https://www.wiwo.de/downloads/10773004/1/DTA_Report_neu.pdf.. [Google Scholar]
- Bag, S.; Wood, L.C.; Mangla, S.K.; Luthrad, S. Procurement 4.0 and its implications on business process performance in a circular economy. Resources, Conservation & Recycling 2019, 152. [Google Scholar] [CrossRef]
- Barry, A.S.; Assoul, S.; Souissi, N. Strengths and Weaknesses of Digital Maturity Models. Journal of Computer Science 2023, 19, 727–738. [Google Scholar] [CrossRef]
- Batran, A.; Erben, A.; Schulz, R.; Sperl, F. Procurement 4.0 A survival guide in a digital, disruptive world. Campus Verlag GmbH. 2017. [Google Scholar]
- Berghaus, S.; Back, A. Stages in Digital Business Transformation: Results of an Empirical Maturity Study. MCIS 2016 Proceedings 2016, 22. https://aisel.aisnet.org/mcis2016/22. [Google Scholar]
- Bean, R. (2020, September 30). Why Culture Is the Greatest Barrier to Data Success. MIT Sloan Management Review. Retrieved October 14, 2020, from https://sloanreview.mit.edu/article/why-culture-is-the-greatest-barrier-to-data-success/.
- Bieda, L.C. (2020, October 13). How Organizations Can Build Analytics Agility. MIT Sloan Management Review. Retrieved October 14, 2020, from https://sloanreview.mit.edu/article/how-organizations-can-build-analytics-agility/?utm_source=newsletter&utm_medium=email&utm_content=Read%20the%20Article%20Now%20%C2%BB&utm_campaign=AWS%20DA%20ExecGuide%20Waller%20Bieda%2010/14/2020%20Version%20B. October.
- Bienhaus, F.; Haddud, A. Procurement 4.0: factors influencing the digitisation of procurement and supply chains. Business Process Management Journal 2018, 24, 965–984. [Google Scholar] [CrossRef]
- Brennen, S.J.; Kreiss, D. Digitalization. In K.B. Jensen, R.T. Craig, J.D. Pooley & E.W. Rothenbuhler (Eds.). The International Encyclopedia of Communication Theory and Philosophy (pp.1-11). John Wiley & Sons. 2016. [CrossRef]
- Bryman, A.; Bell, E. Business Research Methods (3rd ed.). Oxford University Press. 2011. [Google Scholar]
- Clarke, V.; Braun, V. Thematic analysis, The Journal of Positive Psychology 2017, 12, 297–298. [CrossRef]
- Christopher, M. (2023) Logistics and Supply Chain Management (5th ed.). Pearson Education Limited.
- Davenport, T.H.; Bean, R. (2020). Data-Driven Business Transformation Connecting Data/AI Investment to Business Outcomes. NewVenture Partners. Retrieved November 27, 2020, from http://newvantage.com/wp-content/uploads/2020/01/NewVantage-Partners-Big-Data-and-AI-Executive-Survey-2020-1.pdf.
- de Yong, Y. (2018). Defining The Differences In Analytics. Available online: https://www.ithappens.nu/defining-the-differences-in-analytics/ (accessed on 25 March 2024).
- Eriksson, T.; Alessandro, B.; Bonera, M. Think with me, or think for me? On the future role of artificial intelligence in marketing strategy formulation. The TQM Journal 2020, 32, 795–814. [Google Scholar] [CrossRef]
- Flick, U.; von Kardorff, E.; Steinke, I. (2013). Qualitative Forschung. Ein Handbuch [Qualitative Research. A handbook]. rowohlts enzyklopädie.
- Fosso Wamba, S., S. , Edwards, A., Chopin, G., & Gnanzou, D. How ‘big data’ can make big impact: Findings from a systematic review and a longitudinal case study. International Journal of Production Economics 2015, 160, 234–246. [Google Scholar] [CrossRef]
- Giunipero, L.C.; Eltantawy, R. (2022). Theories relevant to purchasing and supply management research: status quo and future suggestions. In Tate, W., Ellram, L., & Bals, L. (Eds.), Handbook of Theories for Purchasing, Supply Chain and Management Research (pp.48-62). Edward Elgar Publishing. [CrossRef]
- Haldipur, P. (2023, August 7). Organizational Structures That Drive Digital Success. Infosys. Retrieved October 13, 2023 from https://www.infosys.com/iki/perspectives/organizational-structures-drive-digital-success.html.
- Handfield, R.; Linton, T. (2017). The Living Supply Chain: The Evolving Imperative of Operating in Real Time. [CrossRef]
- Handfield, R.; Jeong, S.; Choi, T. Emerging procurement technology: data analytics and cognitive analytics. International Journal of Physical Distribution & Logistics Management 2019, 49, 972–1002. [Google Scholar] [CrossRef]
- Haryanti, T.; Rakhmawati, N.A.; Subriadi, A.P. The Extended Digital Maturity Model. Big Data and Cognitive Computing 2023, 7. [Google Scholar] [CrossRef]
- Heeks, R. Information systems and developing countries: failure, success, and local improvisations. Journal of Information Society 2002, 18, 101–112. [Google Scholar] [CrossRef]
- Holliday, A. (2016). Doing & Writing (3e)-Qualitative Research. SAGE Publications.
- Hughes, J.; Ertel, D. (2016). The reinvention of procurement, Supply Chain Management Review, May/June 2016, 18-23, Retrieved August 2, 2019, from https://www.logisticsmgmt.com/wp_content/vantage_wp_reinvention_procurement_062716.pdf.
- International Civil Aviation Organization (ICAO). (2023, January 27).
- Effects of Novel Coronavirus (COVID-19) on Civil Aviation: Economic Impact Analysis.
- Retrieved February 20, 2023 from https://www.icao.int/sustainability/Documents/Covid-19/ICAO_coronavirus_Econ_Impact.pdf.
- Joesbury, P. (2016). Improving the effectiveness of procurement Identification and improvement of key.
- 38. determinant factors – The PEPPS Project. 3038; http://publications.aston.ac.uk/id/eprint/30386/1/Joesbury_P_2017.pdf.
- Kagermann, H. (2015). Change Through Digitization-Value Creation in the Age of Industry 4.0. In H. Albach, H. Meffert, A. Pinkwart & R. Reichwald (Eds.), Management of permanent change (pp.23-45). Springer. [CrossRef]
- Kleemann, F.C.; Glas, A.H. (2020). Einkauf 4.0 Digitale Transformation der Beschaffung. [CrossRef]
- Maxwell, J. (2008). The SAGE Handbook of Applied Social Research Methods (2nd ed., L. Bickmann & D.J. Rog, Eds.). SAGE Publications.(2nd ed.).
- Miles, M.B.; Huberman, M.; Saldana, J. (2014). Qualitative Data Analysis: A Methods Sourcebook (4th ed.). SAGE Publications.
- Mirković, V.; Lukić, J.; Lazarević, S.; Vojinović, Ž. (2019). Key characteristics of organizational structure that supports digital transformation. In International Scientific Conference Strategic Management and Decision Support Systems in Strategic Management.
- Murray, G. (2013). TATA Consultancy Services. Procurement needs a Digital Strategy. Retrieved February 25, 2019, from https://www.slideshare.net/DrGordonMurray/digital-procurement-strategy05131.
- Nicoletti, B. Agile Procurement Volume II: Designing and Implementing a Digital Transformation. Palgrave. Macmillan. 2018. [Google Scholar] [CrossRef]
- Oelcer, E.; Schnellbächer, W.; Weise, D.; Sidopoulos, B. (2019, July 3). Taming Tail Spend. Boston Consulting Group, Retrieved August 2, 2020 from https://www.bcg.com/publications/2019/taming-tail-spend.
- Paulraj, A.; Chen, I.J.; Flynn, J. Levels of strategic purchasing: Impact on supply integration and performance. Journal of Purchasing & Supply Management 2006, 12, 107–122. [Google Scholar] [CrossRef]
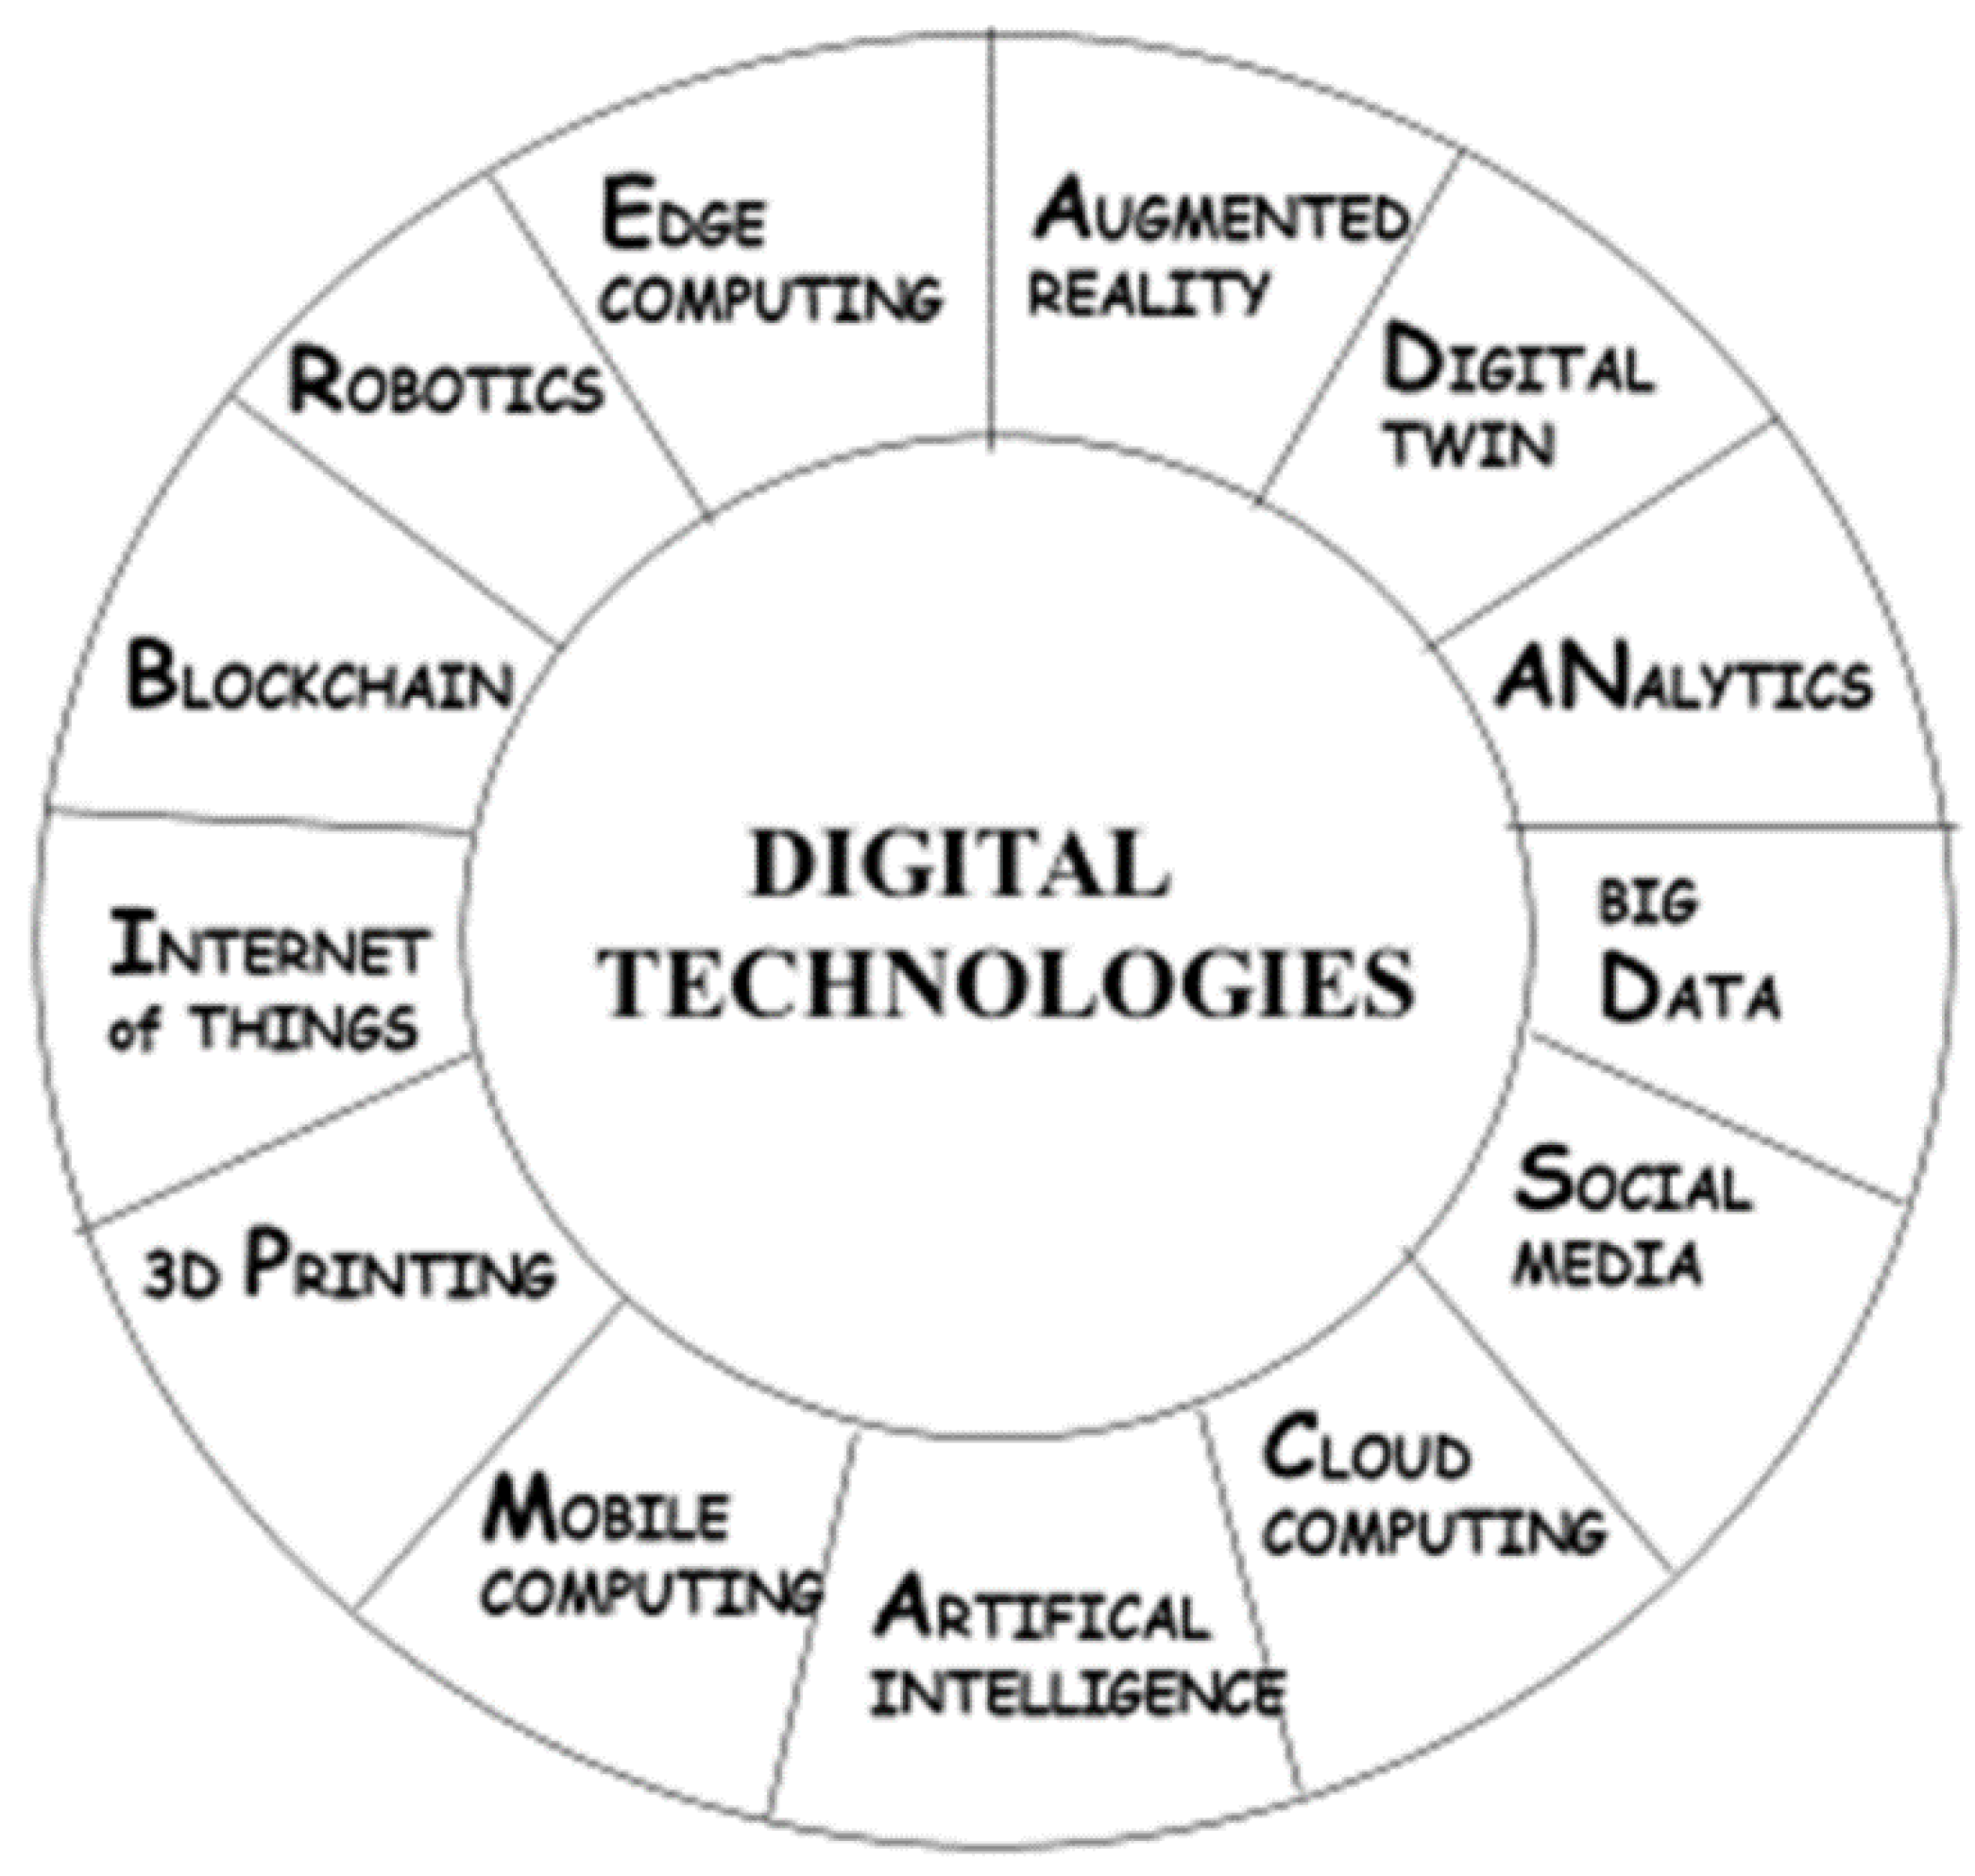
- Perry, 2022 “8 Digital Transformation Technologies and Their Business Impact” (para.8), by Perry 2022 (https://bluexp.netapp.com/blog/cvo-blg-8-digital-transformation-technologies-and-their-business-impact).
- Reinsel, D.; Gantz, J.; Rydning, J. (2018). The Digitization of the World from Edge to Core. IDC. Retrieved August 8, 2021, from https://resources.moredirect.com/white-papers/idc-report-the-digitization-of-the-world-from-edge-to-core.
- Roßmann, B.; Canzaniello, A.; von der Gracht, H.; Hartmann, E. The future and social impact of Big Data Analytics in Supply Chain Management: Results from a Delphi study. Technological Forecasting and Social Change 2018, 130, 135–149. [Google Scholar] [CrossRef]
- Saldaña, J. (2015). The coding manual for qualitative researchers (3rd ed.). SAGE Publications.
- Sanders, N.R. How to Use Big Data to Drive Your Supply Chain. California Management Review 2016, 58, 26–48. [Google Scholar] [CrossRef]
- Saunders, M.N.K.; Lewis, P.; Thornhill, A. Research Methods for Business Students (9th ed.). Pearson Education Limited.
- Tan, M.C.; Lee, W.L. Evaluation and Improvement of Procurement Process with Data Analytics. International Journal of Advanced Computer Science and Applications 2015, 6, 70–80. [Google Scholar] [CrossRef]
- Teichert, R. Digital Transformation Maturity: A Systematic Review of Literature. Acta Universitatis Agriculturae et Silviculturae Mendelianae Brunensis 2019, 67, 1673–1687. [Google Scholar] [CrossRef]
- Schweiger, J. (2016), Concept of a Purchasing and Supply Management Maturity Framework. In R. Bogaschewsky, M. Eßig, R. Lasch & W. Stölze (Eds.), Advanced Studies in Supply Chain Supply Management Research (pp.153-176). [CrossRef]
- Thomas, D.R. A General Inductive Approach for Analyzing Qualitative Evaluation Data. American Journal of Evaluation 2006, 27, 237–246. [Google Scholar] [CrossRef]
- Turchi, P. (2018, February 1). The Digital Transformation Pyramid: A Business-driven Approach for Corporate Initiatives. Retrieved April 17, 2020 from https://www.thedigitaltransformationpeople.com/channels/the-case-for-digital-transformation/digital-transformation-pyramid-business-driven-approach-corporate-initiatives/.
- Westerman, G. (2017, October 25). Your Company Doesn’t Need a Digital Strategy, MIT Sloan Management Review, 59, 1-5. Retrieved May 6, 2021, from https://sloanreview.mit.edu/article/your-company-doesnt-need-a-digital-strategy/.
- Wynn, M. E-business, Information Systems Management and Sustainable Strategy Development in the Digital Era. Sustainability 2022, 14, 10918. [Google Scholar] [CrossRef]
- Wynn, M.; Lam, C. Digitalisation and IT strategy in the hospitality industry. Systems 2023, 11, Art 501. [Google Scholar] [CrossRef]
- Wynn, M.; Felser, K. Digitalisation and Change in the Management of IT. Computers 2023, 12, Art 251. [Google Scholar] [CrossRef]
- Wynn, M.; Rezaeian, M. ERP implementation in manufacturing SMEs: Lessons from the Knowledge Transfer Partnership scheme. InImpact: The Journal of Innovation Impact 2015, 8, 75–92. [Google Scholar]
- Yin, R.K. (2018). Case study research and applications: Design and methods (6th ed.). SAGE Publications.
- Yin, Y.; Stecke, K.E.; Li, D. The evolution of production systems from Industry 2.0 through Industry 4.0. International Journal of Production Research 2018, 56, 848–861. [Google Scholar] [CrossRef]
- Zaoui, F.; Souissi, N. Roadmap for digital transformation: A literature review. Procedia Computer Science 2020, 175, 621–628. [Google Scholar] [CrossRef]
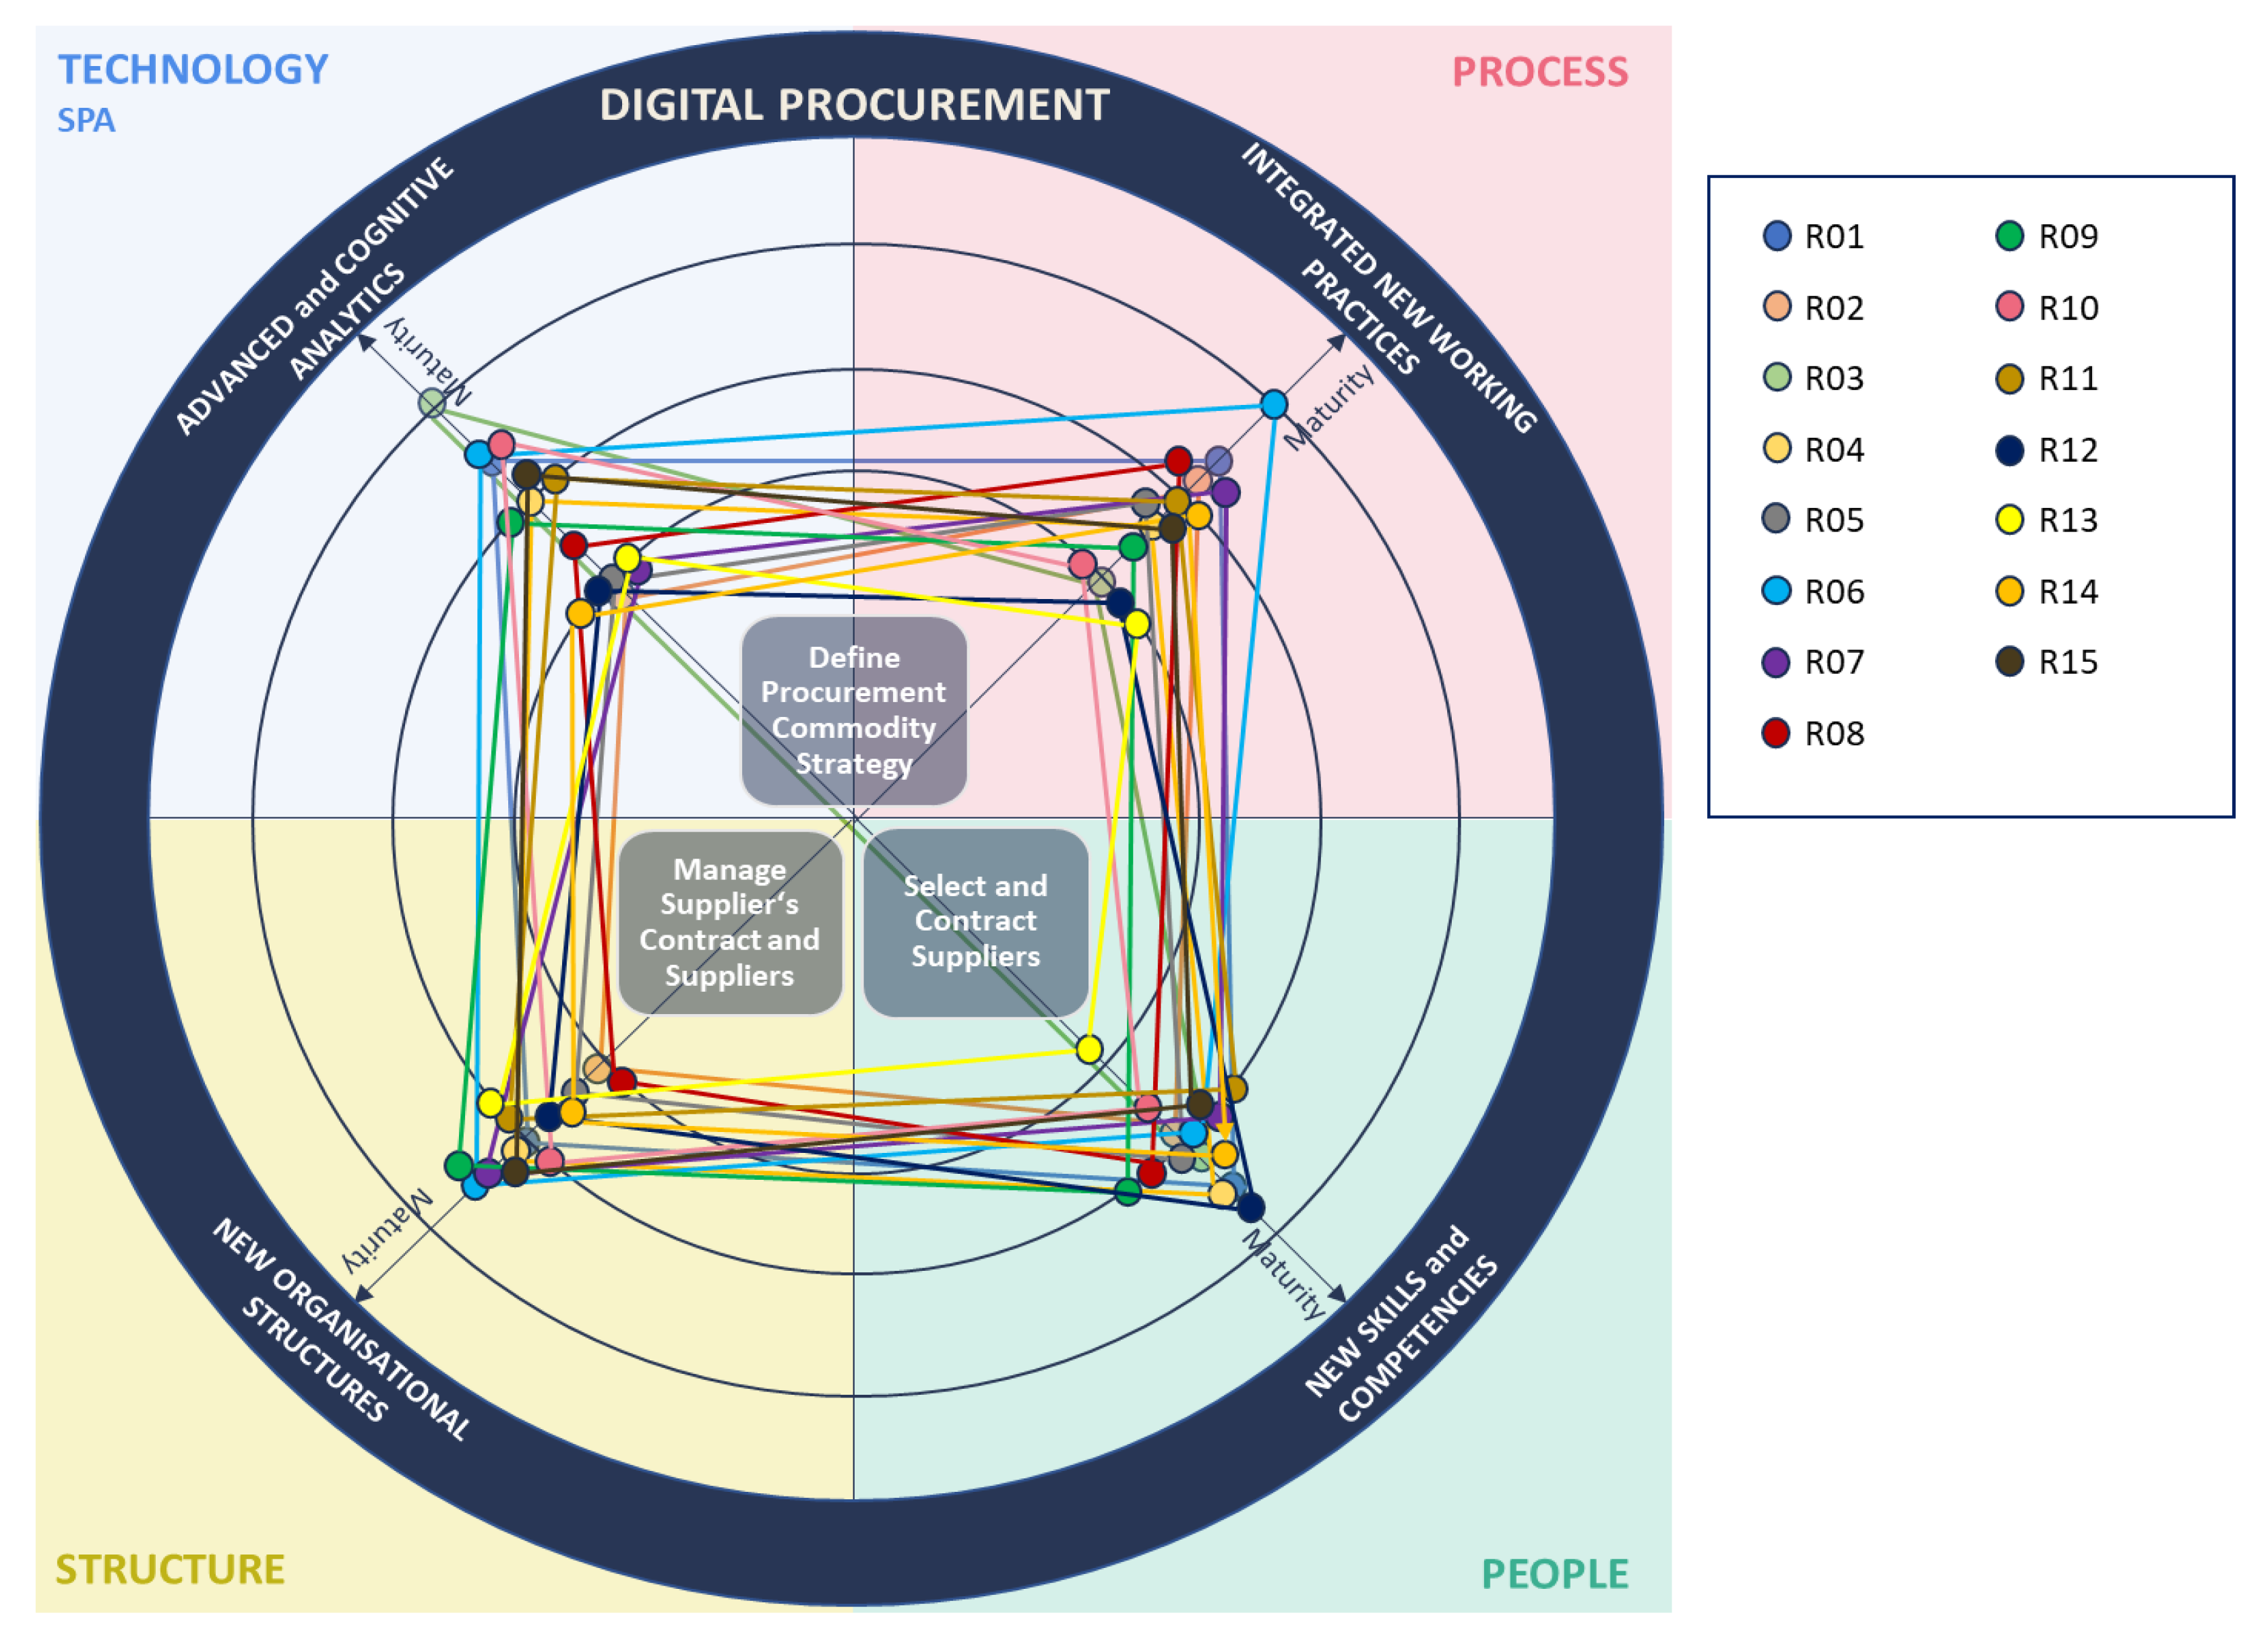
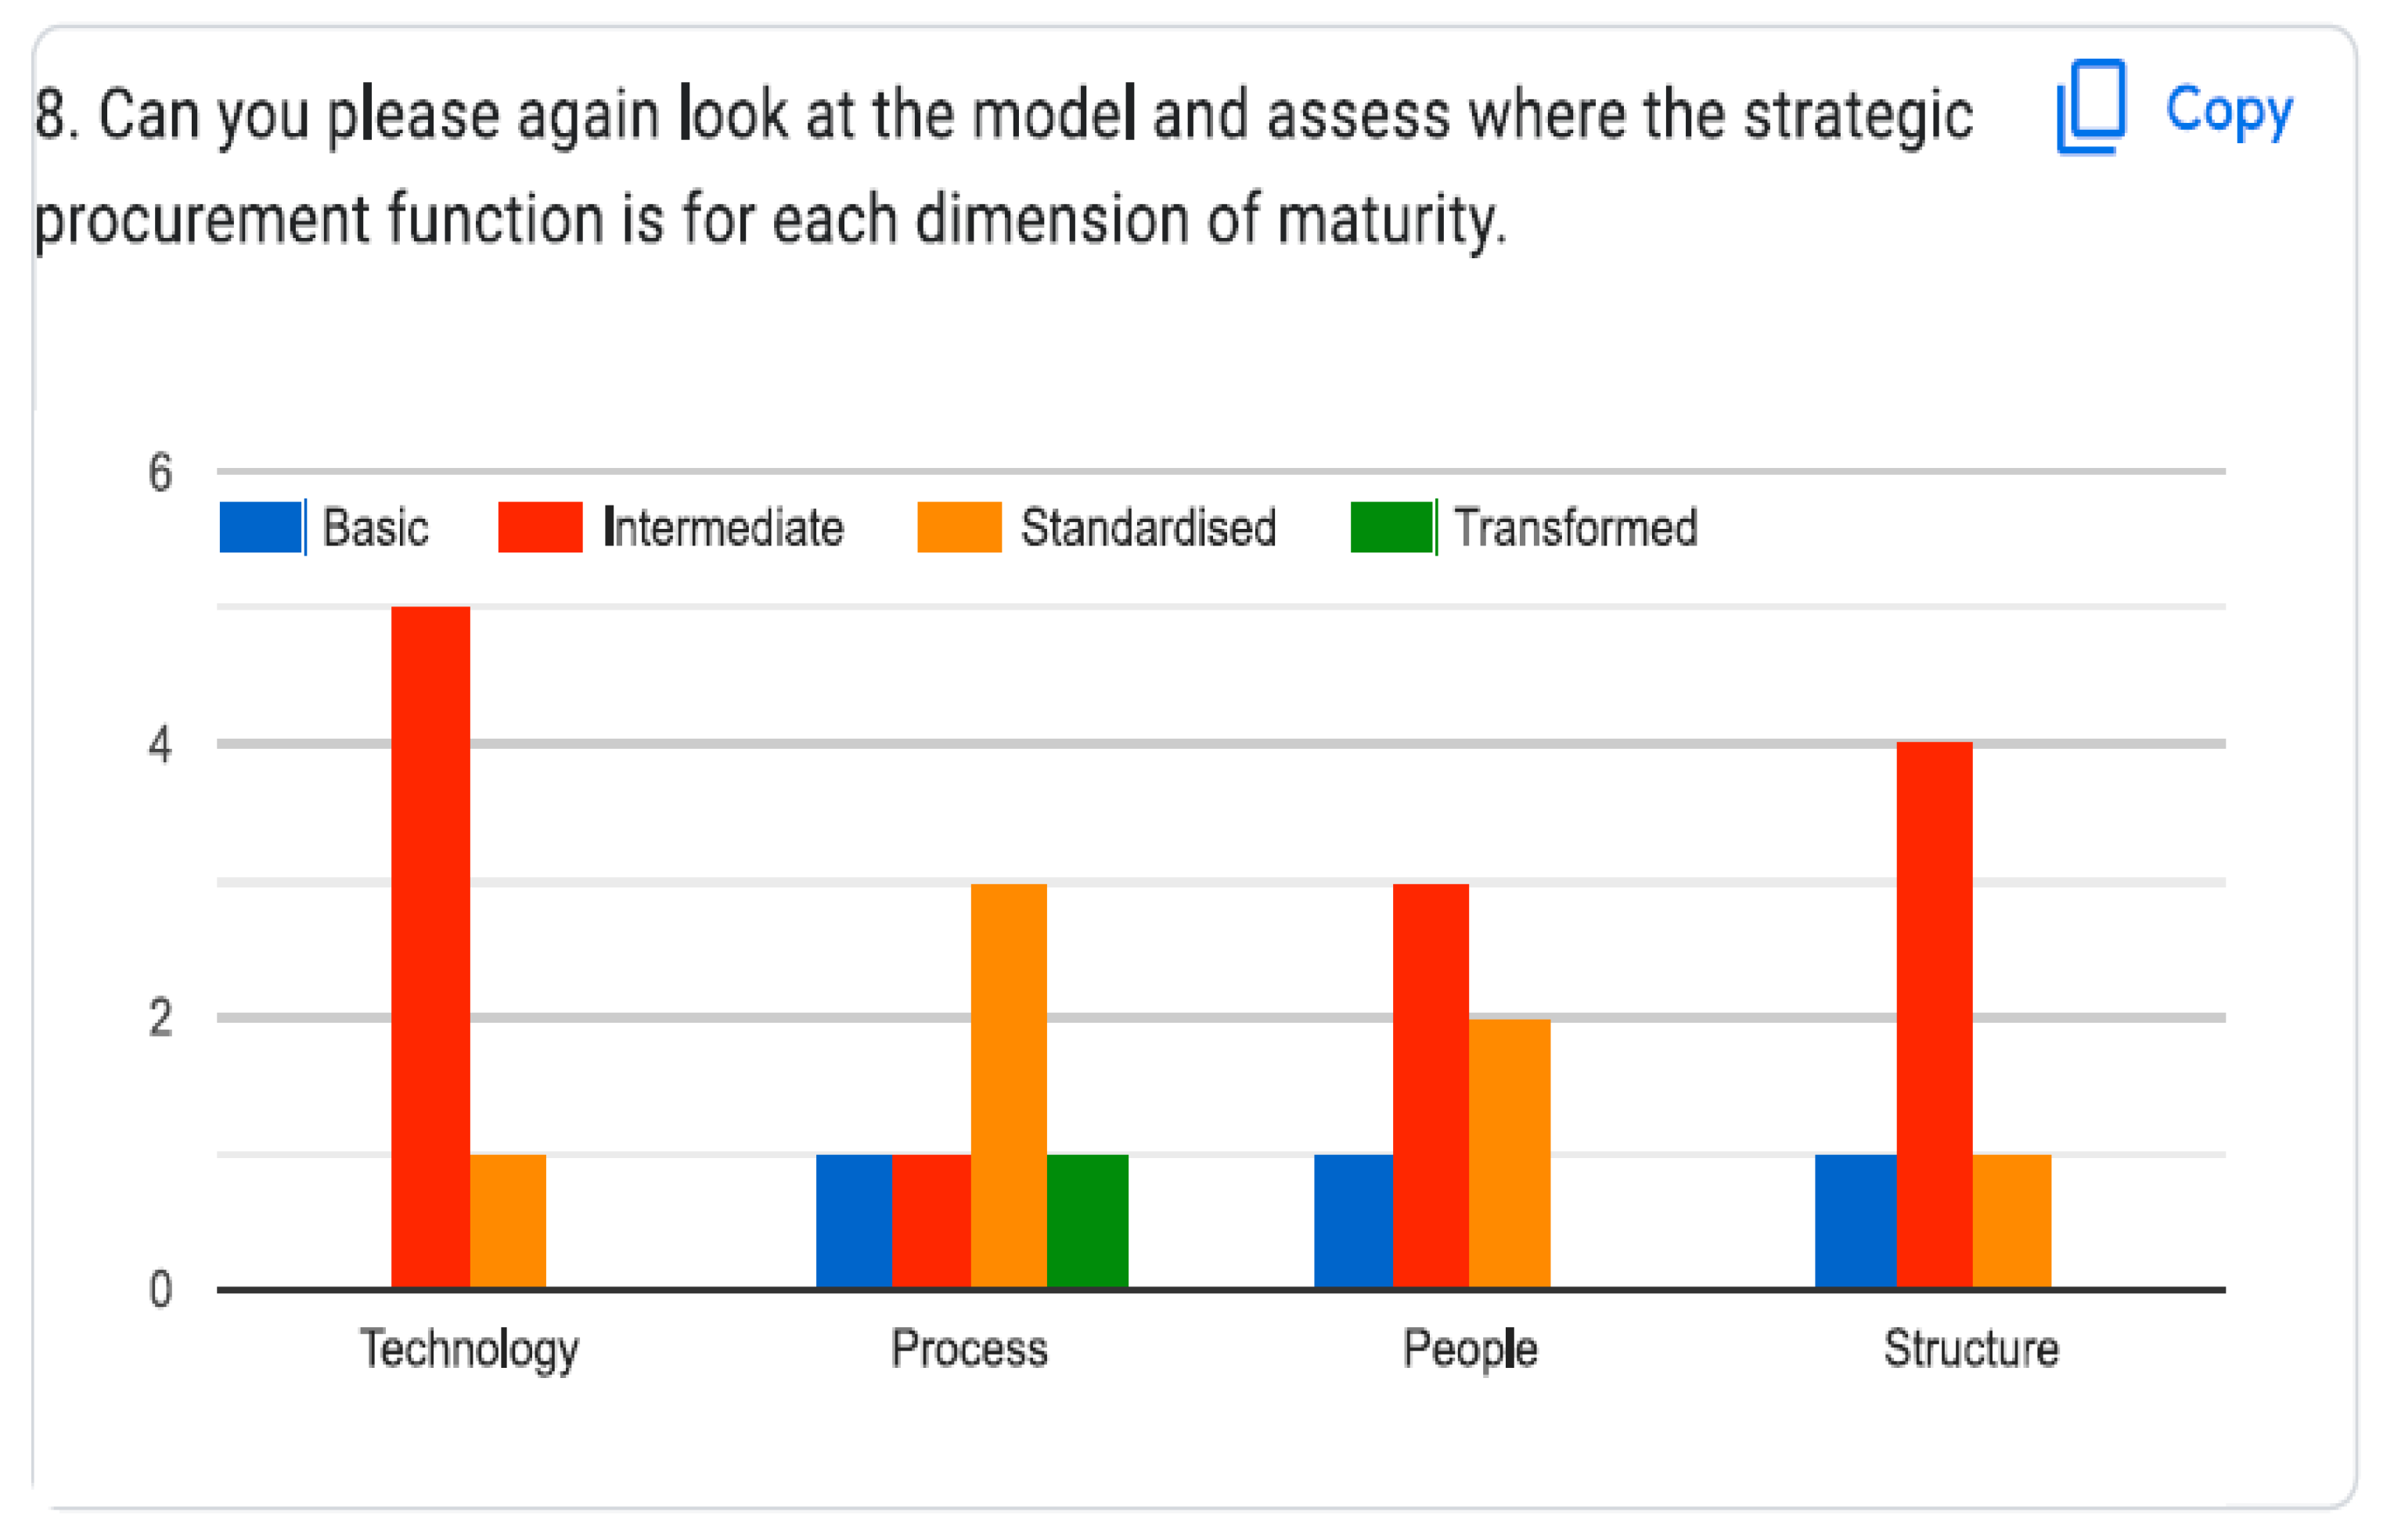
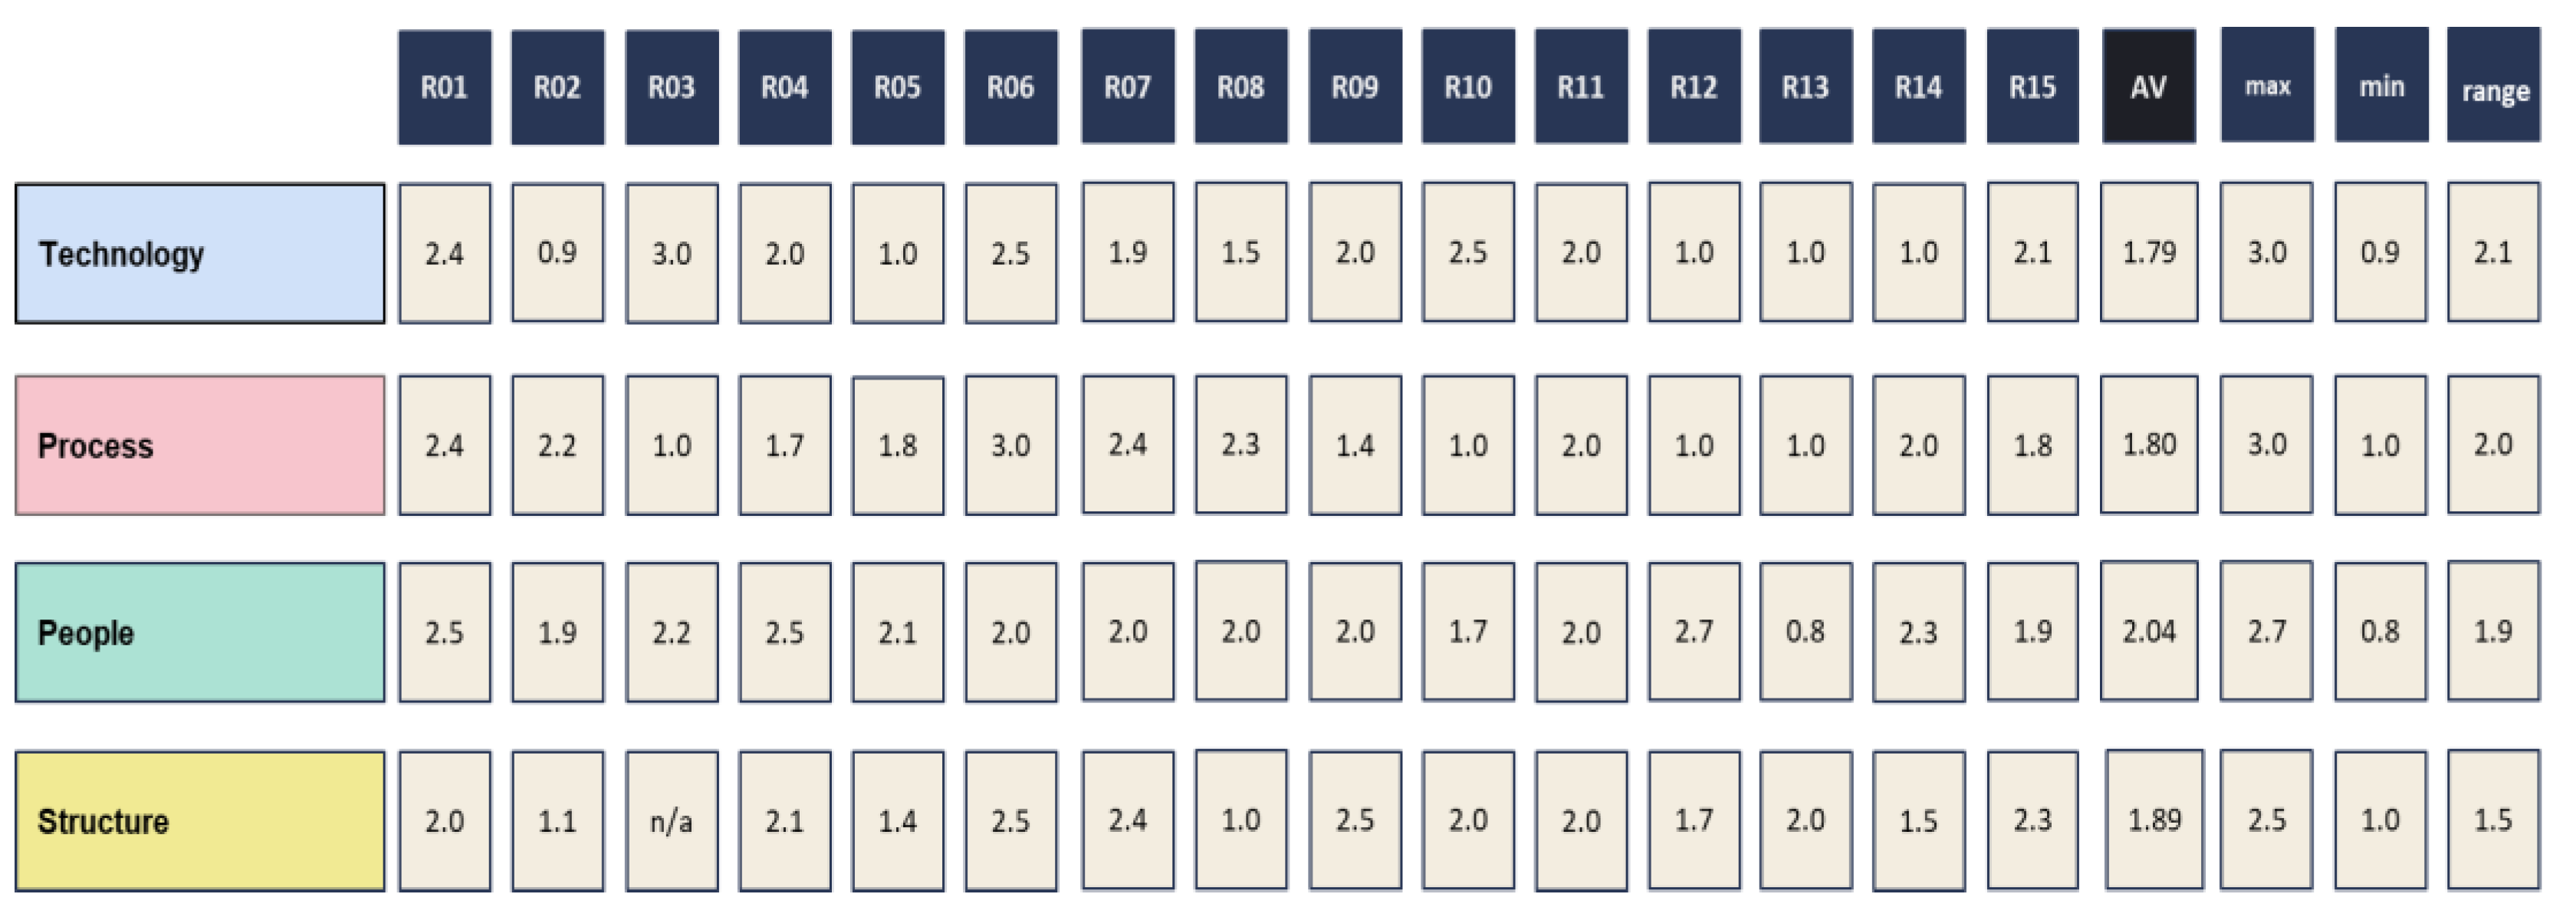
| Code | Procurement Commodity | Role | Strategic Procurement Experience (years) |
|---|---|---|---|
| R01 | Strategy and Processes (Procurement Governance) | Project manager | 12 |
| R02 | Material and Parts | MFT leader | 25 |
| R03 | Equipment and Systems | Vice president | 30 |
| R04 | Equipment and Systems | Project manager | 5 |
| R05 | Aerostructure | Lead buyer | 10 |
| R06 | Cabin and Cargo | Executive assistant | 2.5 |
| R07 | Aerostructure | Vice president | 16 |
| R08 | Material and Parts | Vice president | 2 |
| R09 | Equipment and Systems | Sub-commodity leader | 12 |
| R10 | Material and Parts | Buyer | 5 |
| R11 | Cabin and Cargo | Commodity leader | 8 |
| R12 | Aerostructure | Buyer | 8 |
| R13 | Aerostructure | Sub-commodity leader | 8 |
| R14 | Aerostructure | Project support | 16 |
| R15 | Cabin and Cargo | Project manager | 7 |
 |
| No. | Statement | SA | A | N | D | SD |
|---|---|---|---|---|---|---|
| 1. | Overall, the model supports the realistic assessment of the current level of digital maturity in strategic procurement | 3 | 2 | 1 | ||
| 2. | The four dimensions of maturity (technology-process-people-structure) are appropriate for the model and allow for a comprehensive assessment of the level of maturity. | 3 | 2 | 1 | ||
| 3. | The descriptors for the four stages of maturity in the model are appropriate, balanced, and allow a realistic assessment of the different dimensions of change. | 3 | 2 | 1 | ||
| 4. | The model can be used in practice as a guide to progress the deployment of advanced analytics in strategic procurement. | 2 | 3 | 1 | ||
| 5. | The model supports the development of data-driven decision making. | 2 | 3 | 1 | ||
| 6. | The model, if used effectively, can trigger and support an improvement in data quality. | 2 | 1 | 2 | 1 | |
| 7. | The model can be used periodically to assess the level of digital maturity and act as the basis for action planning in the different change dimension. | 3 | 2 | 1 |
Disclaimer/Publisher’s Note: The statements, opinions and data contained in all publications are solely those of the individual author(s) and contributor(s) and not of MDPI and/or the editor(s). MDPI and/or the editor(s) disclaim responsibility for any injury to people or property resulting from any ideas, methods, instructions or products referred to in the content. |
© 2024 by the authors. Licensee MDPI, Basel, Switzerland. This article is an open access article distributed under the terms and conditions of the Creative Commons Attribution (CC BY) license (http://creativecommons.org/licenses/by/4.0/).


