Submitted:
29 March 2024
Posted:
29 March 2024
You are already at the latest version
Abstract
Keywords:
1. Introduction
2. Materials and Methods
2.1. Study Site
2.2 Soil Sampling and Aggregate Size Fractionation
2.3 Soil Organic Carbon Fractions Analyses
2.4 Soil Enzyme Activities Analyses
2.5 High-Throughput Sequencing
2.6 Statistical Analysis
3. Results
3.1 Soil Aggregate Distribution and Stability
3.2 Soil Organic Carbon Fractions and Enzyme Activities within Aggregates
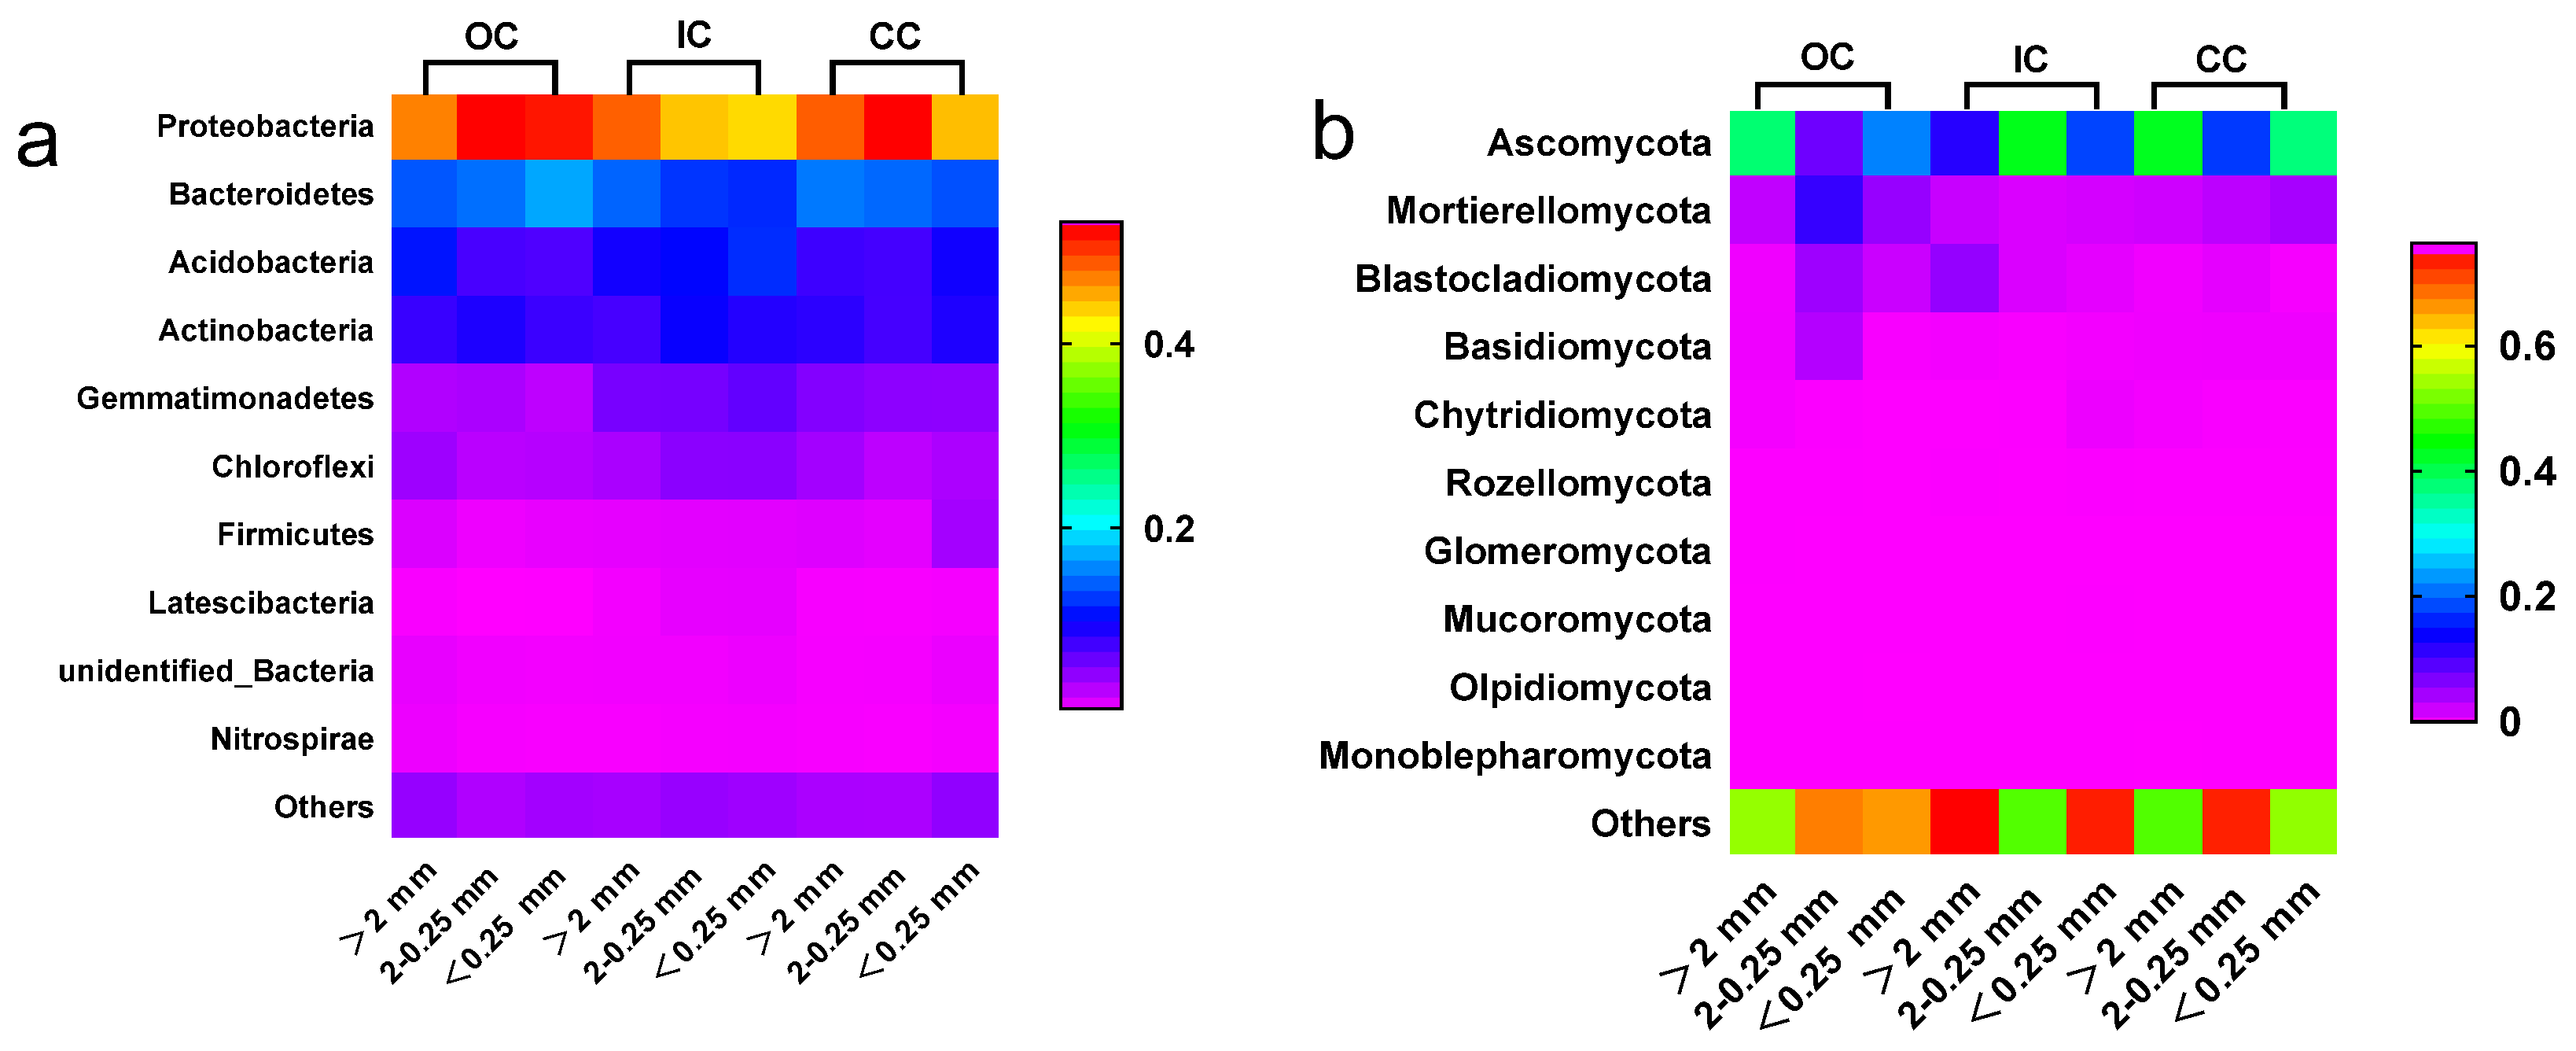
3.4 Microbial Community
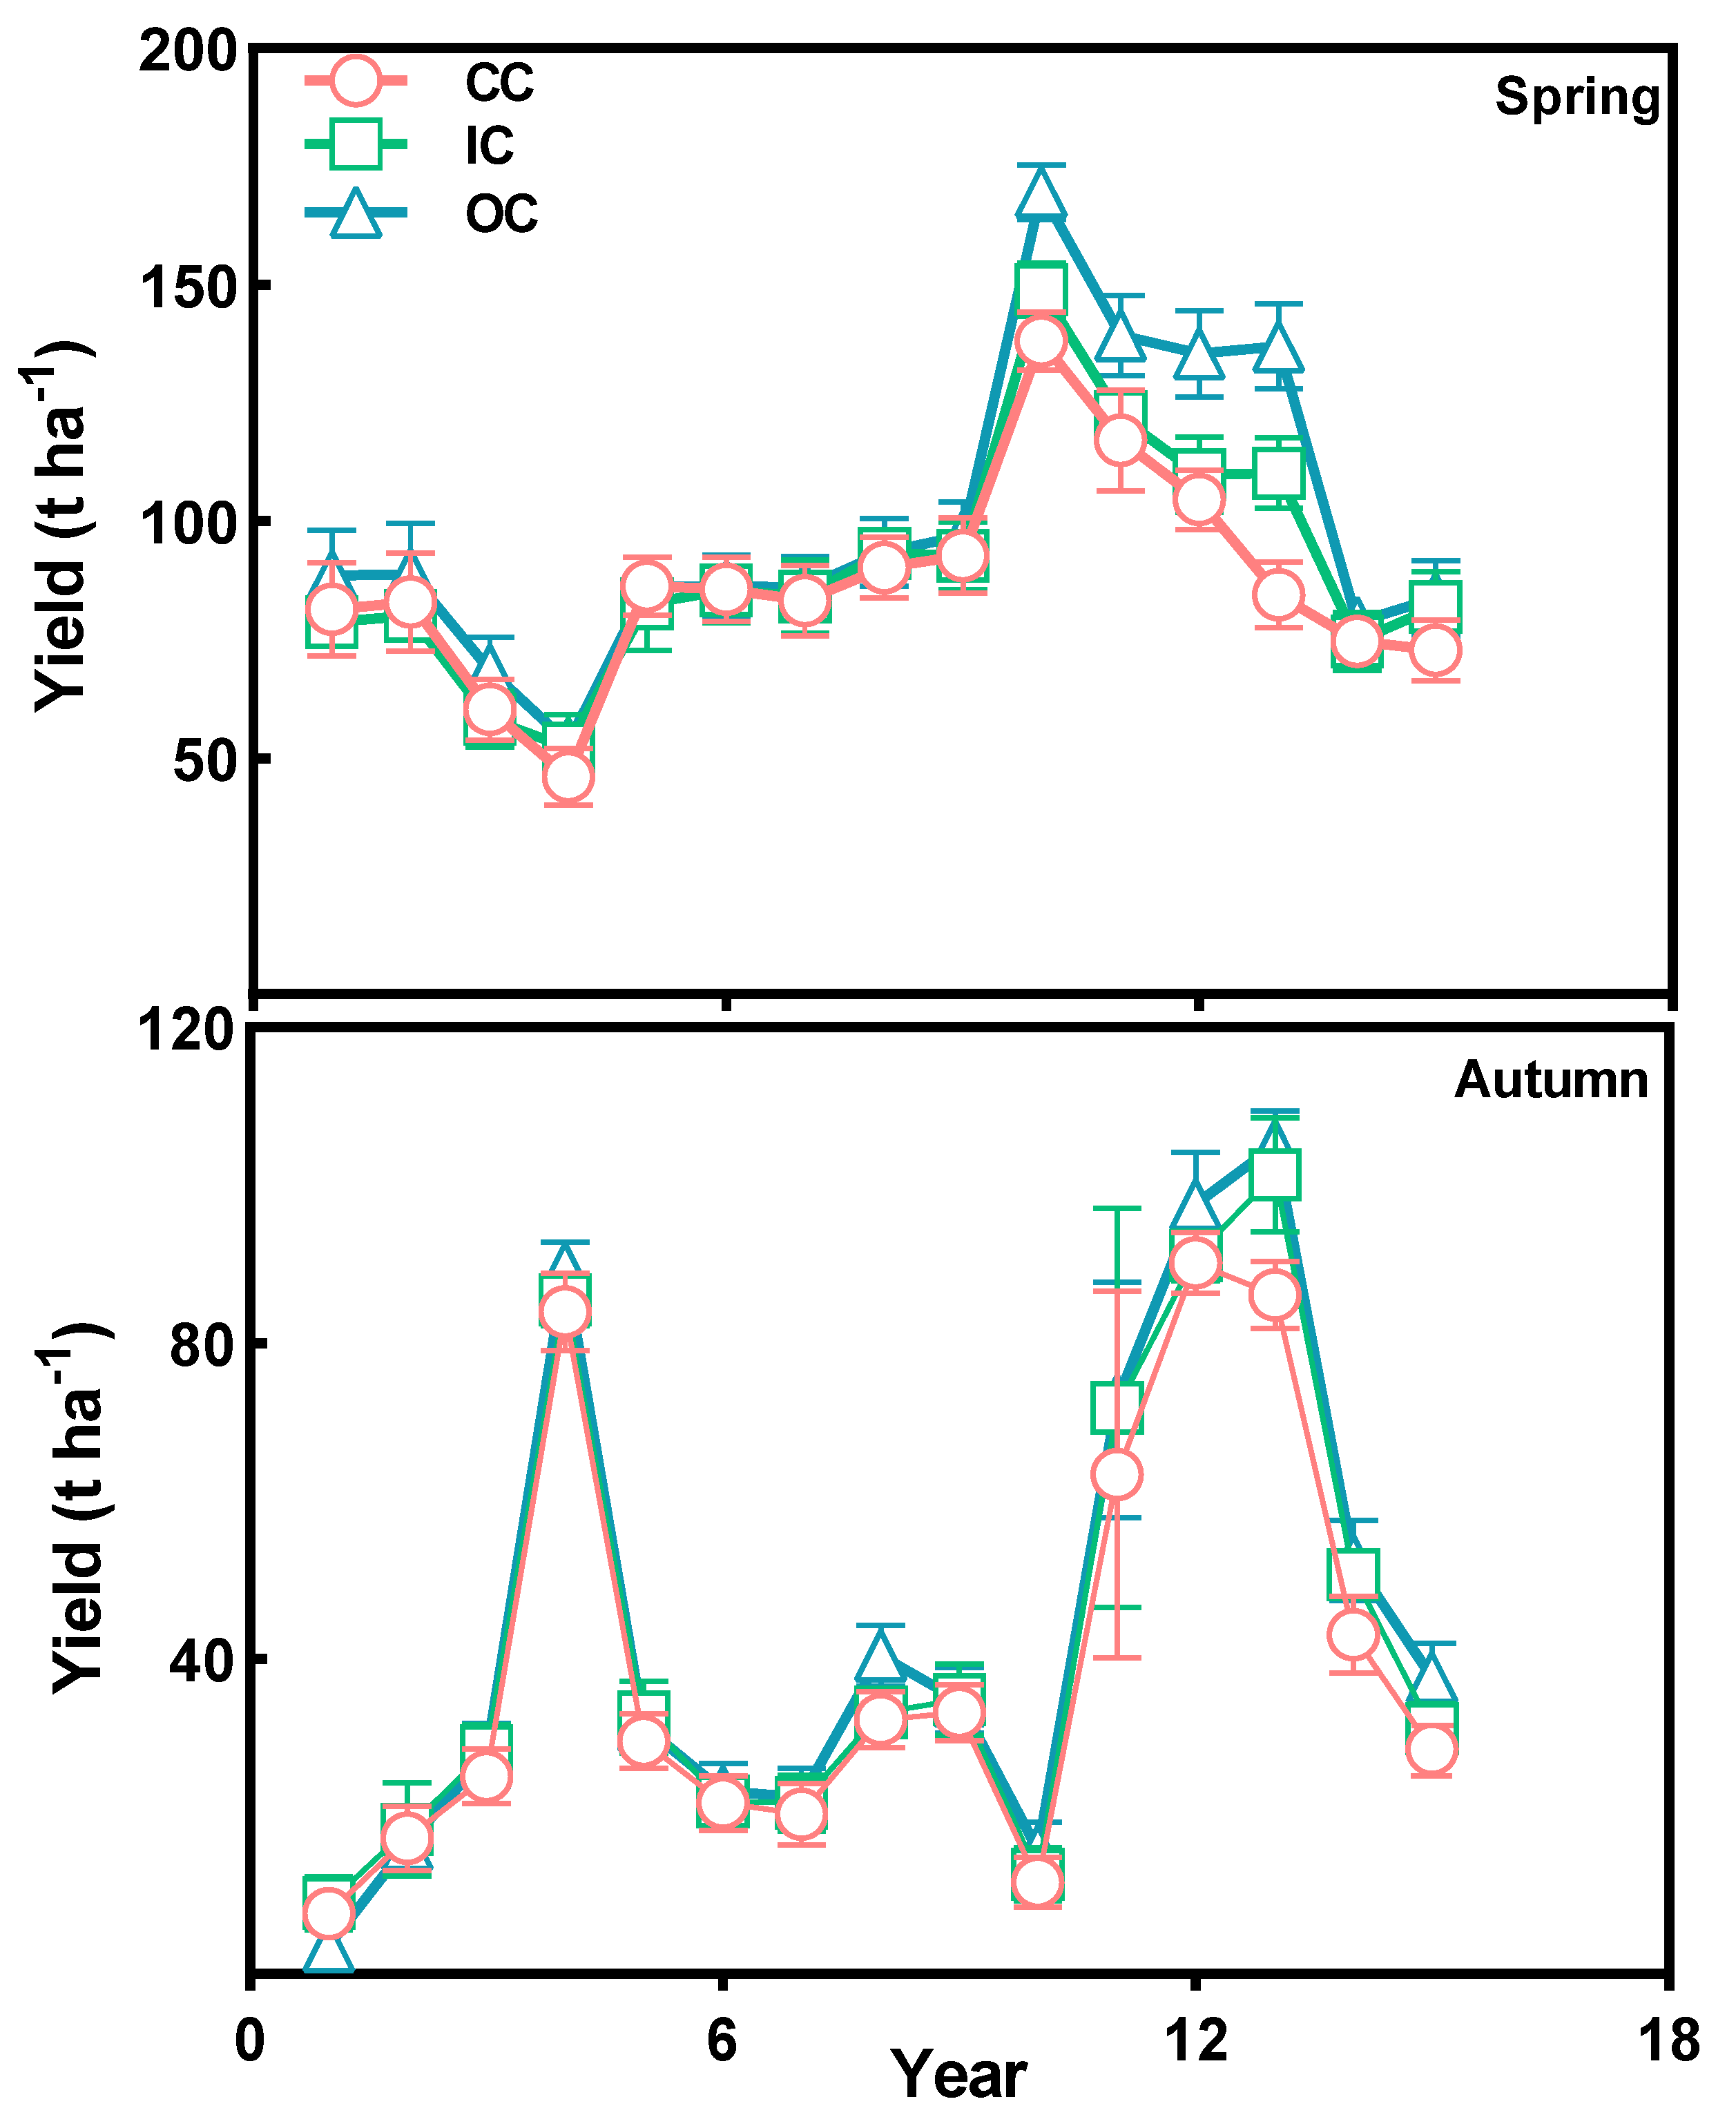
3.5 Vegetable Yield
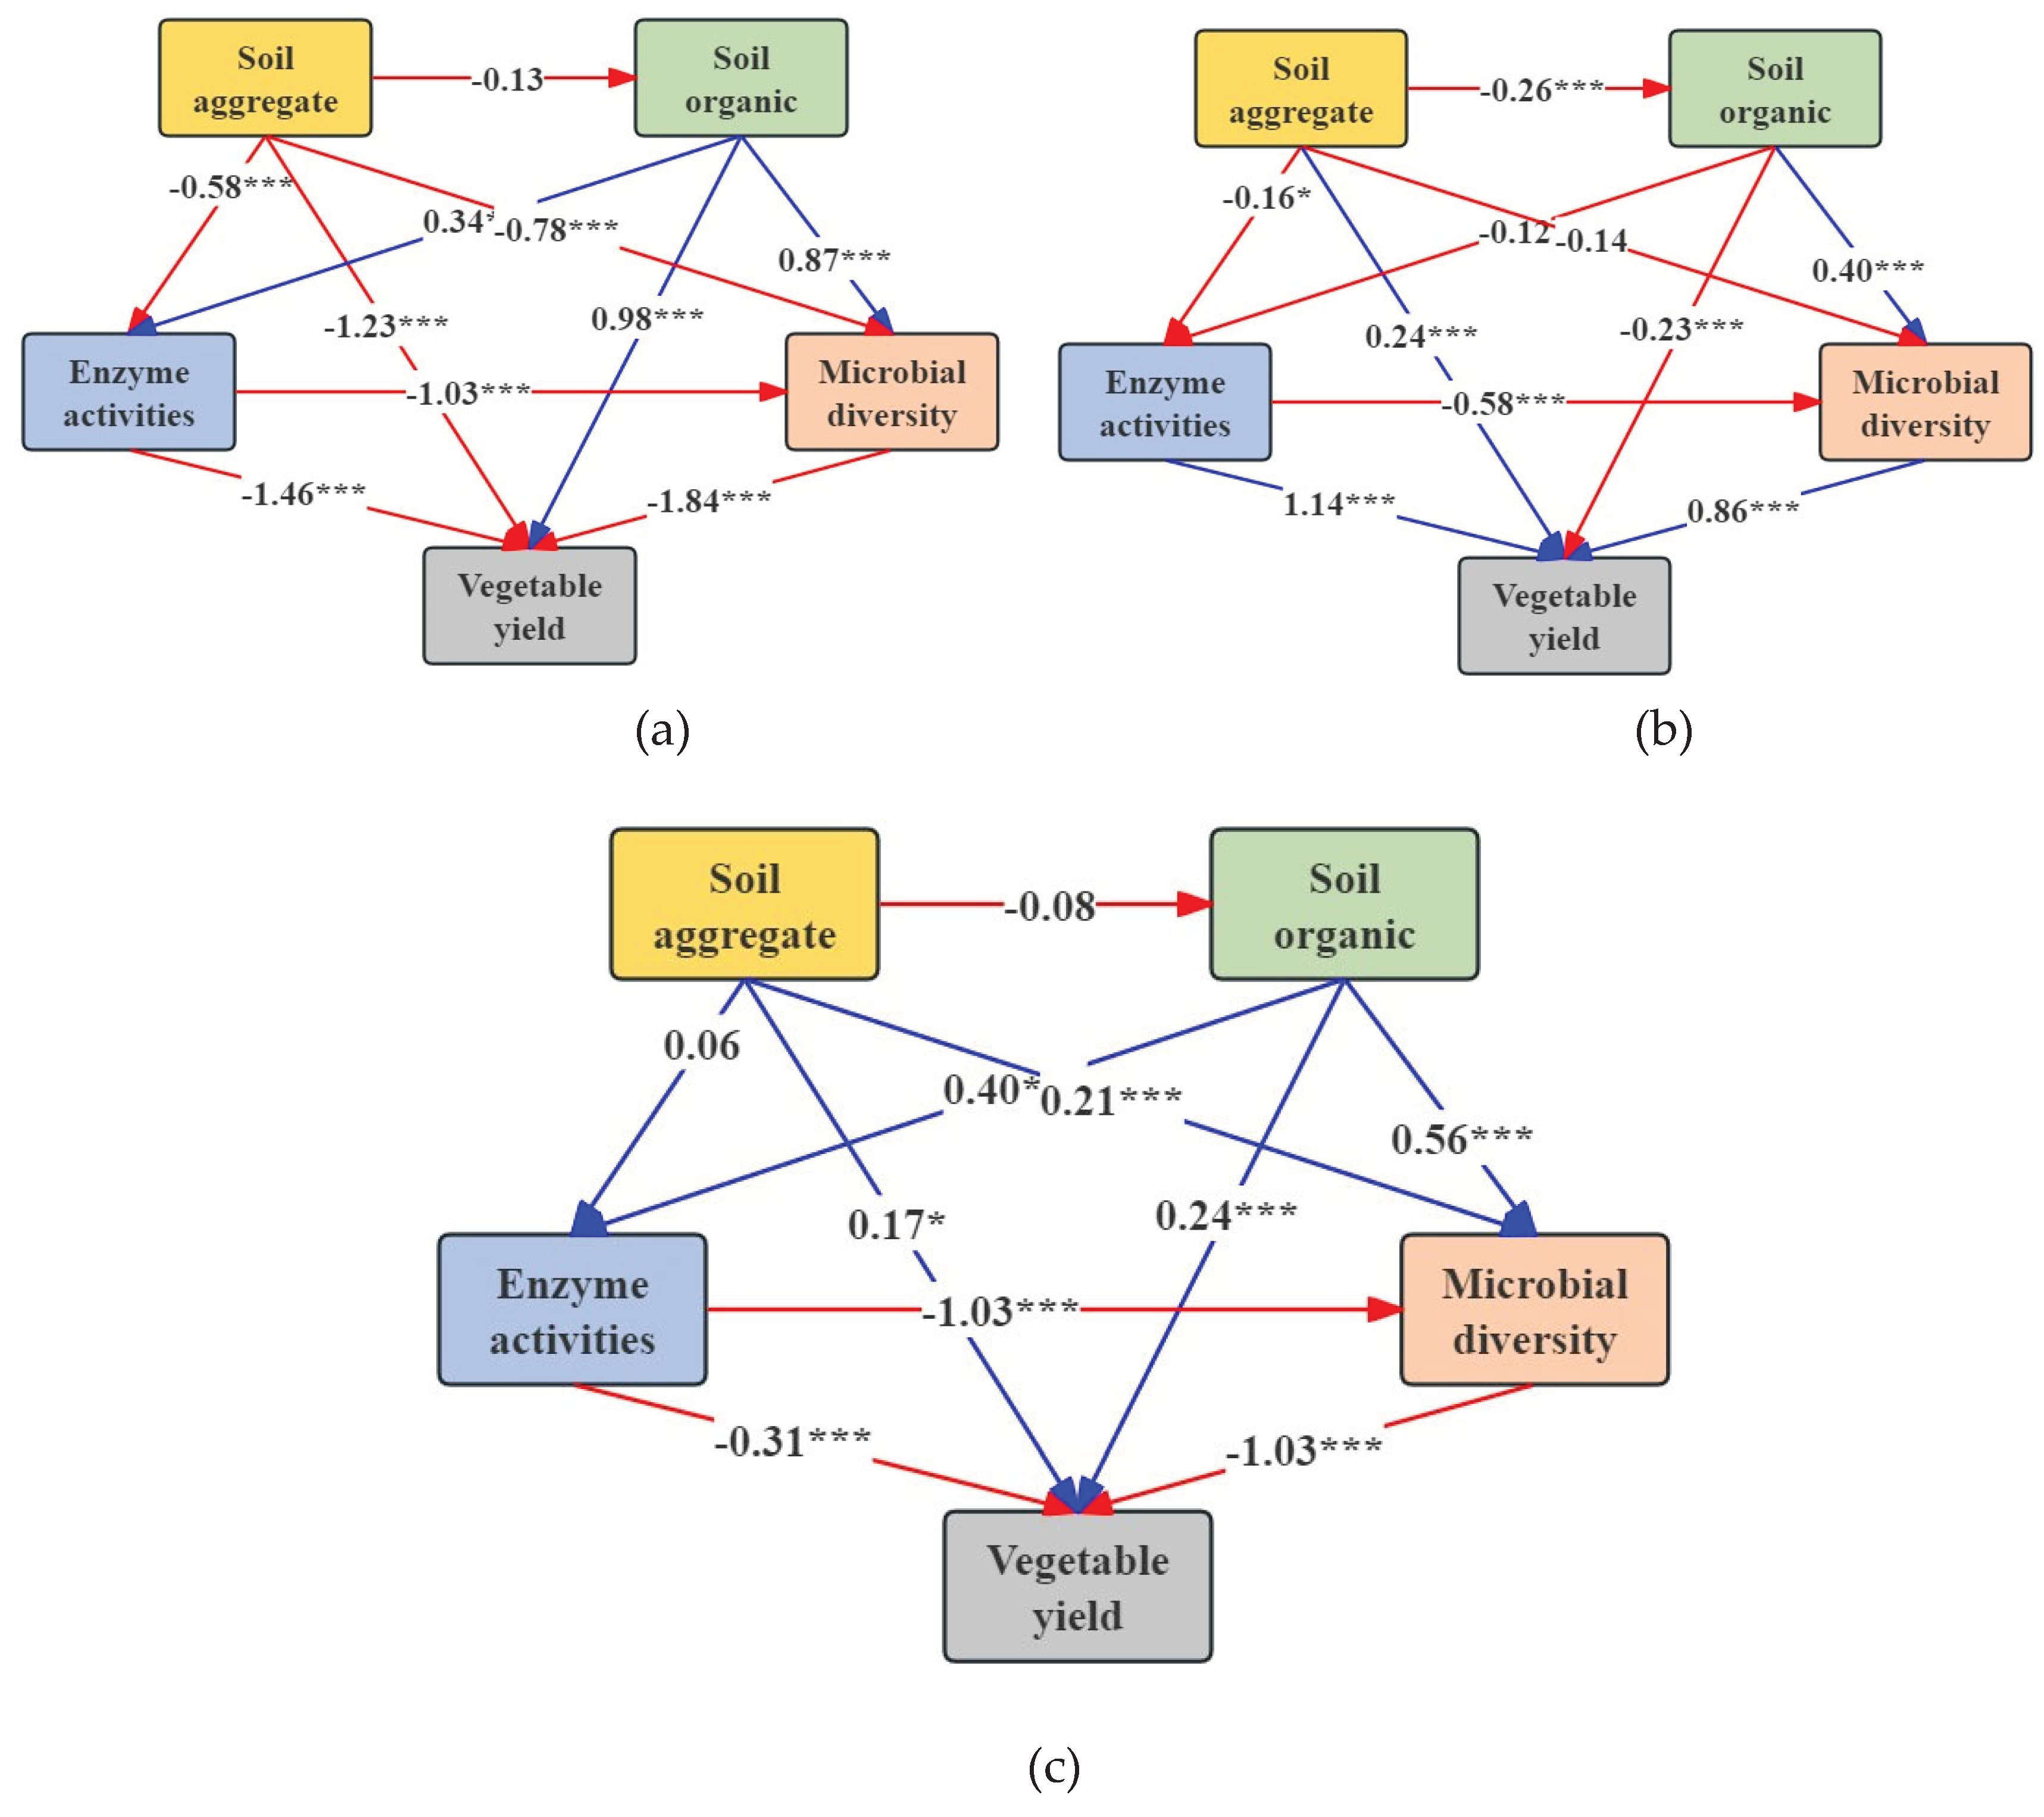
3.5 Quantitative Examination of the Effects of Different Cultivations and Aggregates
4. Discussion
4.1 Organic Cultivation Effects on Soil Aggregation
4.2 Organic Cultivation Effects the Distribution of Organic Carbon Fractions and Enzyme Activity within Aggregate
4.3 Organic Cultivation Effects Microbial Community Composition within Aggregate
5. Conclusions
Supplementary Materials
Author Contributions
Funding
Institutional Review Board Statement
Data Availability Statement
Conflicts of Interest
References
- Tei, F.; De Neve, S.; de Haan, J.; Kristensen, H.L. Nitrogen management of vegetable crops. Agric. Water Manage. 2020, 240, 106316. [Google Scholar] [CrossRef]
- Yuan, Y.; Zhang, X. Comparison of agrochemicals allocation efficiency between greenhouse and open-field vegetables in China. Sci. Rep. 2021, 11, 12807. [Google Scholar] [CrossRef] [PubMed]
- Ti, C.; Luo, Y.; Yan, X. Characteristics of nitrogen balance in open-air and greenhouse vegetable cropping systems of China. Environ. Sci. Pollut. Res. 2015, 22, 18508–18518. [Google Scholar] [CrossRef] [PubMed]
- FAO, Food and Agriculture Organization of the United Nations. 2017.
- Tripathi, S.; Srivastava, P.; Devi, R. S. Chapter 2 - Influence of synthetic fertilizers and pesticides on soil health and soil microbiology, in Agrochemicals Detection, Treatment and Remediation, M.N.V. Prasad, Editor. 2020, Butterworth-Heinemann, 25-54.
- Chen, Z.K.; Muhammad, I.; Zhang, Y.X.; Hu, W.Y.; Lu, Q.Q.; Wang, W.X.; Huang, B.; Hao, M.D. Transfer of heavy metals in fruits and vegetables grown in greenhouse cultivation systems and their health risks in Northwest China. Sci. Total Environ. 2021, 766, 142663. [Google Scholar] [CrossRef] [PubMed]
- Shi, W.; Jing, Y.; Feng, Y. Vegetable cultivation under greenhouse conditions leads to rapid accumulation of nutrients, acidification and salinity of soils and groundwater contamination in South-Eastern China. Nutr. Cycling Agroecosyst. 2009, 83, 73–84. [Google Scholar] [CrossRef]
- Wang, C.N.; Wu, R.L.; Li, Y.Y.; Qin, Y.F.; Li, Y.L.; Meng, F.Q.; Wang, L.G.; Xu, F.L. Effects of pesticide residues on bacterial community diversity and structure in typical greenhouse soils with increasing cultivation years in Northern China. Sci. Total Environ. 2020, 710, 136321. [Google Scholar] [CrossRef] [PubMed]
- Yang, M.; Zhao, X.; Meng, T. What are the driving factors of pesticide overuse in vegetable production? Evidence from Chinese farmers. China Agr Econ Rev. 2019, 11, 672–687. [Google Scholar] [CrossRef]
- Wu, Y.Y.; Xi, X.C.; Tang, X.; Luo, D.M.; Gu, B.J.; Lam, S.K.; Vitousek, P.M.; Chen, D.L. Policy distortions, farm size, and the overuse of agricultural chemicals in China. PNAS. 2018, 115, 201806645. [Google Scholar] [CrossRef]
- Min, J.; Zhang, H.L.; Shi, W.M. Optimizing nitrogen input to reduce nitrate leaching loss in greenhouse vegetable production. Agric. Water Manage. 2012, 111, 53–59. [Google Scholar] [CrossRef]
- Gomiero, T.; Pimentel, D.; Paoletti, M.G. Environmental Impact of Different Agricultural Management Practices: Conventional vs. Organic Agriculture. Crit. Rev. Plant Sci. 2011, 30, 95–124. [Google Scholar] [CrossRef]
- Tuomisto, H.L.; Hodge, I.D.; Riordan, P.; Macdonald, D.W. Does organic farming reduce environmental impacts? – A meta-analysis of European research. J. Environ. Manage. 2012, 112, 309–320. [Google Scholar] [CrossRef] [PubMed]
- Alagöz, E.; Yilmaz, Z. Effects of different sources of organic matter on soil aggregate formation and stability: A laboratory study on a Lithic Rhodoxeralf from Turkey. Soil Till Res. 2009, 103, 419–424. [Google Scholar] [CrossRef]
- Kamran, M.; Nie, J.; Geng, M.J.; Lu, Y.H.; Liao, Y.L.; Zhou, F.L.; Xu, Y.H. Effect of reduced mineral fertilization (NPK) combined with green manure on aggregate stability and soil organic carbon fractions in a fluvo-aquic paddy soil. Soil Till Res. 2021, 211, 105005. [Google Scholar] [CrossRef]
- King, G.M. Enhancing soil carbon storage for carbon remediation: potential contributions and constraints by microbes. Trends Microbiol. 2011, 19, 75–84. [Google Scholar] [CrossRef]
- Reichstein, M.; Bahn, M.; Ciais, P.; Frank, D.; Mahecha, M.D.; Seneviratne, S.I.; Zscheischler, J.; Beer, C.; Buchmann, N.; Frank, D.C.; Papale, D.; Rammig, A.; Smith, P.; Thonicke, K.; van der Velde, M.; Vicca, S.; Walz, A.; Wattenbach, M. Climate extremes and the carbon cycle. Nature. 2013, 500, 287. [Google Scholar] [CrossRef] [PubMed]
- Riestra, D.; Noellemeyer, E.; Quiroga, A. Soil Texture and Forest Species Condition the Effect of Afforestation on Soil Quality Parameters. Soil Sci. 2012, 177, 279–287. [Google Scholar] [CrossRef]
- Purakayastha, T.J.; Rudrappa, L.; Singh, D.; Swarup, A.; Bhadraray, S. Long-term impact of fertilizers on soil organic carbon pools and sequestration rates in maize–wheat–cowpea cropping system. Geoderma. 2008, 144, 370–378. [Google Scholar] [CrossRef]
- Plaza-Bonilla, D.; Álvaro-Fuentes, J.; Cantero-Martínez, C. Identifying soil organic carbon fractions sensitive to agricultural management practices. Soil Till Res. 2014, 139, 19–22. [Google Scholar] [CrossRef]
- Thorburn, P.J. , et al., Changes in soil carbon sequestration, fractionation and soil fertility in response to sugarcane residue retention are site-specific. Soil Till Res. 2012, 120, 99–111. [Google Scholar] [CrossRef]
- Aulakh, C.S.; Sharma, S.; Thakur, M.; Kaur, P. A review of the influences of organic farming on soil quality, crop productivity and produce quality. J. Plant Nutr. 2022, 45, 1–22. [Google Scholar] [CrossRef]
- Gömöryová, E.; Strelcová, K.; Fleischer, P.; Gömöry, D. Soil microbial characteristics at the monitoring plots on windthrow areas of the Tatra National Park (Slovakia): their assessment as environmental indicators. Environ. Monit. Assess. 2011, 174, 31–45. [Google Scholar] [CrossRef]
- Young, I.M.; Crawford, J.W.; Nunan, N.; Otten, W.; Spiers, A. Chapter 4- Microbial Distribution in Soils: Physics and Scaling, in Advances in Agronomy, Academic Press, 2008, 81-121.
- Rillig, M.C.; Muller, L.A.H.; Lehmann, A. Soil aggregates as massively concurrent evolutionary incubators. ISME J. 2017, 11, 1943–1948. [Google Scholar] [CrossRef]
- Tong, L.H.; Zhu, L.; Lv, Y.H.; Zhu, K.; Liu, X.Y.; Zhao, R. Response of organic carbon fractions and microbial community composition of soil aggregates to long-term fertilizations in an intensive greenhouse system. J. Soils Sediments. 2020, 20, 641–652. [Google Scholar] [CrossRef]
- Wang, R.; Liu, J.; Xu, J. ChemInform Abstract: Organocatalytic Enantioselective Sulfur-Michael Addition of Thioacetic Acid to Arylmethylidenemalonates. Adv Synth Catal. 2014, 357, 1. [Google Scholar] [CrossRef]
- Chu, H.J.; Wang, S.P.; Yue, H.W.; Lin, Q.Y.; Hu, Y.G.; Li, X.Z.; Zhou, J.Z.; Yang, Y.F. Contrasting soil microbial community functional structures in two major landscapes of the Tibetan alpine meadow. MicrobiologyOpen. 2014, 3, 585–594. [Google Scholar] [CrossRef]
- Allison, S.D.; Jastrow, J.D. Activities of extracellular enzymes in physically isolated fractions of restored grassland soils. Soil Biol. Biochem. 2006, 38, 3245–3256. [Google Scholar] [CrossRef]
- Abiven, S.; Menasseri, S.; Chenu, C. The effect of organic inputs over time on soil aggregate stability-A literature analysis. Soil Biol. Biochem. 2009, 41, 1–12. [Google Scholar] [CrossRef]
- Jiang, Y.; Sun, B.; Jin, C.; Wang, F. Soil aggregate stratification of nematodes and microbial communities affects the metabolic quotient in an acid soil. Soil Biol. Biochem. 2013, 60, 1–9. [Google Scholar] [CrossRef]
- Fattet, M.; Fu, Y.; Ghestem, M.; Ma, W.; Foulonneau, M.; Nespoulous, J.; Le Bissonnais, Y.; Stokes, A. Effects of vegetation type on soil resistance to erosion: Relationship between aggregate stability and shear strength. Catena. 2011, 87, 60–69. [Google Scholar] [CrossRef]
- Cambardella, C.A.N.S.T.L.; Ames, I.A.; Elliott, E.T. Particulate soil organic-matter changes across a grassland cultivation sequence. Soil Sci Soc Am J. 1992, 56, 3. [Google Scholar] [CrossRef]
- Edgar, R.C.; Haas, B.J.; Clemente, J.C.; Quince, C.; Knight, R. UCHIME improves sensitivity and speed of chimera detection. Bioinformatics. 2011, 27, 2194–2200. [Google Scholar] [CrossRef]
- Kõljalg, U.; Nilsson, R.H.; Abarenkov, K.; Tedersoo, L.; Taylor, A.; Bahram, M.; Bates, S.; Bruns, T.; Bengtsson-Palme, J.; Callaghan, T.; Douglas, B.; Drenkhan, T.; Eberhardt, U.; Dueñas, M.; Grebenc, T.; Griffith, G.W.; Hartmann, M.; Kirk, P.; Kohout, P.; Larsson, K.H. Towards a unified paradigm for sequence-based identification of Fungi. Mol Ecol. 2013, 22, 5271–5277. [Google Scholar] [CrossRef]
- Li, S.S.; Wang, M.; Zhao, Z.Q.; Li, X.Y.; Han, Y.; Chen, S.B. Alleviation of cadmium phytotoxicity to wheat is associated with Cd re-distribution in soil aggregates as affected by amendments. RSC Adv. 2018, 8, 17426–17434. [Google Scholar] [CrossRef]
- Maillard, É.; Angers, D.A. Animal manure application and soil organic carbon stocks: a meta-analysis. Global Change Biol. 2014, 20, 666–679. [Google Scholar] [CrossRef]
- Wang, Y.; Hu, N.; Ge, T.; Kuzyakov, Y.; Wang, Z. L.; Li, Z.; Tang, Z.; Chen, Y.; Wu, C.; Lou, Y. Soil aggregation regulates distributions of carbon, microbial community and enzyme activities after 23-year manure amendment. Appl Soil Ecol. 2017, 111, 65–72. [Google Scholar] [CrossRef]
- Pimentel, D.; Hepperly, P.; Hanson, J.; Douds, D.; Seidel, R. Environmental, Energetic, and Economic Comparisons of Organic and Conventional Farming Systems. J. Biosci. 2005, 55, 573–582. [Google Scholar] [CrossRef]
- Xie, J.; Hou, M.; Zhou, Y.; Wang, R.; Zhang, S.; Yang, X.; Sun, B. Carbon sequestration and mineralization of aggregate-associated carbon in an intensively cultivated Anthrosol in north China as affected by long term fertilization. Geoderma. 2017, 296, 1–9. [Google Scholar] [CrossRef]
- Cotrufo, M.F.; Wallenstein, M.D.; Boot, C.M.; Denef, K.; Paul, E. The Microbial Efficiency-Matrix Stabilization (MEMS) framework integrates plant litter decomposition with soil organic matter stabilization: do labile plant inputs form stable soil organic matter? Global Change Biol. 2013, 19, 988–995. [Google Scholar] [CrossRef]
- Lal, R. Soil Carbon Sequestration Impacts on Global Climate Change and Food Security. Science. 2004, 304(5677), 1623–1627. [Google Scholar] [CrossRef]
- Jastrow, J.D.; Amonette, J.E.; Bailey, V.L. Mechanisms controlling soil carbon turnover and their potential application for enhancing carbon sequestration. Clim. Change. 2007, 80, 5–23. [Google Scholar] [CrossRef]
- Yu, H.; Ding, W.; Luo, J.; Geng, R.; Cai, Z. Long-term application of organic manure and mineral fertilizers on aggregation and aggregate-associated carbon in a sandy loam soil. Soil Till Res. 2012, 124, 170–177. [Google Scholar] [CrossRef]
- Marx, M.C.; Kandeler, E.; Wood, M.; Wermbter, N.; Jarvis, S.C. Exploring the enzymatic landscape: distribution and kinetics of hydrolytic enzymes in soil particle-size fractions. Soil Biol. Biochem. 2005, 37, 35–48. [Google Scholar] [CrossRef]
- Börjesson, G.; Menichetti, L.; Kirchmann, H.; Kätterer, T. Soil microbial community structure affected by 53 years of nitrogen fertilisation and different organic amendments. Biol. Fertil. 2012, 48, 245–257. [Google Scholar] [CrossRef]
- Fanin, N.; Hättenschwiler, S.; Fromin, N. Litter fingerprint on microbial biomass, activity, and community structure in the underlying soil. Plant Soil. 2014, 379, 79–91. [Google Scholar] [CrossRef]
- Huygens, D.; Denef, K.; Vandeweyer, R.; Godoy, R.; Van Cleemput, O.; Boeckx, P. Do nitrogen isotope patterns reflect microbial colonization of soil organic matter fractions? Biol. Fertil. 2008, 44, 955–964. [Google Scholar] [CrossRef]
- Duchicela, J.; Sullivan, T.S.; Bontti, E.; Bever, J.D. Soil aggregate stability increase is strongly related to fungal community succession along an abandoned agricultural field chronosequence in the Bolivian Altiplano. J Appl Ecol. 2013, 50, 1266–1273. [Google Scholar] [CrossRef]
| Treatments | SOC g kg-1 |
Total N g kg-1 |
Total P g kg-1 |
Available N mg kg-1 |
Available P mg kg-1 |
Available K mg kg-1 |
|---|---|---|---|---|---|---|
| OC | 11.08 | 1.17 | 1.38 | 101.28 | 139.13 | 257.30 |
| IC | 9.60 | 1.19 | 1.24 | 95.35 | 81.68 | 364.28 |
| CC | 12.18 | 1.36 | 2.22 | 128.38 | 163.05 | 212.83 |
Disclaimer/Publisher’s Note: The statements, opinions and data contained in all publications are solely those of the individual author(s) and contributor(s) and not of MDPI and/or the editor(s). MDPI and/or the editor(s) disclaim responsibility for any injury to people or property resulting from any ideas, methods, instructions or products referred to in the content. |
© 2024 by the authors. Licensee MDPI, Basel, Switzerland. This article is an open access article distributed under the terms and conditions of the Creative Commons Attribution (CC BY) license (https://creativecommons.org/licenses/by/4.0/).


