
Submitted:
29 March 2024
Posted:
03 April 2024
You are already at the latest version
Abstract
Rebar quantity estimation is pivotal for determining the cost of construction projects and essential for bidding purposes. A bar bending schedule plays a crucial role by providing rebar information and bending instructions, facilitating efficient procurement. Traditional methods of bar bending schedules, which involve manual extraction from 2D (two-dimensional) drawings, are error-prone and hinder construction productivity. This study proposes a Building Information Modeling (BIM)-based algorithm that automates the generation of a Bar Bending Schedule (BBS) directly from the 3D (three-dimensional) BIM models, ensuring accuracy and eliminating manual errors. The effectiveness of the algorithm was verified by comparing the rebar quantities generated by the model against those derived from optimization calculations. The results demonstrated a mean absolute error of 0.017 and a mean absolute percentage error of 1.13%, validating the algorithm’s precision. Additionally, it achieved a remarkable 33.33% reduction in the manpower required for preparing BBSs, highlighting its potential to revolutionize construction workflow efficiency and accuracy.
Keywords:
BIM
; rebar work
; bar bending schedule
; special length
; automation
1. Introduction
Cost estimation is an essential aspect of determining the project expenses and making decisions before the initiation of the construction stage. Rebar cost reaches a significant portion of 16% of the overall project cost in reinforced concrete structures [1]. Estimating rebar quantity requires meticulous calculation since it leads to greater rebar consumption than required for the project, resulting in increased material waste and additional costs [2]. Rebar quantity is determined by the bar bending schedule (BBS) supplied by the structural designer or obtained from the steel mill [3]. Preparing BBS requires detailed data to generate accurate rebar requirements, including the length, amount, and shape of each rebar. It also determines the total weight of all rebars required for a building structure [4].
One factor that influences the efficiency of BBS is the building codes provision for rebar detailing such as regulations for lap splices, development length, hook lengths, bar spacing, and concrete cover. The building codes used are varied depending on the location or country where the project occurs. For instance, in the United States, guidelines for rebar detailing are provided by ACI [5], in the United Kingdom, the guidelines are provided by BSI [6] and Eurocode [7], while KDS [8] is utilized in South Korea, and JSCE [9] in Japan. In addition, bend deduction is crucial to obtain the exact rebar length required for a specific rebar shape [2,10]. The rebar tends to elongate more than its length when it is bent. An excess length of rebar is yielded unless the bend deduction is considered for cutting the rebar. Hence, the building codes and bend deduction play a significant role in enhancing the accuracy of the BBS and rebar quantity estimation process.
Structural design and analysis are conducted after the completion of architectural design along with the preparation of drawings and reports [11], which is time-consuming and labor-intensive. In the conventional method of BBS preparation, the estimator must check every drawing meticulously to determine rebar quantities, ensuring not to omit or double-count items [12]. Material waste in construction is considered to happen in the procurement phase, material handling phase, and design phase [2,13]. Although a safety factor is considered in the structural design, the designer may increase the quantity or length of rebars as additional safety measures. [2]. Even though excess rebar quantity is estimated more than what is required in the design stage, a reliable and accurate BBS can minimize the rebar waste [14]. Therefore, it is essential to adopt advanced technologies to enhance the accuracy of BBS and to optimize the estimation process.
Building information modeling (BIM) has gained significant traction in Architecture, Engineering, and Construction (AEC) due to its capabilities in coordination, visualization, and simulation of building projects [12,15]. BIM-based software applications can extract information from the model to perform quantity take-off for cost estimation [15]. BIM models store dimensional data within the 3D model itself and measurements and material quantities can be extracted from the model, reducing time spent on take-offs by up to 80% compared to traditional methods [12]. BIM also provides consistent updates of data information to changes made to the model and enables the rebar arrangement automatically, generating the required rebar quantity. To ensure the required length and quantity of rebars for BBS, BIM can be implemented at the design stage once the structural analysis is completed. However, the BIM model cannot provide all the data requirements for quantity estimation, necessitating manual data input to the model. Application Program Interface (API) can be employed to import data and update the model automatically or exchange information between BIM and other software, ensuring the accuracy of estimating materials in BIM applications [15,16].
Multiple research projects have been conducted on rebar waste optimization on columns [17,18]], beams [11,19], and diaphragm walls [20], which are the main structural members in the construction. Among them, diaphragm walls consume an enormous amount of rebar, as well as require diverse types of rebar for different purposes in fabrication, including links, stiffeners, spacers, fixing rebars, suspension hooks, starter bars, etc. It is also essential to optimize rebar waste and usage in diaphragm walls since they are constructed in large infrastructures such as bridges, tunnels, and subway stations. Therefore, the diaphragm wall is a suitable case subject for the BBS generation algorithm. Once the proposed algorithm is verified in the diaphragm wall’s BBS, it can be applied to other structural elements, contributing to practical implementation in the ACE industry to save rebar waste and cost.
1.1. Rebar Procurement
Before enhancing the efficiency of a BBS, it is necessary to understand the existing process of rebar procurement. Rebar procurement comprises various critical steps. As depicted in Figure 1, after the completion of structural analysis and design, 2D structural drawings and documents are created, followed by shop drawings. These project shop drawings are analyzed to prepare a BBS which determines the required rebar quantities for a particular project. The BBS needs to be meticulously prepared to avoid wastage and unnecessary additional costs [21]. Estimating rebar quantity and cost is also vital for bidding projects [11]. The next step is to order the required rebars, ensuring the ordered rebar quantity matches the calculated demand accurately to prevent shortages or surplus [22], minimizing the occurrence of waste. Once the rebars have been ordered, the rebar processing and installation can be conducted.
BBS plays a crucial role in rebar procurement since it determines the quantity of rebar for cost estimation and provides instructions for fabricating rebar shapes. The subsequent step, often referred to as rebar work, involves preparing the rebar for use in the construction project, which includes cutting, bending, and storing the rebar pieces according to the project requirements. Efficient coordination is essential in the construction phase to ensure that rebars are correctly and safely installed. The entire process of rebar procurement requires meticulous scheduling and coordination to avoid delivery delays, requiring collaboration between various organizations, such as suppliers, logistics, project teams, and onsite construction teams.
1.2. Related Literature
The primary reason to enhance the accuracy of BBS is to prevent misuse of rebars and reduce material waste and cost in construction projects. Nigussie and Chandrasekar [2] conducted a questionnaire survey regarding the factors that influence rebar wastage on sites. One factor involves not optimizing the use of stock rebars supplied by manufacturers. In practice, the bar benders cut the rebar longer than the given length to accommodate for any mistakes or uncertainties in the construction process, creating unusable short pieces and leading to unnecessary rebar wastage and material cost.
Cutting patterns have been optimized in stock length rebars to reduce unusable rebar waste in multiple studies [1,17,23,24,25]. These approaches, however, did not achieve rebar wastage less than the common range of 3-5% [10,26], since their optimization was restricted to the lap splice position regulations mandated by the building codes [20]. Using stock-length rebars reflecting those regulations results in limited flexibility and potential material waste. Furthermore, it is difficult to follow these regulations in practice and lap splices in columns are placed on top of the floor slab to ease the construction process [27]. Therefore, rebars are often cut depending on the floor height rather than following the precise regulations, leading to additional rebar waste. The study by Widjaja et al. [27] also investigated that the positions of lap splice can be adjusted in the structural member, offering an equal level of structural strength and stability as in the designated areas by the building codes.
Recent studies [11,20] utilized special length rebars to minimize rebar waste in beams and diaphragm walls. Widjaja and Kim [11] minimized rebar consumption and cutting waste in beam members by a two-stage optimization algorithm using special length and achieved 0.93% rebar cutting waste. The study by Rachmawati et al. [20] also resulted in near-zero rebar cutting waste by 0.77% in reducing cutting waste of diaphragm wall rebars by a three-step heuristic algorithm, considering the special length and the flexibility of lap splice position. It has been sufficiently proved that special length prioritization over stock length offers a significant reduction in rebar waste. These studies used a BBS retrieved from the BIM model as the data source, however, did not mention the detailed process of the BBS preparation. This gap is critical since the optimization algorithms rely on the rebar information, especially bar lengths and number of bars, derived from the BBS. A detailed BBS preparation process ensures accurate waste calculation and facilitates the practical implementation of their findings in the construction industry.
In previous studies [28,29] the application of API has been pivotal in the development of plugins and new user interfaces within Autodesk Revit, using programming languages such as C# and Python. Wang and Hu [28] focused on the automatic generation of rebar parametric models to enhance the modeling efficiency and accuracy for reinforced concrete columns, while Li et al. [29] developed a user interface for handling variable cross-section columns through Revit API. Additionally, the studies [15,16] introduced a BIM-based quantity takeoff through API integration. Taghaddos et al. [16] estimated the volume and weight of different structural steel elements and piping by integrating Navisworks and API. Similarly, Sherafat et al. [15] applied API in multiple BIM applications, including Revit, Tekla, and Navisworks, to facilitate the accurate extraction of rebar quantities, demonstrating the capability to transfer models across different software platforms efficiently. Our study utilized only the Revit software platform by employing API for data mapping to automate the generation of a BBS, thereby minimizing manual input errors, and streamlining the rebar procurement.
1.3. Research Objectives
As shown in Figure 1, the current practice of preparing BBS relies on extracting information from 2D computer-aided design (CAD) drawings or paper-based shop drawings [15,30], which often leads to wrong interoperation and deficits of wrong input via manual tasks, consequently, results in miscalculations of exact rebar quantities Recent studies [11,20] investigated the extraction of BBS from BIM models for rebar optimization. However, this approach can inherit inaccuracies from the initial BBS, leading to suboptimal and potentially inaccurate rebar selection due to data inconsistencies. Recognizing this limitation, this study proposes an innovative approach: an enhanced BIM-based BBS generation algorithm integrated with a special length prioritization strategy, considering optimization before model creation. This optimization-first approach minimizes data transitions, thereby reducing error propagation and ensuring consistency between the BBS and subsequent rebar procurement. Therefore, in this study as depicted in Figure 2, a structural 3D model was created after optimization, and required additional data was linked using API, as well as BS shape code [31] applied to the model for exact rebar lengths after bend deduction. Subsequently, a BBS including rebar information and bending shape was automatically extracted from the model, providing accurate and reliable rebar quantity for order requirements. Consequently, the proposed approach is further expected to reduce the time and number of manpower required compared to the manually prepared method in addition to the enhanced accuracy. This study can assist fellow researchers and engineers with the benefits of using special lengths and the detailed process of BBS preparation through a BIM model automatically, including the application of shape codes, data mapping, and automating the schedule.
2. Materials and Methods
Figure 3 illustrates the descriptive algorithm of this study to automatically generate a BBS considering special-length rebar optimization and BIM.
- (1)
- Initially, the main data set was prepared from the structural design and analysis or in some cases, structural drawings.
- (2)
- The data set includes information on building structural frames such as dimensions, locations, and connections of structural members, and rebar information such as bar size, bend diameter, bar spacing, amount of rebar, and concrete cover of each structural element.
- (3)
- The prepared information was reviewed with the regulations of the relevant building codes to ensure structural integrity.
- (4)
- The rebars were optimized in special length priority for optimal rebar usage and cutting waste, generating special lengths and amounts of rebars.
- (5)
- A structural 3D BIM model was created in Autodesk Revit and rebars were added to each element. The rebar arrangement was detailed, especially the lapping area, anchorage, and bend.
- (6)
- After detailing the rebar arrangement, rebar shapes were analyzed and identified through bar type, bar mark, and bar shape respectively.
- (7)
- Consequently, all the rebar shapes were applied with BS shape codes, which determine the exact length of the rebar after bend deduction.
- (8)
- The BIM model cannot provide all the data required for rebar quantity calculation in Revit. An additional data set, rebar unit weight, was linked to the BIM model, using Revit API, which was created through Python script.
- (9)
- Once the BIM model was completed with all the above steps, a BBS was generated automatically through managing Revit properties. The generated BBS shows rebar specifications, including bar type, bar mark, bar size, number of rebars, bar length, bar shape with segment dimensions, and bar weight.
The algorithm’s effectiveness was verified in a case study to automate a BBS and the generated rebar quantities were compared to the optimization results for error analysis.
2.1. Special-Length-Priority Rebar Optimization for Diaphragm Wall Rebars
2.1.1. Optimization of Main Rebars
The diaphragm wall is typically reinforced with different diameter rebars throughout the entire depth with smaller diameter rebars as the wall becomes deeper. Before model creation, all rebars, particularly the continuously arranged rebars of the same diameter within each layer, were optimized for special lengths. This optimization focused on the main rebars due to their continuous arrangement and significant impact on material usage. Equations (1) to (3) were adapted from the study [20] for special length optimization.
where, is the total length of wall rebar in the same diameter; is the length of rebar i; and r is the upper limit of the summation, which is the total number of rebar considered in the total length calculation; is the new number of required rebars and is the optimal reference length (maximum rebar length available in the market); and is the special length of the rebar.
Equation (1) calculates the total length of the same diameter rebars in each layer. Equation (2) determines the new number of required rebars in the total length, by dividing the total length by the reference length available in the market. In South Korea for example, 12 m is regarded as the longest market length. Special length was calculated in Equation (3), by dividing the total length by a new number of required rebar.
2.1.2. Optimization of Remaining Rebars
To achieve optimal rebar usage and the least cutting waste, the remaining rebars were also combined in special length cutting patterns. This was done by using the minimization function in Equation (4), adopted from the study [26]. Equations (5) to (9) are the constraints for special length order requirements. in Equation (5) represents the cutting pattern of rebars in the same diameter (). Equation (6) ensures that the number of cutting patterns ‘i’ must be an integer and greater than zero. The special length must not be shorter than the minimum length () and not longer than the maximum length (), as shown in Equation (7). The total ordered rebar quantity must be greater than the minimum rebar quantity for a special length order, as in Equation (8). Furthermore, Equation (9) indicates that the generated loss rate must be less than the target loss rate. According to the study by Lee et al. [26], a special length can be ordered within the range of 6 m to 12 m, with a minimum rebar quantity of 50 tons in South Korea.
where is the special-length cutting pattern; is the length of cutting pattern i obtained by combining various rebar lengths; represents the number of rebar combinations with the same cutting pattern i; is the minimum length for the special length order requirement; is the maximum length for the special length order requirement; is the minimum rebar quantity for the special length order; represents the total purchased rebar quantity; is the rebar loss rate of the special length cutting pattern; and is the target loss rate, which is less than 1%.
0 < ni, i = 1, 2, 3, …, N
2.2. Revit API Application
Revit API is a set of tools and functions provided by Autodesk Revit for BIM. This can be used for automating repetitive tasks, checking errors automatically, extracting data, importing external data to create new parameter values, and integrating with other applications. Revit API can be managed through programming using .NET languages (VB.NET, C#), and Python language. To perform a particular task, the script or program can be developed using an environment such as Visual Studio or Revit Add-Ins which interact with the software through API. It is necessary to ensure that the Autodesk Revit Program directory contains two DLLs (Dynamic Link Libraries); RevitAPI.dll and RevitAPIUI.dll [32]. The first one contains methods used to access Revit’s application, documents, elements, and parameters at the database level, and the second includes the interfaces related to the manipulation and customization of the Revit user interface.
Rachmawati et al. [20] performed rebar quantity take-off in the Revit model by inserting the required data of rebar unit weights into the model manually. This method requires more time and is error-prone if the project data is complicated. In this study the external unit weight data required for quantity calculation was linked to the model through Revit API, in which the data was assigned to respective rebar elements, eliminating the manual input, and reducing the time required.
3. Case Application
The prior study [20] achieved Near-zero Rebar Cutting Waste (N0RCW) for diaphragm walls using a three-step optimization algorithm applied to rebar information extracted from the BIM model (BBS). However, the study lacked clarity on the process of preparing the rebar data within the BIM model, potentially limiting the generalizability of their findings. This study addresses this gap by focusing on BBS preparation within the BIM model to enhance accuracy by implementing a diaphragm wall for analysis. Unlike the prior study which optimized rebars based on the retrieved data, this method proposes preparing a BBS directly and automatically in the model. The efficiency of this approach is compared to the results of the optimization on a diaphragm wall case study.
3.1. Case Study Overview
Diaphragm walls, serving as crucial structural components, utilize prefabricated rebar cages, incorporating various elements like main rebars, links, spacers, stiffeners, and additional rebars for hanging and lifting. This approach, due to the extensive rebar usage and intricate detailing, stands as a good example of comprehensive BBS preparation. The case study diaphragm wall is part of an interchange station, comprised of 293 primary wall panels. Each panel measures 6 m in length, 1 m in thickness, and 37.58 m in overall depth. Three-floor levels are connected to the diaphragm wall. High-strength steel rebars with a tensile grade of 500 MPa (denoted as ‘H’) were consistently employed for the entire reinforcement. The rebar cage itself utilized six distinct rebar diameters: H40, H32, H25, H20, H16, and H13. Table 1 summarizes the attributes of the primary wall panel.
The case study wall panel employed two identical rebar cages, each built from four sections. Within each cage, EX-links and C-links provided lateral restraint for the main vertical rebars, as demonstrated in Figure 4(a). The starter bars facilitated the anchorage of the floor’s reinforcement to the cages. Other additional rebars such as stiffeners, fixing rebars, and spacers strengthened the cage and prevented it from deformation. As shown in Figure 4(b), the main vertical rebars were organized into layers A, B, D, and E. Notably, layers A and D spanned throughout the entire rebar cage, while layers B and E terminated at the second cage section. Unique rebar marks distinguished the individual rebars, for instance, ‘A1′ indicated the rebar in layer A of the first cage. H40 and H32 diameter rebars were utilized as main rebars: H40 in first, second and third cages (A1, A2, B1, B2, D1, D2, D3, E1, E2), while H32 in third and fourth cages (A3, A4, D3a, D4).
3.2. Application of the Proposed Algorithm
Initially, the rebar specifications of the case study were checked with building code regulations for rebar diameter, rebar cover, and lapping length to prepare the primary data source for the optimization process. For further details, the primary rebar data is presented in Appendix Table A1.
3.2.1. Special-Length-Priority Optimization
Subsequently, special-length-priority optimization was conducted on main rebars by using Equations (1) to (3), on the same diameter rebars, continuously arranged in the same layer, as mentioned in Section (2.1.1). Table 2 depicts the results of the main rebar optimization.
Then, cutting pattern optimization was performed on the remaining rebars, following Equations (4) to (9). For rebar combinations to a particular cutting pattern in Equation (5), an application known as Cutting Optimization Pro [34] was used to automate the process for optimal cutting patterns. The generated special lengths from rebar combinations are summarized in Table 3.
After special length optimization was performed on both main rebars and the remaining rebars of the diaphragm wall, the results were expanded for 293 panels of the diaphragm wall and summarized in Table 4.
From Table 4, it was observed that the optimization achieved N0RCW by 0.77% in diaphragm wall rebars and all the special lengths complied with the constraints for special length order requirements, Equation (5) to (9). The findings of special-length-priority optimization are also compared to the original rebar quantities ordered in stock lengths to analyze the differences in rebar usage and cutting waste, as depicted in Table 5. It was observed that 3000.22 tons (13.3%) of rebar can be saved by using special length rebars instead of stock lengths.
3.2.2. BBS Preparation in Revit
A 3D structural model of the diaphragm wall panel was created in Revit Autodesk 2024, incorporating the optimized special lengths determined for the main rebars. While the remaining rebars were also optimized for special length cutting patterns, their individual lengths were detailed within the model. All the rebars were well-defined with corresponding rebar types, bar marks, and shapes, and further enhanced by incorporating BS shape code formulas into the rebar shape parameter to facilitate bend deduction.
The BBS in this study encompassed crucial information including description (type of rebar), bar mark, bar diameter, unit weight, number of rebars, bar length, bending instruction, and rebar weight. Notably, the conventional method entails the preparation of BBS through Revit properties after completing the structural model with a detailed rebar arrangement. This approach necessitates manual input of individual unit weight values of each rebar diameter. In this study, the unit weight was assigned to each rebar type by using Revit API. A Revit add-in, Revit Python Shell was selected as an environment to run the script for data mapping. Initially, a new ‘type’ parameter was created in Revit to enable data mapping within the script. The developed script is written in pseudocode.
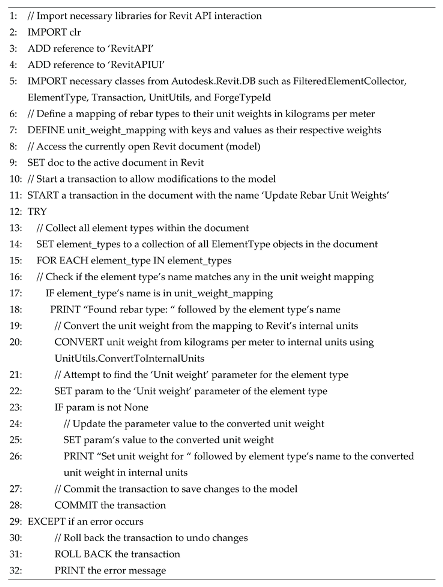
The Python script shown above was explained as follows:
- (1)
- The script begins by importing required libraries and setting up references to Revit API to enable access to Revit’s functions and data.
- (2)
- A dictionary is defined as ‘unit_weight_mapping’, where the keys represent the names of rebar types, and the values are their corresponding unit weights in kg/m.
- (3)
- The script accesses the currently opened Revit document which will be modified.
- (4)
- A transaction is started to allow modifications to the Revit model, ensuring data integrity and allowing undo/redo actions. This repeats the process of selecting a rebar type in the model and maps with the corresponding unit weight in data input. If a rebar type is found, the script proceeds to convert its unit weight from kg/m to Revit’s internal unit system using a conversion function since Revit stores data in its internal units rather than standard metric or imperial units.
- (5)
- The ‘try…except’ block is used for error handling to avoid corrupting the model if an error happens.
- (6)
- The transaction is committed to save all changes to the model if all the operations in the try box are achieved. The rollback operation is executed to undo any changes made during the transaction if any error happens during the process.
- (7)
- The script prints an error message if an exception is found, providing feedback.
Following script execution in Revit Python Shell, the created ‘Unit weight’ parameter within the Revit model received automatic assignment of the corresponding data input. This enabled the subsequent, automatic generation of a BBS, leveraging Revit properties. The comprehensive process of the proposed BBS preparation is illustrated in Figure 5 for rebar layer A. Aligned with the descriptive algorithm (Figure 3), the collected rebar information was checked with regulations to ensure structural stability, followed by special-length-priority optimization. Subsequently, a 3D BIM model was built including detailed rebar arrangement in Revit. Analysis of rebar shapes and application of BS shape codes were conducted, enabling the determination of the precise cutting lengths for each rebar. To facilitate the calculation and inclusion of rebar weight within the BBS, Revit API was employed to integrate rebar unit weight data. This necessitated the creation of a new parameter dedicated to unit weight within Revit. A custom script was then developed to both select the required rebar types within and model and assign the given data to the newly created parameter. Script execution granted access to the Revit API, leading to the automatic input of rebar-type unit weights. Consequently, a BBS was generated automatically through Revit properties.
3.3. Analysis of Mean Absolute Error (MAE) and Mean Absolute Percentage Error (MAPE)
It was essential to verify that the proposed method enhances the accuracy of BBS. MAE measures the average magnitude of errors in a set of observations, and it is calculated as the average of the absolute differences between the predicted values and the observed values as in Equation (10) [35]. The higher the MAE value, the larger the errors in observations. The rebar weights of the main rebars of special-length-priority optimization and the remaining rebars were compared to the rebar weights generated from the BIM model for the analysis of MAE. Furthermore, MAPE, which shows the percentage of error was also calculated in Equation (11) [36].
where is the number of observations; is the actual value; is the predicted value; is the absolute error of each observation.
Table 5 depicts the difference between the predicted value of rebar weights from optimization and the actual value generated in Revit. MAE was calculated as 0.017, dividing the total difference by 43 rebar types. MAPE reached 1.13% obtained by dividing the total percentage difference by the number of rebar types. These results demonstrate the algorithm’s accuracy in estimating rebar weights within Revit.
3.4. Time Analysis between the Manual and Proposed Method
The conventional method employed in the prior study [20] necessitated manual input of rebar unit weight data into the Revit model for weight calculations. This process, inherently time-consuming, was compared to the proposed method in terms of time efficiency. Table 6 presents a comparison of the required data input times. This case study, involving 43 different rebars and 6 rebar diameters, highlighted the efficiency of the proposed method. While manual input took a reasonable two minutes, the script-based approach using Revit API achieved data mapping in just one second. This efficiency gain becomes more significant for larger projects with numerous rebars and diameters, where manual input time could escalate dramatically. In addition, the proposed method eliminates human error risks, ensuring accuracy.
3.5. Manpower Analysis between the Manual and Proposed Method
The conventional method for creating a BBS requires an engineer to develop a structural design, an individual to translate the design into detailed 2D drawings, and another individual to meticulously extract rebar information from the drawings for BBS generation. This method relies on multiple individuals as the project becomes larger and manual data entry and interpretation of drawings lead to discrepancies and inaccuracies in the final BBS. The fragmented process of each individual also limits collaboration and communication between design and BBS preparation.
Meanwhile, a BIM model can be created directly from the structural design information, integrating modeling and BBS generation within a single environment, and the need for drawings and manual rebar data collection is eliminated. The BIM model provides a direct link between design and rebar data, reducing errors due to manual data input and misinterpretation. The use of Revit API also assists in rebar quantity calculation and the final BBS is generated automatically including rebar lengths, quantities, and rebar shape sketches with dimensions. Table 7 shows the manpower analysis between the conventional and the proposed method of the case study diaphragm wall. The BIM-based method eliminated the need for structural drawings preparation, minimizing the manpower by 33.33%.
4. Discussion
This research focused on the automatic generation of BBS from the structural model, ensuring accurate rebar cutting lengths. The modeling was performed in a BIM environment, Autodesk Revit, where rebars were manually arranged and lap splices detailed. To obtain the precise rebar length, BS shape codes were applied as length calculation formulas within rebar parameters, resulting in shorter rebar lengths compared to their original lengths due to rebar elongation from bending. In addition, unit weights of rebar were linked to the corresponding rebar diameters within the model, ensuring data accuracy for rebar quantity (weight) calculation. Consequently, a BBS including rebar diameter, number of rebar, quantity (weight), and bending instructions, was generated automatically from the model through Revit properties.
A prior study [20] optimized cutting waste in diaphragm wall rebars considering special lengths and achieved a significant waste rate of 0.77%. The optimization was based on rebar data extracted from a BIM model which was manually created. Subsequently, the model was updated with generated optimization results for data consistency. The manual modeling of rebar arrangement is a time-consuming process depending on the project’s scope, and prone to human errors such as misplacement of rebars, and incorrect rebar diameters and spacings, therefore, it requires to be meticulous to avoid miscalculation of rebar quantities and weights. Moreover, manual updates and changes to the model become impractical for large-scale projects with extensive rebar usage. This challenge was addressed by applying special length rebar optimization to the dataset before modeling, significantly reducing the time spent on model updates.
The accuracy of the proposed BIM-based BBS generation algorithm was verified using MAE and MAPE, which were calculated from the predicted value and the actual value. The rebar quantities of each rebar type in the generated BBS were regarded as the actual values and the predicted values were considered as the rebar quantities after special length optimization considering BS shape codes for the consistency of comparison. The process yielded a MAE of 0.017 and a MAPE of 1.13%, indicating high accuracy. In addition, the special-length-priority optimization resulted in 13.3% savings in ordered rebar weight compared to the original ordered rebar in stock lengths. Although the proposed algorithm reduced rebar consumption and delivered reliable BBS, its reliance on manual modeling introduces potential for errors, particularly in detecting rebar clashes in complex reinforcement models.
Rebar arrangement in BIM models can be automated in Revit by integrating with Revit API through custom scripting in programming languages, or by visual programming with Dynamo. Recent studies [28,29] utilized API to enable the automatic generation of rebar parametric models in Revit with enhanced modeling efficiency and accuracy. Meanwhile, Liu et al. [37] explored BIM-based clash-free rebar design using Dynamo. Automating rebar arrangement significantly reduces the time required for manual rebar adjustments and increases productivity. By defining precise rules and parameters for rebar arrangements, the risk of human error is eliminated. Furthermore, the model can be automatically updated if any change is made to the script. Therefore, the proposed algorithm can be integrated with the automation of rebar arrangements in further studies to enhance overall quality and efficiency.
5. Conclusions
The automatic BBS generation algorithm aims to enhance the accuracy of rebar quantities (weights) and cutting lengths, ensuring optimal rebar usage. The diaphragm wall was selected as a case study since its reinforcement is comprised of various rebar types than the other structural components, making it an exemplary case study for preparing a BBS. Once rebar information was collected from structural shop drawings, the main rebars of diaphragm walls were optimized in special lengths, reducing rebar cutting waste. The remaining rebars were then combined into special length cutting patterns in the same rebar diameter. Consequently, a 3D structural modeling was performed in Autodesk Revit 2024 with the generated special length main rebars and remaining rebars in individual lengths, followed by the application of shape codes. Python script was developed to input unit weights of corresponding rebar diameters and run in Revit Python Shell. The desired contents for BBS were selected within Revit properties and a BBS including rebar weights was generated automatically. The accuracy of rebar weights was checked through calculations of MAE and MAPE. Notable findings of this study can be observed as follows:
- After special-length-priority optimization, the required rebar weight for 293 panels of diaphragm wall was 19,431.98 tons, while the ordered rebar weight in special lengths was 19,582.43 tons, yielding 150.45 tons of rebar waste by 0.77% waste rate.
- The ordered rebar weight of the proposed study was compared to the original ordered weight in stock lengths which is 22,582.65 tons, saving 3000.22 tons of rebar consumption by 13.3%.
- The automatically generated BBS’s rebar weights from the BIM model were compared to the predicted rebar weights of the special-length-priority optimization, resulting in 0.017 MAE and 1.13% MAPE (98.87% accuracy).
The authors suggest that future studies should focus on integrating the proposed algorithm with the automation of rebar arrangements using Dynamo or Revit plugins, which assist in more complex and efficient rebar arrangement, and offer a more accurate and flexible approach to rebar modeling. This study can assist fellow researchers and engineers with the benefits of using special lengths and the detailed process of preparing BBS through a BIM model automatically, including the application of shape codes and data linking through Revit API. The rebar shape sketch with bending detail included in the generated BBS (demonstrated in Figure 4) can also serve as an instruction or guideline for rebar work. Implementing the proposed algorithm can accelerate the rebar process, ensuring rebar order and cost estimation, thus enhancing overall construction productivity and practices.
Author Contributions
Conceptualization, S.K.; methodology, S.K. and K.H.K.; software, L.P.K.; validation, L.P.K.; D.D.W. and S.K.; formal analysis, L.P.K. and D.D.W.; investigation, L.P.K. and D.D.W.; resources, S.K. and K.H.K.; data curation, L.P.K.; writing—original draft preparation, L.P.K. and D.D.W.; writing—review and editing, S.K.; L.P.K. and D.D.W.; supervision, S.K.; project administration, K.H.K.; funding acquisition, S.K. All authors have read and agreed to the published version of the manuscript.
Funding
This study was supported by National Research Foundation of Korea (NRF) grants funded by the government of the Republic of Korea (MOE) (No. 2022R1A2C2005276).
Data Availability Statement
The data supporting the findings of this study are available from the corresponding authors upon reasonable request.
Conflicts of Interest
The authors declare no conflict of interest.
Abbreviations
| 2D | Two-dimensional |
| 3D | Three-dimensional |
| BIM | Building Information Modeling |
| BBS | Bar Bending Schedule |
| N0RCW | Near-zero Rebar Cutting Waste |
| API | Application Program Interface |
| AEC | Architectural, Engineering, and Construction |
| ACI | American Concrete Institute |
| BSI | British Standard Institute |
| KDS | Korea Design Standards |
| JSCE | Japan Society of Civil Engineers |
| MAE | Mean Absolute Error |
| MAPE | Mean Absolute Percentage Error |
Notations
| Total length of wall rebar in the same diameter (m) | |
| Length of rebar i (m) | |
| r | Upper limit of the summation |
| New number of required rebars | |
| Optimal reference length (m) | |
| Special length (m) | |
| Special length cutting pattern (m) | |
| Length of cutting pattern i (m) | |
| Minimum length for the special length order requirement (m) | |
| Maximum length for the special length order requirement (m) | |
| Minimum rebar quantity for the special length order (ton) | |
| Total purchased rebar quantity (ton) | |
| Rebar loss rate of the special length cutting pattern (%) | |
| Target loss rate (%) |
Appendix A

Table A1.
Primary rebar data of the case study diaphragm wall.
| Main Rebars | ||||||
| Serial No. | Description | Bar Mark | Size | No. of Rebars | Length of Rebar | Weight (Ton) |
| 1 | Main Bars | D2 | H40 | 40 | 9.760 | 3.851 |
| 2 | B2 | 40 | 8.535 | 3.368 | ||
| 3 | E2 | 40 | 8.535 | 3.368 | ||
| 4 | A2 | 40 | 9.185 | 3.624 | ||
| 5 | A1 | 40 | 8.865 | 3.498 | ||
| 6 | B1 | 40 | 8.865 | 3.498 | ||
| 7 | D1 | 40 | 8.865 | 3.498 | ||
| 8 | E1 | 40 | 8.865 | 3.498 | ||
| 9 | D3 | 40 | 3.425 | 1.351 | ||
| 10 | A3 | H32 | 40 | 10.335 | 2.610 | |
| 11 | A4 | 40 | 8.895 | 2.246 | ||
| 12 | D4 | 40 | 8.895 | 2.246 | ||
| 13 | D3a | 40 | 6.335 | 1.600 | ||
| Remaining Rebars | ||||||
| Serial No. | Description | Bar Mark | Size | No. of Rebars | Length of rebar | Weight (Ton) |
| 1 | Suspension Hook | U1 | H40 | 16 | 2.518 | 0.397 |
| 2 | Spacer | S1 | 58 | 2.450 | 1.402 | |
| 3 | Hanging Bar | H1 | 12 | 2.450 | 0.290 | |
| 4 | Add’l Lifting Bar | H3 | 12 | 2.450 | 0.290 | |
| 5 | Coupler Bars | P2c | 4 | 2.160 | 0.085 | |
| 6 | P2d | 4 | 2.160 | 0.085 | ||
| 7 | P2e | 4 | 2.160 | 0.085 | ||
| 8 | P1c | 28 | 2.052 | 0.567 | ||
| 9 | P1d | 28 | 2.052 | 0.567 | ||
| 10 | P1e | 24 | 2.052 | 0.486 | ||
| 11 | Lifting Rebar | H2 | 16 | 1.800 | 0.284 | |
| 12 | Coupler Bars | G2c | 2 | 1.520 | 0.030 | |
| 13 | G2f | 4 | 1.520 | 0.060 | ||
| 14 | G1c | 8 | 1.412 | 0.111 | ||
| 15 | G1f | 28 | 1.412 | 0.390 | ||
| 16 | Coupler Bars | P4c | H32 | 4 | 1.570 | 0.040 |
| 17 | P3c | 28 | 1.483 | 0.262 | ||
| 18 | Add’l Vertical Bars | C2 | H25 | 40 | 8.741 | 1.348 |
| 19 | C1 | 40 | 5.191 | 0.800 | ||
| 20 | Stiffener | L3 | 44 | 1.820 | 0.309 | |
| 21 | Coupler Bars | P6c | 4 | 1.225 | 0.019 | |
| 22 | P5c | 28 | 1.158 | 0.125 | ||
| 23 | EX-Link | L1 | H20 | 972 | 4.766 | 11.442 |
| 24 | Add’l Vertical Bars | F1 | 40 | 4.320 | 0.427 | |
| 25 | Fixing Rebar | FR1 | 16 | 2.450 | 0.097 | |
| 26 | Coupler Bars | G7b | 48 | 0.700 | 0.083 | |
| 27 | G8b | 6 | 0.700 | 0.010 | ||
| 28 | Dowel Bars | SW1 | H16 | 152 | 1.362 | 0.327 |
| 29 | SW2 | 76 | 1.362 | 0.164 | ||
| 30 | C-Link | L2 | H13 | 3440 | 1.214 | 4.343 |
References
- heng, C., Yi, C., Lu, M. Integrated optimization of rebar detailing design and installation planning for waste reduction and productivity improvement. Automation in Construction 2019, 101, 32–47. [CrossRef]
- igussie, T., Chandrasekar, M.K. Influence of rebar practice in the total cost of building construction projects: The case of Hawassa City, Ethiopia. International Journal of Engineering, Science and Technology 2020, 12(1), 54–65. [CrossRef]
- allya, A.G., Reja, V.K., Varghese, K. Impact of reinforcement design on rebar productivity. Proceedings of the 40th International Symposium on Automation and Robotics in Construction, 2023. [CrossRef]
- uliana, C., Kartadipura, R.H., S, M.N., S M, S.H. Analysis of minimizing iron material waste for construction work in wetlands with bar bending schedule method. International Journal of Civil Engineering 2023, 10(8), 1–9. [CrossRef]
- CI Committee 318. Building Code Requirements for Structural Concrete (ACI 318-19) and Commentary (ACI 318R-19); American Concrete Institute: Farmington Hills, MI, USA, 2019.
- S 8110:1997; Structural Use of Concrete-Part 1, Code of Practice for Design and Construction. British Standards Institution: London, UK, 1997.
- urocode 2: Design of Concrete Structures: Part 1-1: General rules and rules for buildings. (2004). British Standards Institution (BSI), European Committee for Standardization (CEN).
- DS 14 20 52; Concrete Structure-Joint Design Criteria, 18. Ministry of Land, Infrastructure, and Transportation: Sejong, Republic of Korea, 2021.
- apan Society of Civil Engineers. Standard Specifications for Concrete Structures–2007 “Design” in JSCE Guidelines for Concrete, No.15 469; Japan Society of Civil Engineers: Tokyo, Japan, 2010.
- won, K. A Study on the Development of Optimization Algorithms for Near Zero Cutting Wastes of Reinforcement Steel Bars. Ph.D. Thesis, Kyung Hee University, Yongin, Republic of Korea, 2023.
- idjaja, D.D., Kim, S. Reducing rebar cutting waste and rebar usage of beams: A two-stage optimization algorithm. Buildings 2023, 13, 2279. [CrossRef]
- lsen, D., Taylor, J.M. Quantity take-off using building information modeling (BIM), and its limiting factors. Procedia Engineering 2017, 196, 1098–1105. [CrossRef]
- urve, R.B., Kulkarni, S.S., 2013, Construction waste reduction– A case study, International Journal of Engineering Research and Technology 2013, 2, pp. 870–875.
- fshar, A., Amiri, H., Eshtehardian, E., 2008. An Improved Linear Programming Model For One-Dimensional Cutting Stock Problem., in: First International Conference on Construction in Developing Countries (ICCIDC-I). Advancing and Integrating Construction Education, Research & Practice, August 4-5. Presented at the First International Conference on Construction In Developing Countries, Karachi, Pakistan.
- herafat, B., Taghaddos, H., Shafaghat, E. Enhanced automated quantity take-off in building information modeling. Scientia Iranica A: Civil Engineering 2021, 29(3), 1024-1037.
- aghaddos, H., Mashayekhi, A., Sherafat, B. Automation of construction quantity take-off: Using building information modeling (BIM). Construction Research Congress 2016. [CrossRef]
- adoushani, Z.S.M., Hannad, A.W.; Xiao, J., Akbarnezhad, A. Minimizing cutting wastes of reinforcing steel bars through optimizing lap splicing within reinforced concrete elements. Constr. Build. Mater. 2018, 185, 600–608. [CrossRef]
- adoushani, Z.S., Hammad, A.W.A., Akbarnezhad, A.A. Framework for Optimizing Lap Splice Positions within Concrete Elements to Minimize Cutting Waste of Steel Bars. In Proceedings of the 33rd International Symposium on Automation and Robotics in Construction (ISARC), Auburn, AL, USA, 2016.
- orwal, A., Hewage, K.N. Building information modeling based analysis to minimize the waste rate of structural reinforcement. J. Constr. Eng. Manag. 2012, 138, 943–954. [CrossRef]
- achmawati, T.S.N., Lwun, P.K., Lim, J., Lee, J., Kim, S. Optimization of lap splice positions for near-zero rebar cutting waste in diaphragm walls using special-length-priority algorithms. J. Asian Archit. Build. Eng. 2023. [CrossRef]
- aveen, P. Implementation of Central Bar Bending Yard: A Case Study on 6 × 660 MW Sasan UMPP. Journal of The Institution of Engineers (India): Series A 2014, 95, 259-268. [CrossRef]
- un, S., Kim, S. Rebar Fabrication Process in Both Field Processing and Factory Processing for Adopting Lean Construction. Architectural research 2013, 15, 167-174. [CrossRef]
- hondoker, M.T.H. Automated reinforcement trim waste optimization in RC frame structures using building information modeling and mixed integer linear programming. Autom. Constr. 2021, 124, 103599. [CrossRef]
- anagiri, Y.V., Singh, R.K. Reduction of Wastage of Rebar by Using BIM and Linear Programming. Int. J. Technol. 2015, 5, 329. [CrossRef]
- ubaidy, D.S., Dawood, S.Q., Khalaf, I.D. Optimal Utilization of Rebar Stock for Cutting Processes in Housing Project. Int. J. Adv. Res. Sci. Eng. Technol. 2016, 3, 189–193. [CrossRef]
- ee, D., Son, S., Kim, D., Kim, S. Special-Length-Priority Algorithm to Minimize Reinforcing Bar-Cutting Waste for Sustainable Construction. Sustainability 2020, 12, 5950. [CrossRef]
- idjaja, D.D., Rachmawati, T.S.N., Kwon, K., Kim, S. Investigating Structural Stability and Constructability of Buildings Relative to the Lap Splice Position of Reinforcing Bars. J. Korea Inst. Build. Constr. 2023, 23, 315–326. [CrossRef]
- ang, D., Hu, Y. Research on the Intelligent Construction of the Rebar Project Based on BIM. Appl. Sci. 2022, 12, 5596. [CrossRef]
- i, S., Shi, Y., Hu, J., Li, S., Li, H., Chen, A., Xie, W. Application of BIM to Rebar Modeling of a Variable Section Column. Buildings 2023, 13, 1234. [CrossRef]
- attineni, A., Bradford, R. Estimating with BIM: A survey of US construction companies, Proceedings of the 28th ISARC, Seoul, Korea, 2011, pp. 564-569. [CrossRef]
- S 8666; Scheduling, Dimensioning, Cutting and Bending of Steel Reinforcement for Concrete; Specification. British Standards Institution: London, UK, 2020.
- utodesk, Revit API Developers Guide. Available online: https://help.autodesk.com/view/RVT/2024/ENU/?guid=Revit_API_Revit_API_Developers_Guide_html (accessed on 05 February 2024).
- idjaja, D.D., Khant, L.P., Kim, S., Kim, K.Y. Optimization of Rebar Usage and Sustainability Based on Special-Length Priority: A Case Study of Mechanical Couplers in Diaphragm Walls. Sustainability 2024, 16, 1213. [CrossRef]
- utting Optimization Pro Home Page. Available online: https://optimalprograms.com/cutting-optimization/ (accessed on 05 February 2024).
- ean Absolute Error (MAE) Formula, Statistics How To. Available online: https://www.statisticshowto.com/absolute-error/ (accessed on 05 February 2024).
- ean Absolute Percentage Error (MAPE) Formula, Statistics How To. Available online: https://www.statisticshowto.com/mean-absolute-percentage-error-mape/ (accessed on 05 February 2024).
- Liu, J., Liu, P., Feng, L., Wu, W., Li, D., Chen, Y.F. Automated clash resolution for reinforcement steel design in concrete frames via Q-Learning and building information modeling. Automation in Construction 2020, 112, 103062. [CrossRef]
Figure 1.
Process of rebar procurement.
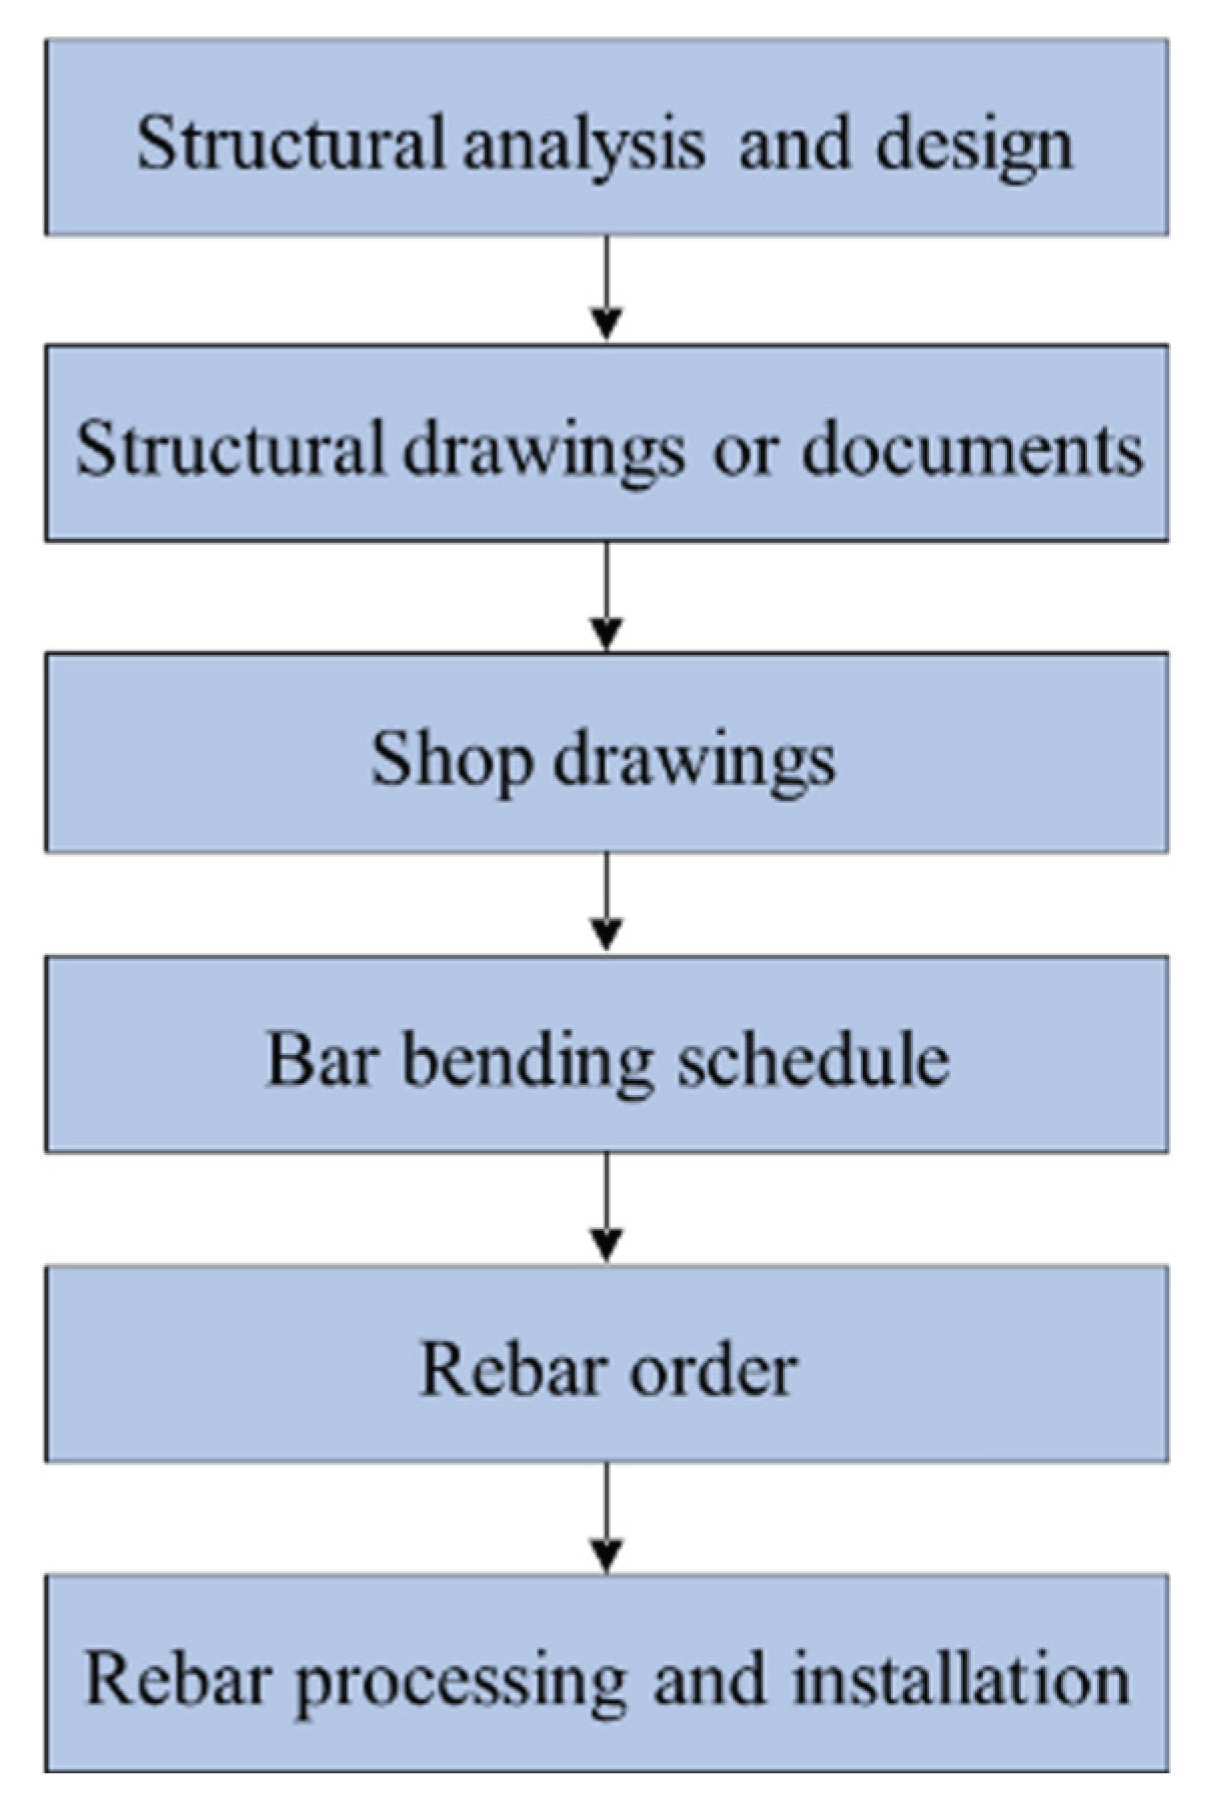
Figure 2.
The proposed method of preparing a BBS.
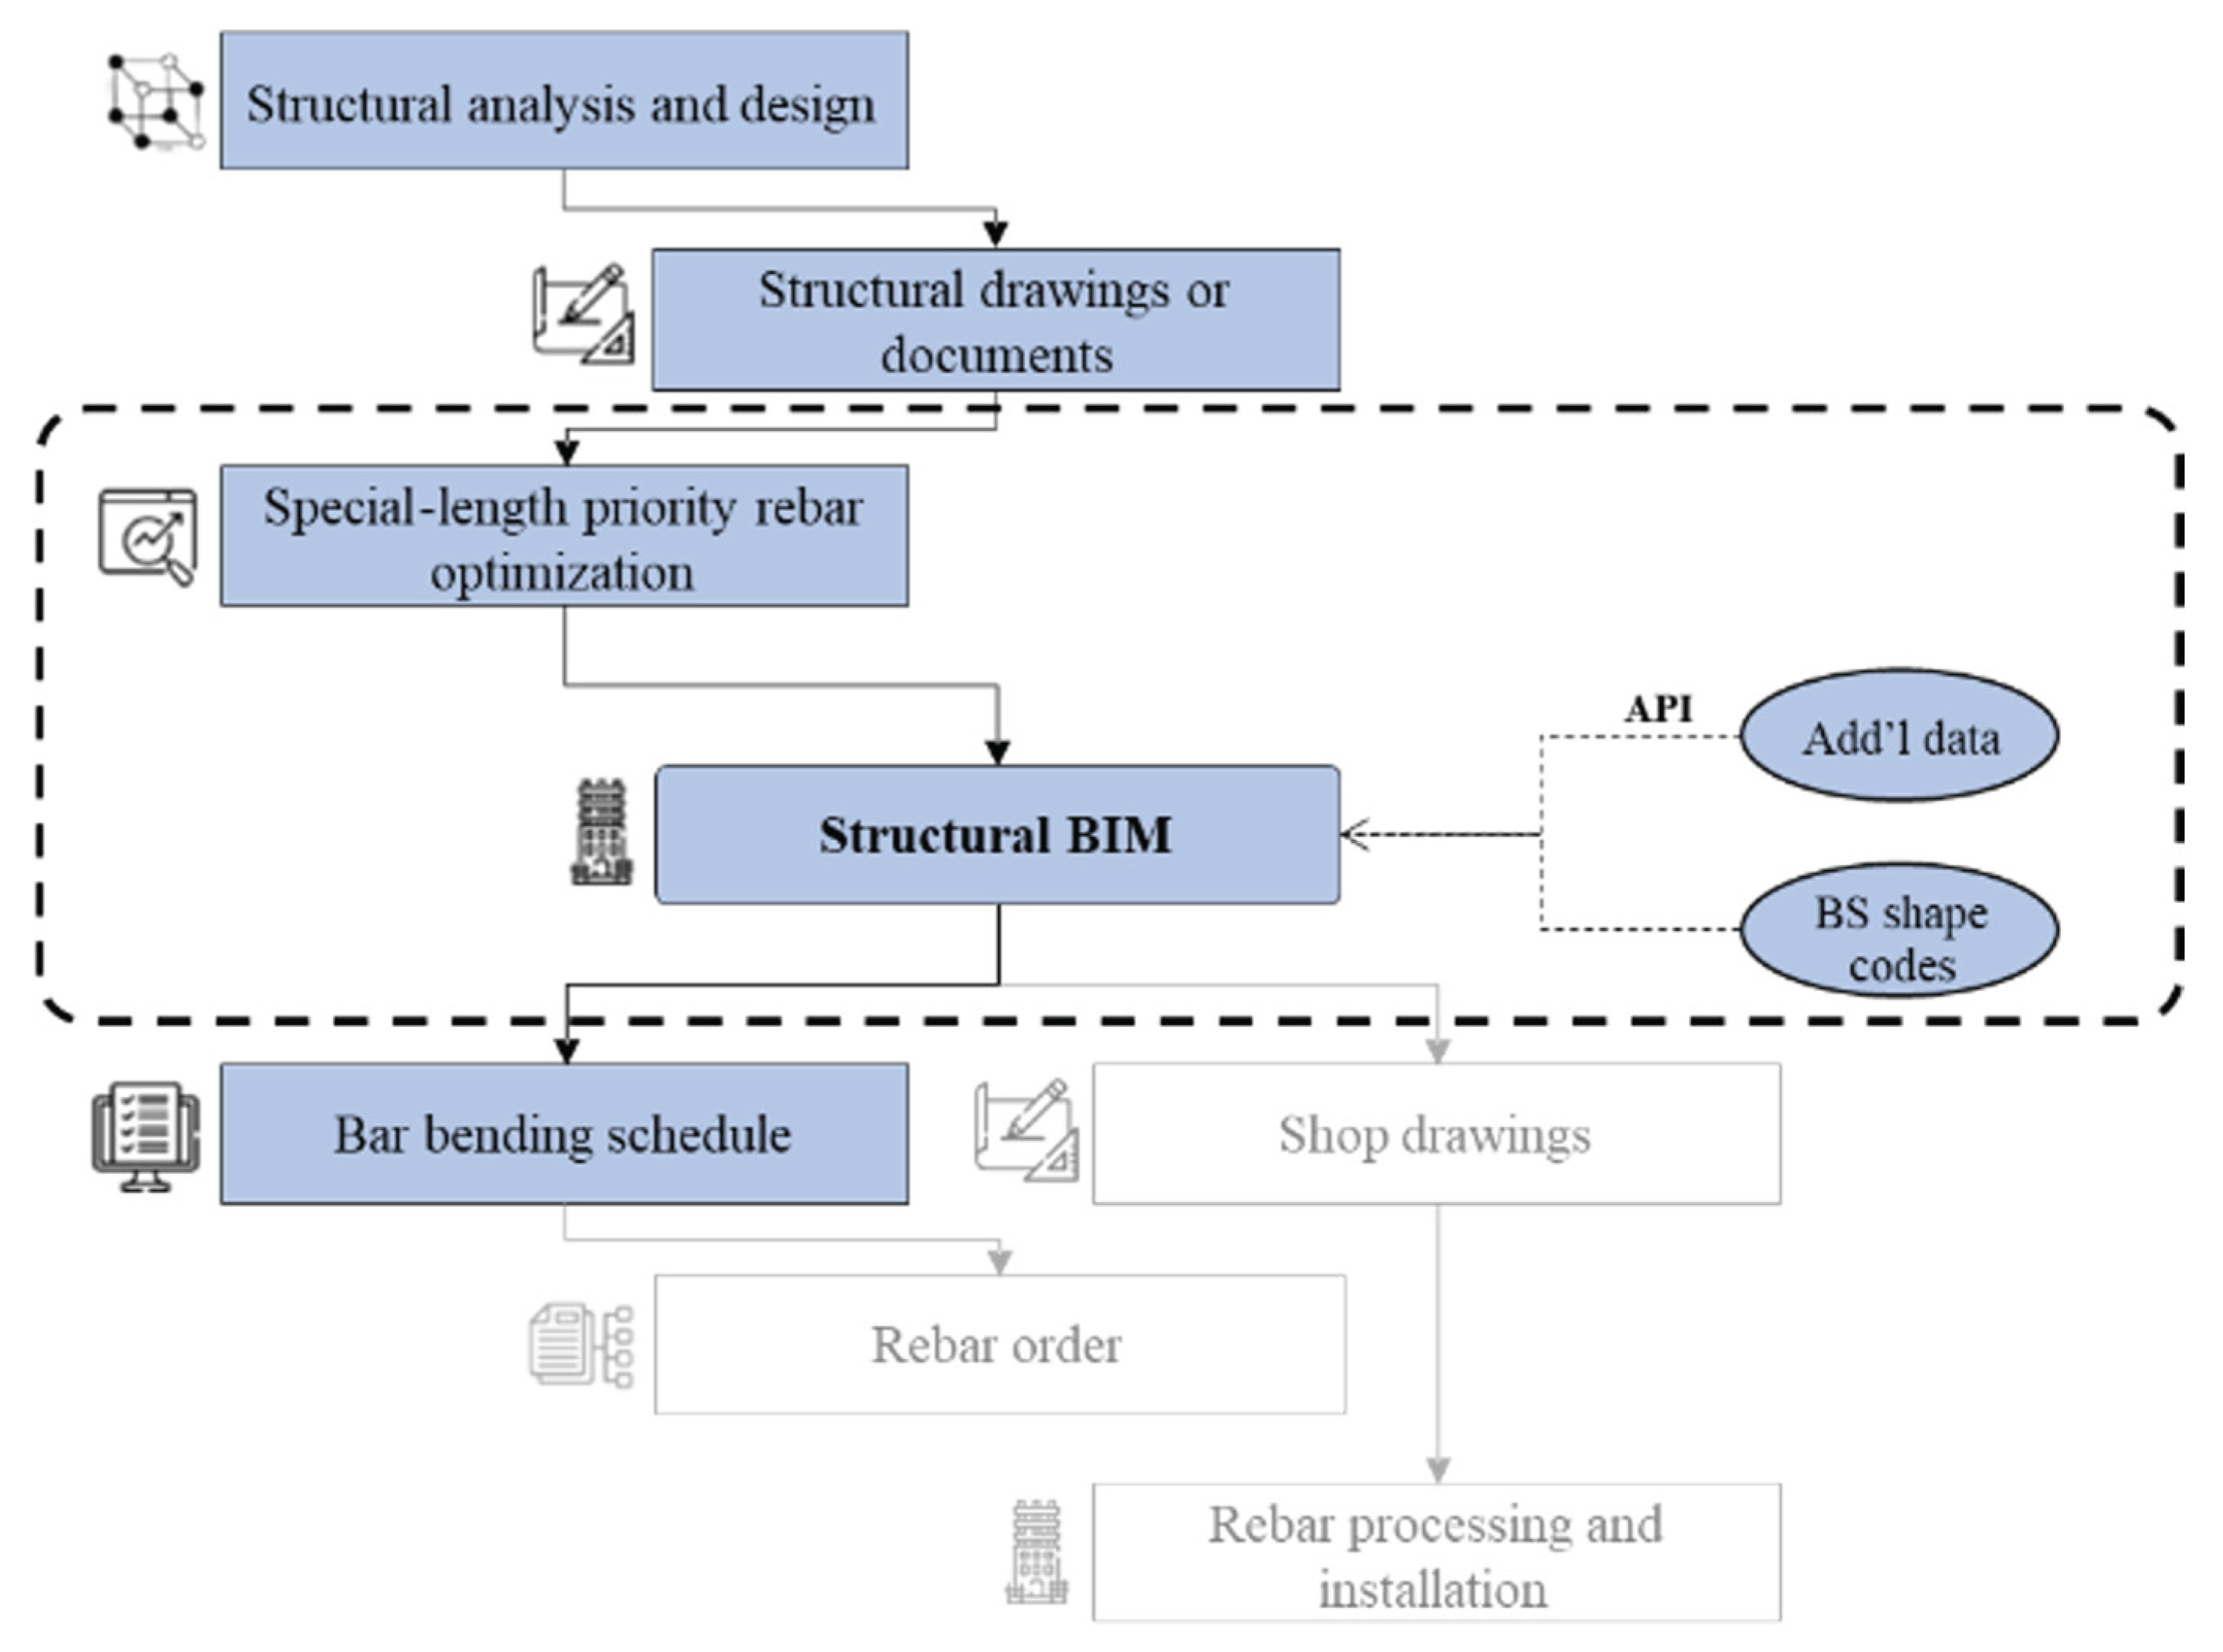
Figure 3.
Descriptive algorithm of BIM-based automatic BBS generation.
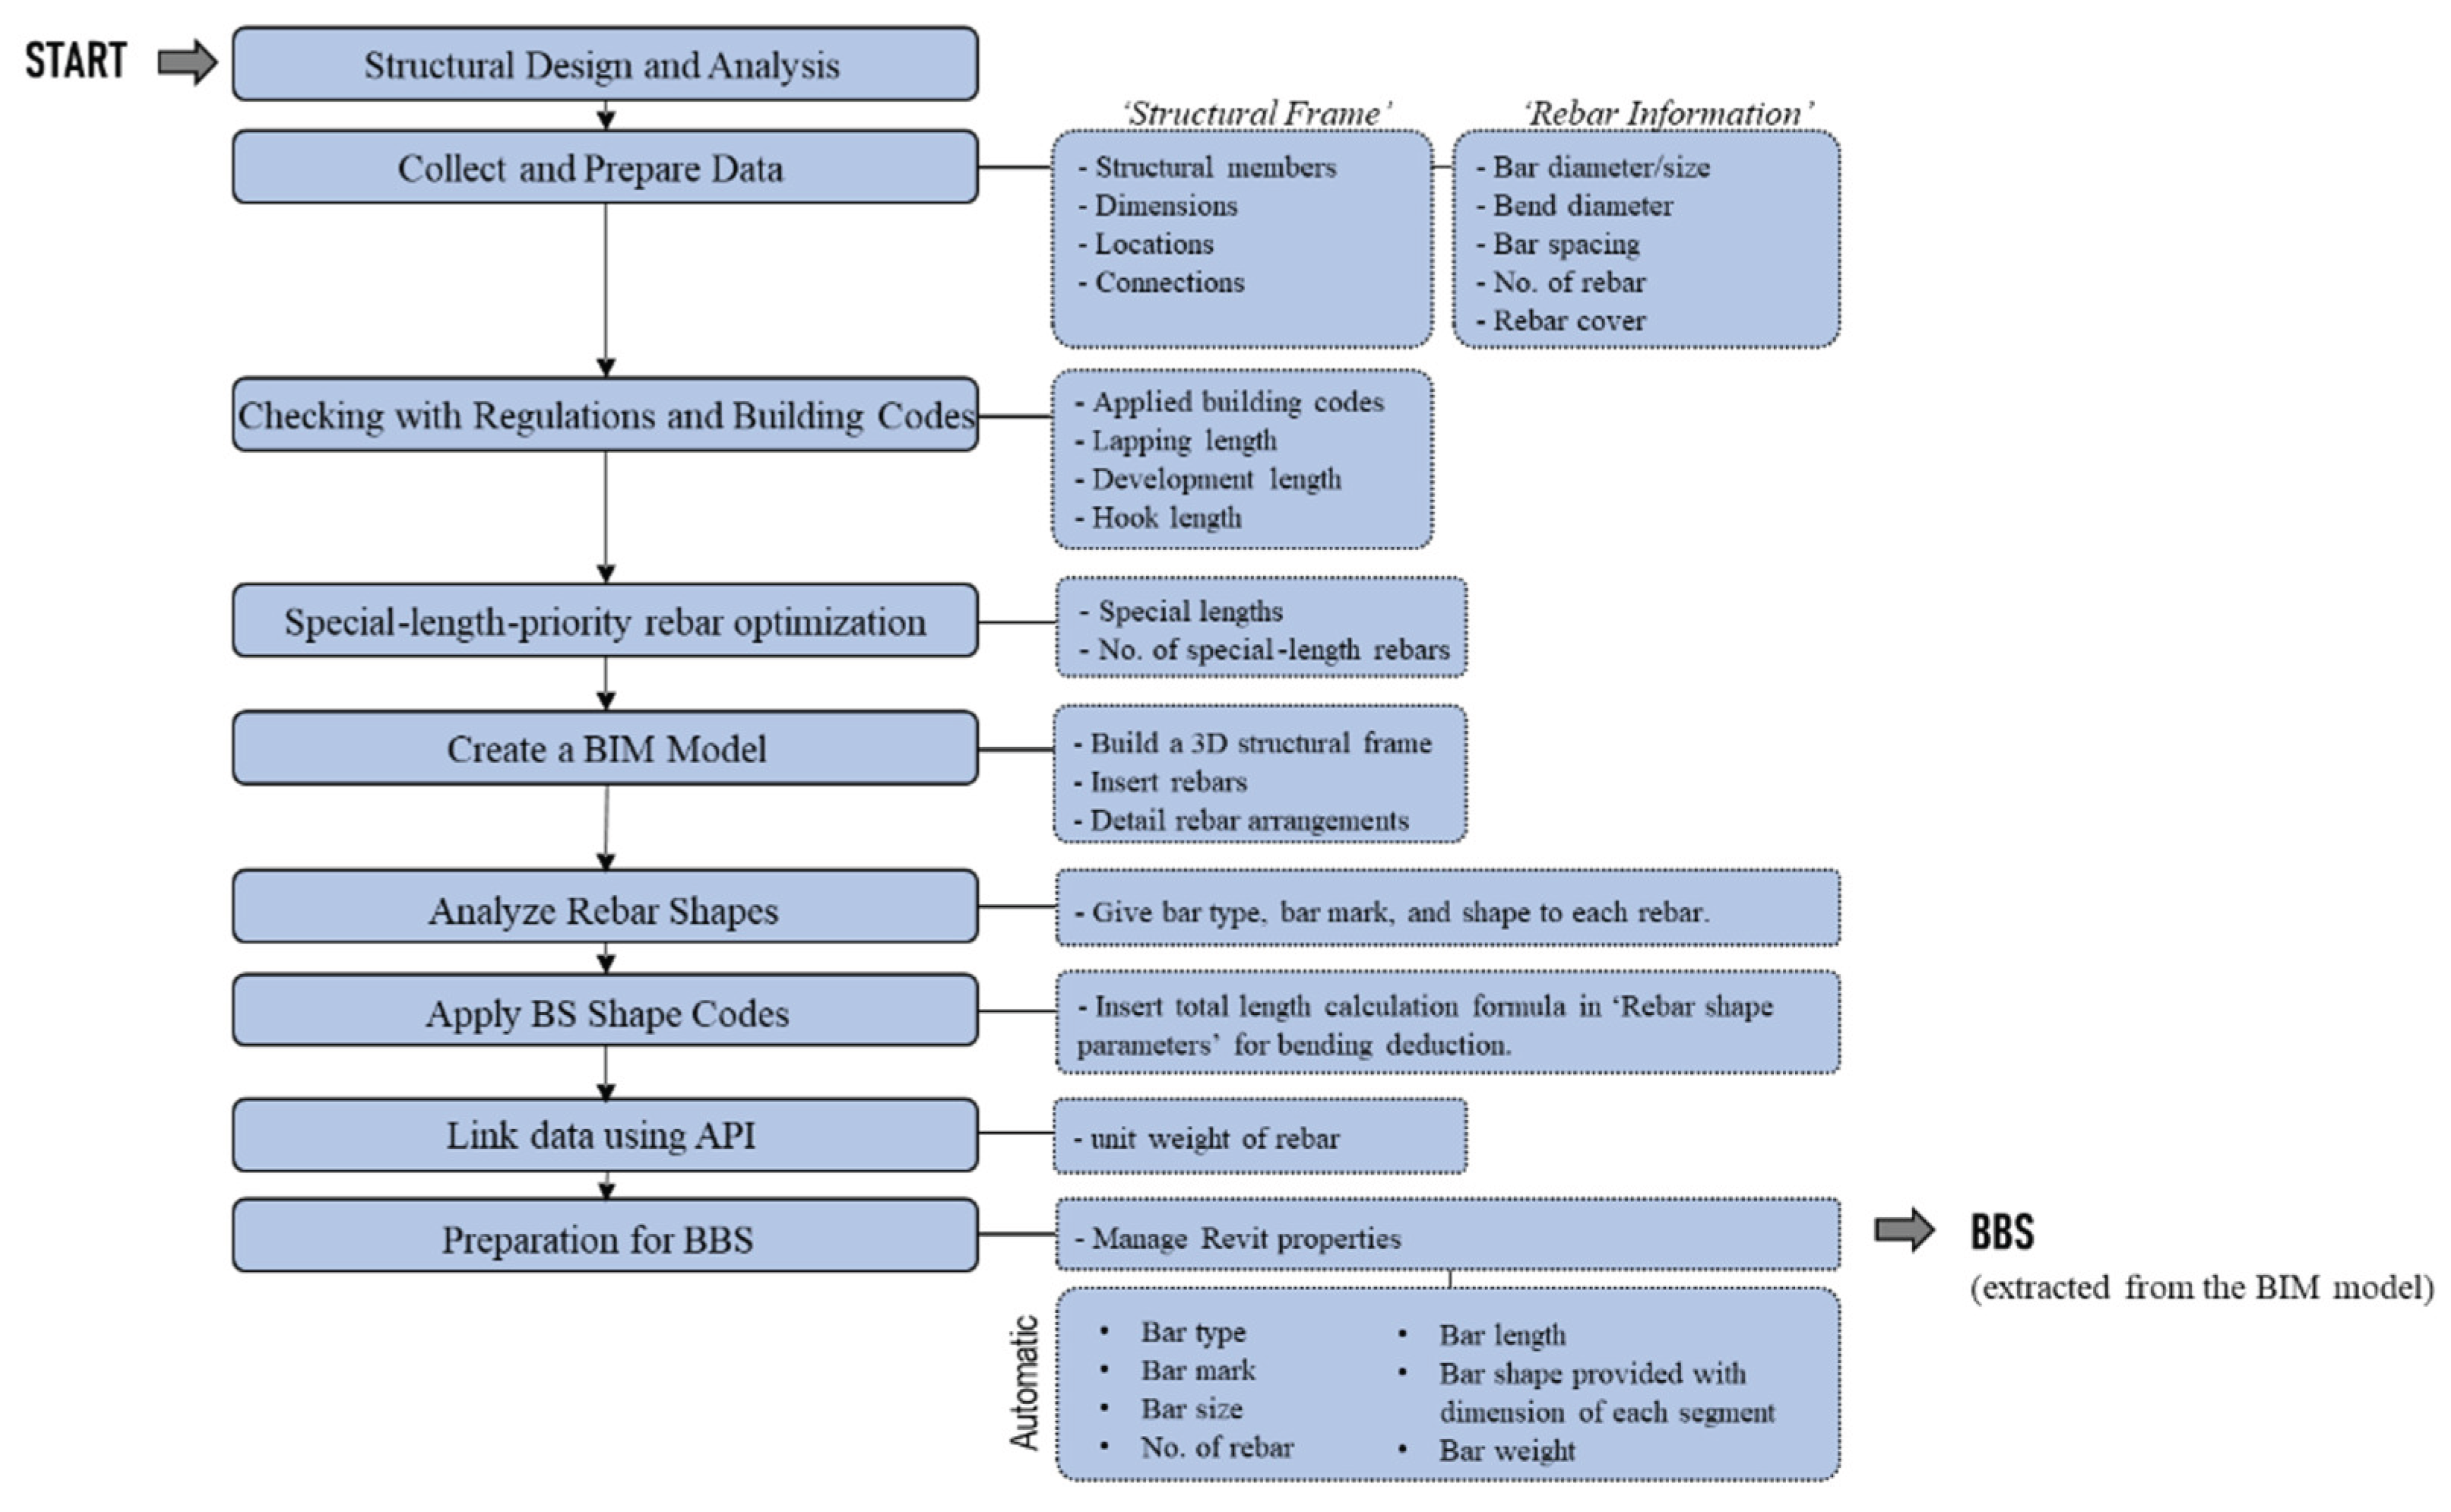
Figure 4.
Diaphragm wall rebar arrangement, (a) main rebar arrangement, (b) rebar arrangement at longitudinal section. (Adapted from Widjaja et al. [33].).
Figure 4.
Diaphragm wall rebar arrangement, (a) main rebar arrangement, (b) rebar arrangement at longitudinal section. (Adapted from Widjaja et al. [33].).
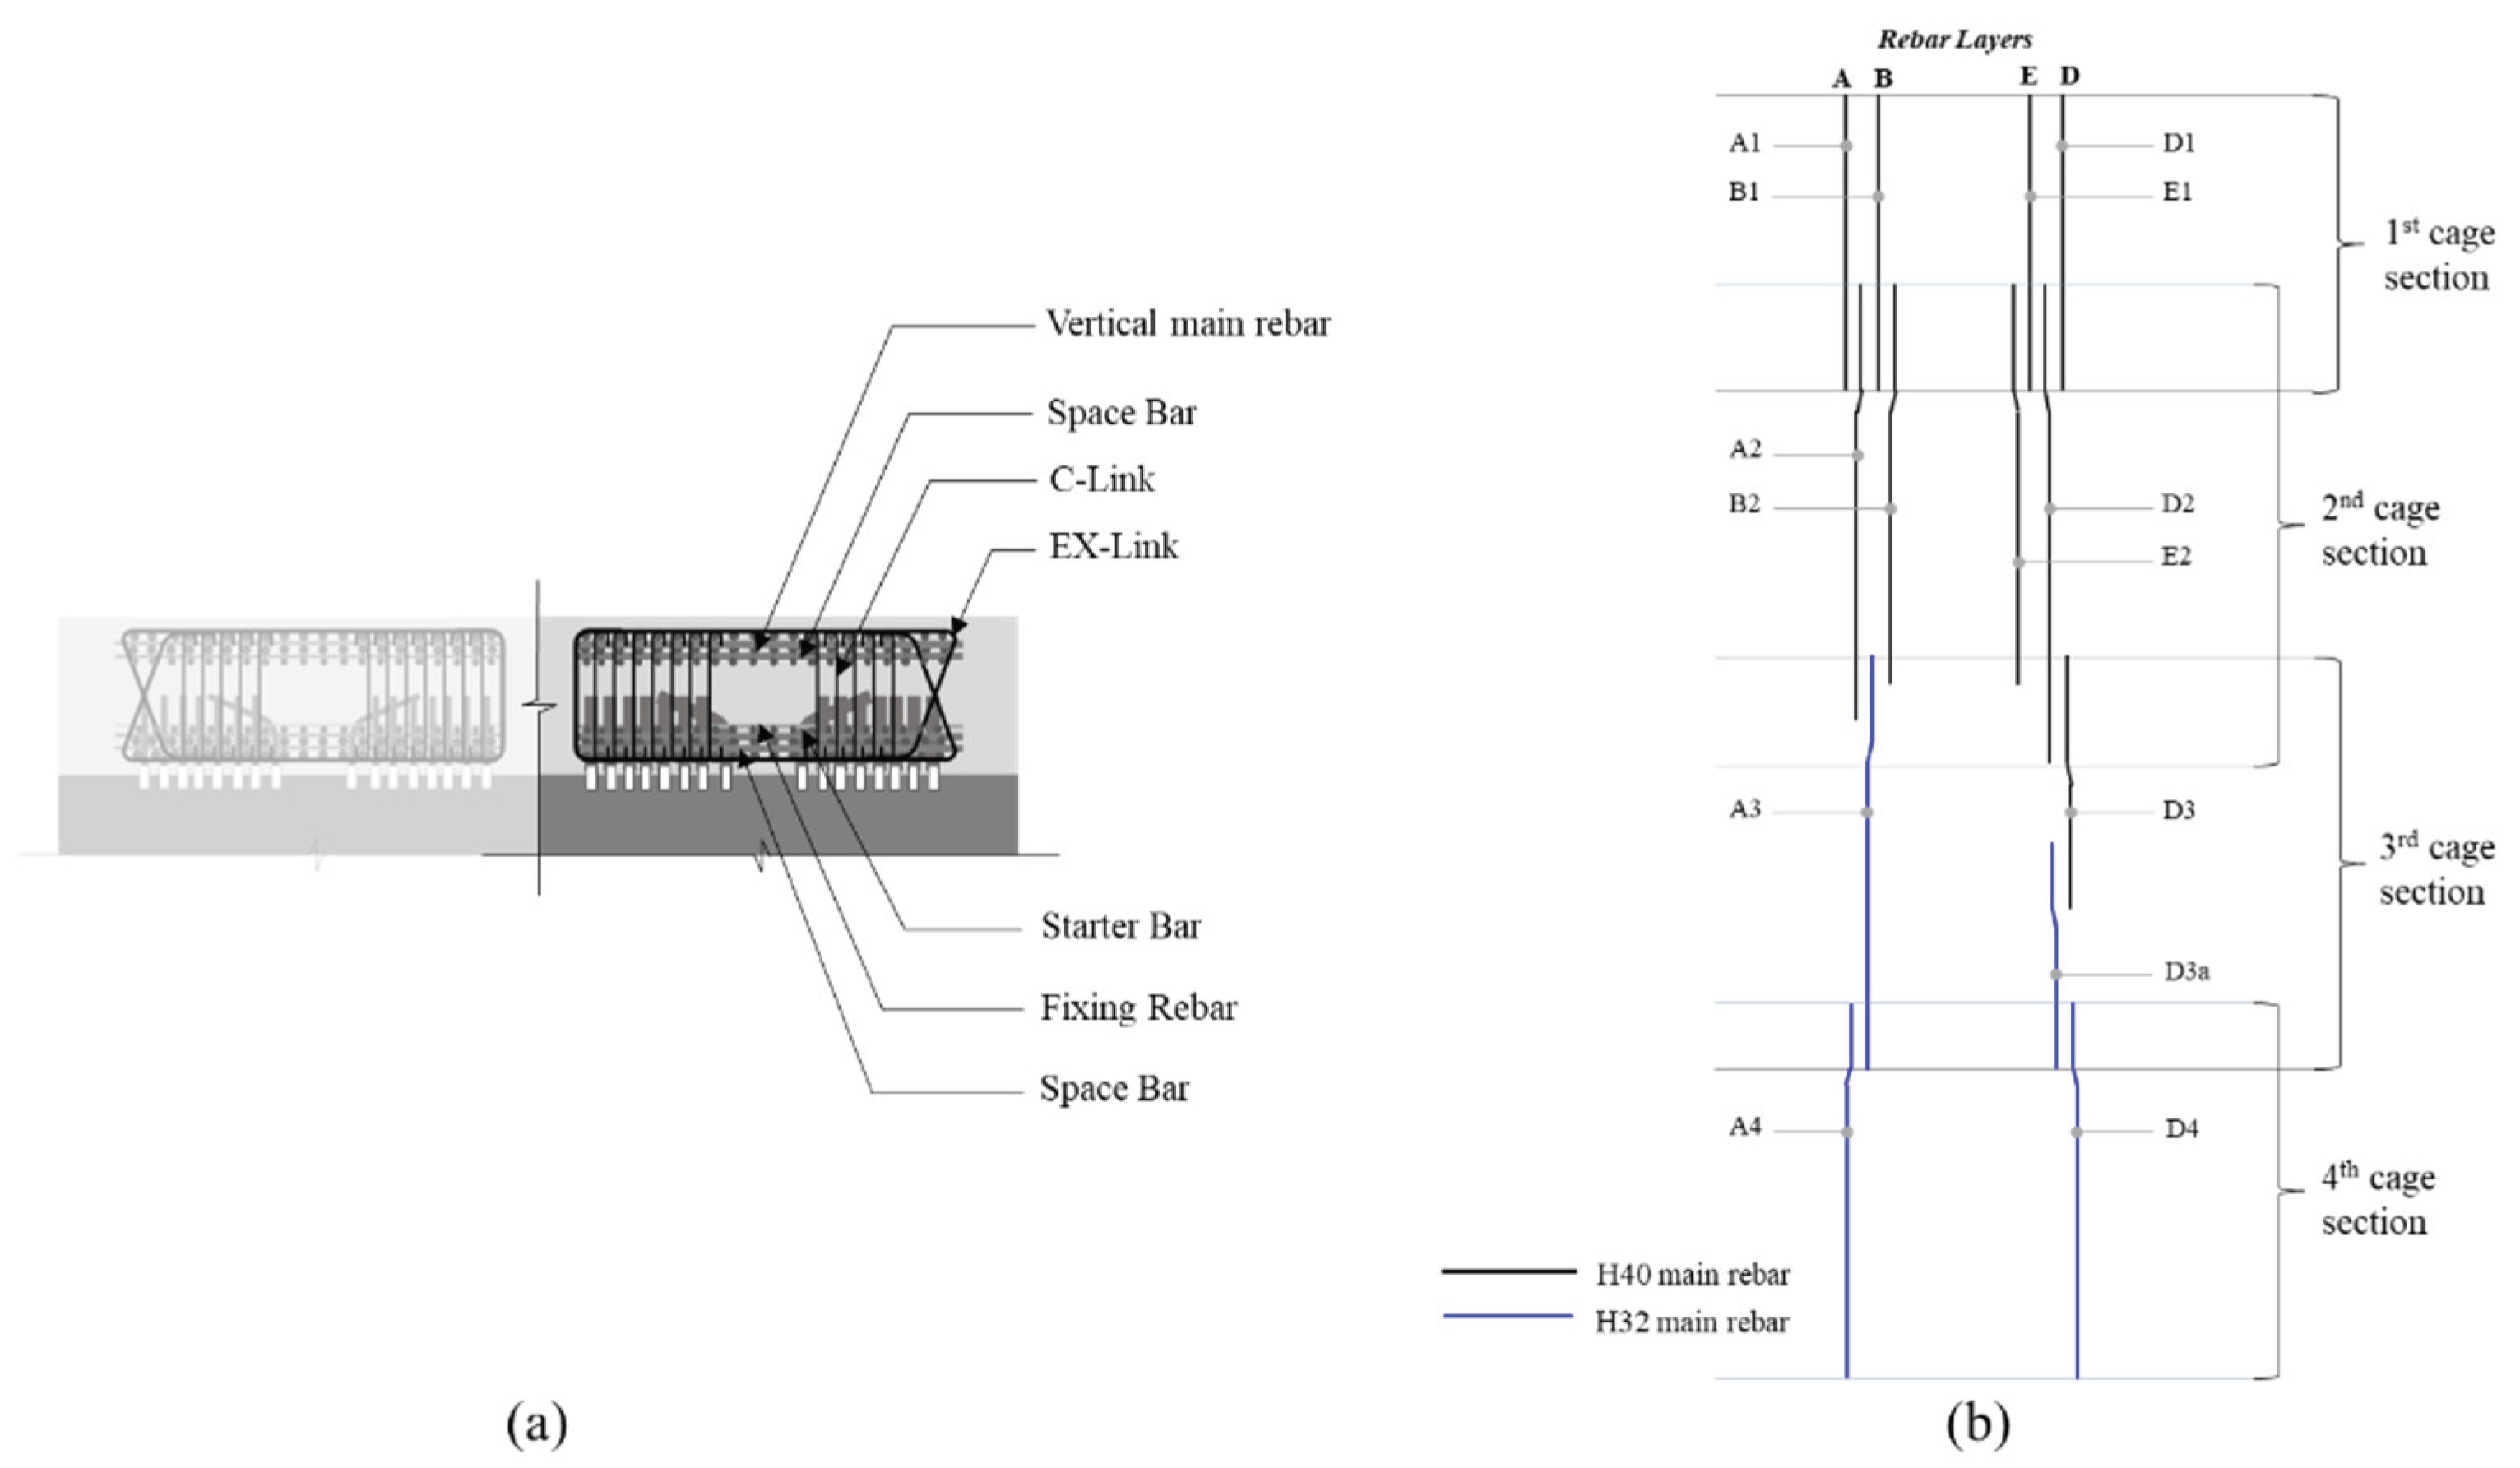
Figure 4.
The process of BBS preparation for rebar layer A.
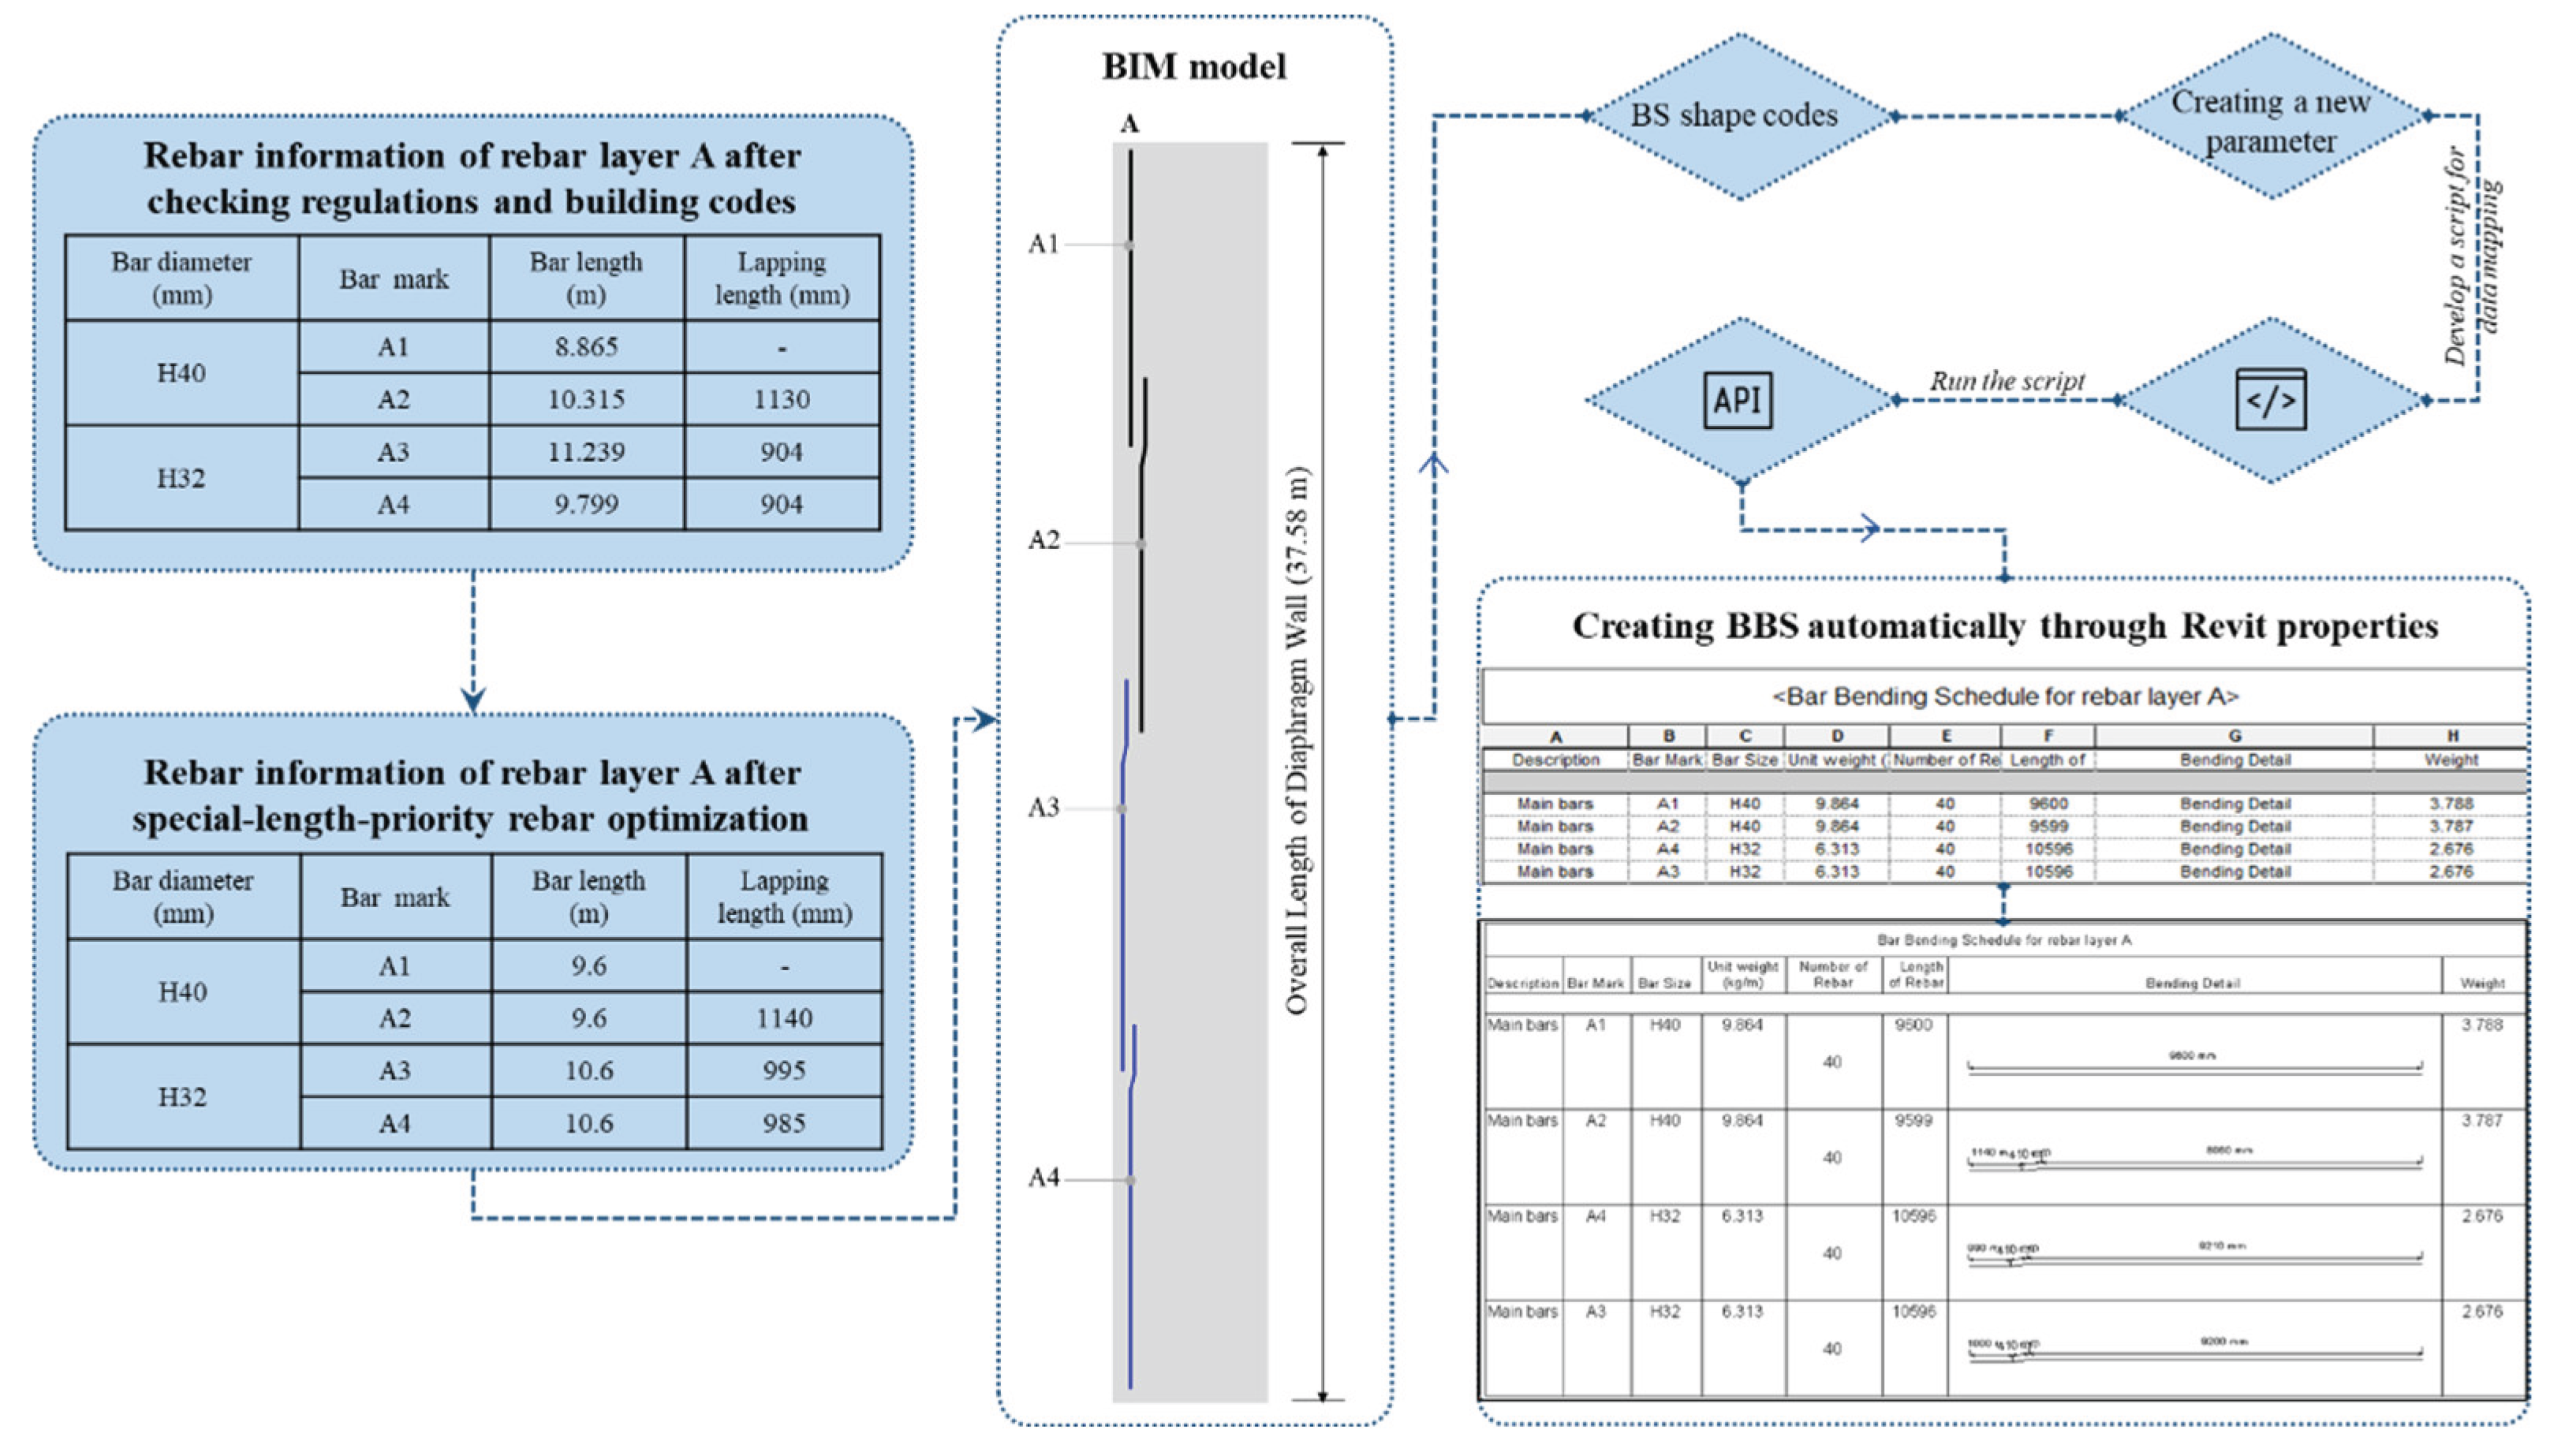
Table 1.
Attributes of the primary wall panel.
| Description | Contents |
|---|---|
| Length of D-wall | 6 m |
| Thickness of D-wall | 1 m |
| Overall depth of D-wall | 37.58 m |
| Depth of floor slab | 1200 mm |
| Top concrete cover | 100 mm |
| Bottom concrete cover | 200 mm |
| Strength of rebars | SHD500 |
| Rebar sizes | H40, H32, H25, H20, H16, H13 |
| Concrete strength | 24 MPa |
| Length of ordered rebar, (m) | 6 ≤ ≤ 12 |
Table 2.
Results of special-length-priority optimization on main rebars.
| Optimized rebars | Rebar diameter (mm) | (mm) | Calculated length (m) | (m) | |
|---|---|---|---|---|---|
| A1, A2 | H40 | 19180 | 2 | 9.590 | 9.6 |
| A3, A4 | H32 | 21038 | 2 | 10.519 | 10.6 |
| B1, B2 | H40 | 18530 | 2 | 9.265 | 9.3 |
| E1, E2 | H40 | 18530 | 2 | 9.265 | 9.3 |
| D1, D2, D3 | H40 | 24310 | 3 | 8.103 | 8.2 |
| D3a, D4 | H32 | 17038 | 2 | 8.519 | 8.6 |
Table 3.
Cutting pattern optimization on remaining rebars.
| Diameter (mm) | Special length (m) | Number of rebar | Total weight (ton) | Ordered weight (ton) | Waste rate (%) |
|---|---|---|---|---|---|
| H40 | 10.3 | 51 | 5.129 | 5.182 | 1.01% |
| H32 | 12 | 4 | 0.302 | 0.303 | 0.41% |
| H25 | 10.6 | 65 | 2.600 | 2.655 | 2.08% |
| H20 | 9.6 | 513 | 12.059 | 12.164 | 0.86% |
| H16 | 8.2 | 38 | 0.491 | 0.492 | 0.34% |
| H13 | 11 | 383 | 4.343 | 4.382 | 0.87% |
| Total | 24.711 | 24.963 | 1.01% |
Table 4.
Summary of special-length-priority optimization on diaphragm wall rebars.
| Diameter (mm) | Special length (m) | Number of rebar | Total weight (ton) | Ordered weight (ton) | Waste rate (%) |
|---|---|---|---|---|---|
| H40 | 10.3 | 14943 | 1502.797 | 1518.197 | 1.01% |
| H40 | 9.6 | 23440 | 2217.325 | 2219.637 | 0.10% |
| H40 | 9.3 | 46880 | 4284.361 | 4300.546 | 0.38% |
| H40 | 8.2 | 35160 | 2810.384 | 2843.910 | 1.18% |
| H32 | 12 | 1172 | 88.486 | 88.786 | 0.34% |
| H32 | 10.6 | 23440 | 1556.567 | 1568.553 | 0.76% |
| H32 | 8.6 | 23440 | 1260.614 | 1272.600 | 0.94% |
| H25 | 10.6 | 19045 | 761.800 | 778.034 | 2.09% |
| H20 | 9.6 | 150309 | 3533.287 | 3564.127 | 0.87% |
| H16 | 8.2 | 11134 | 143.863 | 144.252 | 0.27% |
| H13 | 11 | 112219 | 1272.499 | 1283.785 | 0.88% |
| Total | 19431.983 | 19582.427 | 0.77% |
Table 5.
Analysis of rebar quantities and loss rate between original and ordered rebar weights.
| Description | H40 | H32 | H25 | H20 | H16 | H13 | Total |
| Original ordered weight (O) (ton) | 12208.00 | 3551.44 | 867.24 | 4394.37 | 161.1 | 1400.49 | 22582.65 |
| New ordered weight (N) (ton) | 10882.29 | 2929.94 | 778.03 | 3564.13 | 144.25 | 1283.79 | 19582.43 |
| Cutting waste (O-N) (ton) | 1325.71 | 621.50 | 89.21 | 830.24 | 16.85 | 116.71 | 3000.22 |
| Loss rate (O-N)/O (%) | 10.9% | 17.5% | 10.3% | 18.9% | 10.5% | 8.3% | 13.3% |
Table 6.
Difference between rebar weights of rebar optimization and the proposed method.
| No. | Bar mark | ) | ) | ||
|---|---|---|---|---|---|
| 1. | A1 | 3.788 | 3.788 | 0 | 0% |
| 2. | A2 | 3.788 | 3.787 | 0.001 | 0.03% |
| 3. | E1 | 3.669 | 3.669 | 0 | 0% |
| 4. | B1 | 3.669 | 3.669 | 0 | 0% |
| 5. | E2 | 3.669 | 3.667 | 0 | 0.05% |
| 6. | B2 | 3.669 | 3.667 | 0.002 | 0.05% |
| 7. | D1 | 3.235 | 3.235 | 0 | 0% |
| 8. | D3 | 3.235 | 3.233 | 0.002 | 0.06% |
| 9. | D2 | 3.235 | 3.233 | 0.002 | 0.06% |
| 10. | U1 | 0.397 | 0.408 | 0.011 | 2.77% |
| 11. | S1 | 1.402 | 1.402 | 0 | 0% |
| 12. | H3 | 0.29 | 0.29 | 0 | 0% |
| 13. | H1 | 0.29 | 0.29 | 0 | 0% |
| 14. | P2e | 0.085 | 0.084 | 0.001 | 1.18% |
| 15. | P2d | 0.085 | 0.084 | 0.001 | 1.18% |
| 16. | P2c | 0.085 | 0.084 | 0.001 | 1.18% |
| 17. | P1e | 0.486 | 0.495 | 0.009 | 1.85% |
| 18. | P1d | 0.567 | 0.578 | 0.011 | 1.94% |
| 19. | P1c | 0.567 | 0.578 | 0.011 | 1.94% |
| 20. | H2 | 0.284 | 0.284 | 0 | 0% |
| 21. | G2f | 0.06 | 0.059 | 0.001 | 1.67% |
| 22. | G2c | 0.03 | 0.029 | 0.001 | 3.33% |
| 23. | G1f | 0.39 | 0.401 | 0.011 | 2.82% |
| 24. | G1c | 0.111 | 0.115 | 0.004 | 3.60% |
| 25. | A4 | 2.677 | 2.676 | 0.001 | 0.04% |
| 26. | A3 | 2.677 | 2.676 | 0.001 | 0.04% |
| 27. | D4 | 2.172 | 2.171 | 0.001 | 0.05% |
| 28. | D3a | 2.172 | 2.171 | 0.001 | 0.05% |
| 29. | P4c | 0.04 | 0.039 | 0.001 | 2.50% |
| 30. | P3c | 0.262 | 0.268 | 0.006 | 2.29% |
| 31. | C2 | 1.348 | 1.347 | 0.001 | 0.07% |
| 32. | C1 | 0.8 | 0.8 | 0 | 0% |
| 33. | L3 | 0.309 | 0.304 | 0.005 | 1.62% |
| 34. | P6c | 0.019 | 0.019 | 0 | 0% |
| 35. | P5c | 0.125 | 0.128 | 0.003 | 2.40% |
| 36. | L1 | 11.442 | 11.05 | 0.392 | 3.43% |
| 37. | F1 | 0.427 | 0.427 | 0 | 0% |
| 38. | FR1 | 0.097 | 0.097 | 0 | 0% |
| 39. | G8b | 0.01 | 0.01 | 0 | 0% |
| 40. | G7b | 0.083 | 0.079 | 0.004 | 4.82% |
| 41. | SW2 | 0.164 | 0.165 | 0.001 | 0.61% |
| 42. | SW1 | 0.327 | 0.331 | 0.004 | 1.22% |
| 43. | L2 | 4.343 | 4.097 | 0.246 | 5.66% |
| 0.736 | 48.51% |
Table 7.
Time analysis of manual input and the proposed method.
| Degree of project | Manual Input | Data mapping using Revit API |
|---|---|---|
| Current case study with 6 rebar diameters in one panel | ○ | ◎ |
| Larger project with various rebar diameters in the entire construction | △ | ◎ |
◎: Excellent; ○: Good; △: Moderate.
Table 8.
Manpower analysis of the conventional and the proposed method based on the case study.
| Description | Required manpower | ||
|---|---|---|---|
| Structural design | Structural drawings | BBS creation | |
| Conventional BBS preparation | 1 | 1 | 1 |
| BIM-based BBS preparation | 1 | - | 1 |
Disclaimer/Publisher’s Note: The statements, opinions and data contained in all publications are solely those of the individual author(s) and contributor(s) and not of MDPI and/or the editor(s). MDPI and/or the editor(s) disclaim responsibility for any injury to people or property resulting from any ideas, methods, instructions or products referred to in the content. |
© 2024 by the authors. Licensee MDPI, Basel, Switzerland. This article is an open access article distributed under the terms and conditions of the Creative Commons Attribution (CC BY) license (http://creativecommons.org/licenses/by/4.0/).
Copyright: This open access article is published under a Creative Commons CC BY 4.0 license, which permit the free download, distribution, and reuse, provided that the author and preprint are cited in any reuse.


