1. Introduction
Since September 2020, when China formally put forward its "dual-carbon" strategy, China's National Development and Reform Commission (NDRC), China's National Energy Administration (NEA), and other Chinese ministries and commissions have continued to release favorable policies on the distributed PV industry, which side by side reflects the fact that distributed PV will play an important role in the path of China's realization of its "dual-carbon" strategy. This reflects that distributed PV will play an important role in China's realization of the "dual-carbon" strategy. Among them, industrial and commercial distributed PV is developing extremely rapidly and has huge potential due to large market demand and small technical difficulties, etc. However, at present, China's industrial and commercial distributed PV is also encountering a lot of difficulties in its promotion. The research team found that, with the continuous construction and development of China's power spot market, the market's main body of transactions continues to expand, and more and more industrial and commercial users are willing to participate in the power spot market transactions. And power spot market trading price is often lower than the distributed PV investment company and industrial and commercial users reach an agreement on the price of electricity. In such a market environment, as well as all levels of government across China continue to cancel the industrial and commercial distributed PV subsidies, industrial and commercial distributed PV investment difficulty greatly increased. Therefore, there is an urgent need for a new power supply model in the field of commercial and industrial distributed PV, which can minimize the off-site electricity costs of commercial and industrial users while guaranteeing the returns of distributed PV investors. This paper carries out this research on the above issues.
The team reviewed a large amount of literature before the beginning of the study and found that most scholars have conducted a lot of research on the traditional master-slave game relationship with distributed PV investment companies as the leader and industrial and commercial users as the followers.
Paper [
1] comprehensively investigates the state-of-the-art optimization methods for hybrid energy systems of photovoltaics, diesel turbine generators, and energy storage systems, and lays the foundation for solving the intricate and complex real-world problems related to the operation of distributed energy systems; Paper [
2] proposes a joint optimization and operation mechanism of distributed PV power generation market and the carbon market based on cross-chain trading technology from the perspective of the electric power market; Paper [
3] puts forward a novel trading energy-based operation framework, which helps to ensure the economic operation of aggregators and users in the distributed PV distribution system; Paper [
4] comprehensively reviews the development and impact of distributed PV in the electricity market, and discusses in detail the related market models and bidding strategies; Paper [
5] proposes a novel distributed energy system integrating CHP, PV power generation, and ground-source heat pumps, and develops a new distributed energy system based on a hybrid of differential evolution and particle swarm optimization algorithm and hierarchical analysis method to develop a seasonal operation strategy; Paper [
6] proposes a multi-stage and multi-period distributed energy optimization method based on deepening the market integration of distributed energy resources in the form of aggregation. Paper [
7] establishes a bi-level planning model for distributed PV energy storage systems in distribution networks, taking into account the uncertainty of distributed PV power output and the demand response behavior of users in the context of the coordinated operation of China's power market and carbon market; Paper [
8] combs through an analytical study of PV user demand response modeling and tariff mechanism from the perspective that PV user demand response can improve PV extinction rate.
This paper takes the above literature as the research background to establish a new type of master-slave game relationship with industrial and commercial users as leaders and distributed PV investment companies as followers. Under the circumstance of guaranteeing the investment interests of distributed PV companies, it is possible to minimize the cost of electricity for industrial and commercial users and improve the success rate of distributed PV contracting as much as possible. Since commercial power consumption cannot be deployed off-site, this paper only discusses the optimization of off-site industrial power consumption. For large manufacturing group enterprises using assembly line operation, electricity consumption is proportional to the production plan, i.e., the production plan deployment can be reflected in the respective electricity consumption of off-site factories. And because of the light resources, natural conditions, and market mechanism, the cost of photovoltaic power generation is not the same everywhere. The production deployment of heterogeneous industrial parks can make good use of the different costs of photovoltaic power generation in different places to optimize the deployment of production and thus save the cost of electricity. In the case of logistics deployment costs are not taken into account, low electricity cost areas to produce more products, and high electricity cost areas as far as possible to reduce the production of products. However, from a practical point of view, because of the volatility of electricity prices, distributed photovoltaic power generation is unstable and other factors, belonging to the same enterprise's off-site factories are difficult to make effective optimal deployment decisions. This paper addresses this issue.
In this paper, a mathematical model applicable to the optimization of the enterprise's off-site industrial production scheduling is first established. Secondly, because of the missing parameters of the model in practical application, an electricity price prediction model and a distributed PV levelized kWh cost model are established, in which the electricity price prediction model employs an LSTM neural network. Finally, the particle swarm algorithm is used to solve the model.
To verify the relevance and effectiveness of the model in solving the problem of off-site production scheduling on the demand side of electricity, the research team researched two off-site pharmaceutical factories located in Kunming, Yunnan Province, China, and Binzhou, Shandong Province, China, and belonging to the same large-scale pharmaceutical enterprises, through field visits and telephone interviews, and obtained the relevant research data. Finally, the research data on behalf of the model solution, the results concluded that this paper establishes the enterprise off-site industrial production scheduling optimization model can effectively reduce the enterprise's electricity costs.
2. Industrial Production Optimization Scheduling Model
Aiming at the problem of high cost of electricity consumption of off-site factories belonging to the same enterprise, this paper proposes an optimization model of off-site industrial production scheduling of the enterprise. The model can make good use of the different PV resources, different electricity prices and other conditions to reduce the total cost of electricity for enterprises' off-site factories, and increase the contracting rate of distributed PV investment.
2.1. Tripartite Electricity Trading Model
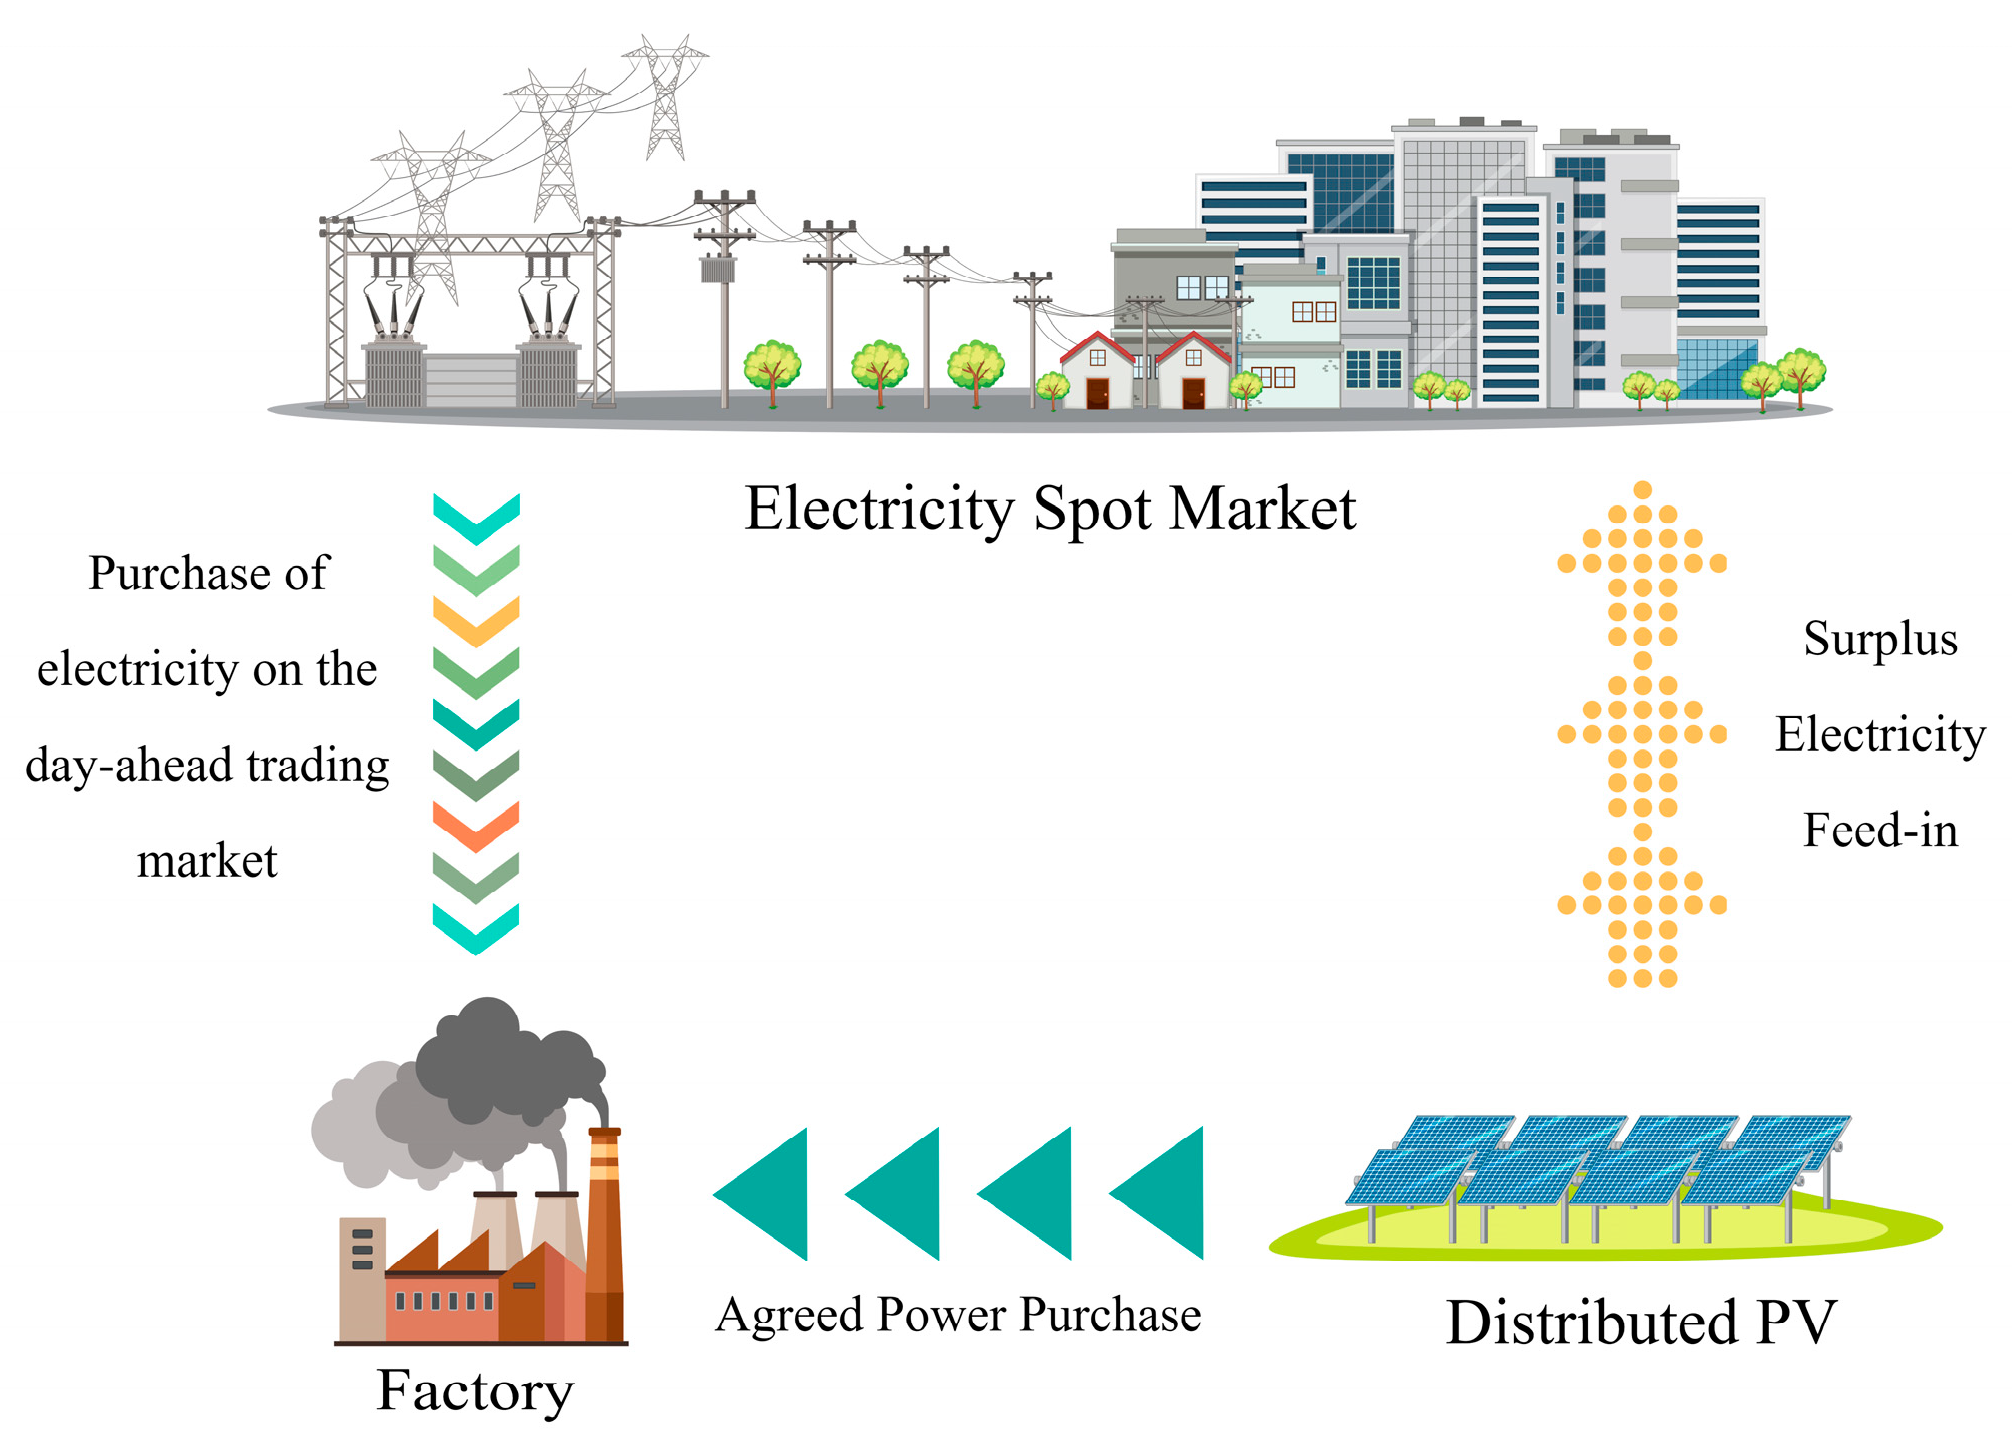
A three-party power trading model is first developed for a single-site factory, which is proposed on the basis of the traditional distributed PV contract energy management model (EMC). This distributed PV operation model consists of a factory providing a roof for free and a third party investing in the construction of a PV power plant; the third party is the asset owner but also needs to share the revenue to the factory. The third party, i.e., the distributed PV investor, signs an agreement with the factory that, under the premise of guaranteeing a return on the distributed PV investment, the factory purchases the agreed power from the distributed PV investor at an agreed tariff on a daily basis as the basic time unit. Essentially, the factory is the leader and the distributed PV investor is the follower, and the two constitute a master-slave game relationship [
9].
The advantage of this operation model is that usually the customer-side tariff is significantly higher than the residual feed-in tariff, the distributed PV investor can sell electricity to the factory for higher profit, and the factory can save electricity cost by using the investor's PV power generation. This mode of operation increases the willingness of factories to provide distributed PV installation sites compared to the traditional EMC mode, as the factories will be more flexible in the way they use electricity under this mode of operation.
As shown in
Figure 1, the plant can purchase agreed power from the distributed photovoltaic company at an agreed tariff and can purchase power from the power day-ahead trading market, and the distributed photovoltaic company's remaining power is fed into the grid at the coal-fired benchmark price.
2.2. Enterprise Off-Site Industrial Production Optimization Scheduling Model
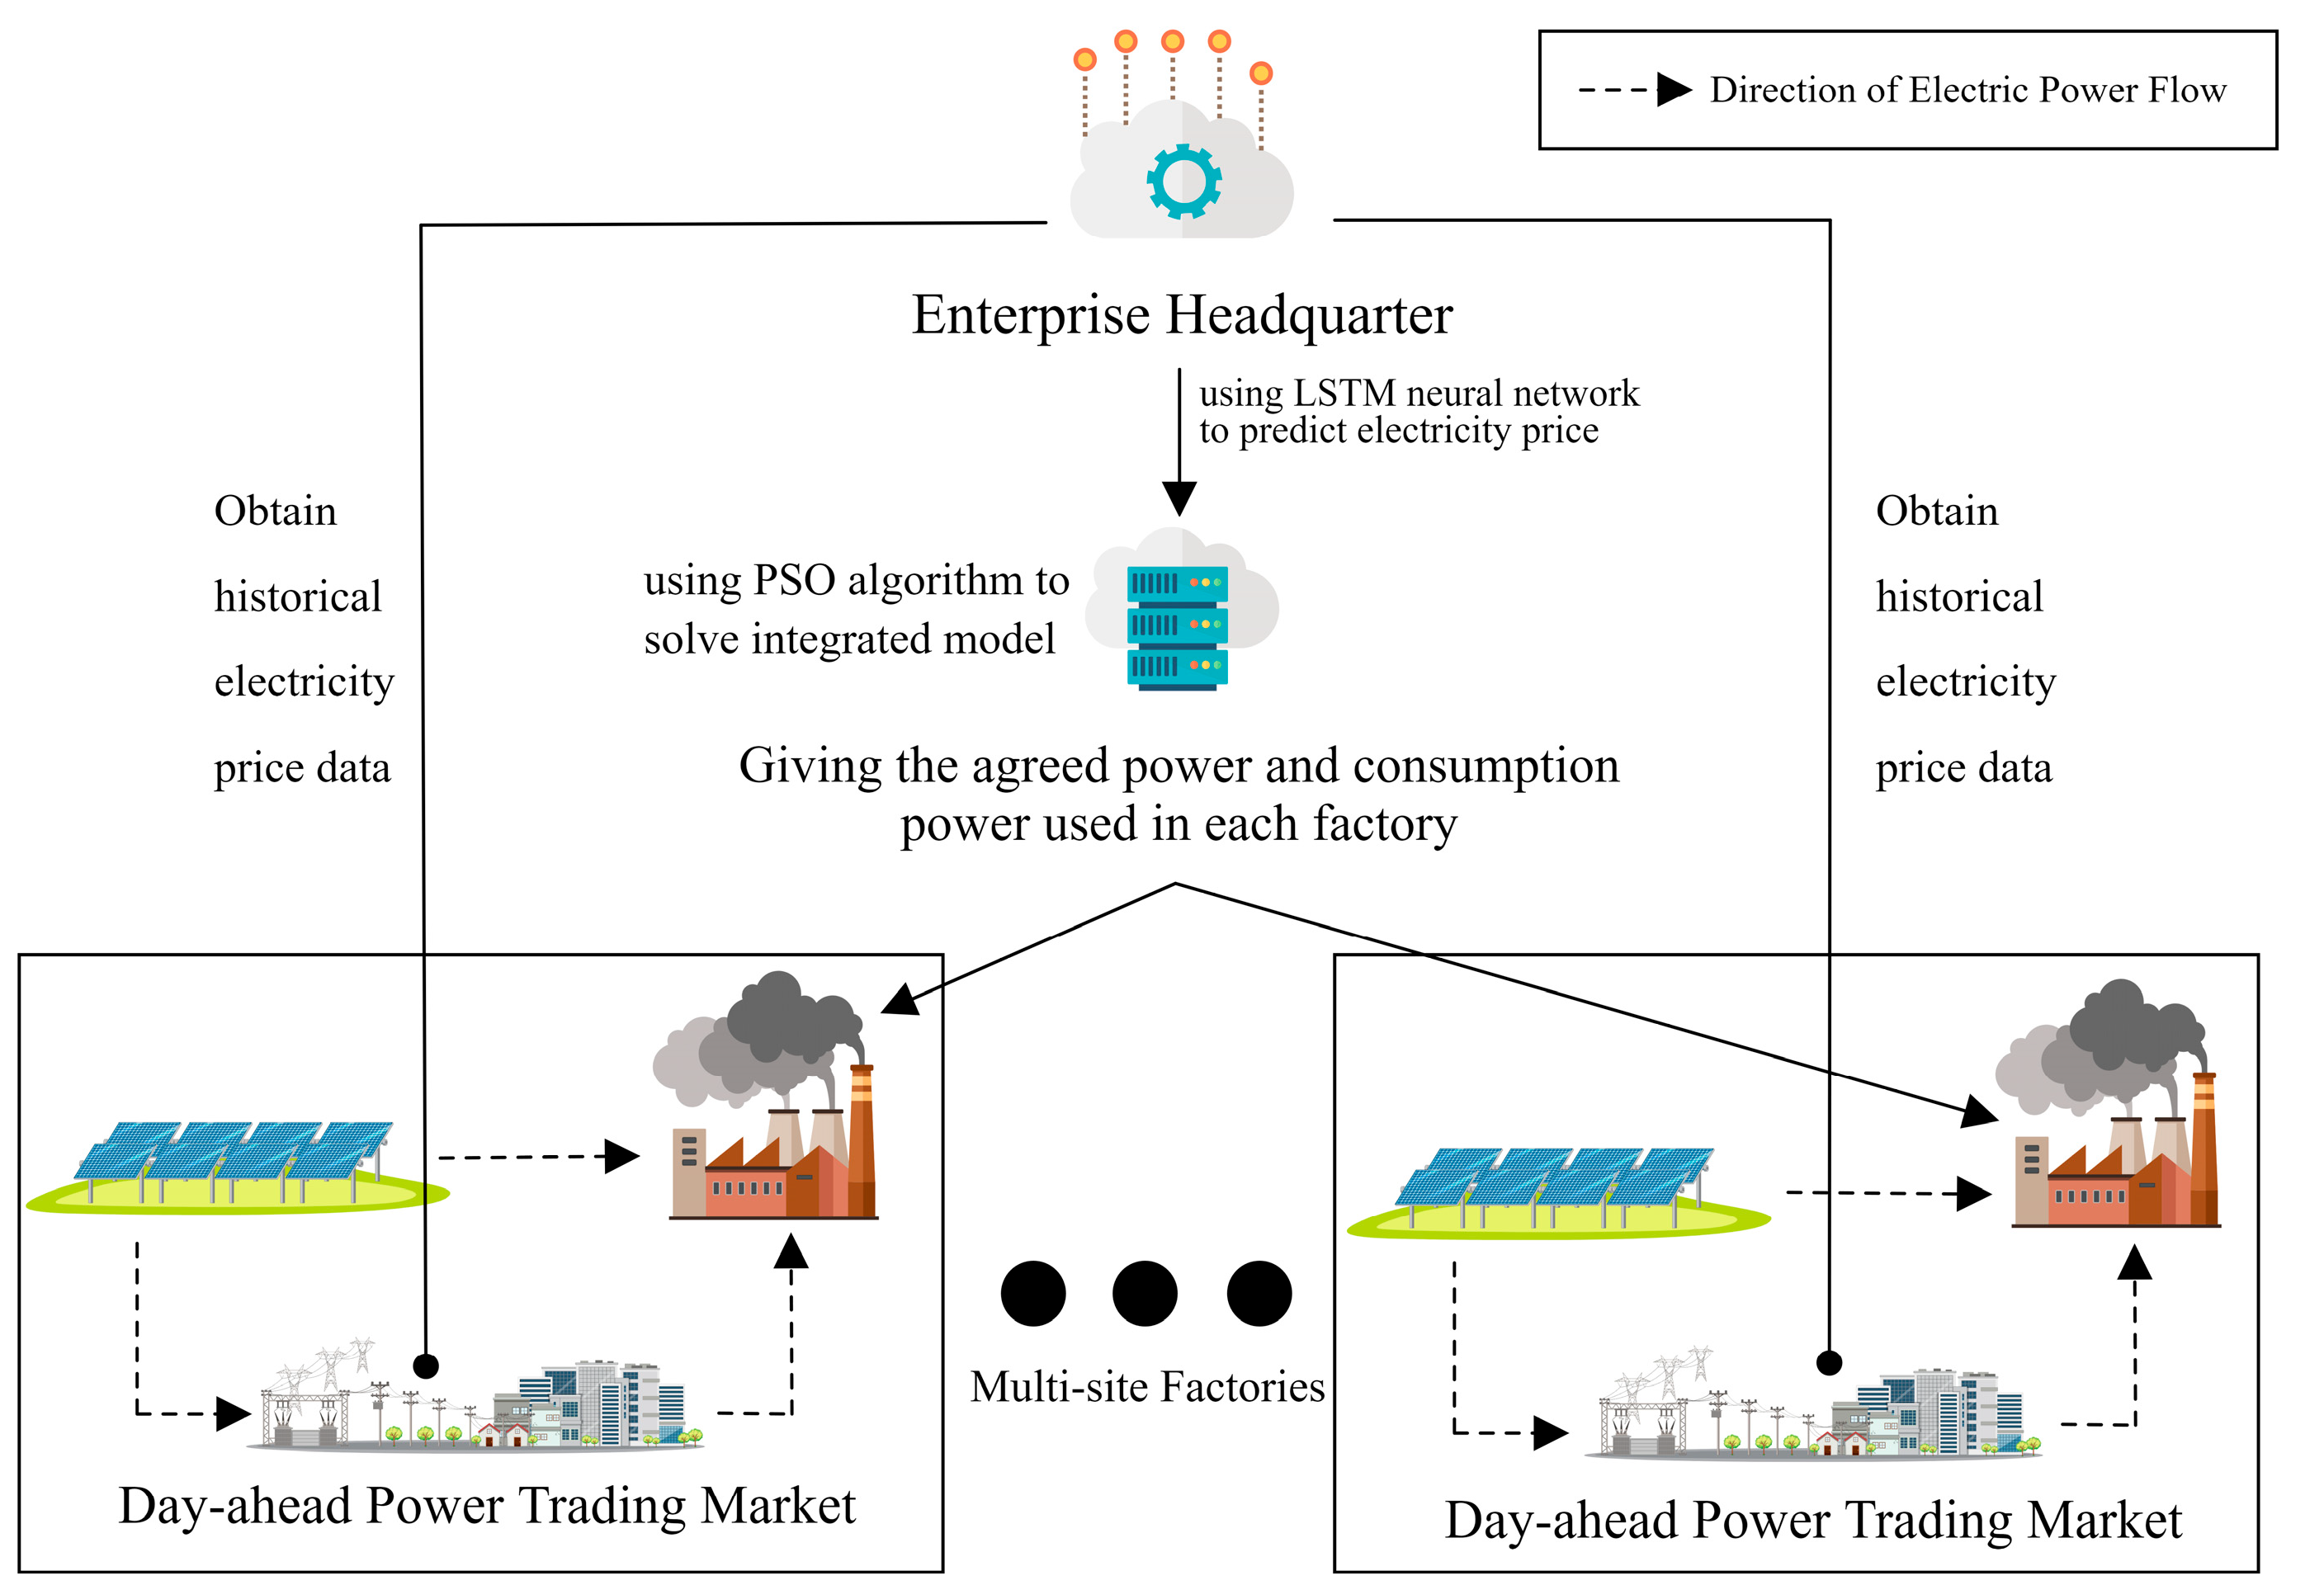
For the case of joint production of multiple factories in different places, the above model is no longer applicable, so this paper proposes an enterprise's off-site industrial production optimization scheduling model (see
Figure 2). The daily production schedules of the off-site factories distributed in each province of China are decided by the enterprise headquarters, i.e., the enterprise headquarters runs the off-site industrial production optimization scheduling model to derive the daily electricity consumption and the agreed amount of electricity of the factories in each place. Finally, the factories in each province purchase the difference between the daily power consumption and the agreed power, i.e., the daily power purchased from the grid, from the provincial power trading center.
A mathematical model is developed with respect to the model structure in
Figure 2, where the objective of optimal scheduling is to minimize the total cost of electricity (i.e., the cost of electricity to the enterprise) for all factories in the off-site location while producing the same number of products, and the objective function of the model is thus listed.
And the daily power consumption of each plant can be expressed by the following equation. (See
Appendix A for a description of the relevant symbols.)
The constraints of the model are discussed next. The first is that the total number of goods produced by all factories needs to satisfy the total number of goods in the production plan. Second, due to the limited capacity of each factory, there is an upper limit on the number of commodities it can produce per day. Finally, the deployment of commodity production directly affects the agreed electricity quantity, which in turn affects the revenue of the distributed PV company. Therefore, the production deployment needs to ensure the return on investment of the distributed PV company.
It is assumed that the industrial assembly line of each factory is almost the same, so in the case of producing the same kind of commodities, the electricity required per unit quantity of commodities can be regarded as the same. Therefore the production deployment of the commodity can be expressed indirectly using the power consumption of the factory.
In summary, the following constraints can be listed.
2.3. Particle Swarm Algorithm Solution
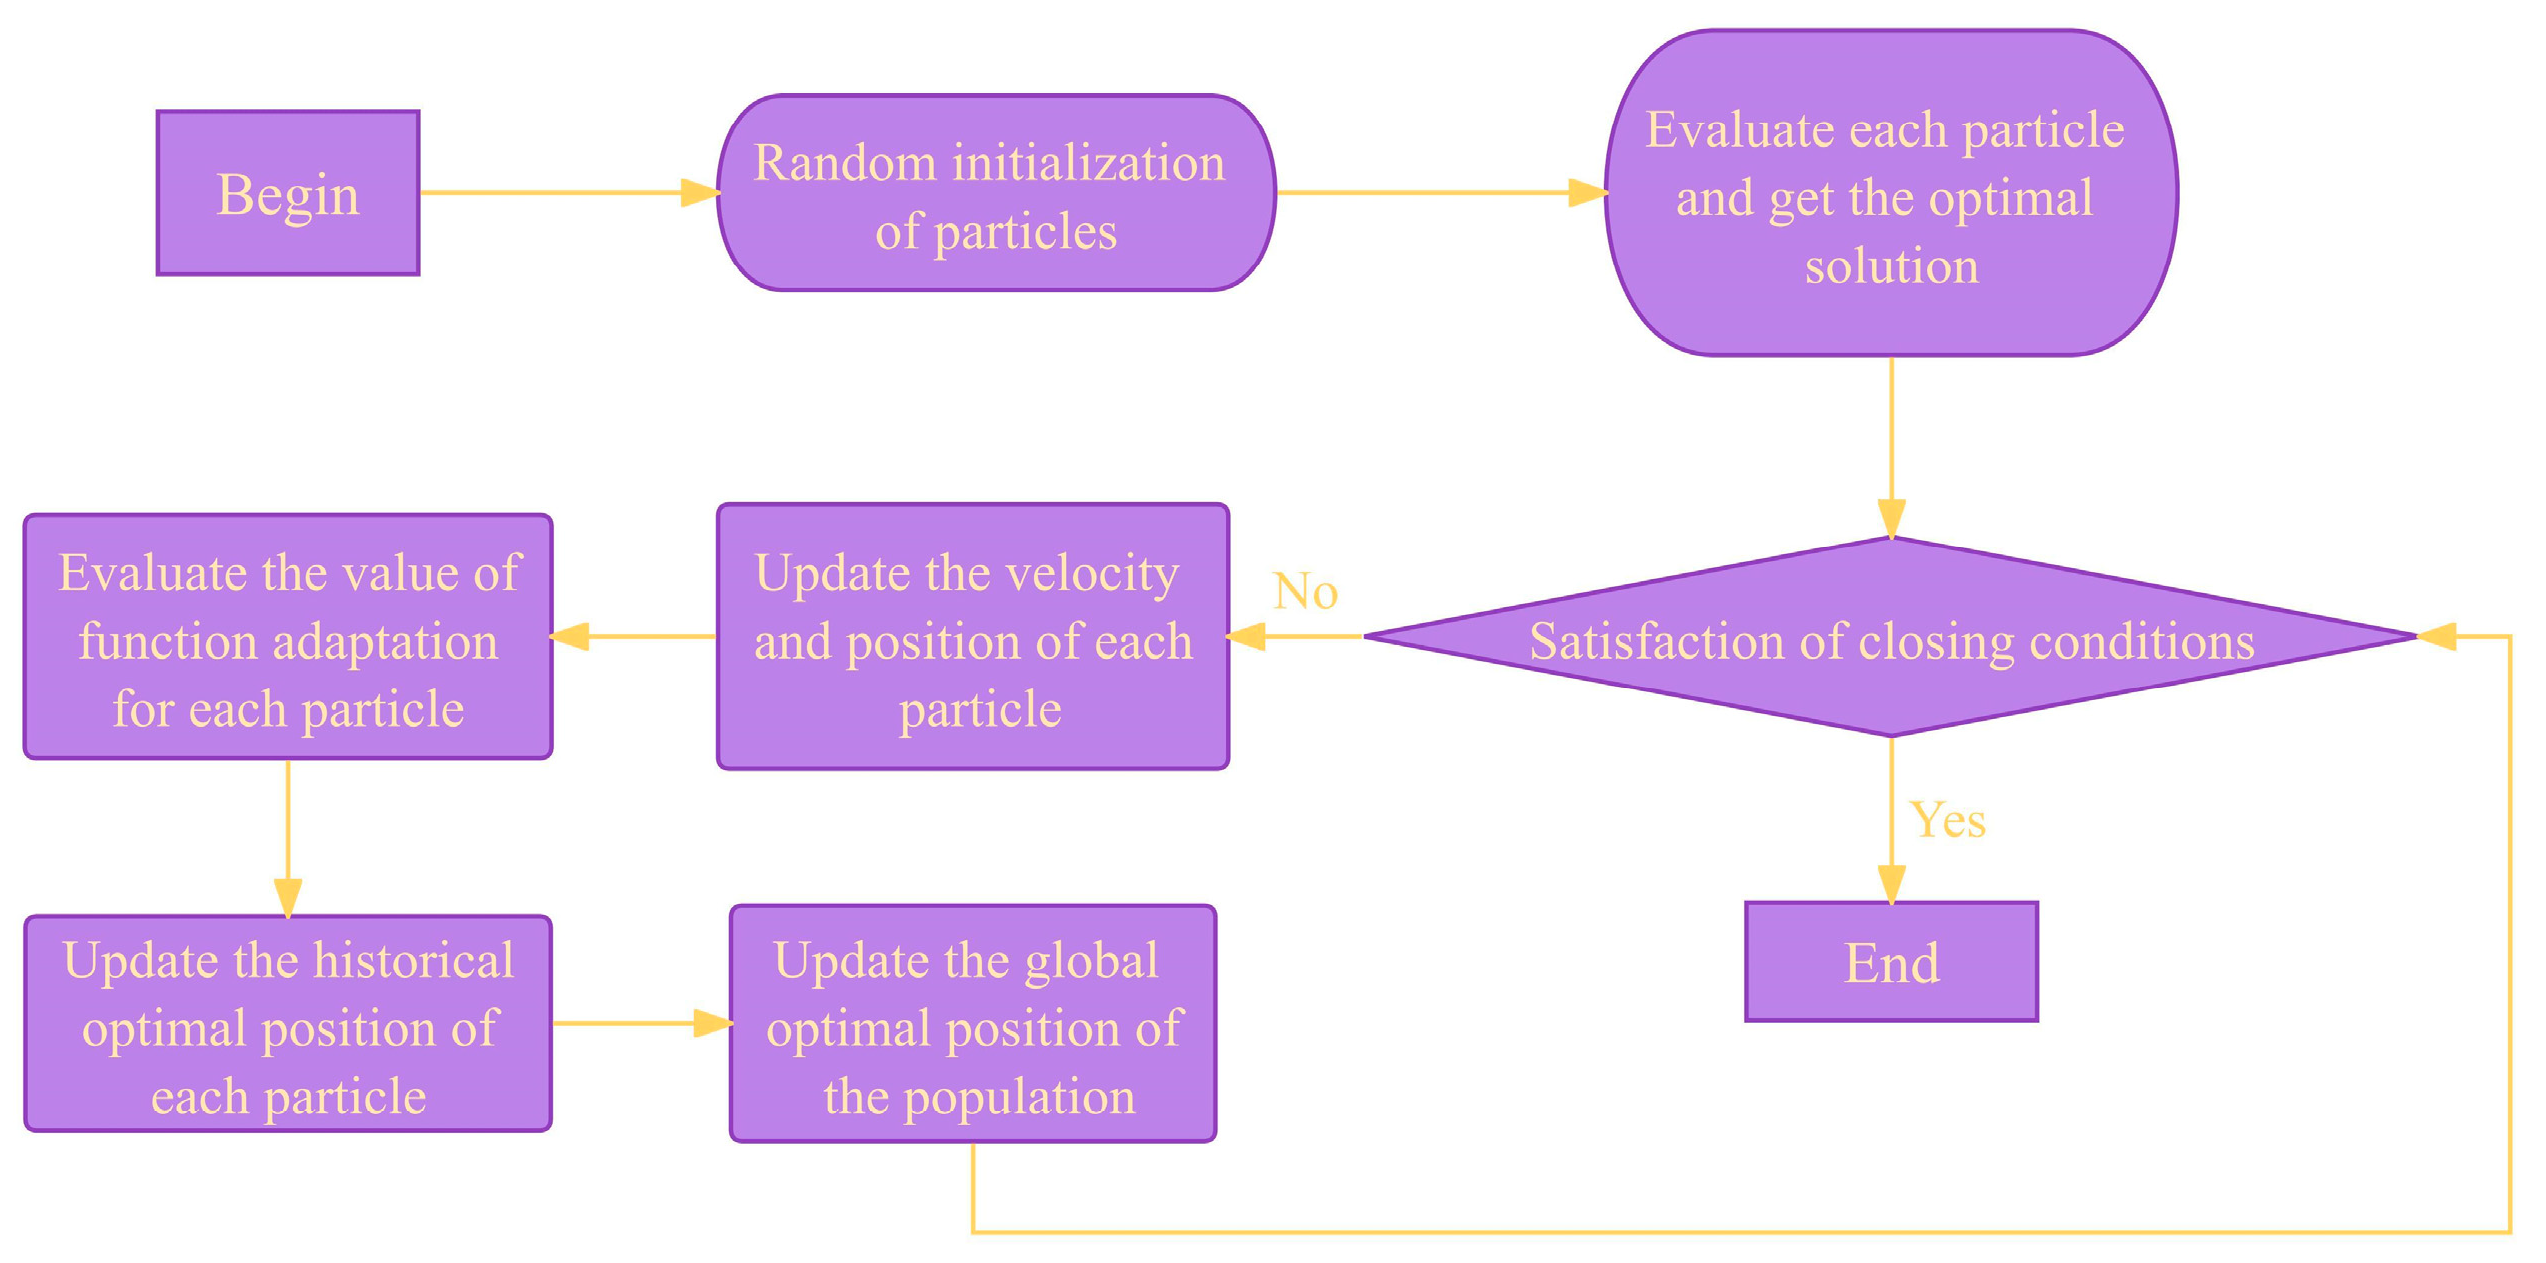
In summary, the optimization model required to be solved is a quadratic programming model, and this paper uses particle swarm modern optimization algorithm for solving. The structure of the particle swarm algorithm is shown in
Figure 3.
The algorithm simulates the collaboration and information sharing between individuals in a population by continuously adjusting the direction of movement of the individuals in the expectation of finding an optimal solution to the problem. At the beginning of the algorithm, particles are randomly distributed in the search space according to some initialization strategy. Then, each particle updates its velocity and position based on its current position and velocity as well as the information of other particles in the neighborhood. This updating process includes two important parts: individual experience and social experience. Individual experience is the ability of a particle to adjust its velocity and position based on the optimal solutions it has found in its history. Social experience is the particle's ability to adjust its speed and position by observing the optimal solutions of other particles in its neighborhood. These two types of experience allow particles to retain both individual optimal solutions in the search space and to search globally through group collaboration. In each iteration, the particle evaluates the current solution based on the updated velocity and position and compares it to the optimal solutions found historically. If a better solution is found, the historical optimal solution is updated. The algorithm proceeds iteratively until a stopping condition is met, such as reaching the maximum number of iterations or finding a solution that satisfies the accuracy requirement.
Particle swarm algorithm has better global search ability and convergence speed, which is proved by related literature [
10,
11,
12,
13,
14,
15,
16] to be suitable for solving various types of optimization problems such as continuous, discrete, and multimodal.
In the actual production operation, the enterprise headquarters in the implementation of the production plan the day before the comprehensive consideration of the constraints (plant capacity, distributed PV power generation and production plan, etc.), running particle swarm algorithm to solve the optimization model and the results will be fed back to the factories around the factories, factories around the respective provinces of the power trading centers and distributed PV investors reported to purchase power. As most of the provinces in China's power market adopts the day-ahead trading method, this trading method requires the power generator to report the power and tariff the day before the power consumption, while the power purchaser only reports the power, i.e., the purchaser is unable to determine the day-ahead trading tariff. Therefore, it is difficult for the enterprise headquarters to determine the next day's electricity trading price and distributed PV levelized cost of electricity, resulting in the lack of parameters for this optimization model to be solved efficiently, so the electricity price prediction model and distributed PV levelized cost of electricity model will be discussed in the next 3 and 4. The electricity price prediction model is used to calculate the in 2.2, and the distributed PV levelized cost of electricity model is used to calculate the in 2.2.
3. Electricity Price Prediction Model Based on LSTM Neural Network
At present, China's electricity market is far less free for market transactions than the electricity markets in the United States, the United Kingdom, and other Western countries due to the constraints of the planned economy. Only a few provinces under the jurisdiction of the State Grid Corporation (SGC) and the Southern Power Grid Corporation (SPGC) have piloted the spot market, and most of the provinces have adopted the medium- and long-term trading system, supplemented by the day-ahead trading market [
17,
18,
19,
20]. Compared with the spot market, the trading price in the day-ahead trading market is more stable, which is more in line with the power trading mode required by the optimal scheduling model of industrial production in this paper. Therefore, the model established in this paper is an electricity price prediction model in the context of the day-ahead trading mode of the electricity market.
Second, in such a trading context, two factories located in different provinces, need to report their grid power purchases one day before the transaction. According to the formula in 2.2, since the plant's daily electricity consumption is a fixed value, the amount of power purchased from the grid is determined by the agreed amount of power. The trading price in the electricity market on the day of the transaction will directly affect the agreed amount of electricity reported by the plant to the distributed PV company. Therefore, accurate prediction of the trading price in the power market is crucial for off-site industrial production scheduling.
The forecasting of trading prices in electricity markets is essentially a one-dimensional time series forecasting problem [
21,
22,
23]. There are many methods to solve the time series forecasting problem, including the traditional Autoregressive Integrated Moving Average (ARIMA) model and Seasonal and Trend Decomposition (STL) model, but these traditional time series forecasting models are only suitable for smooth seasonal and linear forecasting tasks. For those more stochastic and volatile power market price forecasting tasks, these traditional time forecasting models are not able to perform well, which requires the use of neural networks in machine learning. Currently, the neural networks applicable to the time series prediction problem are Recurrent Neural Network (RNN), Long Short-Term Memory Network (LSTM), Gated Recurrent Unit (GRU), Transformer and Convolutional Neural Network (CNN) [
24,
25]. However, relevant literature [
26] illustrates that Transformer and CNN perform poorly in solving time series prediction problems with small sample size. And since the current electricity day-ahead trading market in most provinces of China has been established for too short a period of time, mostly within three years, the sample size of data on electricity price is too small. Such a data situation will cause the Transformer model and CNN, which need large-scale data support, to perform poorly in the time series prediction problem in this paper, so this paper adopts an improved LSTM neural network structure based on RNN [
27,
28,
29].
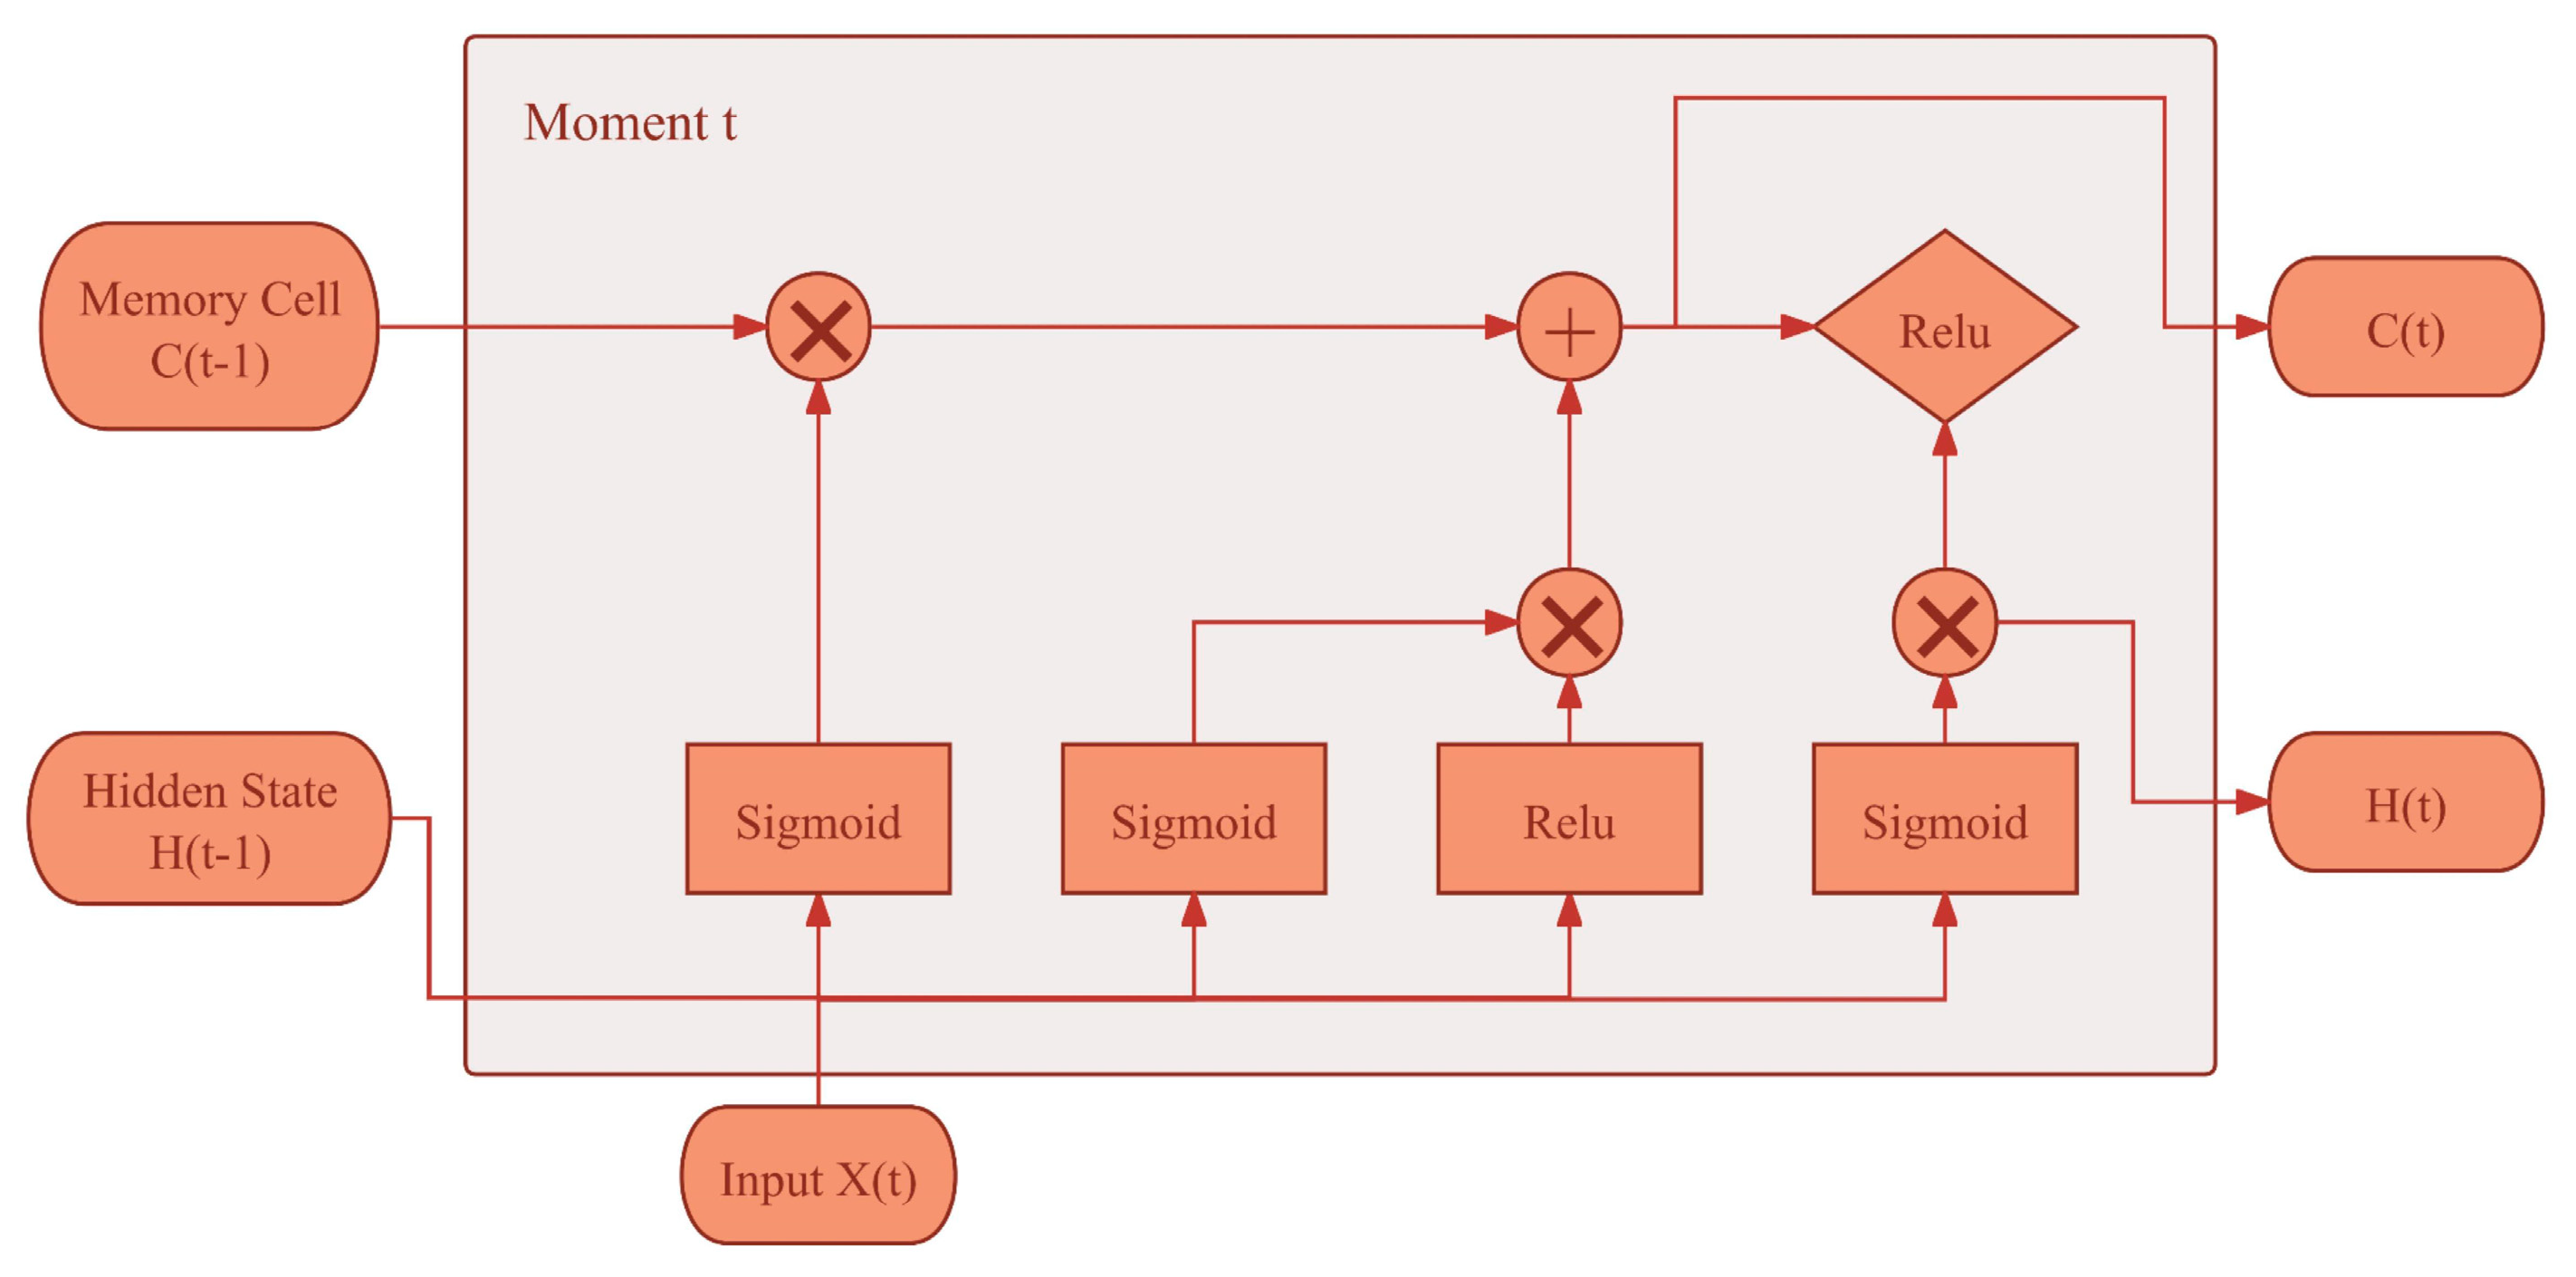
The LSTM neural network structure is shown in
Figure 4, which is different from the traditional LSTM neural network in that the neural network employs the Relu function. This helps to alleviate the problem of gradient vanishing during information transfer for long sequences and reduces the redundancy of parameters, improves the generalization ability of the model, as well as helps the neural network to learn more complex feature representations. In the actual model training, a sequence input layer with a dimension of 40 was set up, followed by an LSTM layer with 20 hidden units, and finally a fully connected layer and a regression output layer.
4. Distributed Photovoltaic kWh Cost Model
To evaluate and predict the economic operation of distributed photovoltaic (PV) power generation projects, we used the Net Present Value (NPV) method to calculate the average unit cost of power generation over the entire project cycle [
30]. The formula is as follows.
is the distributed PV kWh cost;
is the total cost of the distributed PV project;
is the total power generation over the project cycle. The following paper describes the calculation of
and
in detail, respectively.
4.1. Total Cost of the Distributed PV Project
Specifically, the following formula was used to calculate the discounted cost of distributed PV projects:
is the initial investment cost of the system; is the annual operation and maintenance cost rate; is the insurance premium rate, which is assumed to be a fixed percentage to simplify the evaluation process; is representative of the annual interest expense due to the loan; is the discount rate, which is taken to be 8.5% according to the provision of the "Financial Benchmark Returns of Construction Projects" of the National Development and Reform Commission of China; n is the period of the investment, which is based on the lifespan of 25 years of the distributed photovoltaic power generation project, i.e., n=25.
Initial investment cost () is the total cost to be paid at the beginning of the project, the initial full investment in China's commercial and industrial distributed PV systems mainly consists of the purchase of PV modules, installation of electrical equipment, etc. This cost is a one-time payment, which is not affected by time during the entire project cycle, and therefore does not need to be discounted. the full investment cost of China's commercial and industrial distributed PV systems in 2022 is 3.74 RMB Yuan/W.
According to the results of related research, the operation and maintenance expense () is set to be 1% of the initial investment cost (), the distributed PV long-term loan interest rate () is 6. 5 %, the insurance premium rate () is taken to be 0.1% of the initial investment cost (), and the initial investment cost () is taken to be the base model of 20 % of own funds and 80% of the bank loan.
4.2. Total Power Generation over the Project Cycle
Meteorological conditions are critical to distributed PV power generation. Factors such as light duration and temperature will directly affect the power generation efficiency of PV panels. In this paper, we will utilize the built-in metenorm meteorological database in the PVsyst software to set up the meteorological sites of the pharmaceutical factory as a reference for meteorological data.
The module mounting type has an important impact on the annual power generation of PV, in this paper we will use the module mounting type with seasonally adjustable orientation, preset tilt angle of 20 degrees in summer and 50 degrees in winter. PV array characteristics include, PV modules, inverter selection, operating conditions (temperature), module area and other major factors that determine the efficiency of the PV array, in the array construction planning, has been taken into account in the initial investment costs, this paper will be common in the market 300Wp photovoltaic modules and 30kWac inverter as a preset condition.
In this paper, in predicting the total life cycle power generation, the losses are discussed in several parts such as heat loss, line loss, module quality-LID-mismatch loss, fouling loss, and IAM loss with aging. Heat loss-Field heat loss coefficient, preset stand type is open and annual heat loss reaches 3.00%. Line Losses-Line losses for DC loop arrays are defaulted to 1.5%. Total module power loss is preset to 2.8%, LID-Deterioration due to light irradiation is preset to 2%, and voltage mismatch loss is 0.15%. The annual fouling loss factor is preset to 3%. Among them, the total annual attenuation coefficient of individual PV modules is 3.8%, and the efficiency decrement is carried out year by year through Monte Carlo calculations.
The was obtained by summing the annual total power generation forecasts of 25 years output year by year through PVsyst software respectively.
5. Case Analysis
To validate the off-site industrial production optimization scheduling model established in this paper, as well as the corresponding sub-models and algorithms, the team conducted fieldwork and research on two factories located in Kunming, Yunnan Province, China, and Binzhou, Shandong Province, China, and obtained relevant data. The Kunming factory in Yunnan Province and the Binzhou factory in Shandong Province mainly produce I.V. preparations, both of which are automated assembly lines operating 24 hours a day. The two factories belong to the same group of companies, which is a leading pharmaceutical company in China. From the perspective of electricity consumption, the electricity consumption of the two pharmaceutical factories is not affected by seasons, climate and other objective factors, and the electricity consumption is determined only by the production plan. From the perspective of policies of the two provinces, the power trading policies and distributed PV policies of the two provinces a few days ago are basically the same. From the perspective of PV resources, the two provinces have excellent light conditions and are currently popular provinces for PV investment in China. Combining the above conditions, the computational example is an ideal arithmetic example for the model in this paper.
5.1. Description of the Case System
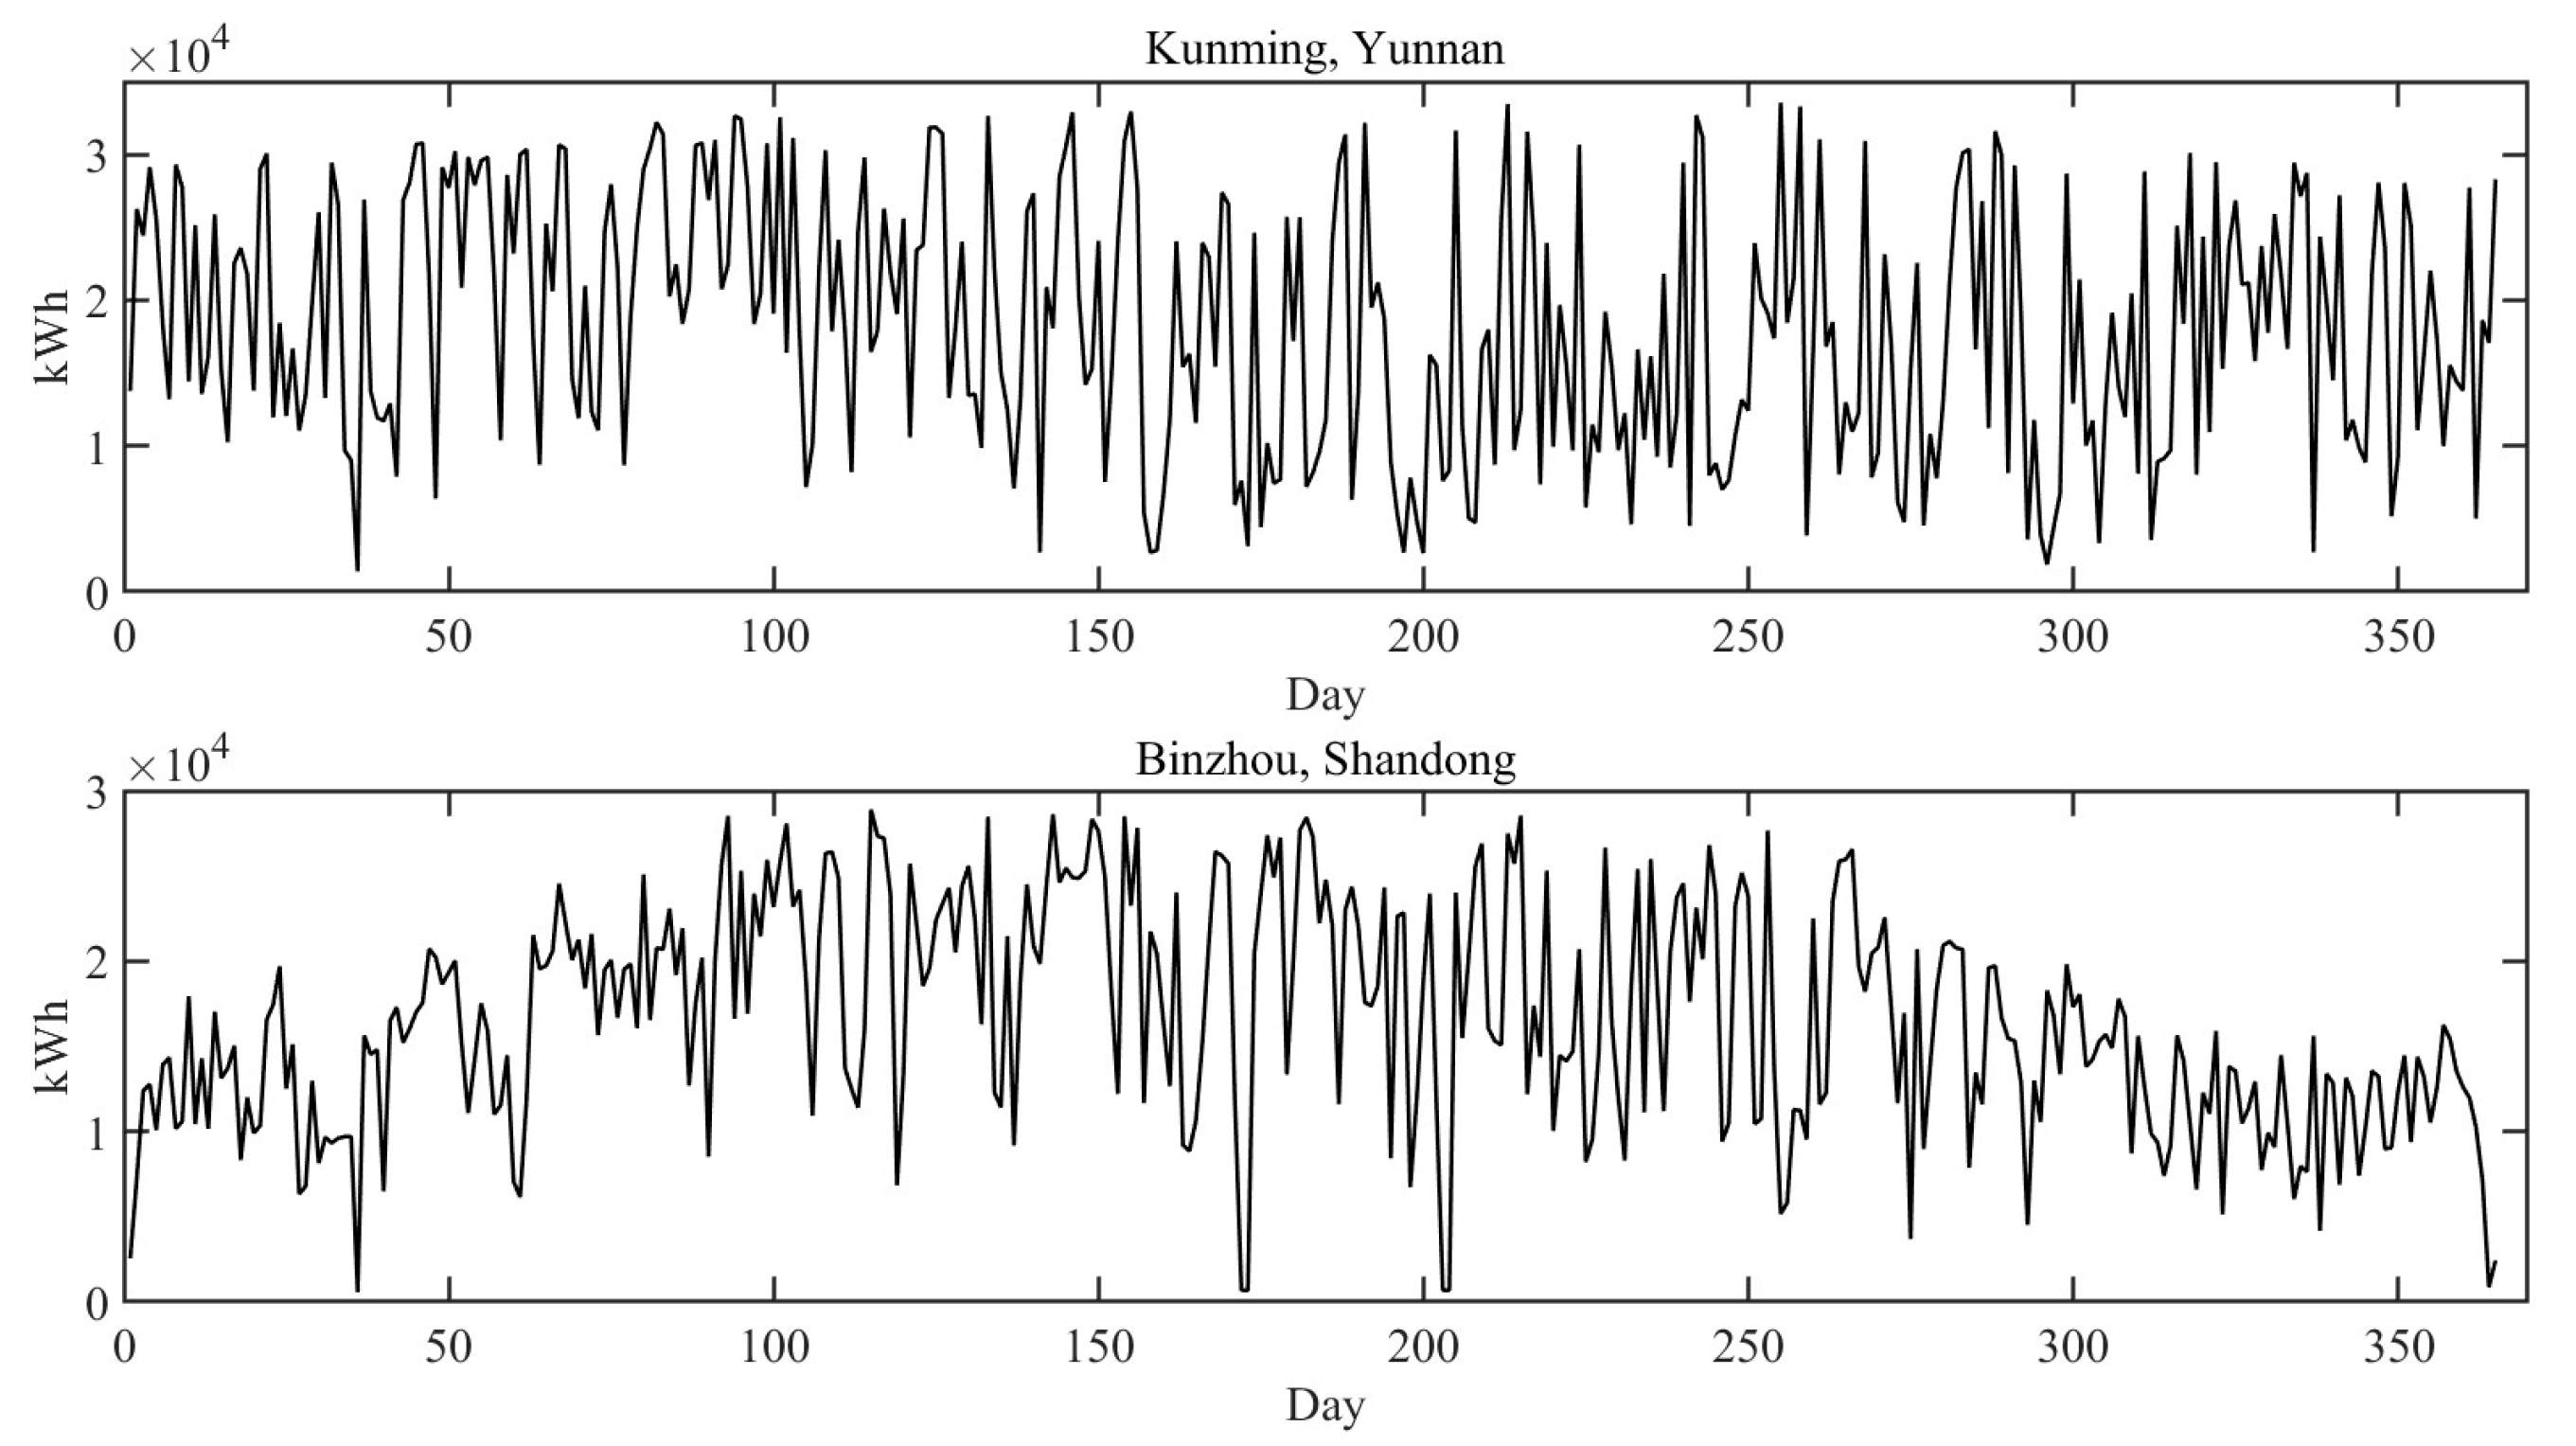
To reflect the optimal scheduling characteristics of this paper's model for heterogeneous industrial production, the team retrieved the electricity consumption data of the pharmaceutical factories in the two locations for the whole year of 2023 (see
Figure 5). The electricity consumption of the pharmaceutical factories in the two places was summed up to get the total electricity consumption data. The optimal scheduling model for heterogeneous industrial production reallocates the total electricity consumption in 2023, which laterally reflects the allocation of the production plan. Therefore, the time horizon of this algorithmic system is 365 days in 2023, and the geographic scope is Kunming, Yunnan, China and Binzhou, Shandong, China. The related geographic information is shown in
Table 1.
The team researched the energy and electricity tariff policies of Yunnan and Shandong provinces and obtained information on the parameters of the relevant examples. Among them, the distributed PV residual power feed-in price is set according to the local province's coal-fired benchmark price according to the relevant policy; the industrial electricity price consists of the feed-in tariff, feed-in link line-loss cost, transmission and distribution tariff, system operation cost, governmental funds and surcharges, etc., according to the relevant policy; the agreed tariff is determined according to the average of the local industrial electricity price; and the daily power generation of distributed PV is simulated by the PVsyst software for the first year electricity generation is derived. The overall parameter settings are shown in
Table 2.
5.2. Description of the Results of the Sub-Model Operations
5.2.1. Distributed Photovoltaic Power Generation
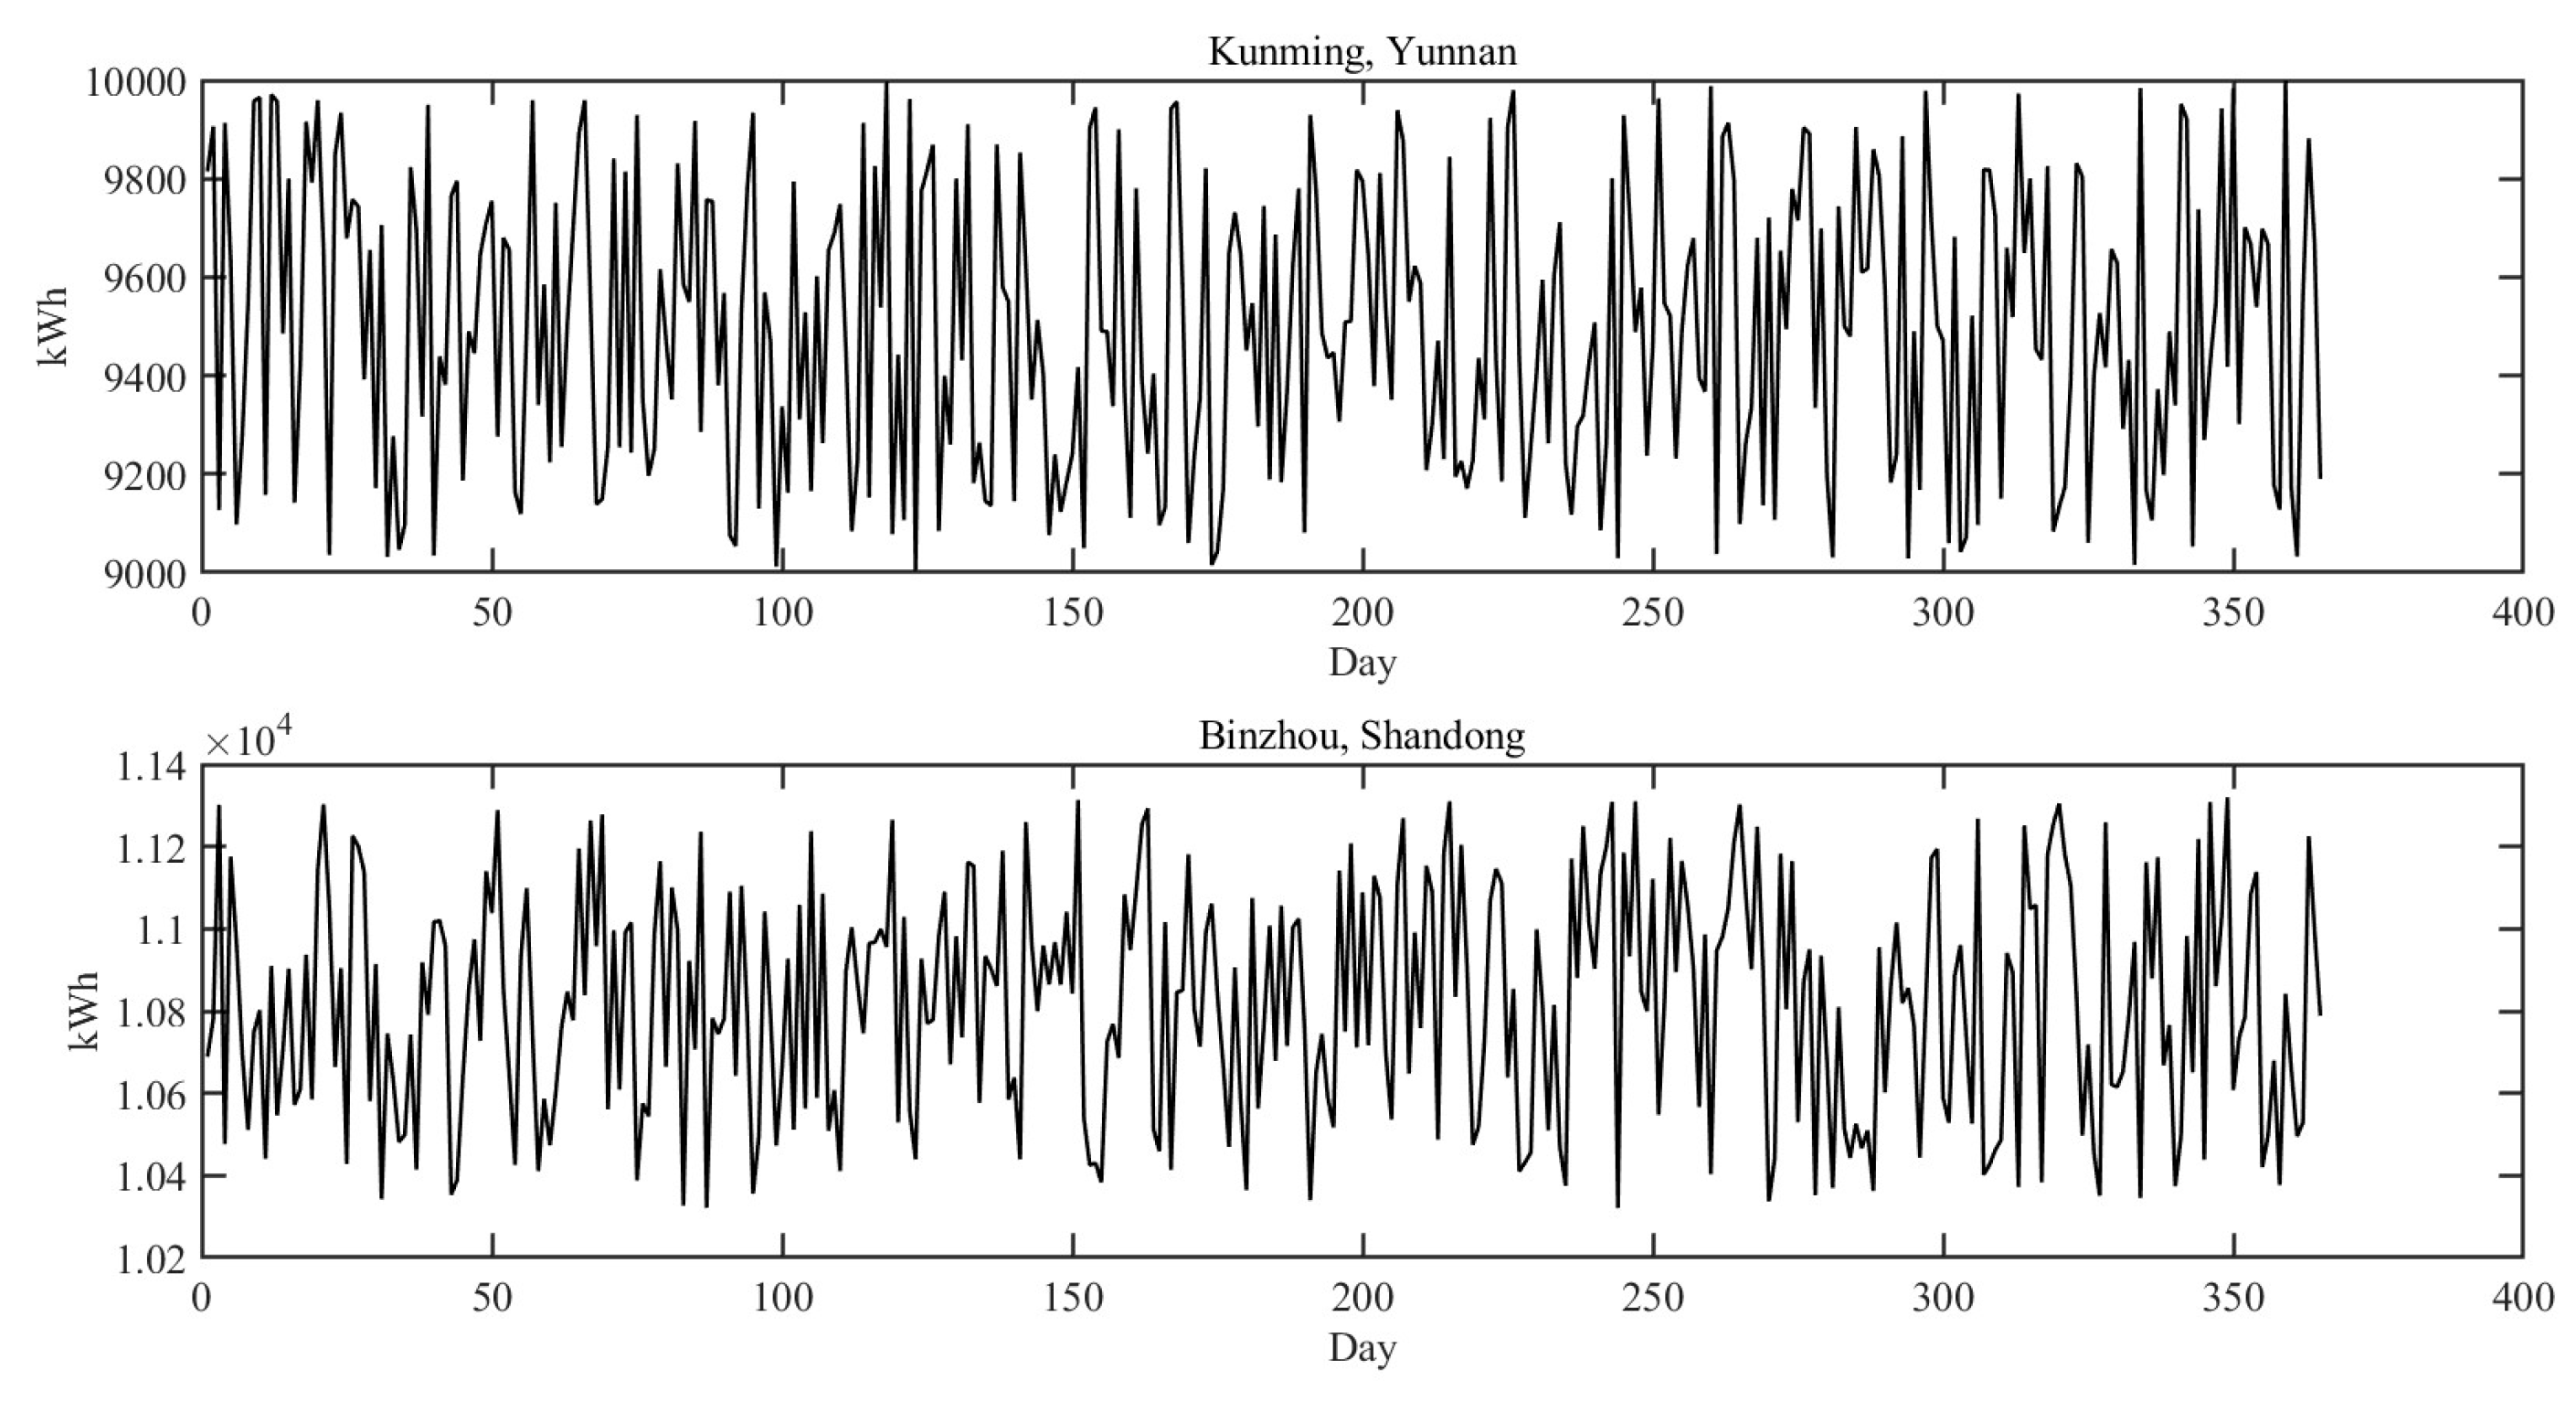
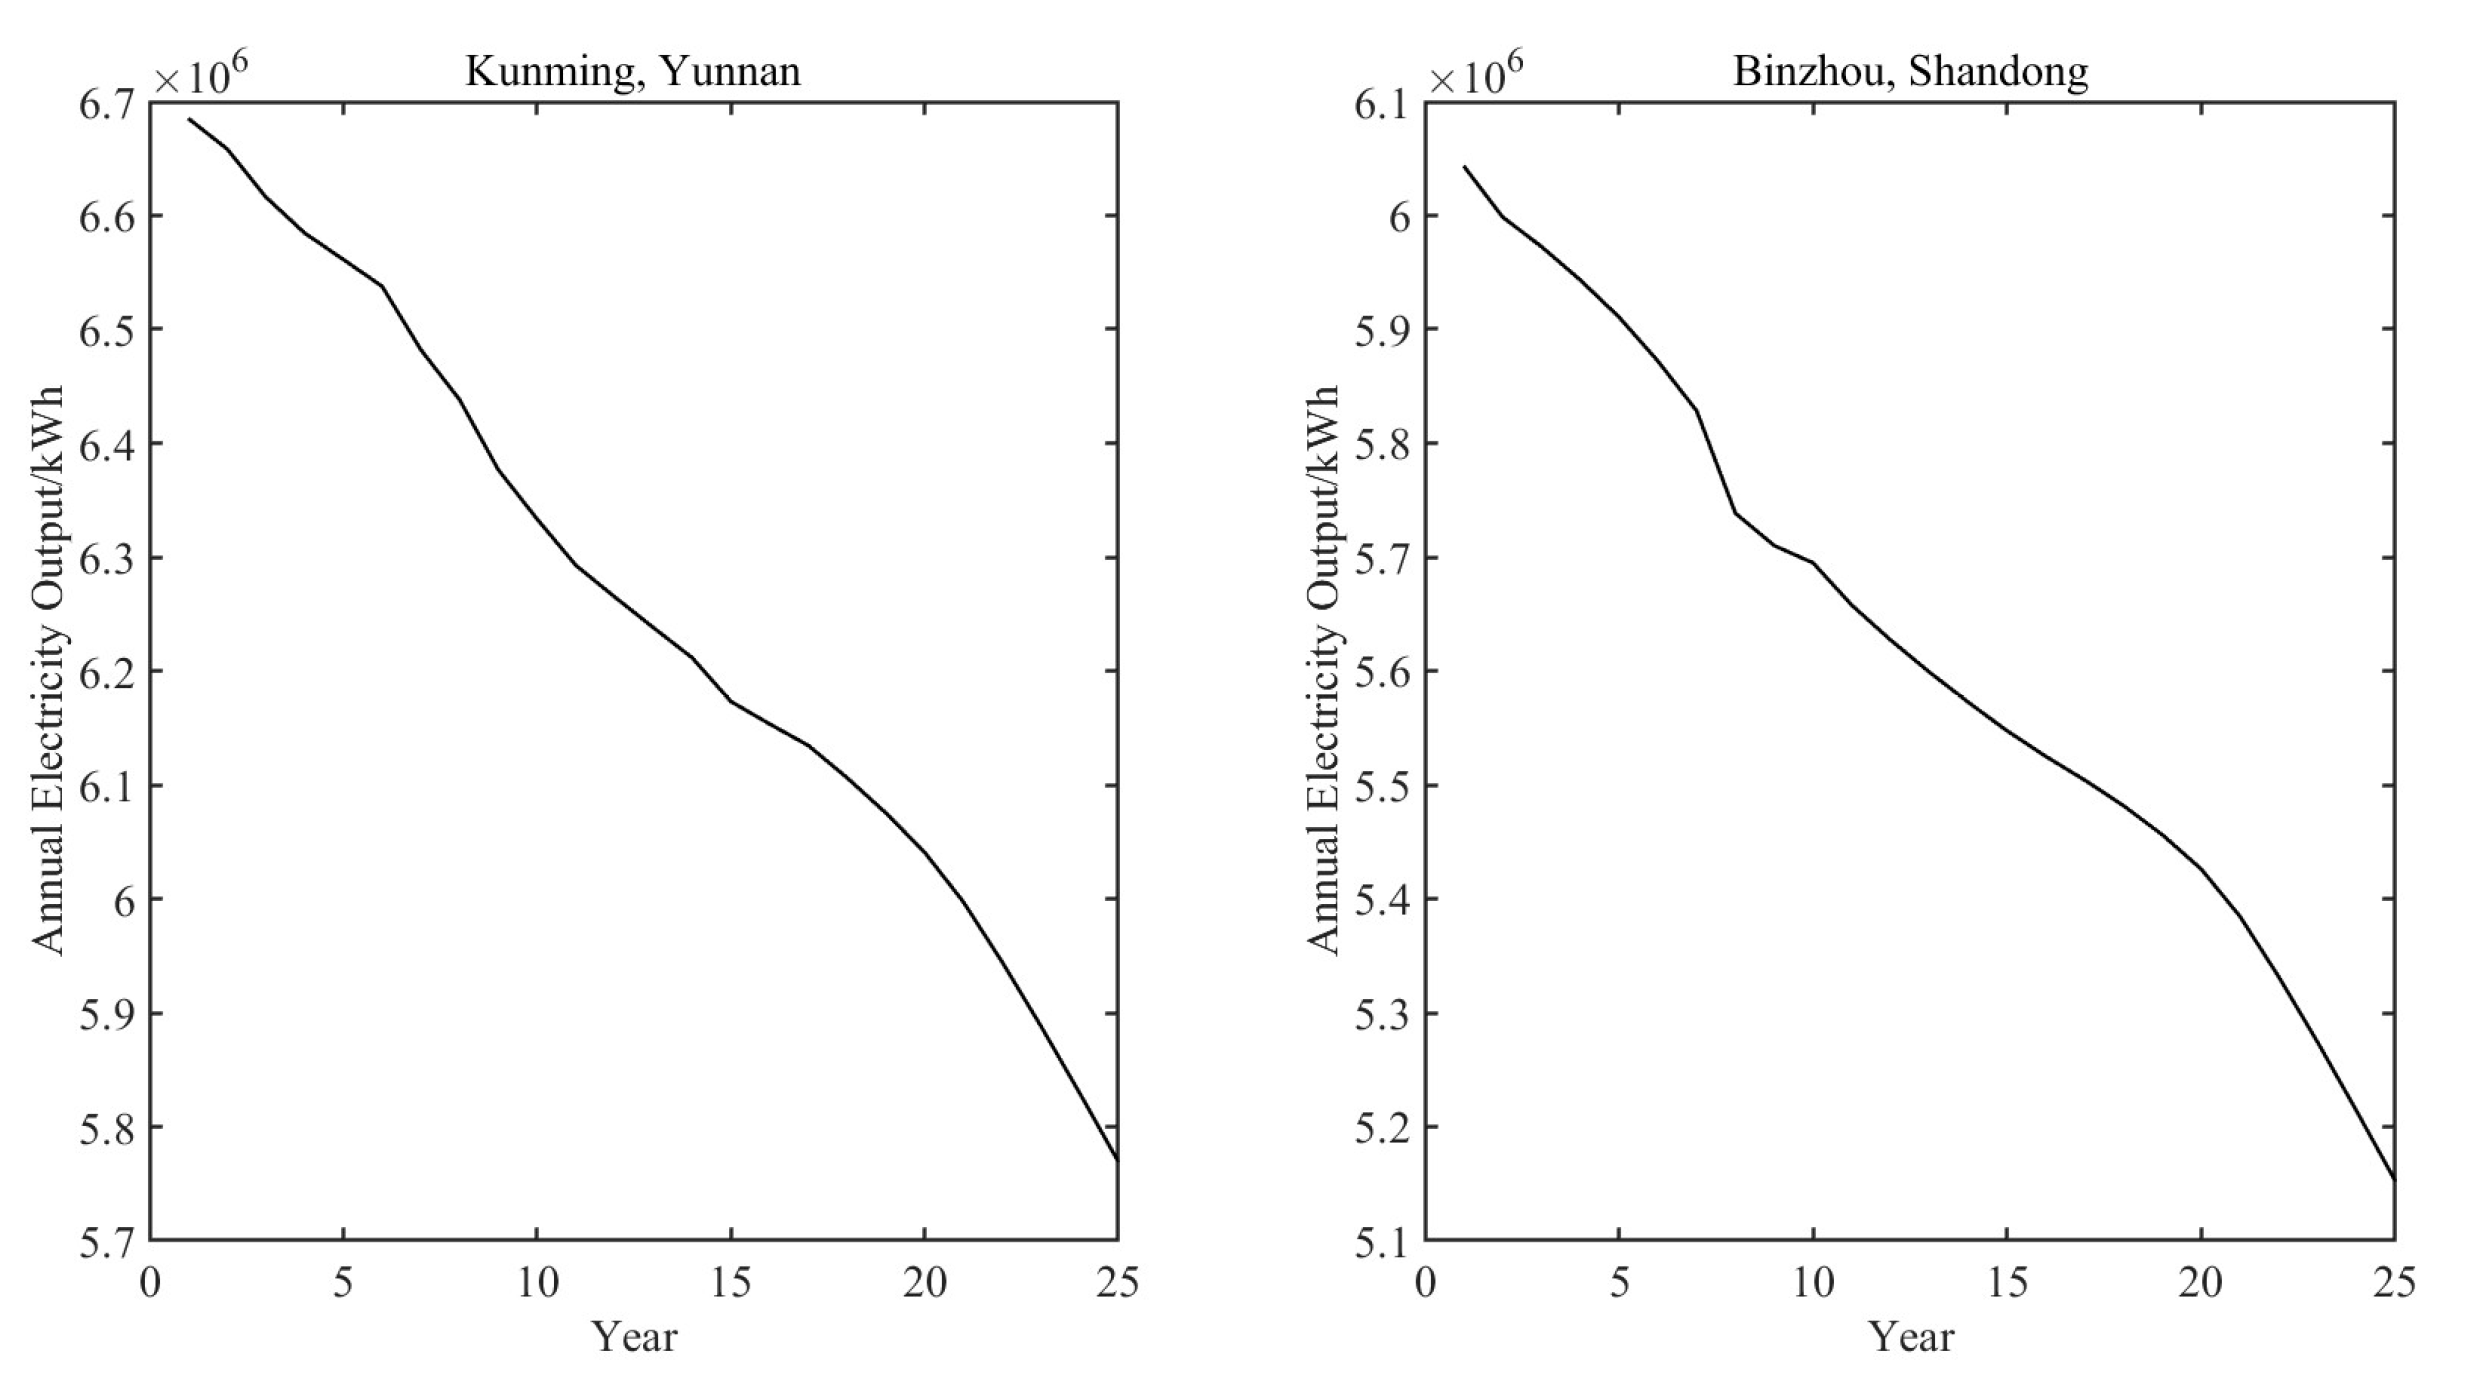
The PVsyst software is used to simulate the distributed PV projects. The distributed PV projects in the two places use roof-mounted, fixed arrays and seasonal tilting systems, which are installed on the largest scale under the premise of ensuring that the PV modules are not shaded. The roof area of Kunming, Yunnan Province is 20,868 square meters, with an installed PV capacity of 3,848 kW, while the roof area of Binzhou, Shandong Province is 21,520 square meters, with an installed PV capacity of 3,967 kW. The total project cycle is 25 years, and the annual power generation is shown in
Figure 6. The first year's electricity generation is shown in
Figure 7.
5.2.2. Distributed Photovoltaic Power Generation Costs
Using the distributed PV power generation cost model established in 4, the total cost of distributed PV power generation in the two locations is obtained by substituting the research data, as shown in
Table 3.
Combined with the total power generation of the 25-year project cycle simulated by PVsyst software in 5.2.1, the unit power generation cost can be obtained by dividing the cost of the 25th year in Table III by the total power generation. The final calculation is 0.1741 RMB yuan/kWh for Kunming in Yunnan Province and 0.1996 RMB yuan/kWh for Binzhou in Shandong Province.
5.2.3. Results of Tariff Forecasts
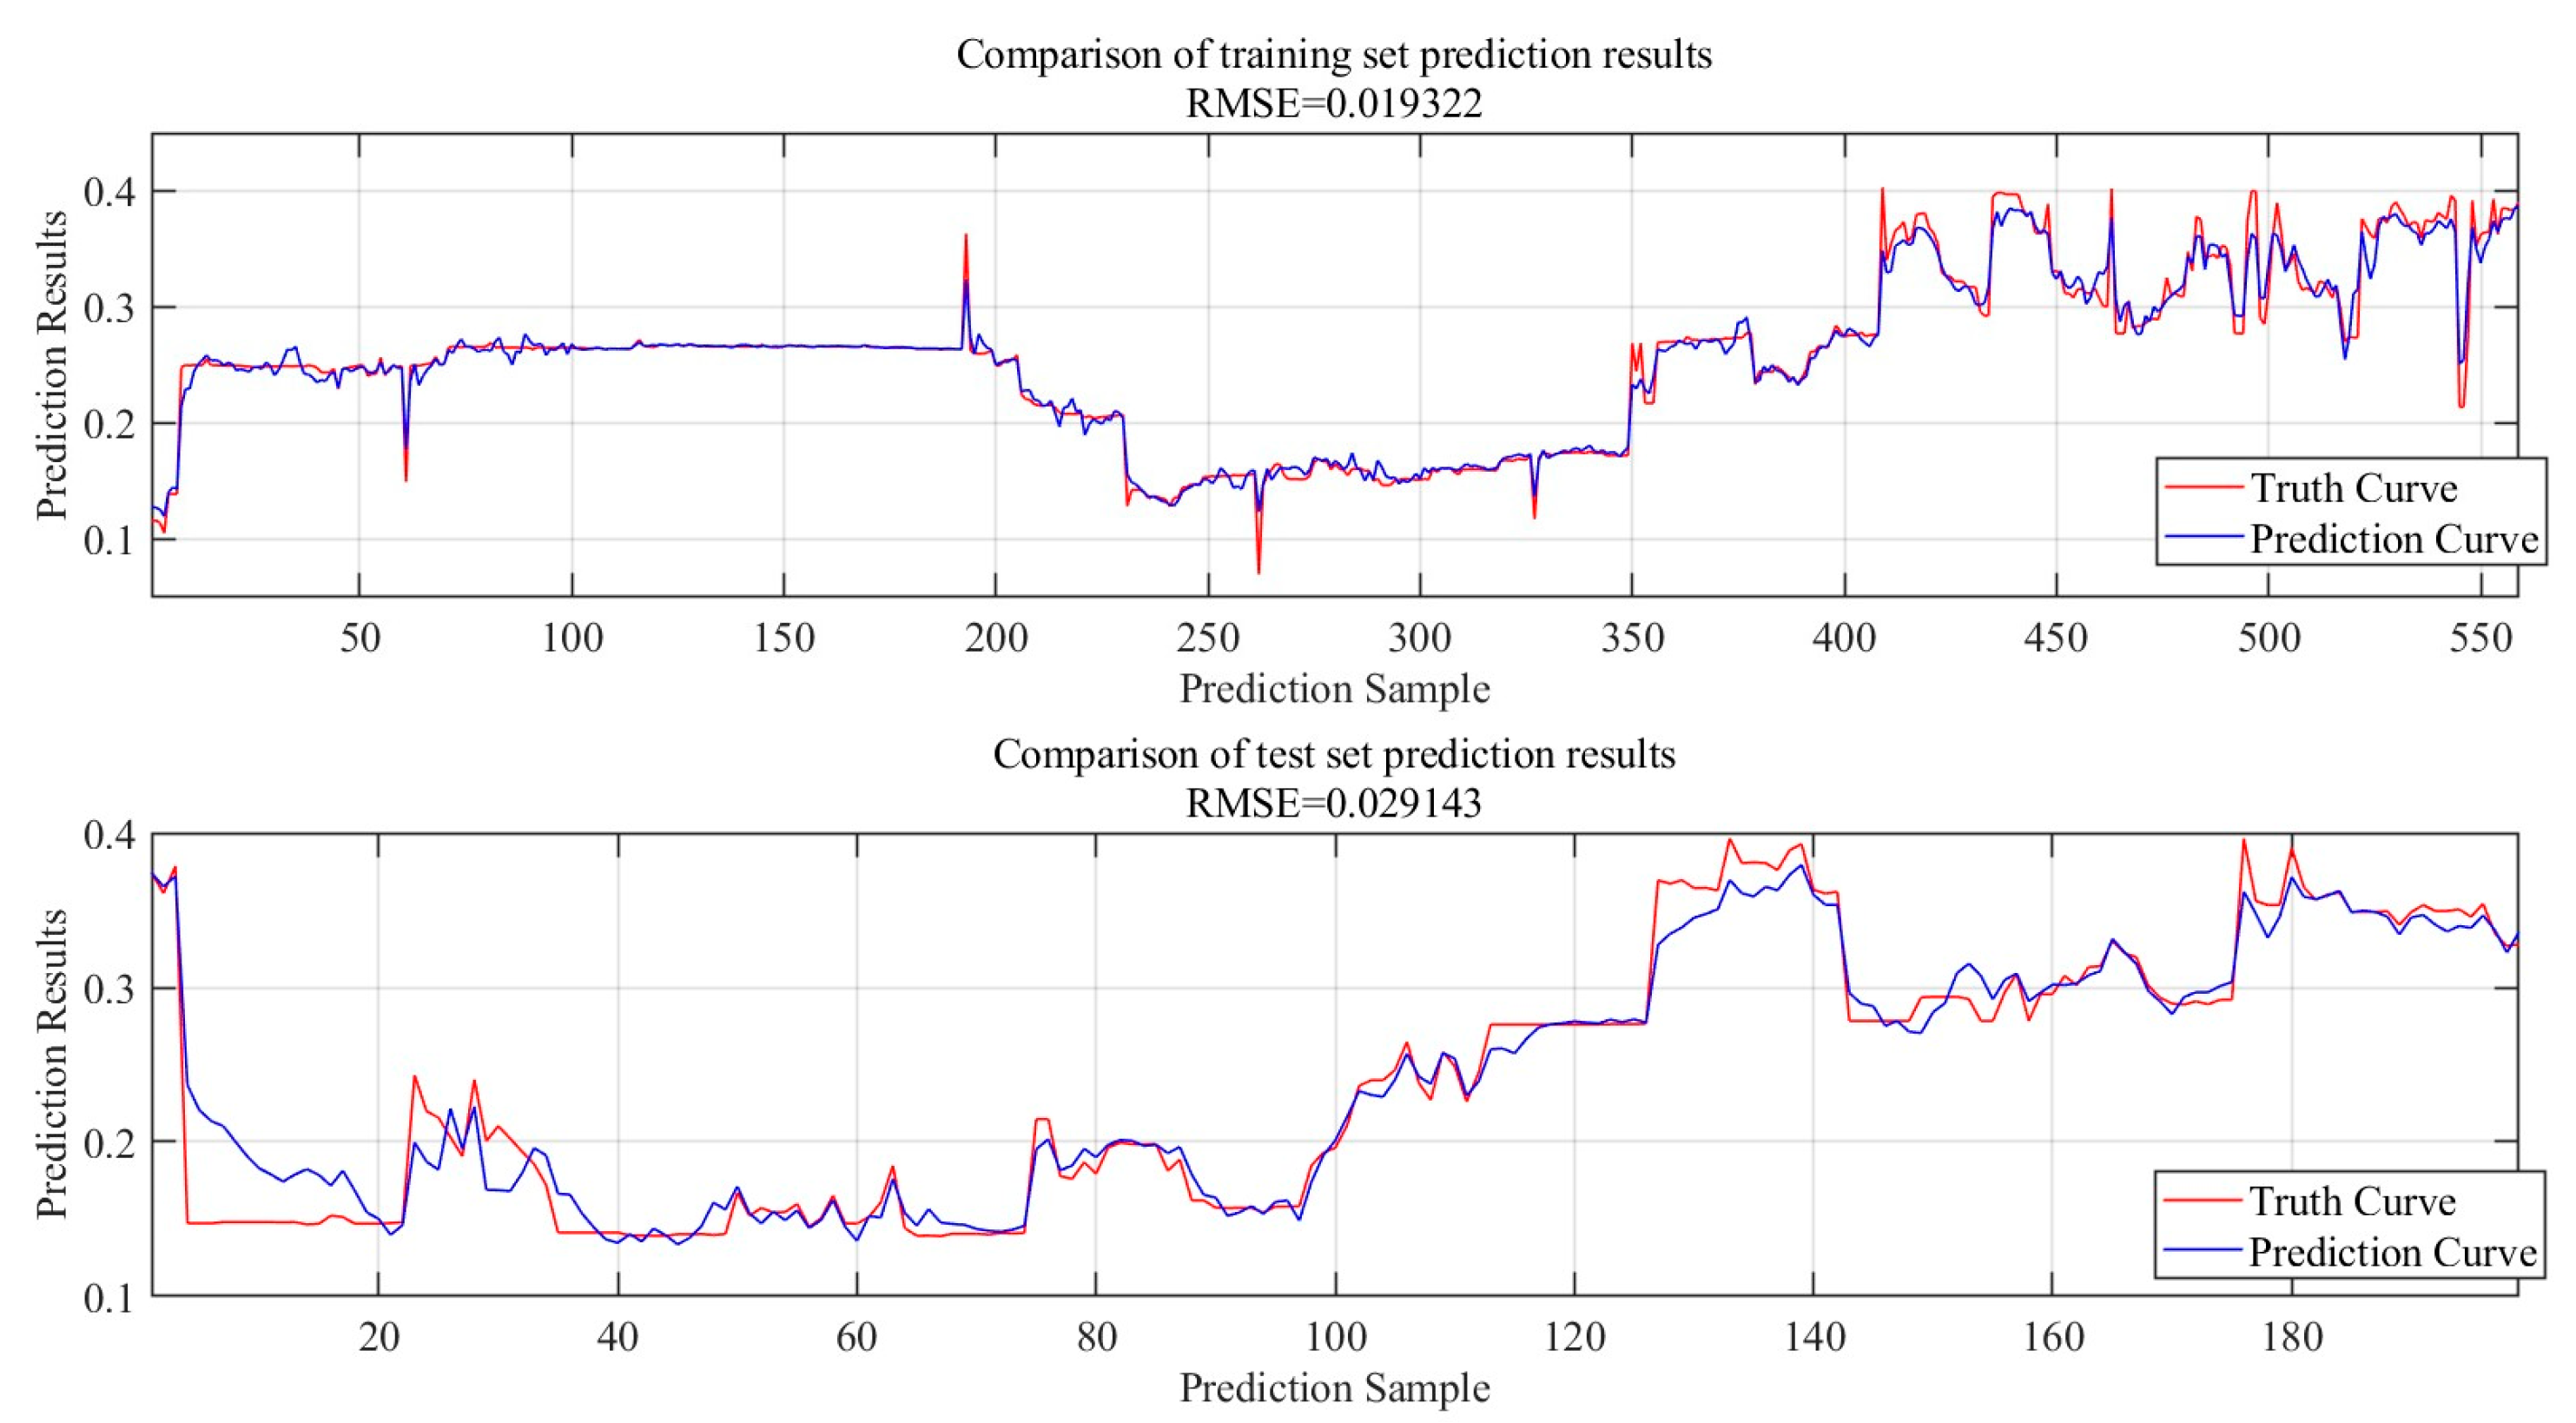
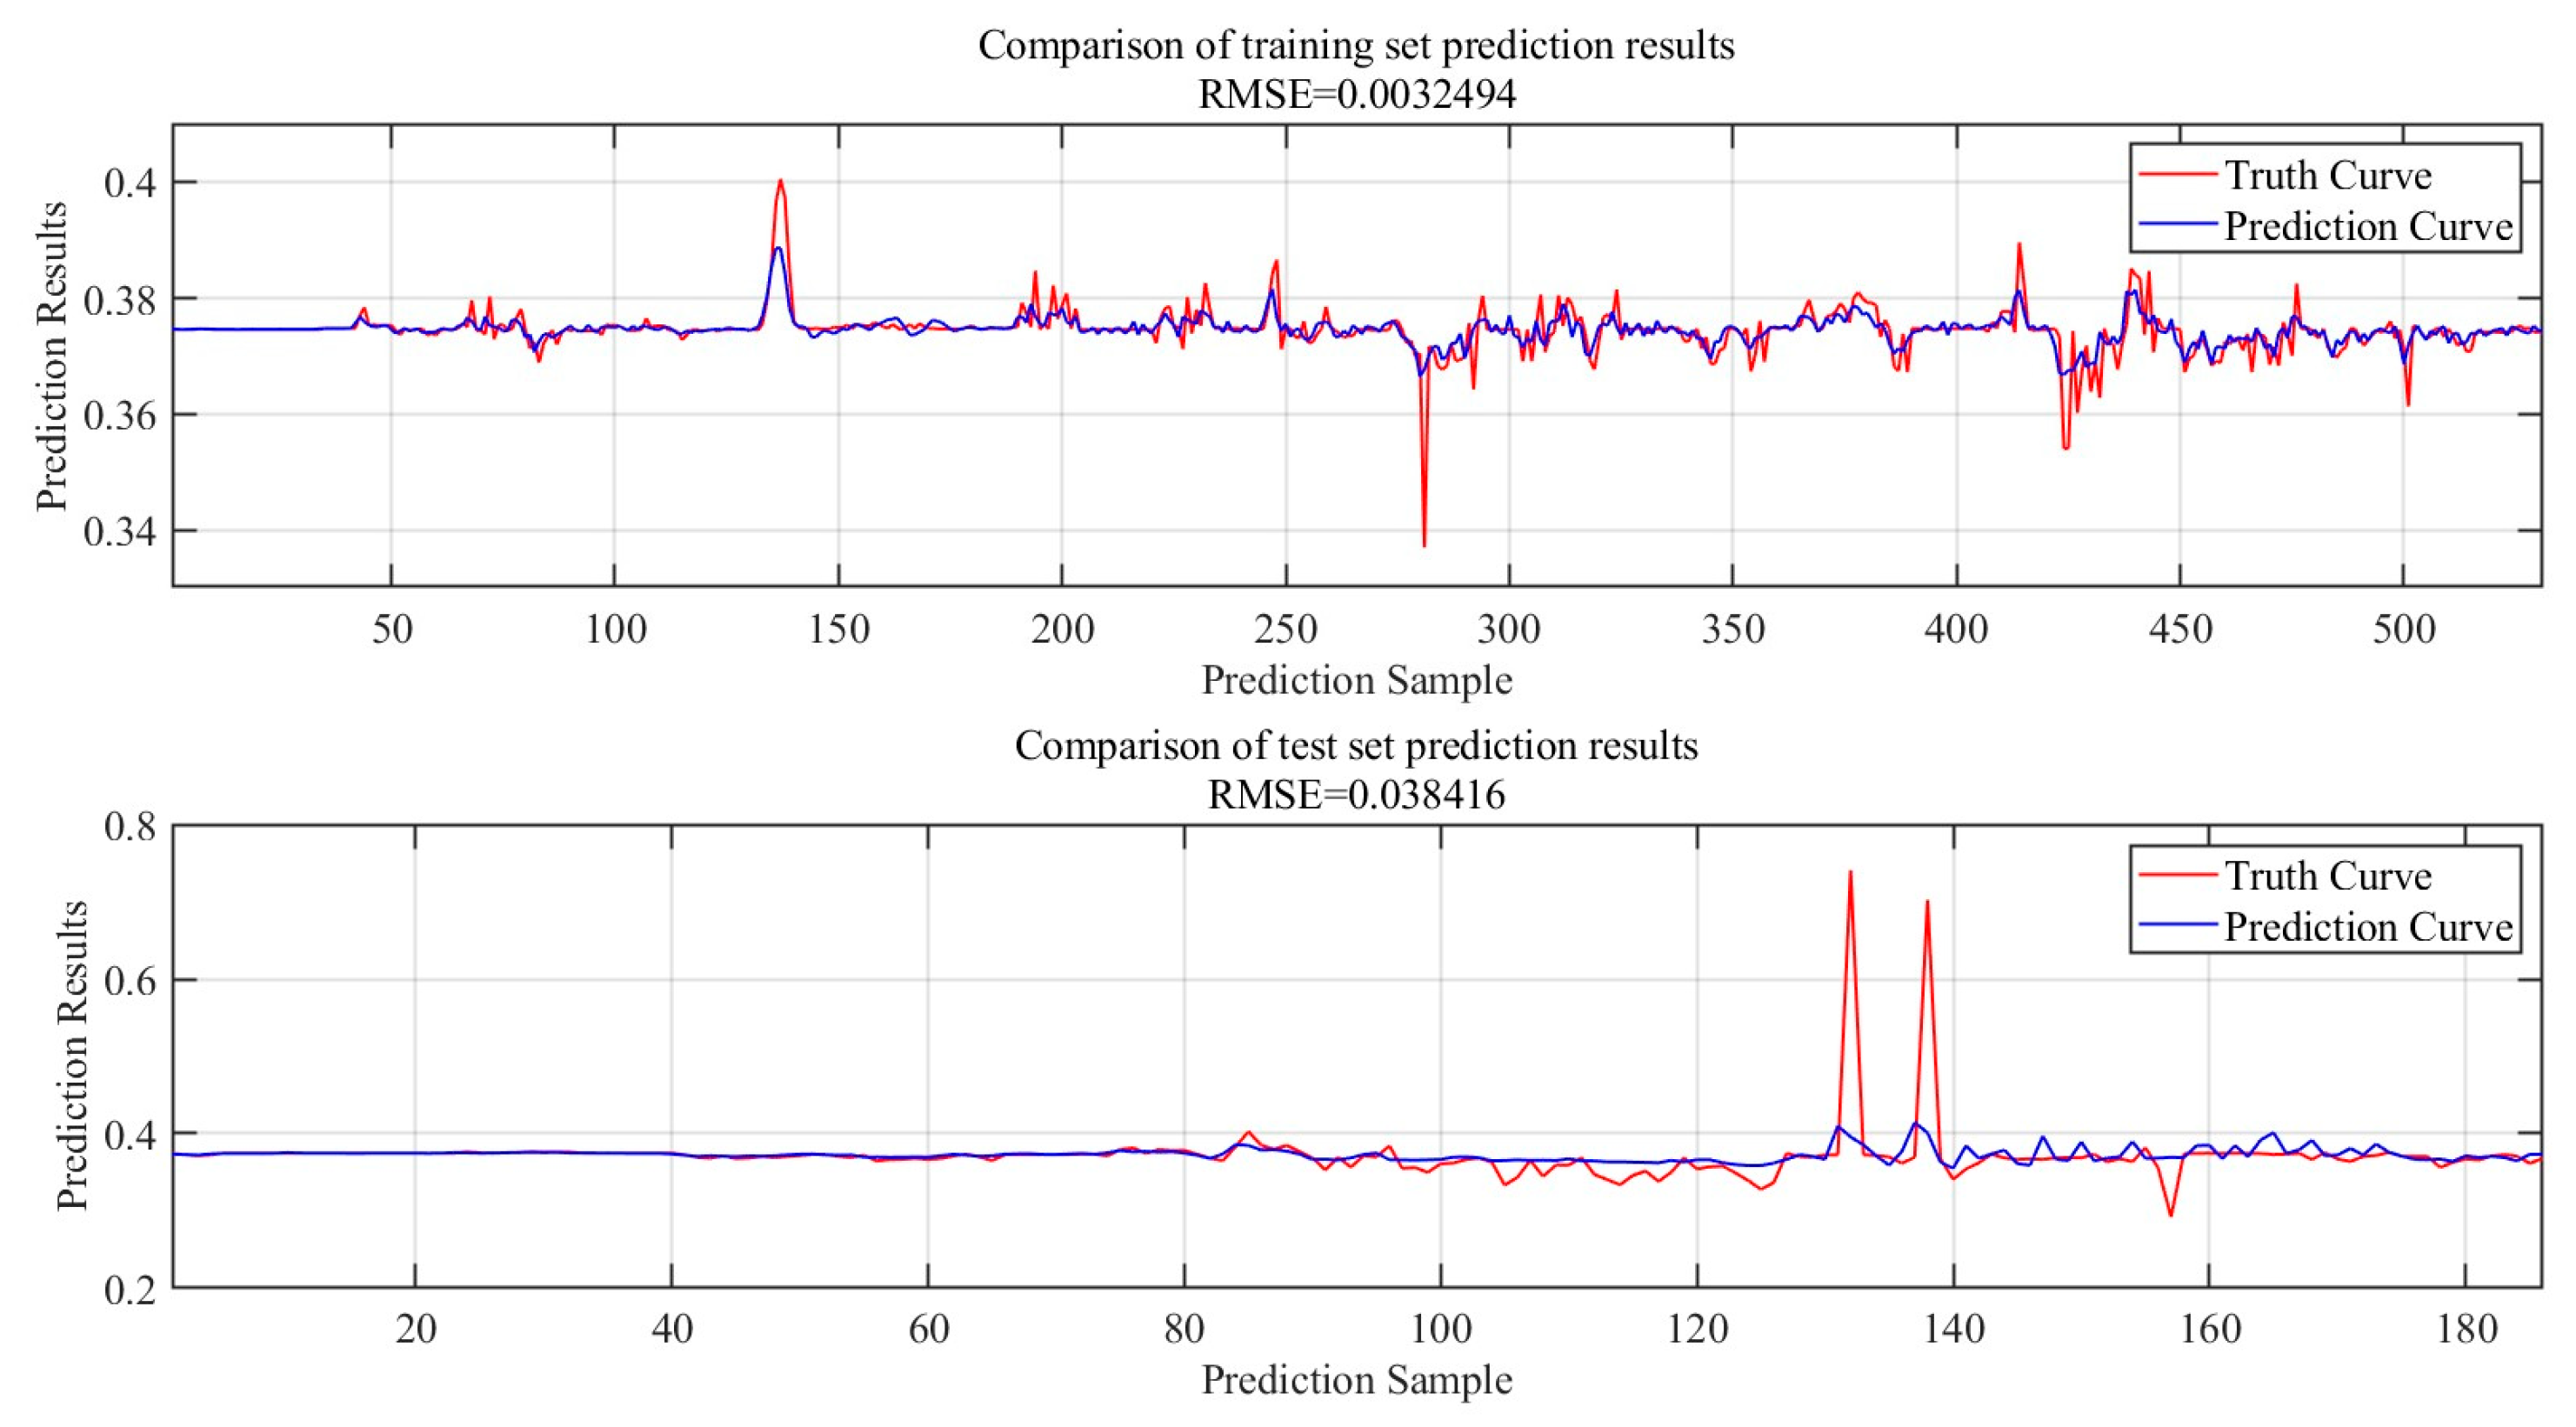
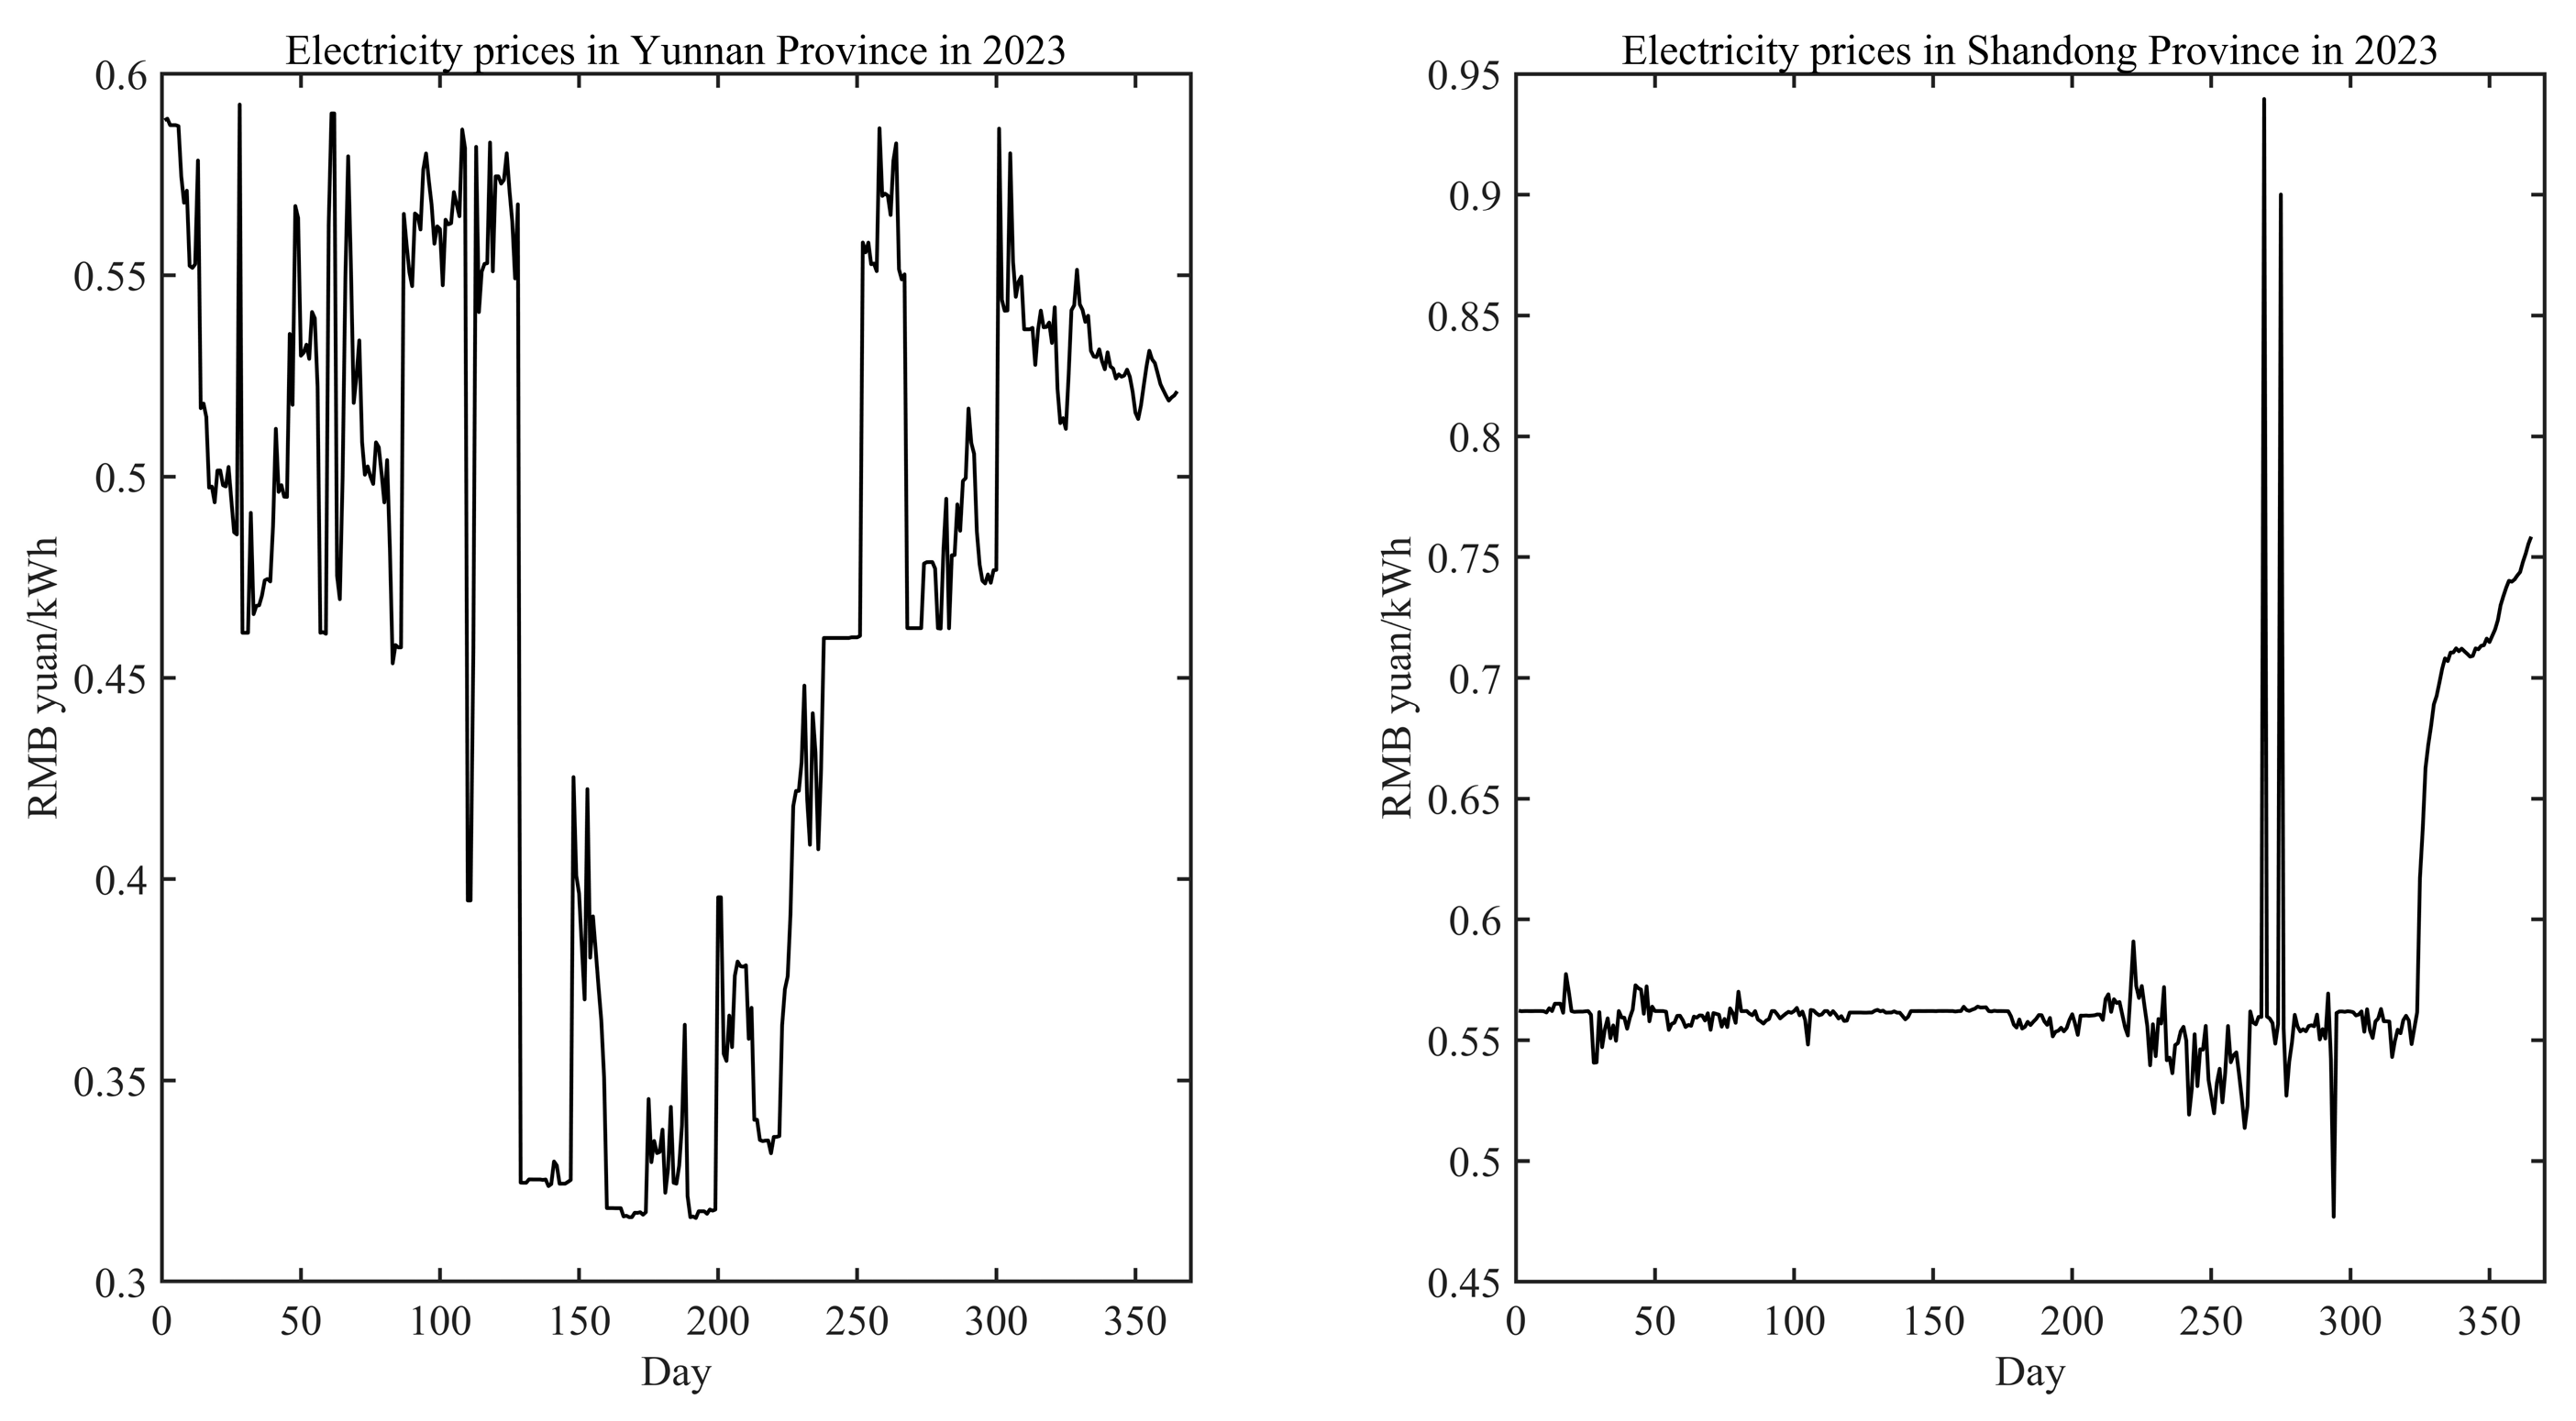
Electricity price data of two provinces in 2023 are used separately to train neural networks applicable to electricity trading in the province. 70 % of the data is selected as the training set and the remaining 30 % of the data is used as the test set. This this model training is based on CPU (AMD Ryzen 7-5800H 4.4GHz), GPU (NVIDIA GeForce RTX 3060 6GB), RAM memory (16GB), Windows operating system and MATLAB software environment. The maximum number of training iterations was set to 4800, and the total number of learnable parameters was up to 4900. It took 51 seconds to complete this model training in Yunnan Province, and 36 seconds to complete this model training in Shandong Province. The final standardized root mean square error of Yunnan Province is about 0.06. The final standardized root mean square error of Yunnan Province is about 0.05.
The training and test set prediction results for Yunnan Province are shown in
Figure 8, and the training and test set prediction results for Shandong Province are shown in
Figure 9.
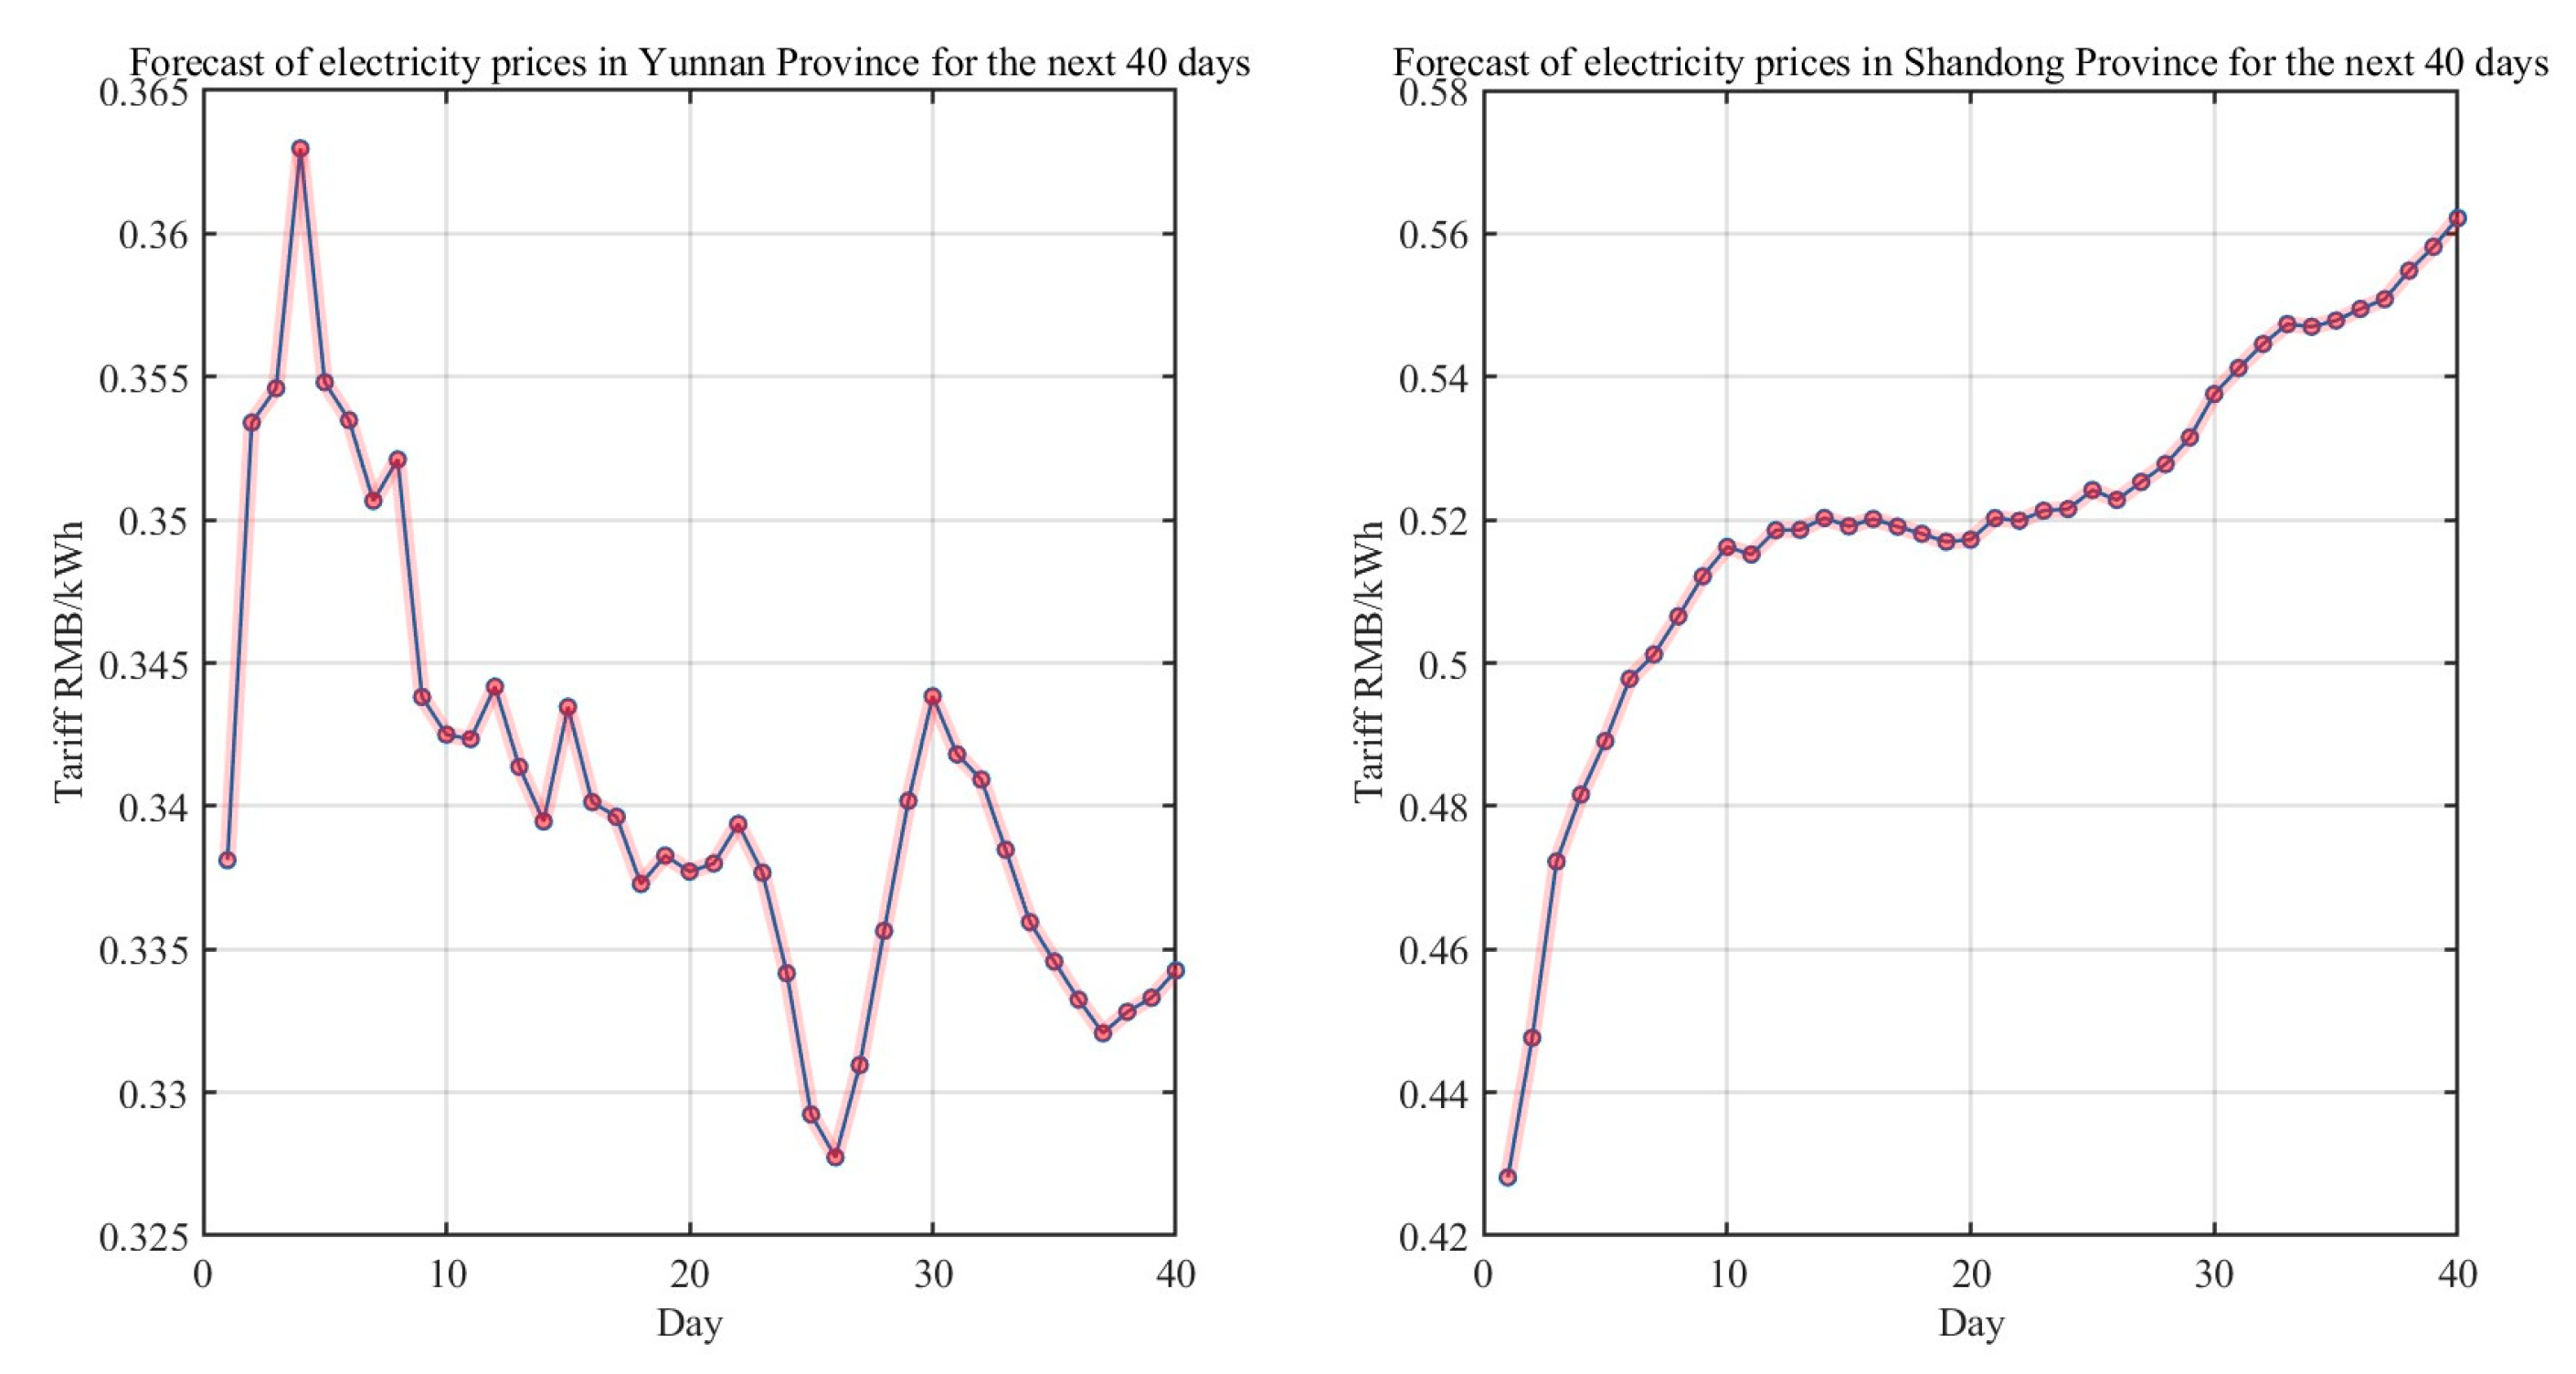
In order to better show the prediction ability of LSTM neural network, we now iteratively predict the electricity price of Yunnan and Shandong provinces in the next 40 days. The prediction results are shown in
Figure 10.
5.3. Results
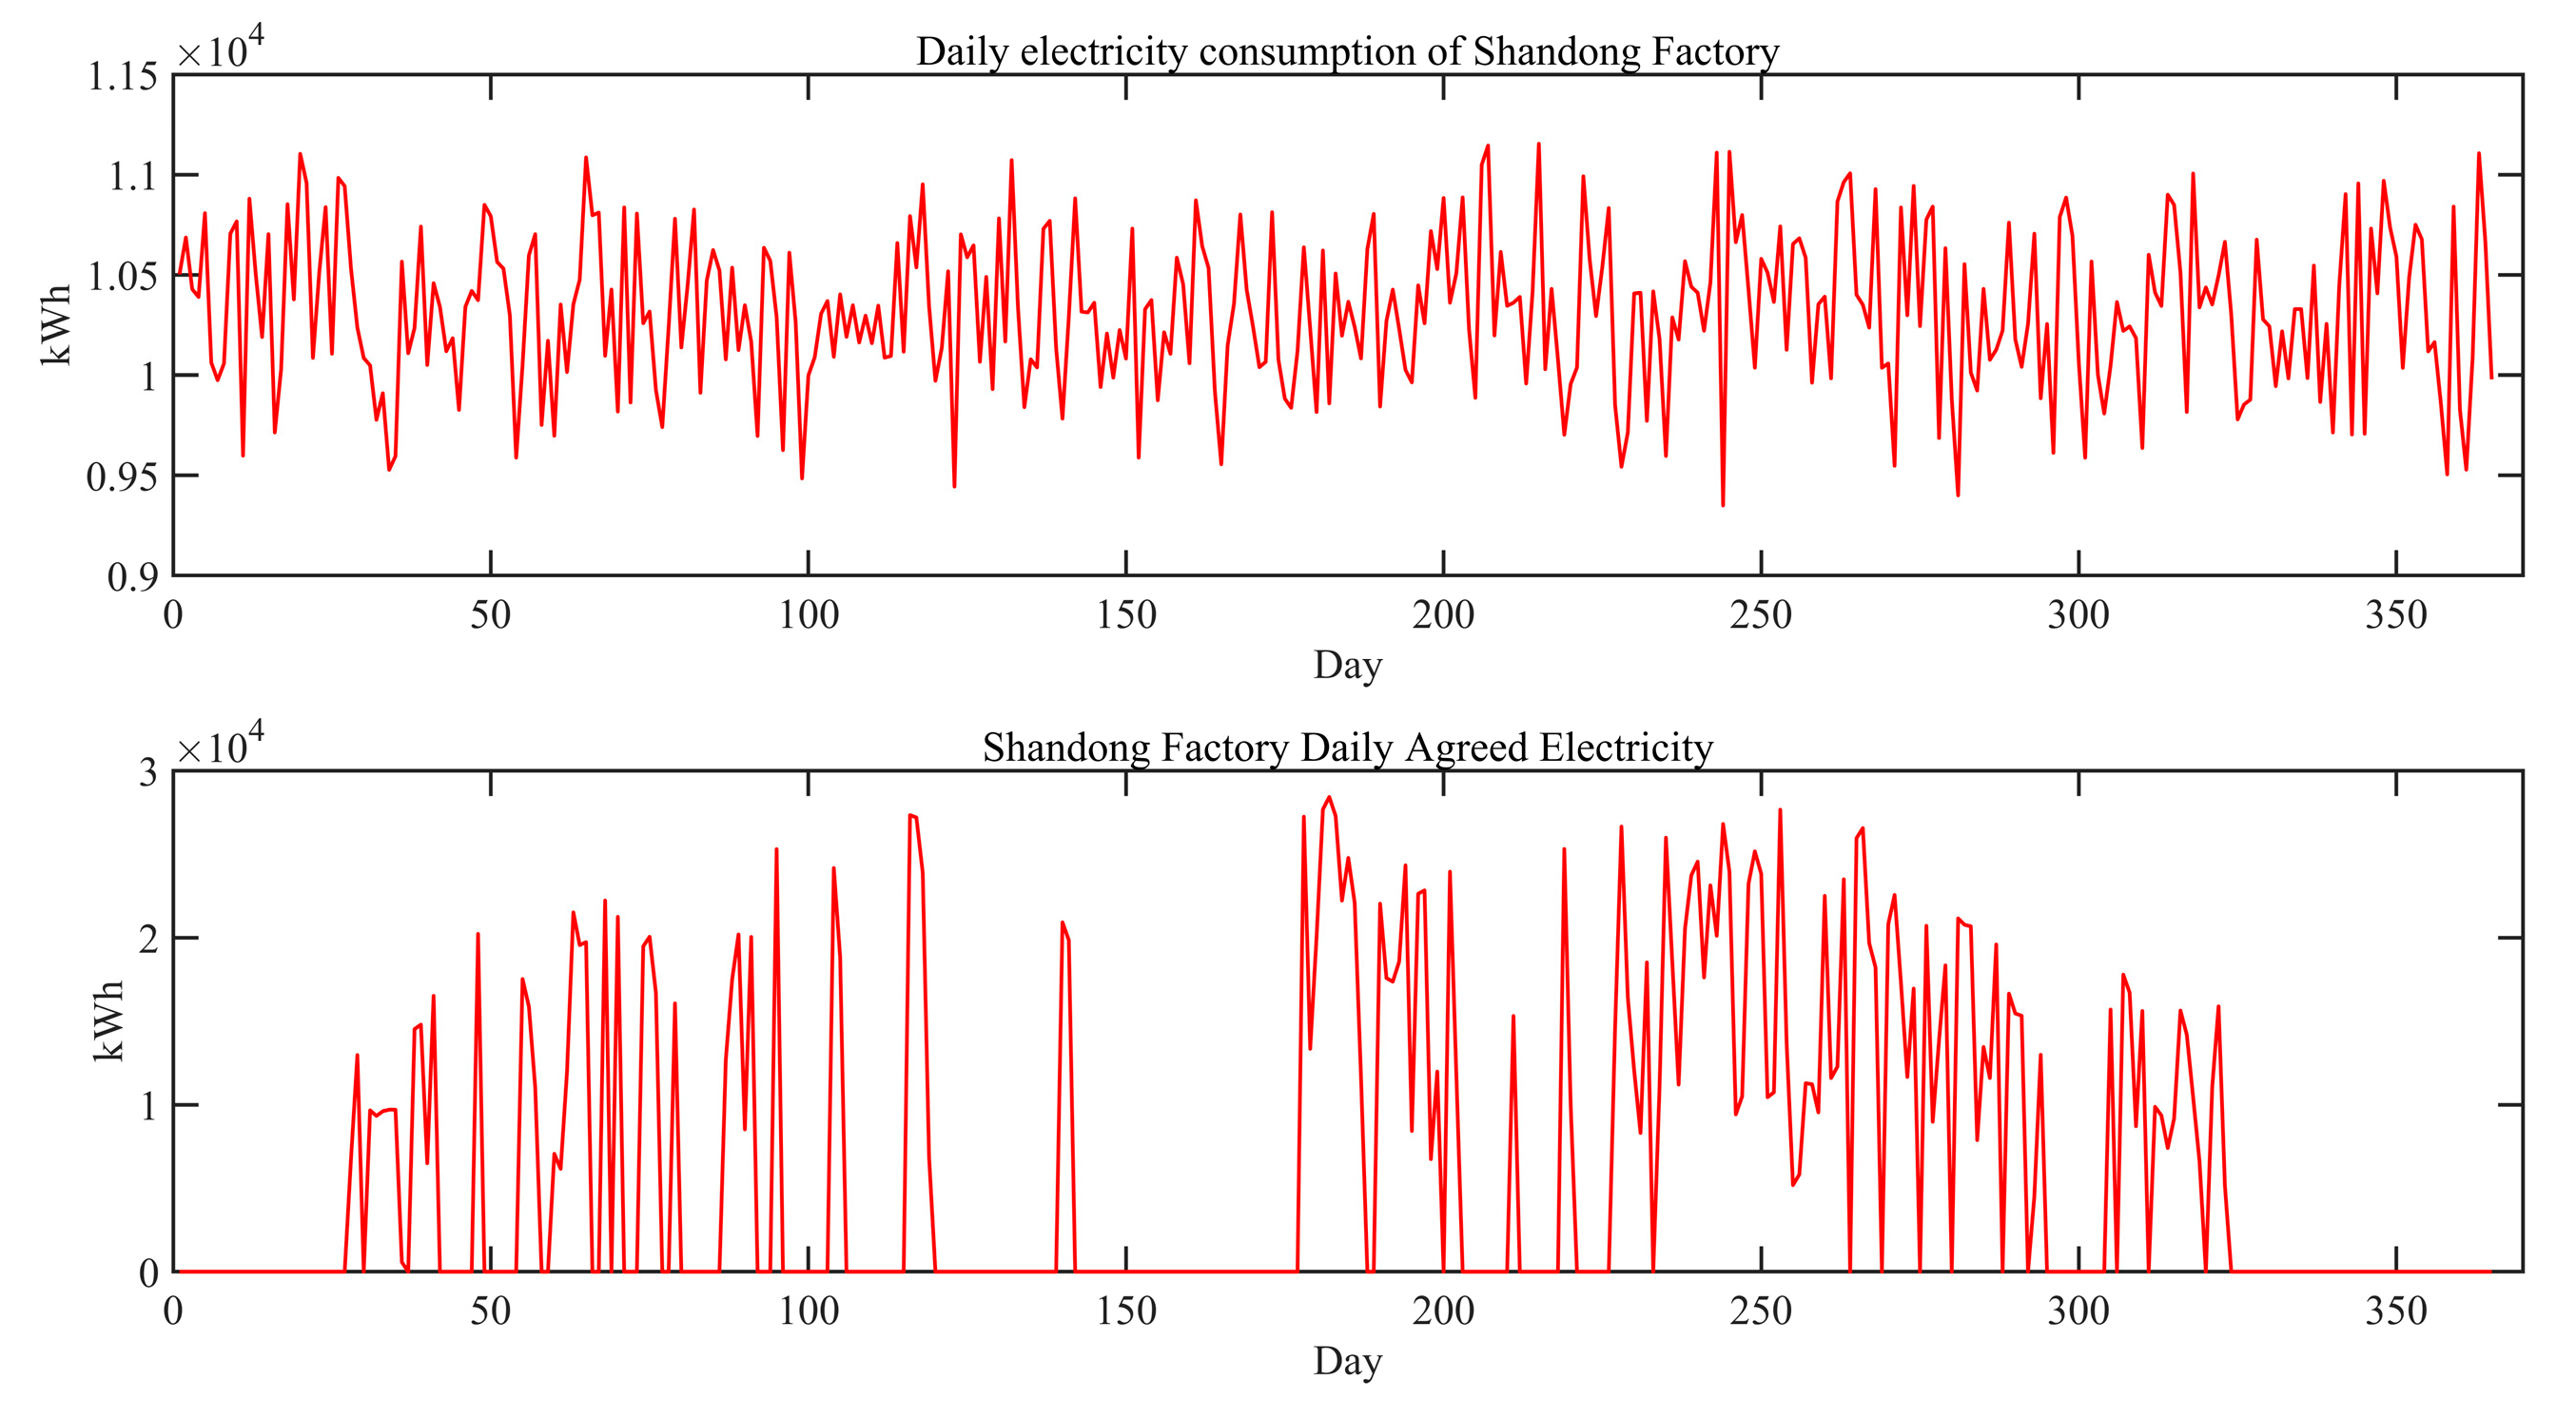
Combining the research data in 5.1 and the sub-model solution data in 5.2, the optimized electricity cost for the two pharmaceutical factories in 2023 is calculated using the integrated optimization algorithm. In particular, to better test the effectiveness of the LSTM algorithm in predicting the electricity price, the predicted electricity price for the last 40 days in 4.2 is substituted for the day-ahead market traded electricity price for the last 40 days in 2023(See
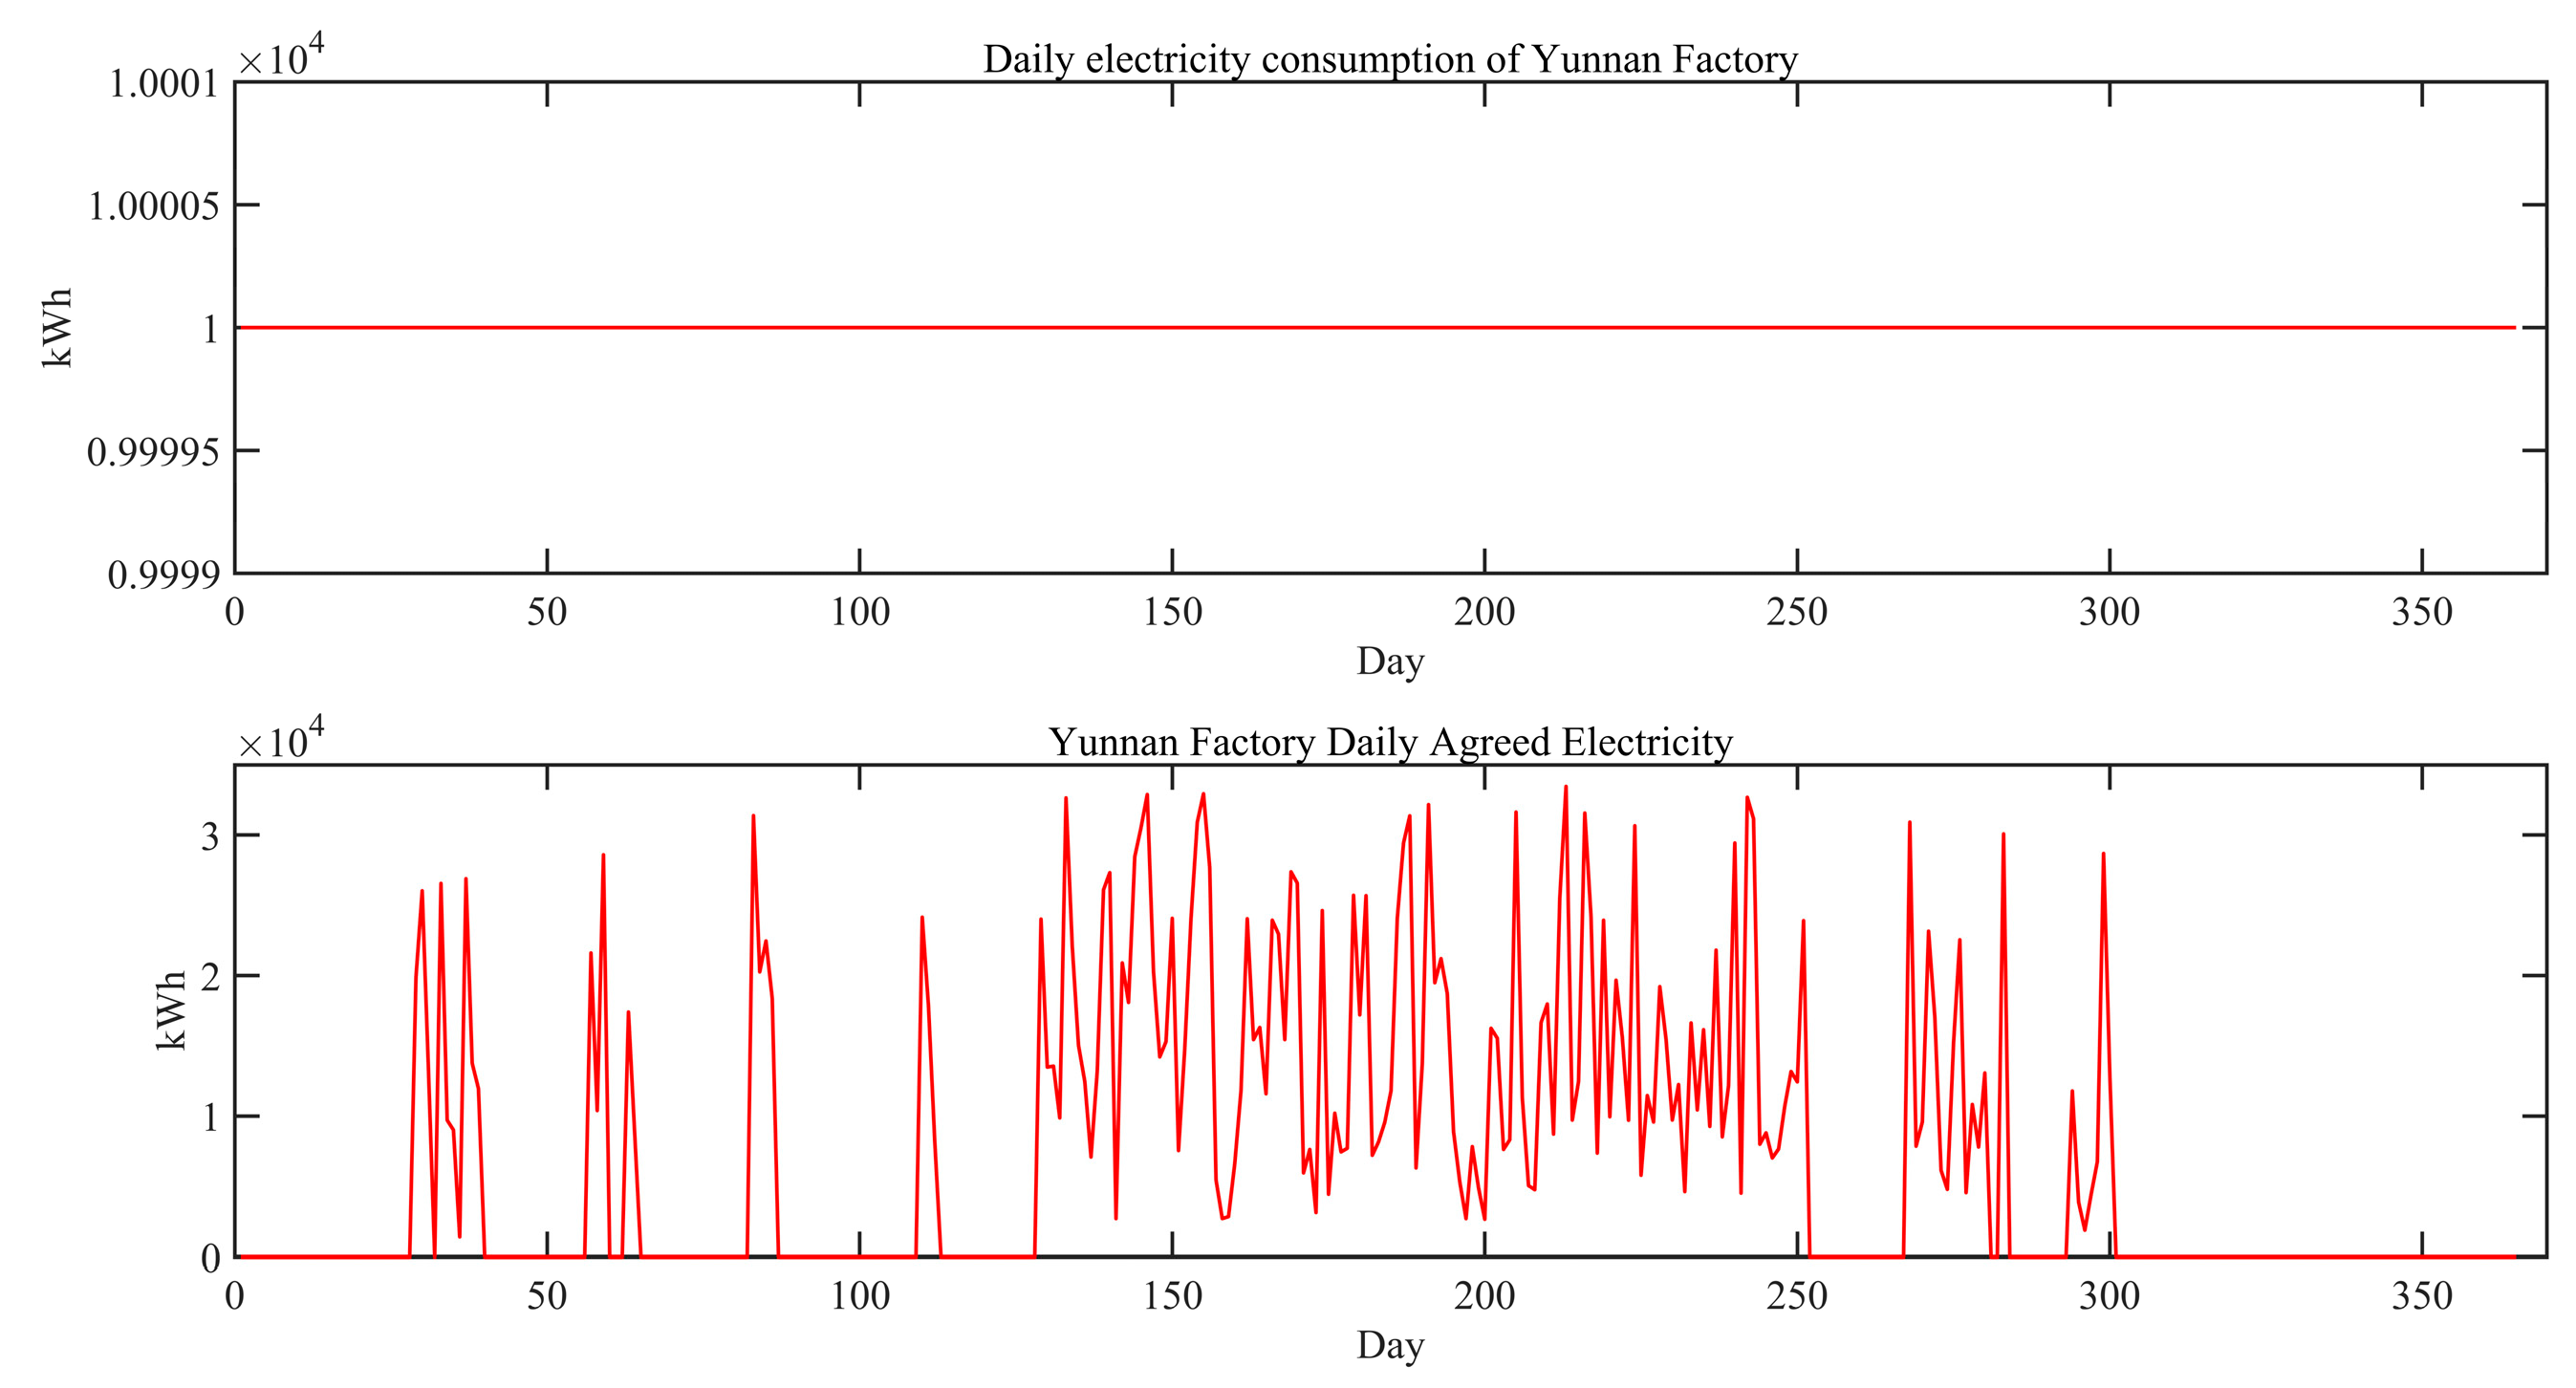
Figure 11). The optimized electricity consumption and agreed electricity of the pharmaceutical factory in Yunnan Province are shown in
Figure 12, and the optimized electricity consumption and agreed electricity of the pharmaceutical factory in Shandong Province are shown in
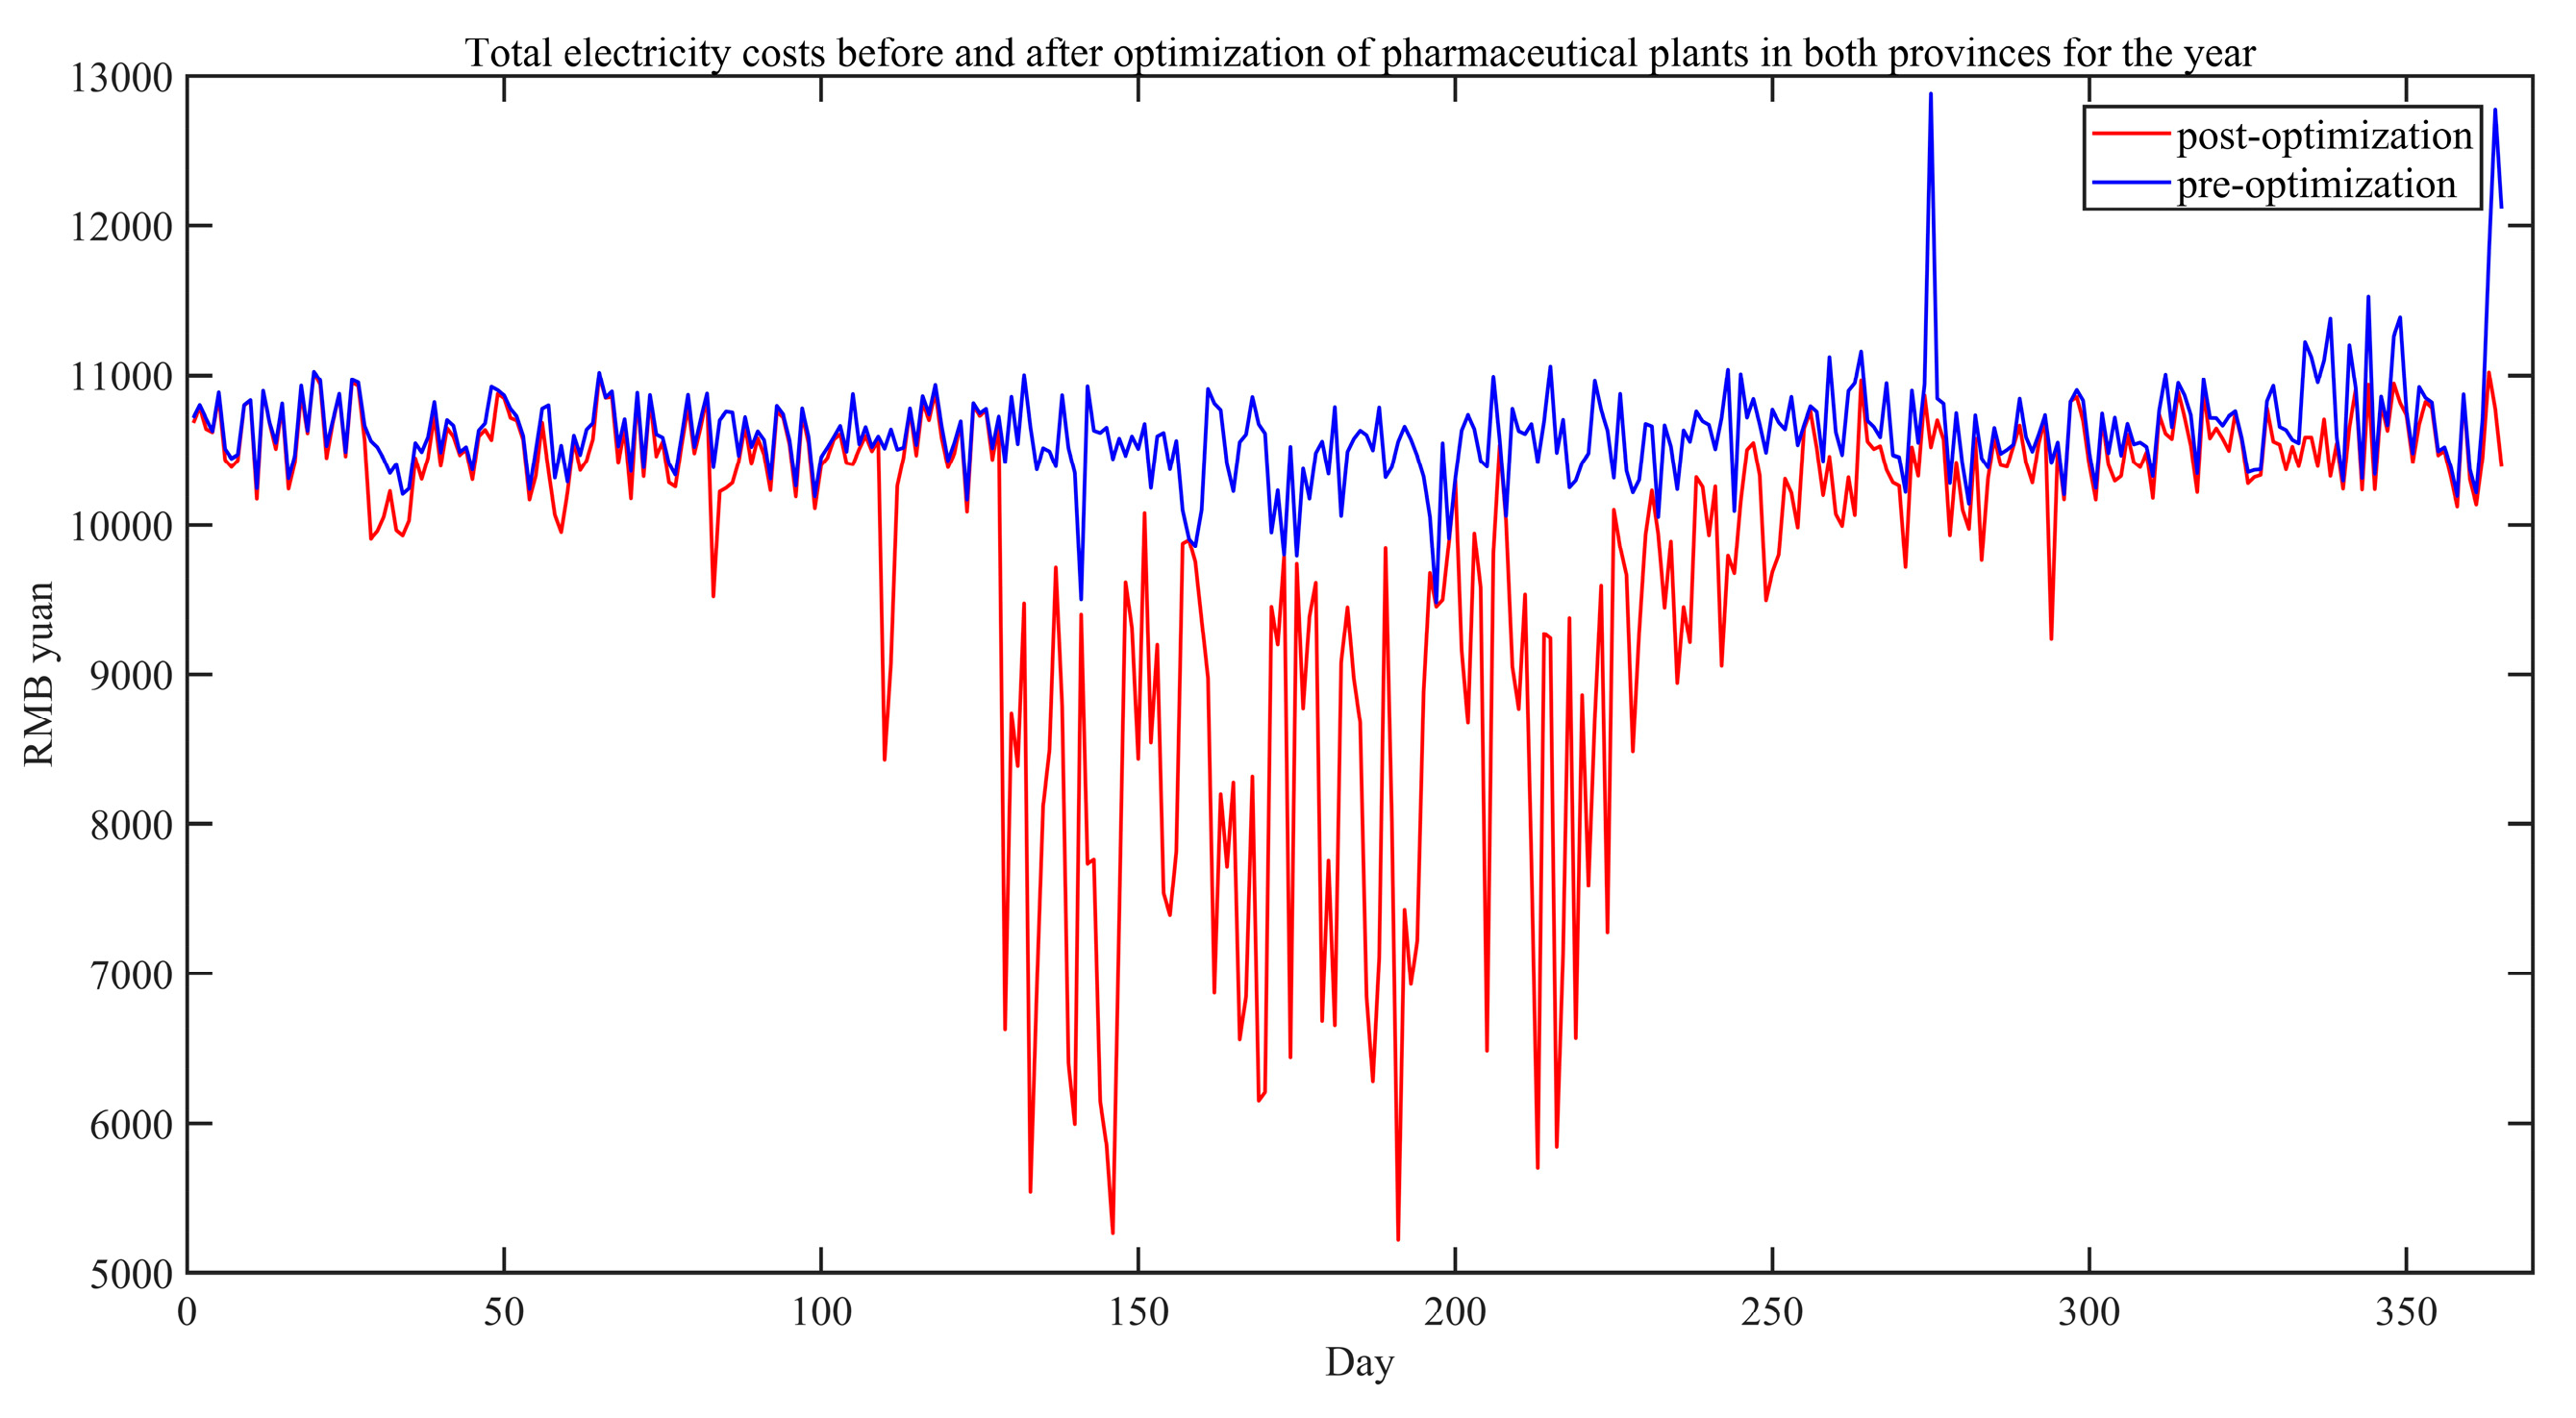
Figure 13, and the electricity cost before and after optimization for the whole year in the two provinces is shown in
Figure 14. Among them, the electricity tariff before optimization is calculated according to the full use of distributed PV power generation by the pharmaceutical plant, and only when the distributed PV power generation is not enough to meet the power consumption of the pharmaceutical plant, the pharmaceutical plant will purchase power from the grid. It is easy to see from observing
Figure 14 that there is a significant decrease in the total electricity cost after optimization compared with the pre-optimization period. It is calculated that the total electricity cost before optimization is RMB 3,874,600 yuan, and the total electricity cost after optimization is RMB 3,590,800 yuan, which is a decrease of about 7.9 %.
6. Conclusions
In summary, this paper innovatively proposes a new industrial production optimization scheduling algorithm for the power demand side that integrates machine learning techniques such as LSTM neural network and particle swarm algorithm. This algorithm is applicable to multiple industries and can reduce the cost of electricity consumption of production enterprises. Then the data obtained from the research of the team in this paper is substituted into the algorithm to analyze the examples, and finally concluded that this algorithm can reduce the cost of electricity used by the pharmaceutical factory by 7.9 %. This shows that the algorithm can significantly reduce the cost of electricity on the demand side.
The example data in this paper only focuses on two pharmaceutical factories in Binzhou, Shandong Province and Kunming, Yunnan Province, i.e., the significant optimization results of the algorithm from the data analysis are only presented in the case of two optimization objects. However, from the theoretical analysis, the algorithm is applicable to multiple optimization objects, but this situation will increase the complexity of the algorithm so that the calculation time increases.
This paper has the following innovations:
(1) A new master-slave game relationship is proposed with industrial and commercial users as leaders and distributed PV companies as followers. (2) An enterprise off-site industrial production optimization scheduling model is established, which can significantly reduce the cost of electricity for enterprises. (3) Particle swarm algorithm and LSTM neural network are integrated into the large model with excellent results.
Of course, this optimization model also has certain limitations. (1) It simplifies the actual industrial production process and does not consider the logistics scheduling cost between different locations. (2) When calculating the feed-in tariff for distributed PV residual power, it is calculated according to the coal-fired benchmark price, and does not take into account the pilot transaction of China's green power market. (3) The environmental protection benefits are not considered and the carbon emission right trading benefits are not calculated.
This model will provide theoretical support for the construction of integrated energy systems in off-site industrial parks in the future, empowering the development of the industry at the demand-side level of electricity.
Author Contributions
Conceptualization, P.W. and S.X.; methodology, S.X.; software, S.X. and Y.L.; validation, P.W., S.X. and Y.L.; formal analysis, S.X. and Y.L.; investigation, S.X.; data curation, S.X.; writing—original draft preparation, S.X.; writing—review and editing, P.W., S.X. and Y.L.; All authors have read and agreed to the published version of the manuscript.
Funding
This work was partially supported by the Innovation and Entrepreneurship Training Program for College Students of North China Electric Power University (202301019) and the Chengdu Silicoms Technology Co., LTD.
Data Availability Statement
The data set can be obtained by contacting the corresponding author.
The data are not publicly available due to the experimental data are confidential. The geographic coordinates mentioned in this paper are not accurate due to confidentiality requirements. The data in the tariff section comes from Kunming Power Exchange Center (
https://www.kmpex.com) and Shandong Power Exchange Center (
https://pmos.sd.sgcc.com.cn).
Conflicts of Interest
All authors declare that the research was conducted in the absence of any commercial or financial relationships that could be construed as a potential conflict of interest.
Appendix
Appendix A shows the notation for the equations in 2.2.
| Notation |
Explanation |
|
Daily electricity consumption of the th plant |
|
Daily agreed electricity of the th plant |
|
Daily grid purchase of electricity for the th plant |
|
Daily surplus electricity feed-in for the th plant |
|
Distributed photovoltaic power generation per day |
|
Agreed tariffs |
|
Feed-in tariff for surplus electricity |
|
Price of electricity for industrial use in the th plant |
|
Daily cost of electricity consumed by the th plant |
|
Distributed PV daily revenue |
|
Minimum daily income from distributed PV with guaranteed ROI |
|
Minimum daily revenue per for distributed PV with guaranteed ROI |
|
Maximum daily electricity consumption of the th plant (maximum capacity) |
References
- Alzahrani, A. M.; Zohdy, M.; Yan, B. An Overview of Optimization Approaches for Operation of Hybrid Distributed Energy Systems with Photovoltaic and Diesel Turbine Generator. Electr. Power Syst. Res. 2021, 191. [Google Scholar] [CrossRef]
- He, H. Y.; Luo, Z.; Wang, Q.; Chen, M. X.; He, H. Q.; Gao, L. J.; Zhang, H. X. Joint Operation Mechanism of Distributed Photovoltaic Power Generation Market and Carbon Market Based on Cross-Chain Trading Technology. IEEE Access 2020, 8, 66116–66130. [Google Scholar] [CrossRef]
- Hou, P.; Yang, G. Y.; Hu, J. J.; Douglass, P. J.; Xue, Y. S. A Distributed Transactive Energy Mechanism for Integrating PV and Storage Prosumers in Market Operation. Eng. 2022, 12, 171–182. [Google Scholar] [CrossRef]
- Jiang, S. F.; Wan, C.; Chen, C.; Cao, E. B.; Song, Y. H. Distributed Photovoltaic Generation in the Electricity Market: Status, Mode and Strategy. IEEE J. Power Energy Syst. 2018, 4(3), 263–272. [Google Scholar] [CrossRef]
- Ma, W. W.; Fang, S.; Liu, G. Hybrid optimization method and seasonal operation strategy for distributed energy system integrating CCHP, photovoltaic and ground source heat pump. Energy 2017, 141, 1439–1455. [Google Scholar] [CrossRef]
- Schwidtal, J. M.; Agostini, M.; Coppo, M.; Bignucolo, F.; Lorenzoni, A. Optimized operation of distributed energy resources: The opportunities of value stacking for Power-to-Gas aggregated with PV. Appl. Energy 2023, 334. [Google Scholar] [CrossRef]
- Yang, S. X.; Wang, X. F.; Yang, Y. G.; Li, J. L. Bi-level planning model of distributed PV-energy storage system connected to distribution network under the coordinated operation of electricity-carbon market. Sustain. Cities Soc. 2023, 89. [Google Scholar] [CrossRef]
- Yu, J. C.; Wu, L.; Yao, C.; Chen, J.; Li, S. Y.; Ma, X. F. A Review of Distributed PV Operation Analysis and Demand Response Research. 3rd Asia Conference on Power and Electrical Engineering (ACPEE), Kitakyushu, JAPAN, Mar 22-24 2018.
- Zhang, Q.; Chen, L.; Li, X.; Mei, S. OPTIMIZATION DECISION OF PURCHASING AND SELLING POWER BETWEEN INDUSTRIAL PARK OPERATORS AND DISTRIBUTED OPTICAL STORAGE USERS BASED ON STACKELBERG GAME. Acta Energ. Sol. Sin. 2024, 45(1), 450–456. [Google Scholar]
- Gad, A. G. Particle Swarm Optimization Algorithm and Its Applications: A Systematic Review. Arch. Comput. Methods Eng. 2022, 29(5), 2531–2561. [Google Scholar] [CrossRef]
- Liu, Y. Y.; Dai, J. J.; Zhao, S. S.; Zhang, J. H.; Shang, W. D.; Li, T.; Zheng, Y. C.; Lan, T.; Wang, Z. Y. Optimization of five-parameter BRDF model based on hybrid GA-PSO algorithm. Optik 2020, 219. [Google Scholar] [CrossRef]
- Pan, J. H.; Wang, H.; Yang, X. G. A Random Particle Swarm Optimization Algorithm with Application. 2nd International Conference on Chemical, Material and Metallurgical Engineering (ICCMME 2012), Kunming, PEOPLES R CHINA, Dec 15-16 2012.
- Qu, L. P.; Meng, Y.; Li, D. H.; Xue, H. B.; Soc, I. C. A Quantum Particle Swarm Optimization Algorithm with Available Transfer Capability. 19th International Symposium on Distributed Computing and Applications for Business Engineering and Science (DCABES), Xuzhou, PEOPLES R CHINA, Oct 16-19 2020.
- Shami, T. M.; El-Saleh, A. A.; Alswaitti, M.; Al-Tashi, Q.; Summakieh, M. A.; Mirjalili, S. Particle Swarm Optimization: A Comprehensive Survey. IEEE Access 2022, 10, 10031–10061. [Google Scholar] [CrossRef]
- Thirunavukkarasu, M.; Sawle, Y.; Lala, H. A comprehensive review on optimization of hybrid renewable energy systems using various optimization techniques. Renew. Sustain. Energy Rev. 2023, 176. [Google Scholar] [CrossRef]
- Yang, X. J.; Jiao, Q. J.; Liu, X. K. Center Particle Swarm Optimization Algorithm. IEEE 3rd Information Technology, Networking, Electronic and Automation Control Conference (ITNEC), Chengdu, PEOPLES R CHINA, Mar 15-17 2019.
- Hao, Z.; Hai, L.; Enbo, L.; Yanting, H.; Zhi, W.; Chong, T.; Wenmeng, Z.; Guo, X. Research on power trade potential and power balance between Lancang-Mekong countries and southern China under long-term operation simulation. Front. Energy Res. 2023, 11. [Google Scholar] [CrossRef]
- Hu, B.; Zhou, P. Can the renewable power consumption guarantee mechanism help activate China's power trading market? Energy 2022, 253. [Google Scholar] [CrossRef]
- Wu, Q. L.; Zhang, S. S.; Zhou, B. Z. Research and application of power market trading index system for power generation enterprises. Energy Rep. 2022, 8, 270–274. [Google Scholar] [CrossRef]
- Yang, S.; Chen, K. N.; Li, M.; Qu, Y. Y.; Wu, Z. C.; Zhang, X. X. Typical Cohesion Modes of Foreign Long-Term Power Market with Spot Market and Implications for China. 5th International Conference on Advances in Energy Resources and Environment Engineering (ICAESEE), Chongqing, PEOPLES R CHINA, Dec 06-08 2019.
- Jiang, H. Y.; Fu, Y. Y.; Ge, Q. B. Overview of Bidding Strategies Based on Electricity Price Forecast for Generation Side under New Electricity Reform. 35th Youth Academic Annual Conference of Chinese-Association-of-Automation (YAC), Zhanjiang, PEOPLES R CHINA, Oct 16-18 2020.
- Lyu, Z.; Wang, Y. S.; Wang, J. Y.; Zhang, L.; Shen, J.; Wang, X. Short-term electricity price forecasting G-LSTM model and economic dispatch for distribution system. 4th International Conference on Energy Engineering and Environmental Protection (EEEP), Xiamen, PEOPLES R CHINA, Nov 19-21 2019.
- Matsumoto, T.; Endo, M. Electricity price forecast based on weekly weather forecast and its application to arbitrage in the forward market. 11th International Conference on Power, Energy and Electrical Engineering (CPEEE), Electr Network, Feb 26-28 2021.
- Bouktif, S.; Fiaz, A.; Ouni, A.; Serhani, M. A. Optimal Deep Learning LSTM Model for Electric Load Forecasting using Feature Selection and Genetic Algorithm: Comparison with Machine Learning Approaches. Energies 2018, 11(7). [Google Scholar] [CrossRef]
- Torres, J. F.; Hadjout, D.; Sebaa, A.; Martínez-alvarez, F.; Troncoso, A. Deep Learning for Time Series Forecasting: A Survey. Big Data 2021, 9(1), 3–21. [Google Scholar] [CrossRef]
- Khan, A.; Raufu, Z.; Sohail, A.; Khan, A. R.; Asif, H.; Asif, A.; Farooq, U. A survey of the vision transformers and their CNN-transformer based variants. Artif. Intell. Rev. 2023, 56 (SUPPL3), S2917–S2970. [Google Scholar] [CrossRef]
- Ewees, A. A.; Al-qaness, M. A. A.; Abualigah, L.; Abd Elaziz, M. HBO-LSTM: Optimized long short term memory with heap-based optimizer for wind power forecasting. Energy Convers. Manag. 2022, 268. [Google Scholar] [CrossRef]
- Huang, X. Q.; Li, Q.; Tai, Y. H.; Chen, Z. Q.; Liu, J.; Shi, J. S.; Liu, W. M. Time series forecasting for hourly photovoltaic power using conditional generative adversarial network and Bi-LSTM. Energy 2022, 246. [Google Scholar] [CrossRef]
- Peng, L.; Liu, S.; Liu, R.; Wang, L. Effective long short-term memory with differential evolution algorithm for electricity price prediction. Energy 2018, 162, 1301–1314. [Google Scholar] [CrossRef]
- Wang, Y.; He, J. J.; Chen, W. Y. Distributed solar photovoltaic development potential and a roadmap at the city level in China. Renew. Sust. Energ. Rev. 2021, 141. [Google Scholar] [CrossRef]
|
Disclaimer/Publisher’s Note: The statements, opinions and data contained in all publications are solely those of the individual author(s) and contributor(s) and not of MDPI and/or the editor(s). MDPI and/or the editor(s) disclaim responsibility for any injury to people or property resulting from any ideas, methods, instructions or products referred to in the content. |
© 2024 by the authors. Licensee MDPI, Basel, Switzerland. This article is an open access article distributed under the terms and conditions of the Creative Commons Attribution (CC BY) license (http://creativecommons.org/licenses/by/4.0/).
